Article

Incorporation of Silver-Doped Graphene Oxide Quantum Dots in Polyvinylidene Fluoride Membrane for Verapamil Removal

1
Lee Kong Chian Faculty of Engineering and Science, Universiti Tunku Abdul Rahman, Kajang 43000, Malaysia
2
Centre of Photonics and Advanced Materials Research (CPAMR), Universiti Tunku Abdul Rahman, Kajang 43000, Malaysia
3
Department of Chemical Engineering, Faculty of Engineering, Technology and Built Environment, UCSI University, Kuala Lumpur 56000, Malaysia
4
Center for Sustainable Process Technology (CESPRO), Faculty of Engineering and Built Environment, Universiti Kebangsaan Malaysia, Bangi 43600, Malaysia
5
School of Chemical Engineering, College of Engineering, Universiti Teknologi MARA, Shah Alam 40450, Malaysia
*
Author to whom correspondence should be addressed.
Sustainability 2022, 14(23), 15843; https://doi.org/10.3390/su142315843
Submission received: 20 October 2022 / Revised: 13 November 2022 / Accepted: 21 November 2022 / Published: 28 November 2022
(This article belongs to the Special Issue Functional Materials in Sustainable Chemistry)

Abstract

:
Verapamil hydrochloride, a calcium channel-blocking agent, is detectable in receiving water bodies and affects the well-being of aquatic organisms. Membrane filtration could be effective in removing such pharmaceutical contaminants. However, limited studies have employed commercial membranes, such as polyvinylidene fluoride (PVDF), in removing verapamil from water sources, owing to their low solution fluxes, poor antibacterial properties, and high surface hydrophobicity. Efforts are needed to create the PVDF membrane suitable for removing verapamil from water sources. In this study, PVDF composite membranes incorporated with from 0 to 0.10 wt% silver-doped graphene oxide quantum dots (Ag−GOQD) were evaluated in terms of their morphological structures, elemental composition, surface roughness, hydrophilicity, verapamil rejection capability, anti-fouling, and antibacterial capabilities. The pure PVDF membrane showed the lowest verapamil rejection (73.66 ± 2.45%), highest surface roughness (mean surface roughness, Sa = 123.80 nm), and least hydrophilic membrane surface (contact angle = 79.06 ± 4.53°) when compared to other membranes incorporated with nanocomposites. However, the membrane incorporated with 0.10 wt% Ag−GOQD showed the smoothest and the most hydrophilic membrane surface (Sa = 13.10 nm and contact angle = 53.60 ± 4.75°, respectively), associated with the highest verapamil rejection (96.04 ± 1.82%). A clear inhibition zone was spotted in the agar plate containing the membrane incorporated with Ag−GOQD, showing the antibacterial capability of the membrane. The overall improvement in morphological structures, surface smoothness, surface hydrophilicities, permeabilities, verapamil rejection abilities, and anti-fouling and antibacterial capabilities indicated a great potential to incorporate Ag−GOQD in PVDF membrane fabrication.

1. Introduction

Verapamil hydrochloride is a phenylalkylamine-derivative calcium channel-blocking agent. It is a basic (pKa = 9.1) and highly hydrophobic compound (C log P = 4.6). It has been applied in treating hypertension, angina pectoris, and supraventricular arrhythmias. It is partly removed from wastewater treatment plants and detectable in receiving water bodies. Verapamil at around 7.34 mg/L was detected in the effluents from five manufacturing facilities in Ontario, Canada [1] and 67.2 ng/L of verapamil was found in hospital effluents in Coimbra, Portugal [2]. Some of the literature has discussed the effects of verapamil contact on fish; 455 mg/L of verapamil was determined to affect the heart rate and gut activity of zebrafish larvae (Danio rerio) [3]. When exposed to 270 µg/L of verapamil for 96 h, the oxidative stress was examined in the tissues of juvenile rainbow trout (Oncorhynchus mykiss) [4]. The half-life of verapamil in common carp (10.2 d) was relatively longer than that of verapamil in the human body (4.5–12 h) [5]. The molecular structure of verapamil hydrochloride is depicted in Figure 1 [6].
Current methods of treating verapamil solution have been studied and reported by several techniques, such as UV irradiation [7], non-thermal plasma treatment [8], ozonation [9], adsorption by powdered activated carbon [9], and activated biological treatment [10]. However, these methods have some limitations, such as poor degradation efficiency by UV irradiation (only 51.2%), negative removal efficiency by activated biological treatment (microbial transformation of conjugated forms of drugs in the wastewater can increase the residue levels of parent drugs in the waste streams), difficulty in scaling up the equipment in ozonation, difficulty in regenerating powdered activated carbon (leading to the production of secondary wastes), and high cost by non-thermal plasma treatment (high equipment and operating cost). Besides, the degradation of verapamil by the UV-irradiation method is normally effective for a low solution concentration (1 mg/L) because the presence of excessive verapamil molecules in the solution could limit the penetration of UV light through the solution. Similarly, the ozonation process could remove about 76% of verapamil from a solution having a concentration of only 1.08 µg/L at the expense of lower throughput owing to the low generation of ozone (0.1 to 0.15 g O3/h).
Therefore, membrane technology appeared as the emerging technology for water and wastewater treatments owing to its simplicity and sustainability. Membrane filtration seems to be a feasible technique for removing pharmaceutical contaminants due to its high removal efficiency compared to the adsorption process using activated carbon, easily scalable compared to ozonation, and tunable filtration performance by modifying membrane characteristics. This research aims to modify the membrane characteristics using a sustainable source of GOQDs as an additive in the membrane matrices to increase the verapamil removal efficiency.
Based on the literature, no existing works have reported the removal of verapamil using membrane filtration. The limited studies on verapamil removal by membrane separation could be explained by the nature of most commercial membrane materials (such as the PVDF membrane). PVDF is commonly utilized as a membrane material in water treatments such as microfiltration (MF), ultrafiltration (UF), and membrane bioreactor (MBR) owing to its excellent durability, chemical tolerance, and thermal stability. However, the hydrophobic nature of the PVDF membrane causes severe fouling problems whenever it is used to treat wastewater comprising organic compounds and microorganisms that can adsorb and grow on the membrane surface. Such behavior has been commonly associated with their hydrophobic interaction with the organic compounds. Thus, recent studies have been focusing on the development of PVDF membranes with antibacterial and anti-fouling properties by improving the surface hydrophilicity of the PVDF membranes. Incorporating additives into the casting solution is an attractive membrane modification method to improve the membrane properties. Various additives, such as graphene oxide (GO), quaternary ammonium compound (QAC), titanium dioxide (TiO2), zinc oxide (ZnO), and halloysite nanotubes have been blended into the membranes with enhanced membrane characteristics. GOQD, also known as the smaller size of GO, is another graphene derivative with a lateral dimension of around 100 nm. Owing to the smaller size of GOQD than GO, GOQD could offer a shorter tortuous route for the permeation of molecules across the membrane. Thus, GOQD could be suggested as a potential graphene derivative in the fabrication of nanocomposite material. Silver (Ag) nanoparticles have significantly inhibited the growth of an extensive range of microorganisms. However, large dimensions of the Ag nanoparticles are subjected to aggregation due to insufficient surface functional groups for stabilization [11]. Smaller Ag nanoparticles are also reported to have better antibacterial properties than the bigger ones [12]. A recent study has been conducted to immobilize small Ag onto a bigger substrate to obtain the antibacterial property, simultaneously preventing Ag nanoparticles’ aggregations [13]. The study used GOQD to immobilize the Ag nanoparticles to alter the membrane characteristics and alleviate membrane fouling.
To date, there are only two studies involving the incorporation of similar nanocomposites into the membranes for membrane performance enhancement. The Ag−GOQD nanoparticles that incorporated thin film nanocomposite (TFN) membranes (polyamide selective layer was fabricated through interfacial polymerization method) performed better in terms of permeability, protein rejection, and anti-fouling properties when compared to the bare thin film composite (TFC) membrane (polysulfone as the support layer) [14]. At 200 ppm of nanocomposites, the membrane could eliminate 98.6% of Escherichia coli and 96.5% of Staphylococcus aureus. However, the TFN membranes produced in their work showed relatively low water fluxes in which the highest water flux obtained was only 39.1 LMH. The low water fluxes in their work can be explained by the additional internal resistance imposed by the polyamide selective layer and the absence of Ag−GOQDs in the polysulfone support layer, which makes the TFN membrane less attractive in applications where higher solution flux and solute retention capability are desired. The second study employed a silver phosphate-loaded GOQD-incorporated TFN membrane (polyamide as the selective layer while polysulfone as the support layer) [15]. The water flux increased from 25.8 to 39.6 LMH when the loadings of nanocomposites into the membrane increased from 0 to 50 ppm. Similarly, the low water fluxes in that work were mainly caused by the additional internal resistance due to the polyamide selective layer and the absence of Ag−GOQDs in the polyulfone support. Both studies focused mainly on the reverse osmosis application and the membrane fabrication method used in these studies was the interfacial polymerization method.
A previous study has attempted to employ membrane bioreactor (MBR) in treating pharmaceutical wastewater containing verapamil but by using a polyethersulfone (PES) membrane [16]. Based on that study, the removal efficiency obtained using PES membrane was only 82%. The PVDF membrane has previously been modified and used in removing tetracycline, doxycycline, norfloxacin, and ciprofloxacin through a membrane distillation setup. However, the operation required an elevated feed solution temperature and high hydrophobic surface to prevent the pore-wetting effect. To date, there is no study applying similar nanocomposite-incorporated membranes or PVDF membranes to treat solutions contaminated by verapamil. The current work serves as the first trial in removing verapamil aqueous solutions only by membrane filtration using pure PVDF and Ag−GOQD-incorporated PVDF membranes in a batch filtration setup. No recent works have reported the employment of PVDF membranes for verapamil removal, which could be explained by the pure PVDF membranes’ low rejection capabilities due to the PVDF membrane’s highly hydrophobic nature. Attempts have been performed to modify PVDF surfaces through the grafting method to hydrophilize the PVDF membrane surfaces. However, the stability of the PVDF membrane produced through the grafting method and its potential application in verapamil removal is not reported in any of the existing works. Therefore, the current study aims to modify the PVDF membranes with Ag−GOQD to improve the rejection capability and surface hydrophilicity of the membranes.
In this work, the GOQD nanocomposites were produced using empty fruit bunches from oil palms before decoration by the Ag nanoparticle. The Ag−GOQD were blended into the PVDF membrane matrix to form Ag−GOQD-incorporated PVDF composite membranes through phase inversion. The Ag−GOQD nanocomposites were characterized by their morphological structures, functional groups, and surface charges. The modified PVDF membranes were characterized by their morphological structures, surface roughness, hydrophilicities, permeabilities, anti-fouling properties, verapamil removal capabilities, and antibacterial tests.

2. Materials and Methods

2.1. Materials

The oil palm empty fruit bunches (EFB) were obtained from Seri Ulu Langat Palm Oil Mill Sdn Bhd. Sulphuric acid (H2SO4, 98%), potassium permanganate (KMnO4, ≥99.5%), sodium nitrate (NaNO3, ≥99%), hydrogen peroxide (H2O2, 37%), sodium borohydride (NaBH4, ≥98%), silver nitrate (AgNO3, ≥99%), diethylene glycol (DEG, 99%), verapamil hydrochloride, polyvinyl fluoride beads (PVDF, MW 180,000 g/mol), N-2-methyl-pyrrolidone (NMP), nutrient broth, and nutrient agar were procured from Sigma Aldrich, Subang Jaya, Malaysia. All the chemicals are of analytical grade.

2.2. Pre-Treatment of Oil Palm Empty Fruit Bunches (EFB)

The EFBs were washed a few times with deionized water. Then, EFBs were dried, crushed into powder, and sieved to receive an average size of 300 µm.

2.3. Production of Graphite from Oil Palm Empty Fruit Bunches (EFB)

Additionally, 12.0 g of EFBs were added into an alumina boat and placed in the middle of the furnace chamber. The conditions were as follows: temperature = 900 °C and heating rate = 10 °C/min. A high temperature is required to eliminate the non-graphitic materials in the sample [17]. The nitrogen gas flowed through the system continuously. The heating process was halted after keeping 900 °C for 3 h while the nitrogen gas flowed through the system until the chamber temperature was 100 °C. The sample was taken out when the sample temperature dropped to room temperature.

2.4. Production of Graphene Oxide (GO) from Graphite

The graphite sample was exfoliated using the method previously reported [18]. The mixture was centrifuged at 8000 rpm stirring speed for 30 min. The solution was diluted with 5% HCl and deionized water until the pH changed to almost neutral. The precipitate was collected, freeze-dried, and stored for further use.

2.5. Decoration of Silver (Ag) onto GO

The Ag-GO was synthesized based on previously reported work [19]; 10 mL of GO suspension was mixed with 4 × 10⁻³ mol dm−3 of AgNO3 solution. The mixture was stirred for 1 h in an ice bath. Then, 1 mL of 0.01 mol dm−3 of NaBH4 solution was added gradually into the mixture under vigorous stirring. The mixture was stirred for another 5 h at 25 °C to allow for the complete reduction in AgNO3 [20]. The mixture was rinsed with deionized water and centrifuged a few times. Lastly, the mixture was freeze-dried and stored for further use.

2.6. Production of Ag−GOQD from Ag-GO

Firstly, the Ag-GO powder was weighed and mixed with mixtures containing deionized water and DEG (at a ratio of 1:1) to produce a mixture concentration of 10 g/L. The mixtures were sonicated for 30 min to create a homogenous solution. The samples were heated in the microwave oven (Midea MM720CXM, Malaysia) for 3 min at 385 W.

2.7. Characterization of Ag−GOQD

2.7.1. Morphological Analysis of Ag−GOQD

The transmission electron microscopy (TEM, PHILIPS CM-12, Eindhoven, The Netherlands) and field emission scanning electron microscopy (FESEM, SUPRA 55VP-ZEISS, Oberkochen, Germany) were employed to investigate the morphologies of GOQD and Ag−GOQD; 20 µL of Ag−GOQD solution was sonicated and coated on a copper mesh grid. The excess water was wiped off using tissue paper after 2 min to reduce the chances of aggregation of nanoparticles. The sample was dried in a dust-free chamber for a minimum period of 2 h before the analysis. Energy dispersive X-ray spectroscopy (EDX) was employed to investigate the dispersion of Ag elements in the nanocomposites. The sample was dried in the desiccator before the analysis.

2.7.2. Elemental Composition Analysis of Ag−GOQD

X-ray photoelectron spectroscopy (XPS, PHI 5000 Versa Probe, ULVAC-PHI, Inc., Chigasaki, Japan) was employed to study the elemental composition of GOQD and Ag−GOQD. One sample drop was placed on a clean glass slide, letting it air dry.

2.7.3. Determination of Functional Groups of Ag−GOQD

Fourier transform infrared spectroscopy (FTIR, Themo Fisher Nicolet C700 model) was employed to study the functional groups of GOQD and Ag−GOQD [21]. The Ag−GOQD was scanned from 4000 to 400 cm−1 with a resolution of 4 cm−1 for 100 scans. The sample was dried in the desiccator before the analysis.

2.7.4. Determination Zeta Potential of Ag−GOQD

A Zeta sizer (Malvern Zetasizer Nano ZS, Worcestershire, UK) was employed to determine the zeta potentials of GOQD and Ag−GOQD. The zeta potentials of the sample were measured thrice in distilled water at different pH values ranging from 3 to 11. The mixture containing the sample and distilled water was sonicated for 10 min to obtain a homogenous solution before the analysis.

2.8. Composite Membrane Fabrication

During the casting solution preparations, a certain amount of Ag−GOQD was dispersed in NMP in an ultrasonicator for 2 h to receive a uniform dispersion of Ag−GOQD in the solvent. A certain amount of PVDF beads was mixed into the mixtures comprising Ag−GOQD and NMP and stirred at 70 °C until the polymer beads were completely dissolved. The solution was left at room temperature overnight to allow it to cool down and eliminate bubbles. A 150 µm thick membrane was casted using a film applicator. The casted membrane was immersed in the water bath overnight. Lastly, the membrane was transferred into a water bath for storage. Table 1 shows the compositions of the casting solutions of the PVDF composite membranes.

2.9. Membrane Characterization

2.9.1. Morphological Analysis of Membrane

FESEM (SUPRA 55VP-ZEISS, Oberkochen, Germany) equipped with the EDX was employed to study the surface and cross-section morphologies of the fabricated membranes and the surface elemental composition of the fabricated membranes. The membranes were fractured in liquid nitrogen. The membranes were platinum coated to enhance electrical conductivity before scanning to enhance the visualization of the membrane morphologies.

2.9.2. Determination of Membrane Surface Roughness

Atomic force microscopy (AFM) (Veeco Multimode, Portsmouth, VI, USA) was applied to analyze the surface roughness of the fabricated membranes. The sample was fixed firmly on mica support before the analysis. Each measurement was repeated 3 times to confirm the consistency of the results.

2.9.3. Determination of Surface Hydrophilicity of Membrane

A shape analysis system (DSA100 Kruss, Hamburg, Germany) was employed to study the surface hydrophilicity of the fabricated membranes. All the membrane samples were air-dried overnight before the contact angle measurement. Three different contact angle measurements were taken at three other locations to acquire the average value.

2.10. Flux and Rejection Test

A dead-end setup (Sterlitech HP4750 stirred cell, Auburn, WA, USA) was employed to measure the pure water flux. The membrane was compacted at 5 bar for 30 min. The membranes were placed at the bottom of the cell, with an alumina support disc provided. The rejection capabilities of the membranes toward the verapamil molecules were determined at an operating pressure of 5 bar and a stirring speed of 200 rpm.
Both the pure water flux (using deionized water as feed) and verapamil solution flux (using 20 mg/L VPM solution as feed) were obtained using Equation (1):
J = ΔV/(A × Δt)
where J is the permeate flux (L/m2 h), ΔV is the permeate volume (L), A is the effective surface area of the membrane (13.85 × 10⁻⁴ m2), and Δt is the filtration time interval (h), respectively.
VPM was used as the synthetic solute to study the effect of Ag−GOQD on the fouling resistance of the fabricated membranes. The concentration of the VPM was determined using an ultraviolet-visible spectrophotometer at the absorption wavelength of verapamil of approximately 278 nm. A graph of absorbance against the drug concentration was plotted, enabling the unknown concentration of verapamil to be determined using the regression equation derived from Beer’s Law.
The rejection of solute was obtained using Equation (2):
R = 1 − (Cp/Cf)
where Cp and Cf refer to the concentrations of the permeate and feed solutions (g/L), respectively.

2.11. Membrane Anti-Fouling Test

The anti-fouling performances of the membranes were analyzed by measuring water and solution fluxes. The first 30 min was logged to measure the pure water flux (J0). The solution flux (J1) using a 20 ppm verapamil solution was logged in the next 60 min. Then, the membranes were rinsed using distilled water. Finally, the pure water flux (J2) was logged in the next 30 min. A graph of membrane flux against time was plotted to evaluate the fouling behavior of the membranes. The flux recovery ratio (FRR), total fouling ratio (Rt), reversible fouling ratio (Rr), and irreversible fouling ratio (Rir) were used to quantify the anti-fouling ability of the membranes. The calculations were as follows:
FRR = (J2/J1) × 100%
Rt = ((J0 − J1)/ J0) × 100%
Rr = ((J2 − J1)/ J0) × 100%
Rir = ((J0 − J2)/ J0) × 100%

2.12. Antibacterial Test

Escherichia coli (E. coli) bacteria were chosen as the model bacteria for the study. To prepare the broth solution to be inoculated, 0.8 g of nutrient broth powder was mixed with 100 mL of distilled water. The agar plates were prepared with 4 g of nutrient broth and 14 g of nutrient powder in 500 mL of distilled water. The nutrient broth and agar solutions were autoclaved at 121 °C for 15 min. The membrane samples (with a diameter of 5 mm) were UV-treated before dipping into the bacterial suspension for 1 min. The membrane samples were placed on the agar and inoculated at 37 °C for 24 h. The zone of inhibition was observed on the membrane samples incorporated with and without Ag−GOQD nanocomposites.

3. Results and Discussion

3.1. Characterization of GOQD and Ag−GOQD

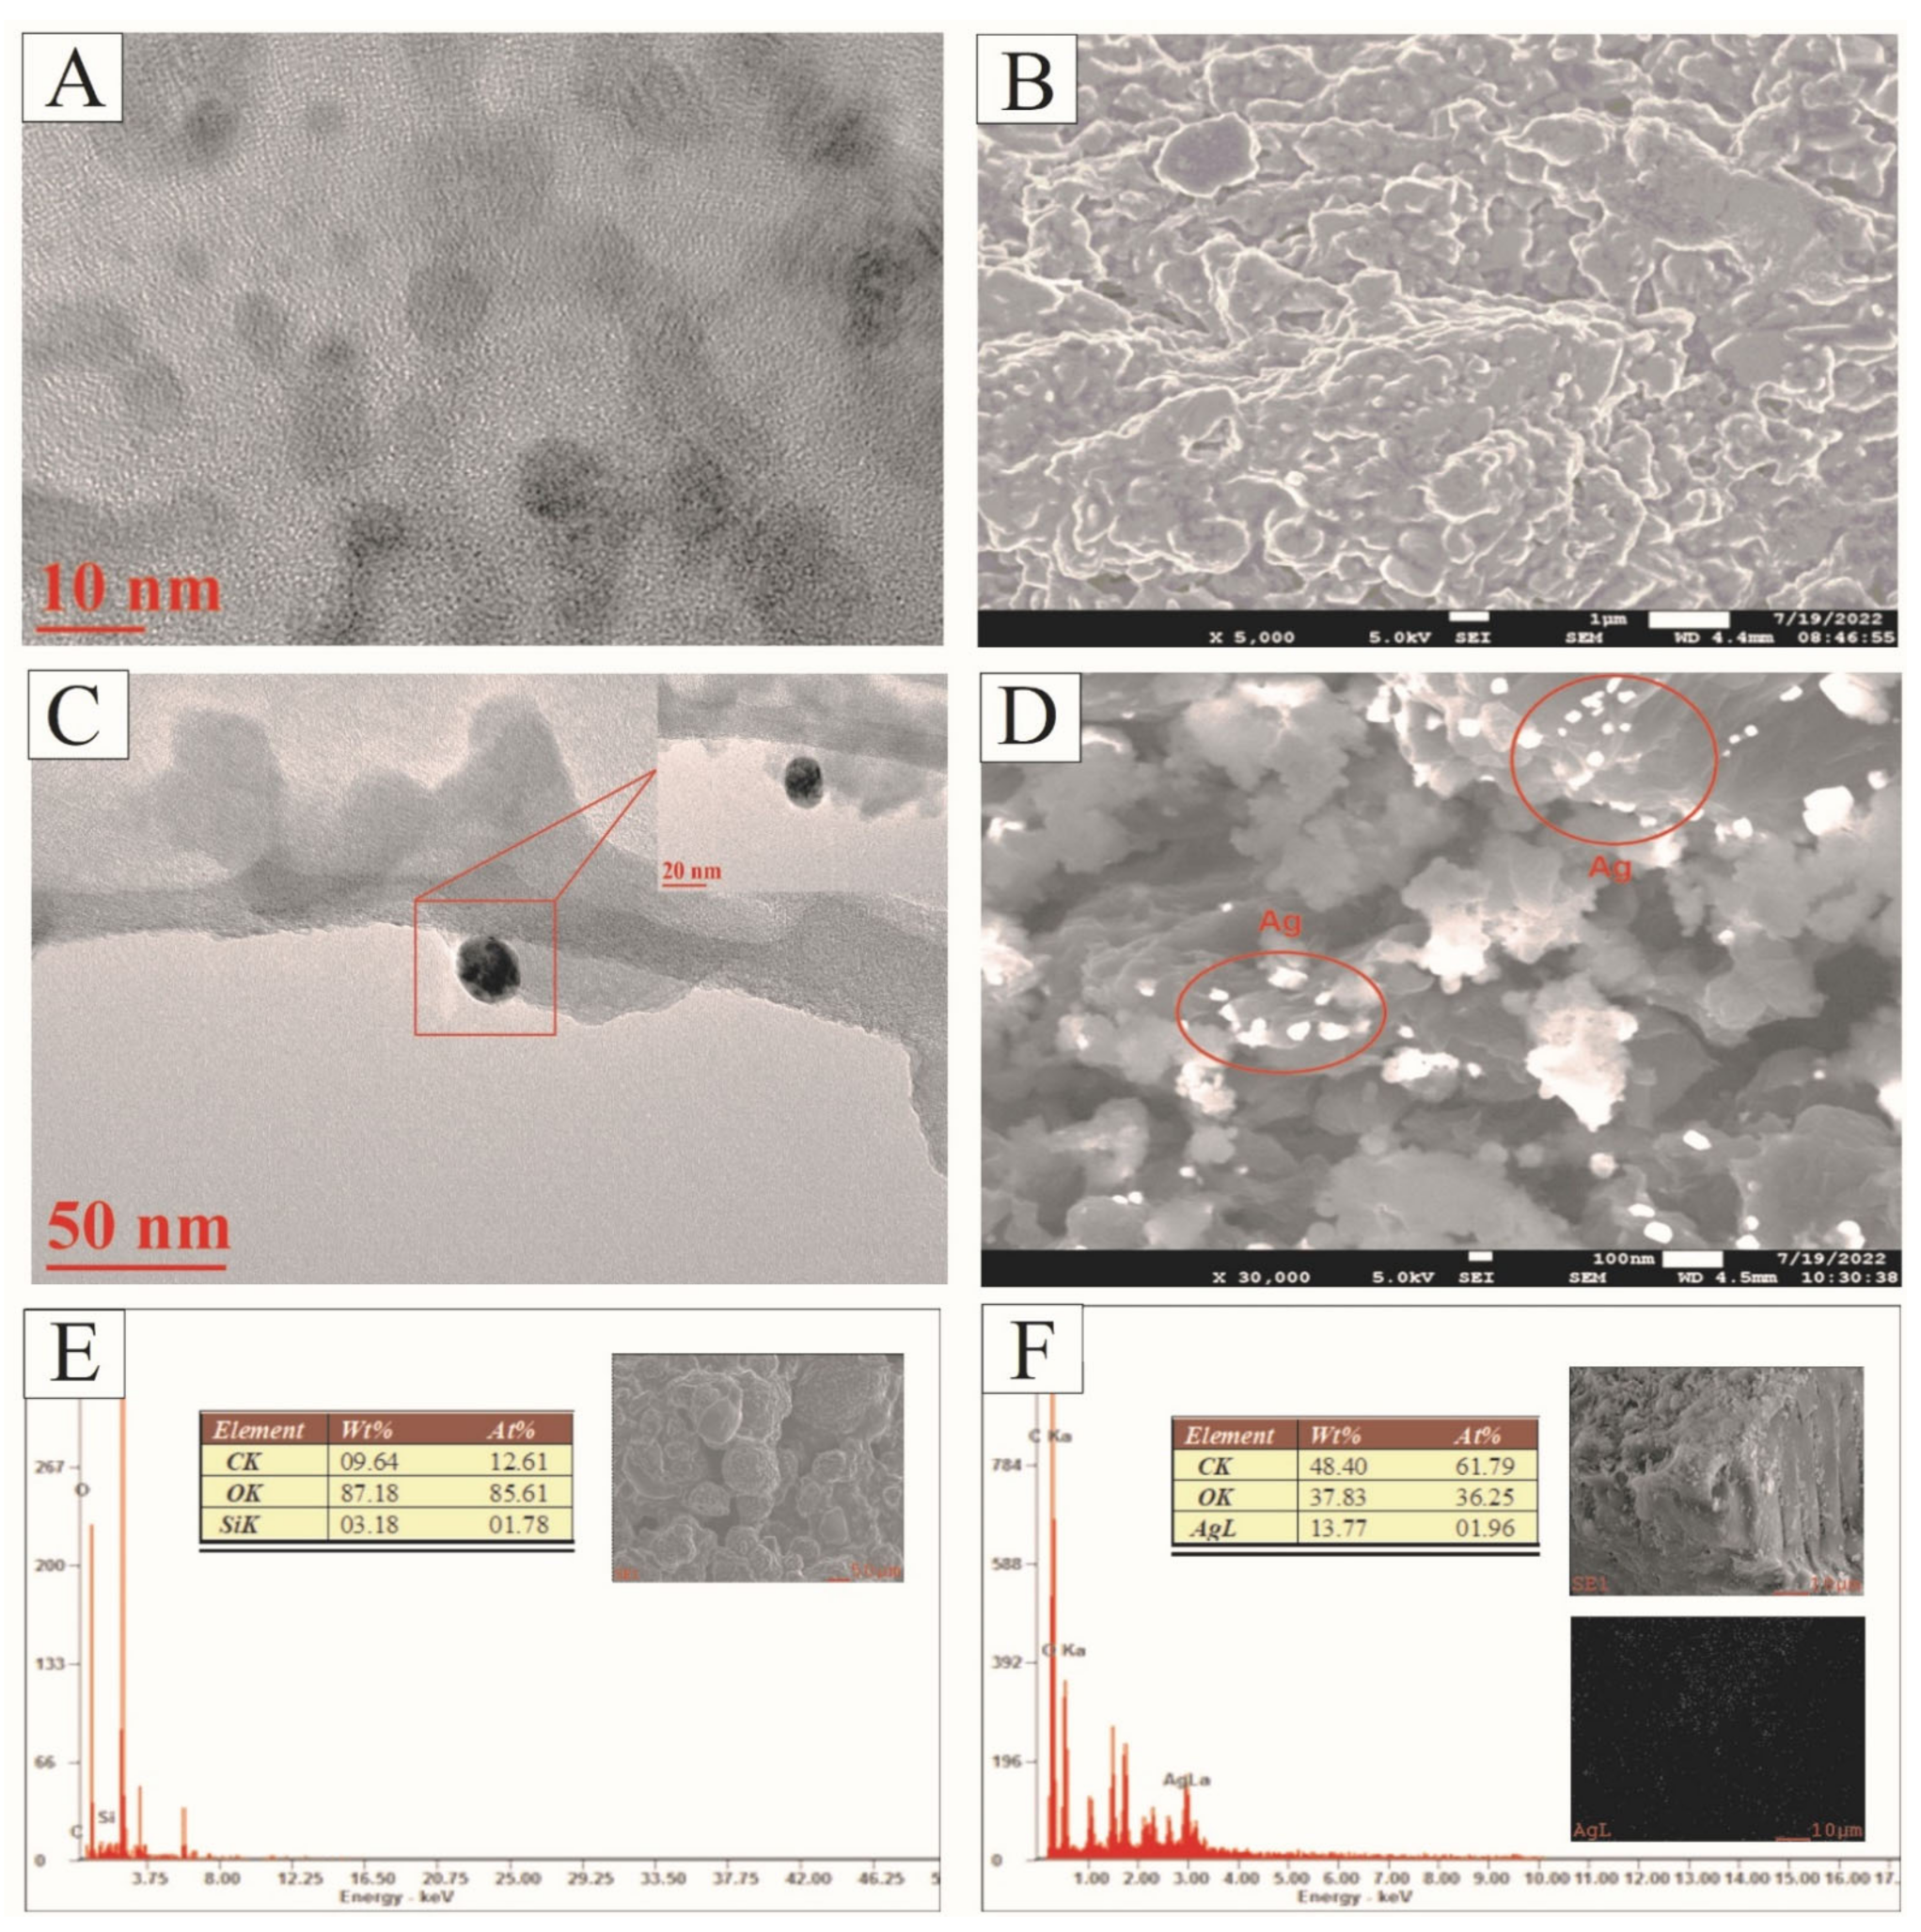
The TEM was employed to evaluate the morphology and size of GOQD and Ag−GOQD. The TEM image of GOQD, as shown in Figure 2A, showed that GOQD exhibited a dot-like shape with a lateral dimension of around 10–20 nm. The FESEM image of GOQD in Figure 2B indicated the aggregations of GOQD. Figure 2C showed that the Ag nanoparticles with a lateral dimension of over 10 nm were embedded onto the GOQD surface. The immobilization of Ag nanoparticles onto GOQD could prevent the aggregation of Ag nanoparticles and encourage the uniform distribution of Ag nanoparticles onto the GOQD surface, which may improve the overall antibacterial capability. The FESEM image of Ag−GOQD in Figure 2D indicated the spherical Ag nanoparticles attached to the basal planes and edges of GOQD. Performing the EDX analysis exhibited the elemental composition of GOQD and Ag−GOQD. The EDX results of GOQD in Figure 2E showed that 9.64 wt% of C, 87.18 wt% of O, and 3.18 wt% of Si were detected in GOQD. Silicon was present as a result of the substrate used in positioning the samples during the scanning process. In Figure 2F, the elemental mapping exhibited the uniform dispersion of Ag nanoparticles throughout the Ag−GOQD nanocomposites. The EDX results of Ag−GOQD indicated the existence of C, O, and Ag elements in the nanocomposites
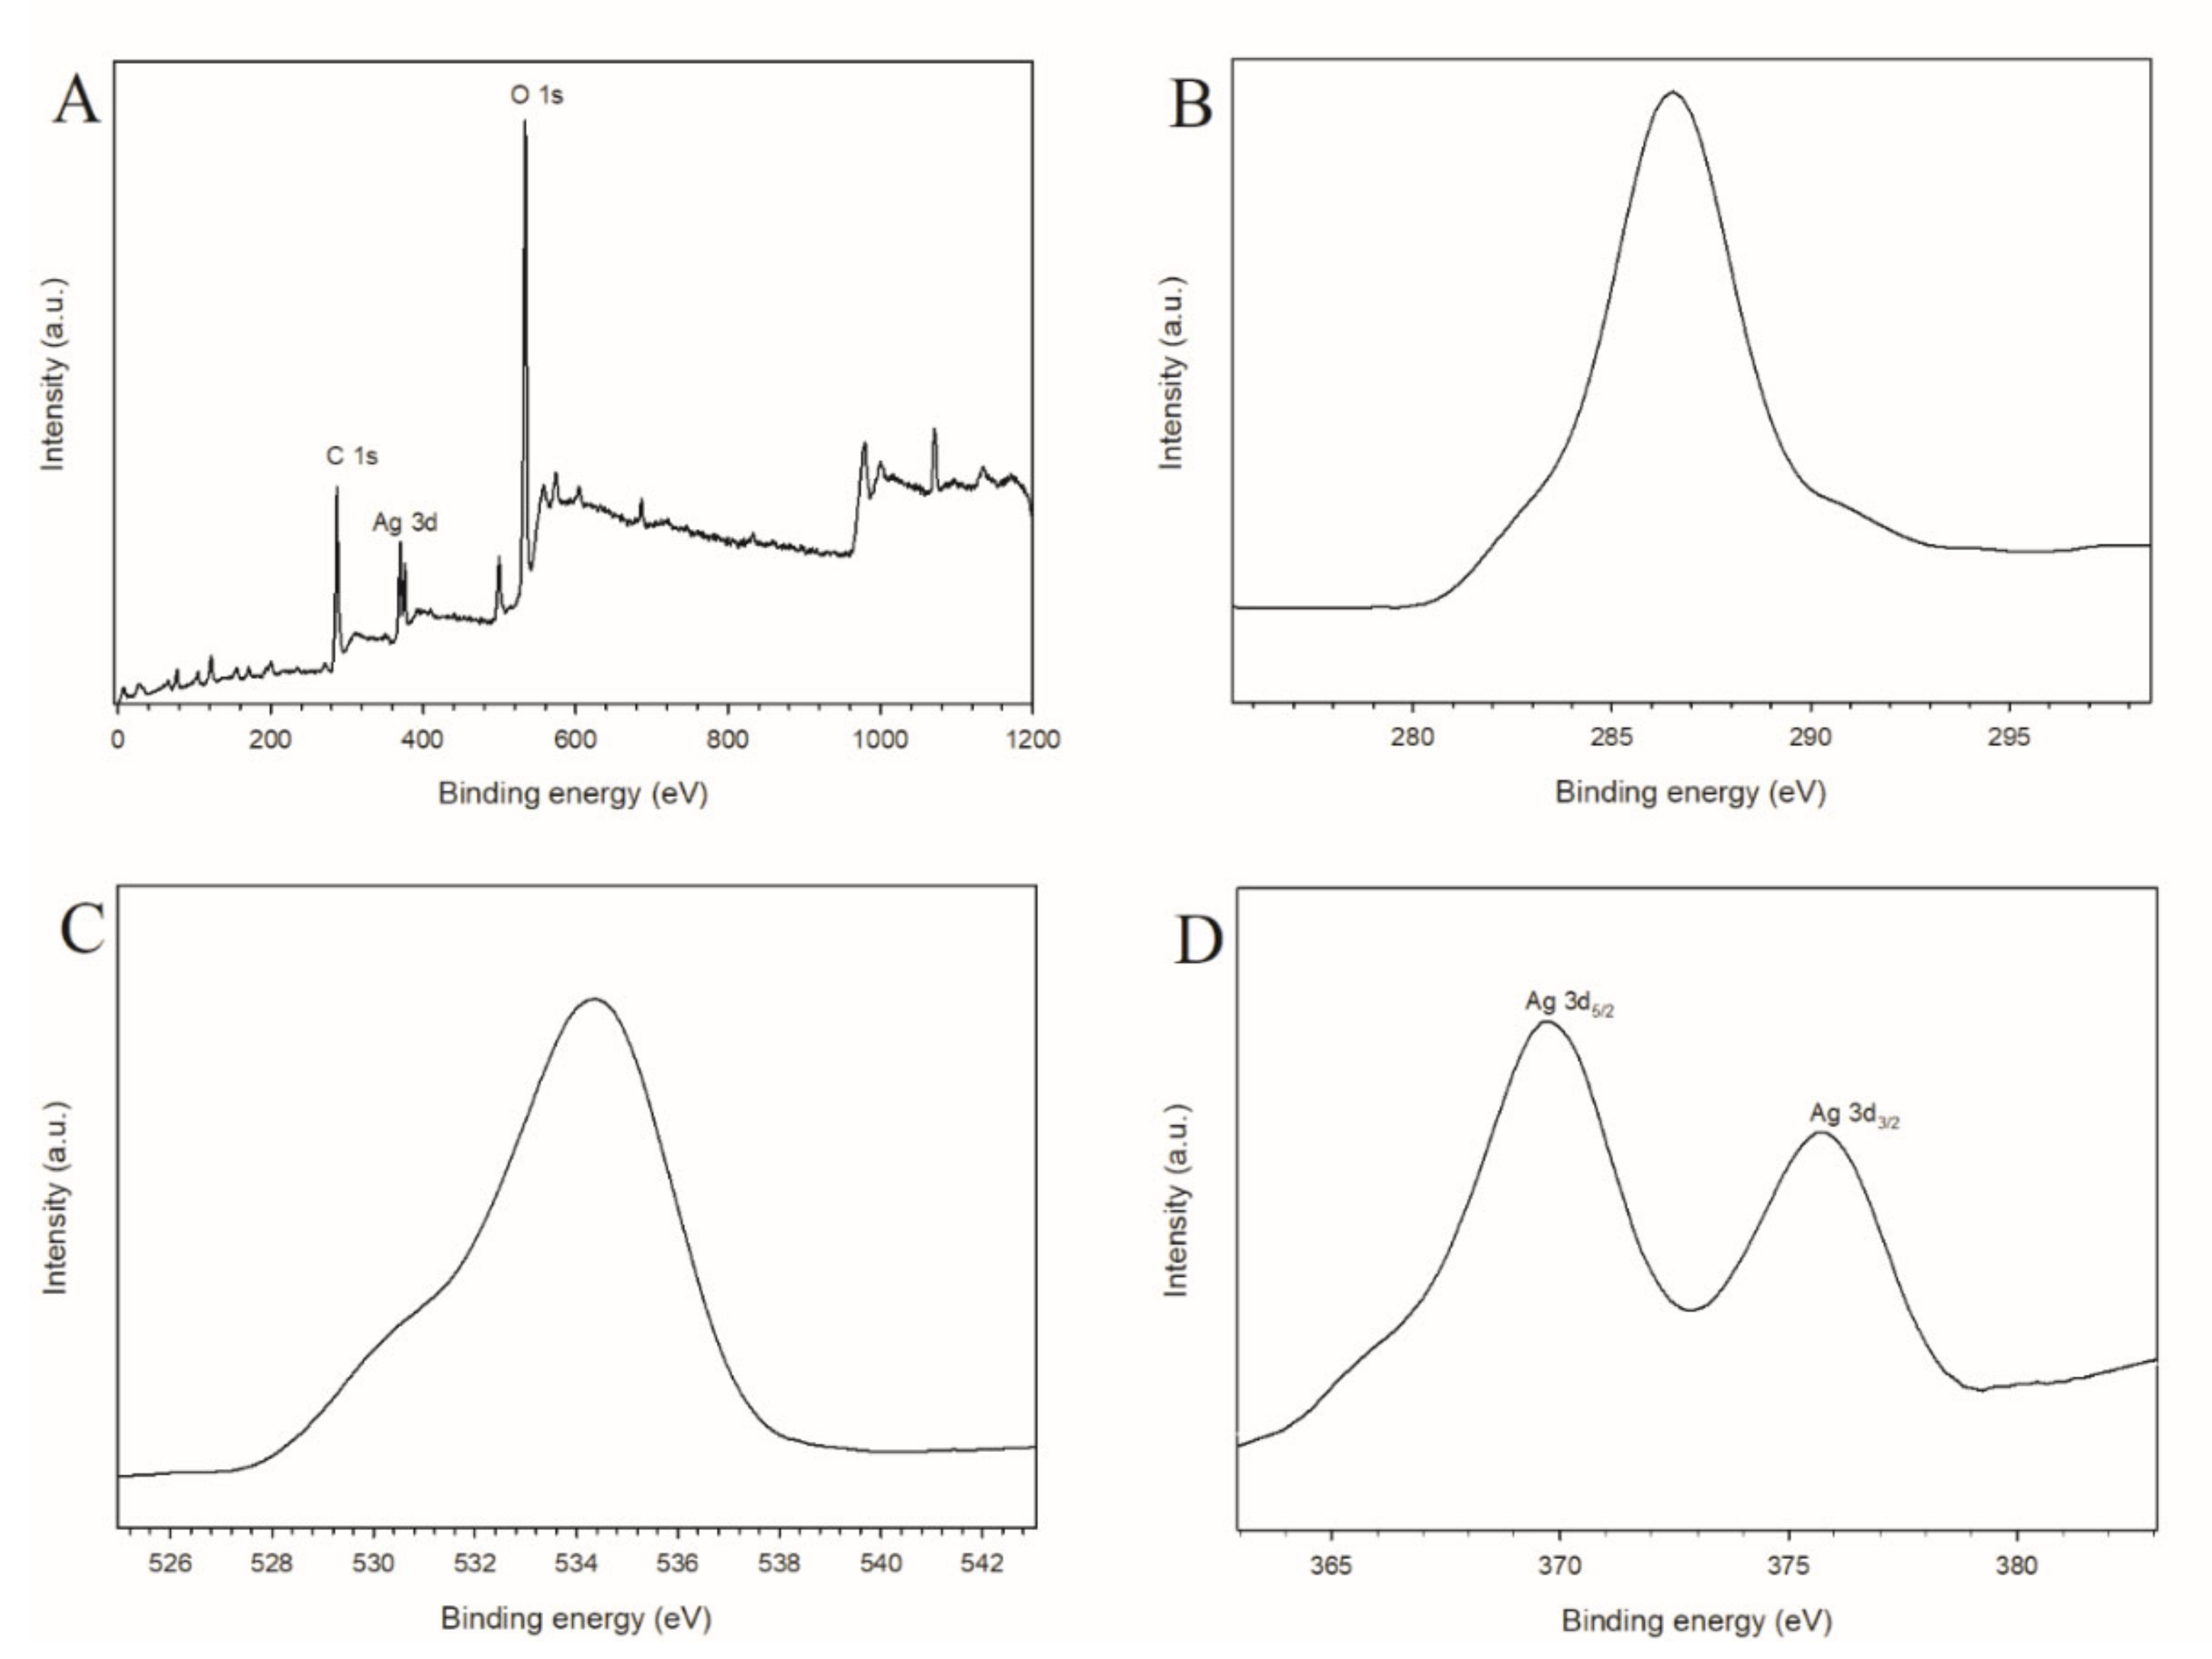
The XPS analysis was carried out to reveal the surface composition of Ag−GOQD. The XPS results in Figure 3 displayed the successful anchoring of Ag nanoparticles onto the surface of GOQD. The XPS survey in Figure 3A indicated the binding energies of the elements such as C 1s (286.54 eV), O 1s (534.42 eV), and Ag 3d (375.76 and 369.73 eV) in the nanocomposites. The C 1s and O 1s spectra of Ag−GOQD are depicted in Figure 3B,C, respectively. A decline in the intensity of oxygenated functional groups was observed in GOQD when the Ag nanoparticles adhered to the GOQD surface [14]. As shown in Figure 3D, two peaks were detected at 375.76 and 369.73 eV in the XPS spectrum of Ag 3d of Ag−GOQD, resulting from Ag 3d5/2 and Ag 3d3/2, respectively. The spin energy difference of 6 eV in the Ag 3d spectrum corresponded to the theoretical value of metallic Ag, suggesting that the Ag ions had been reduced when Ag was formed on the GOQD surface [22].
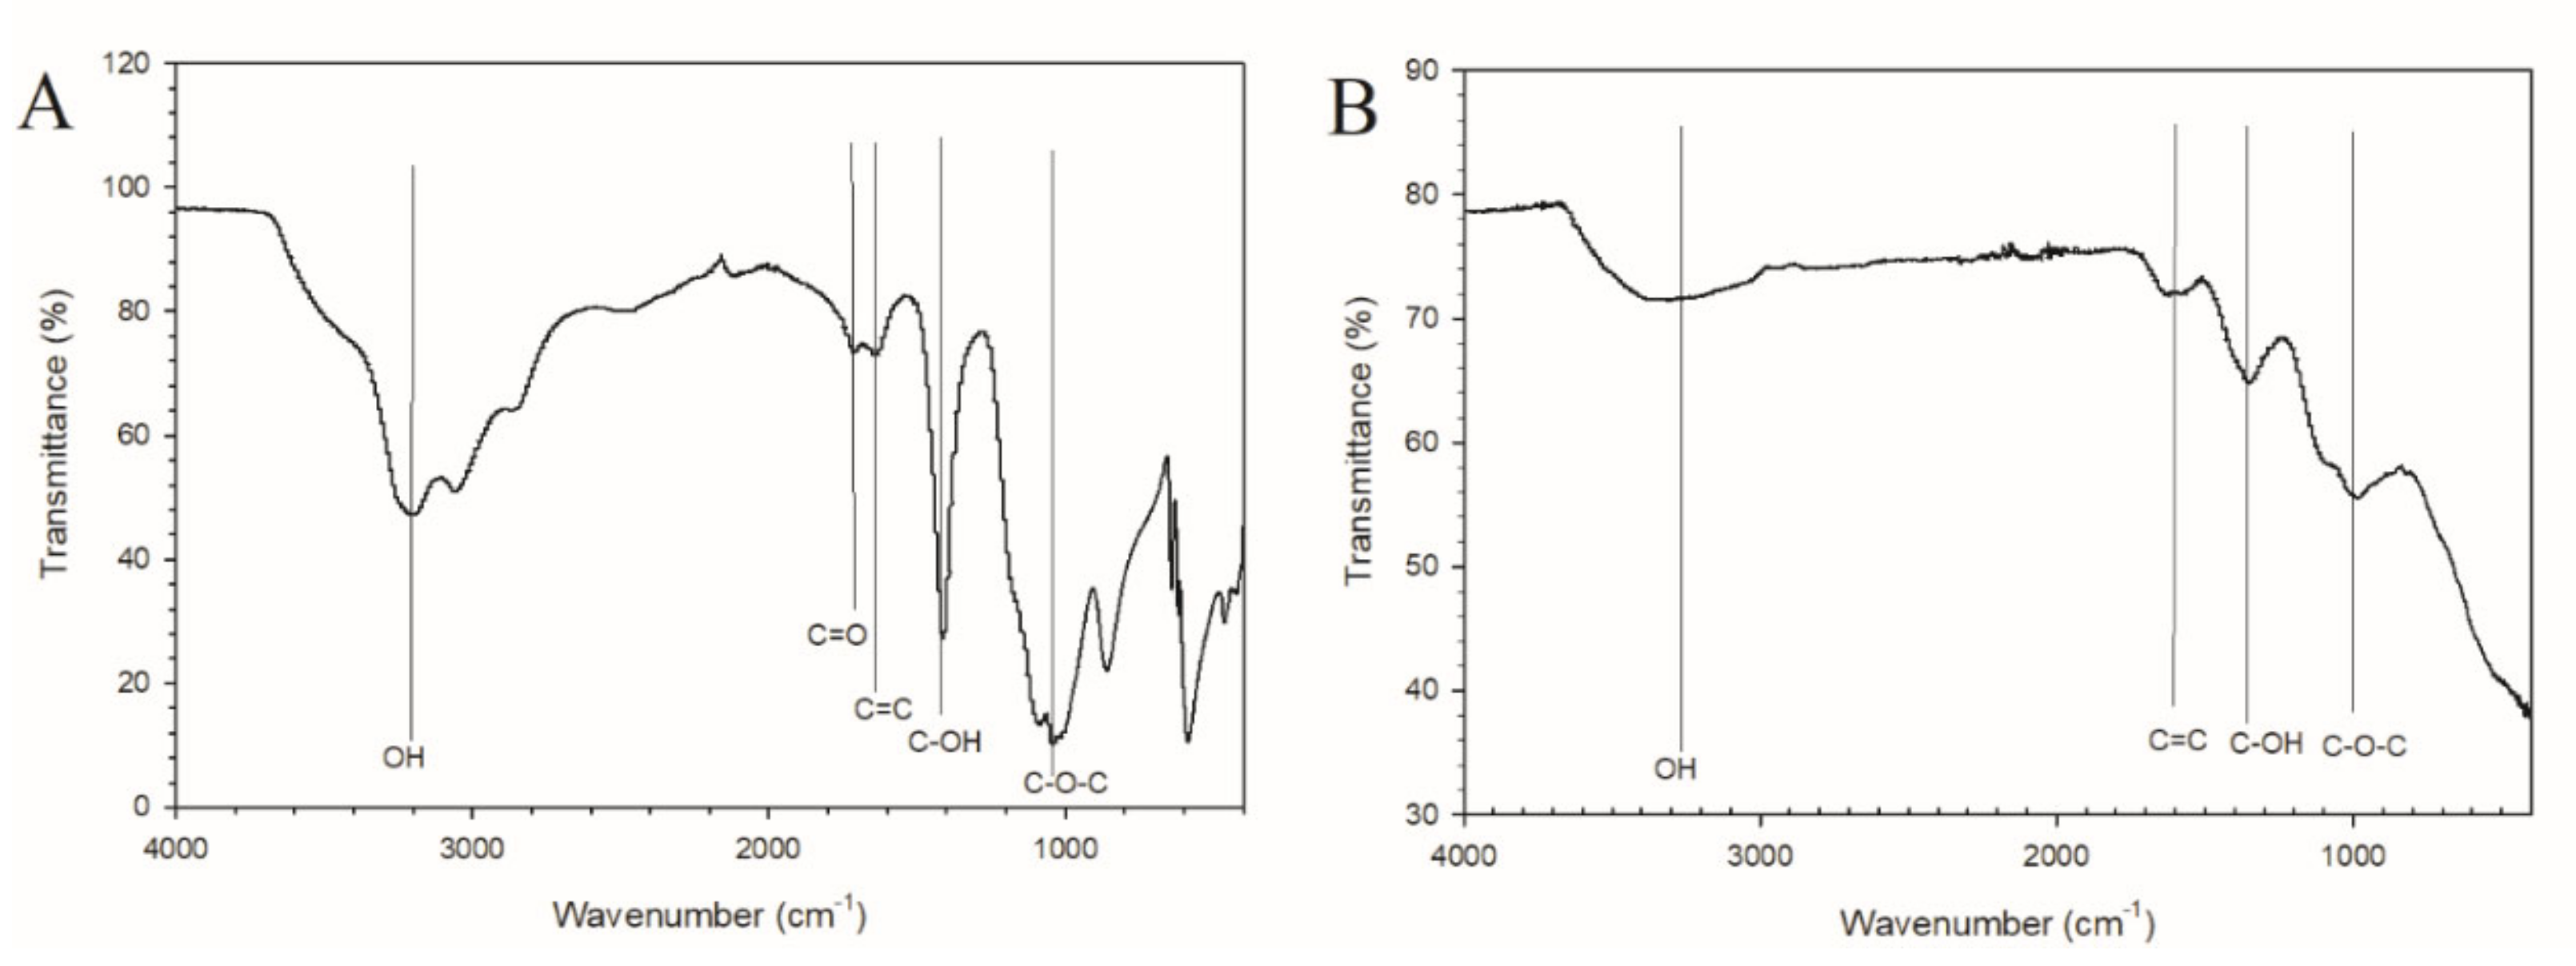
The FTIR analysis was conducted to analyze the presence of functional groups in GOQD and Ag−GOQD. The FTIR spectrum of GOQD in Figure 4A revealed that the absorption peaks centered at the wavenumbers of 3199.95, 1712.56, 1635.41, 1410.09, and 1039.51 cm−1, corresponding to the stretching vibrations of OH, C = O, C = C, C-OH, and C-O-C groups, respectively [23]. Conversely, the FTIR spectrum of Ag−GOQD in Figure 4B showed that the absorption peaks centered at 3312.94, 1617.64, 1356.16, and 1001.92 cm−1, corresponding to the OH, C = C, C-OH, and C-O-C groups, respectively [24]. The Ag−GOQD displayed reduced intensity of all the absorption bands of the oxygenated functional groups compared to GOQD, owing to the doping of Ag on the GOQD surface. The change can be correlated to the interactions between the Ag nanoparticles and the oxygenated functional groups of GOQD either by hydrogen bonding or electrostatic attractions. The oxygen-rich functional groups of GOQD can serve as the nucleation center for Ag ions to form Ag nanoparticles under basic conditions [25]. The phenolic groups of GOQD have been ionized to be converted into phenolate anions. The phenolate anions can undergo electrophilic aromatic substitution, which can be converted into semiquinone by transferring the electrons to Ag ions, contributing to the reduction in Ag+ to Ag0 [26].
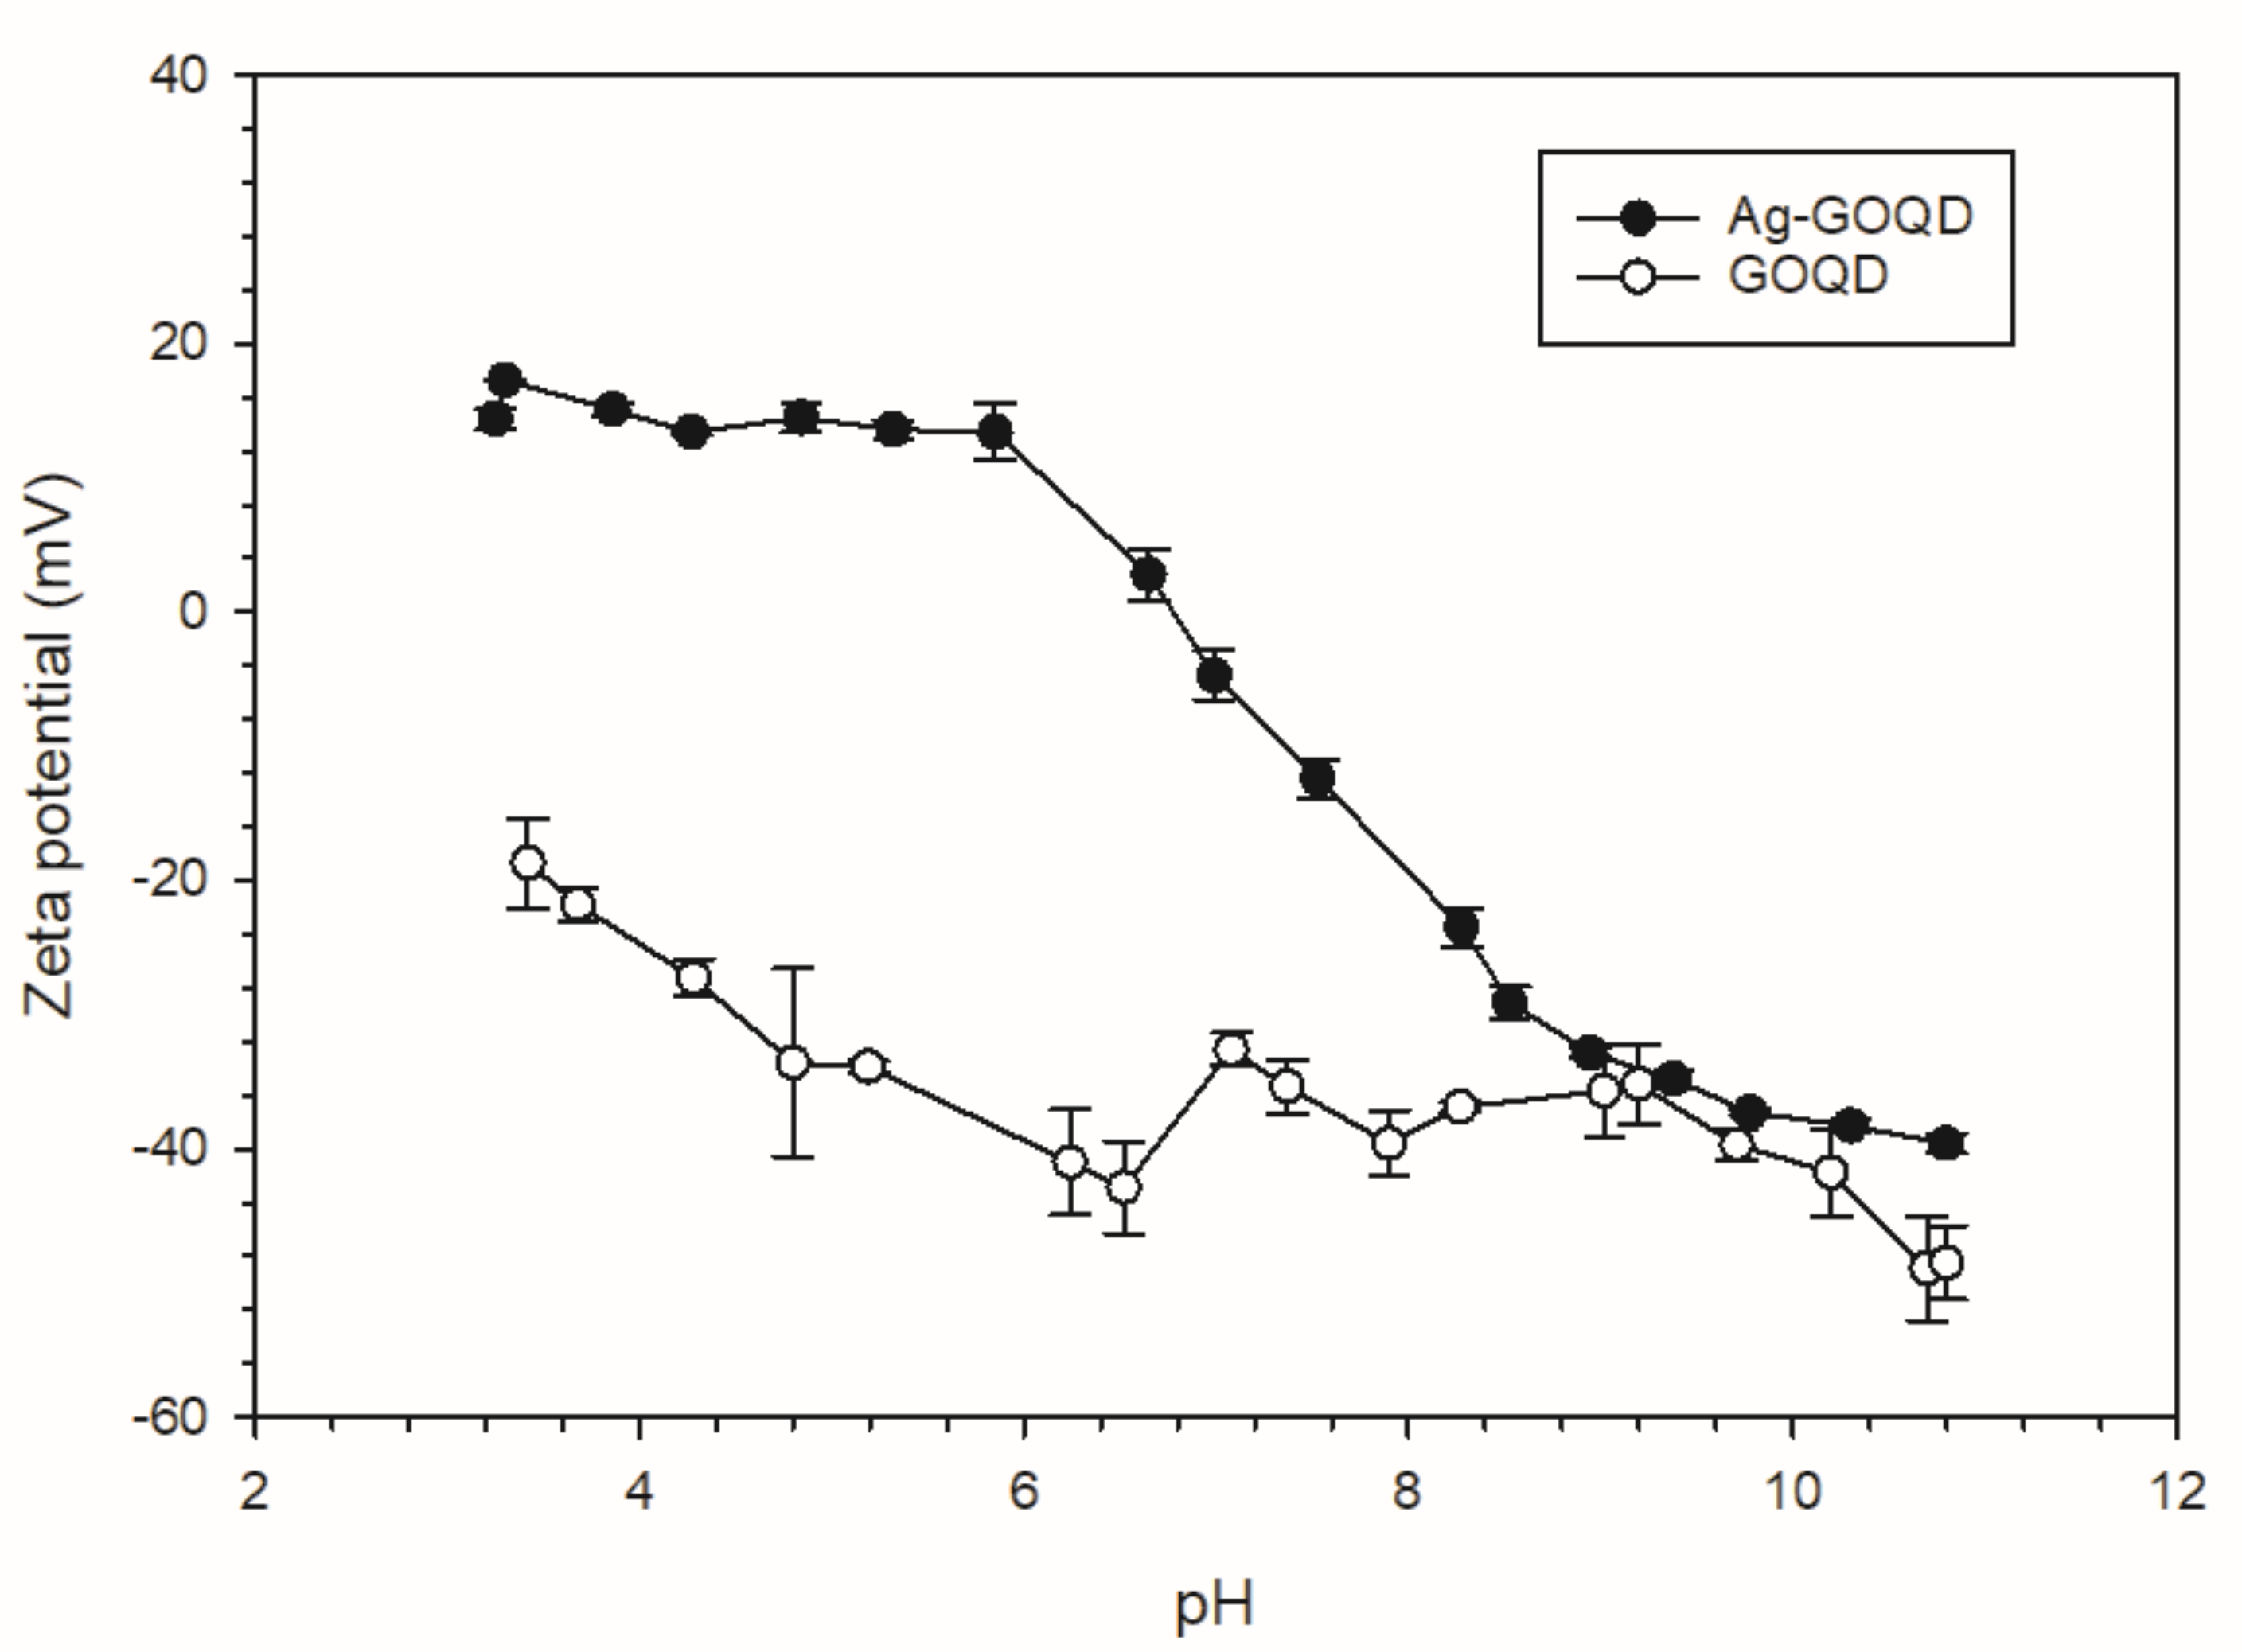
The Zeta potential analysis was employed to study the zeta potential values of GOQD and Ag−GOQD at a pH range from 3 to 11, as shown in Figure 5. The GOQD and Ag−GOQD exhibited increasing negative zeta potential as the pH value increased. The GOQD showed increasing negative zeta potential as the pH value increased due to the expanding degree of deprotonation of carboxyl groups to carboxylate ions (COO-) when the pH value increased [27]. The slight increase in zeta potential values of GOQD at pH around from 6 to 7 may result from the compression of the double electrical layer [28]. The compression of the double electrical layer might occur due to the equal amount of hydrogen and hydroxide ions when the pH value of the GOQD solution increased from around 6 (weak acid) to 7 (neutral). The expanded ionization of carboxylate and phenolic groups of GOQD contributed to the high negative surface charge at an increasing pH value, which may enhance the stability of the GOQD in suspension [29]. As compared to GOQD, the Ag−GOQD showed a more favorable surface charge owing to the reduction in the number of oxygenated functional groups of GOQD after Ag nanoparticles were successfully decorated onto the GOQD surfaces. This finding is well supported by the results from the XPS and FTIR analyses. The Ag−GOQD showed positive charges at pH around from 3 to 6, owing to the expanded amount of oxygenated functional groups of GOQD binding to Ag ions in the solution.

3.2. Characterization of Pure PVDF and Ag−GOQD-Incorporated PVDF Membranes

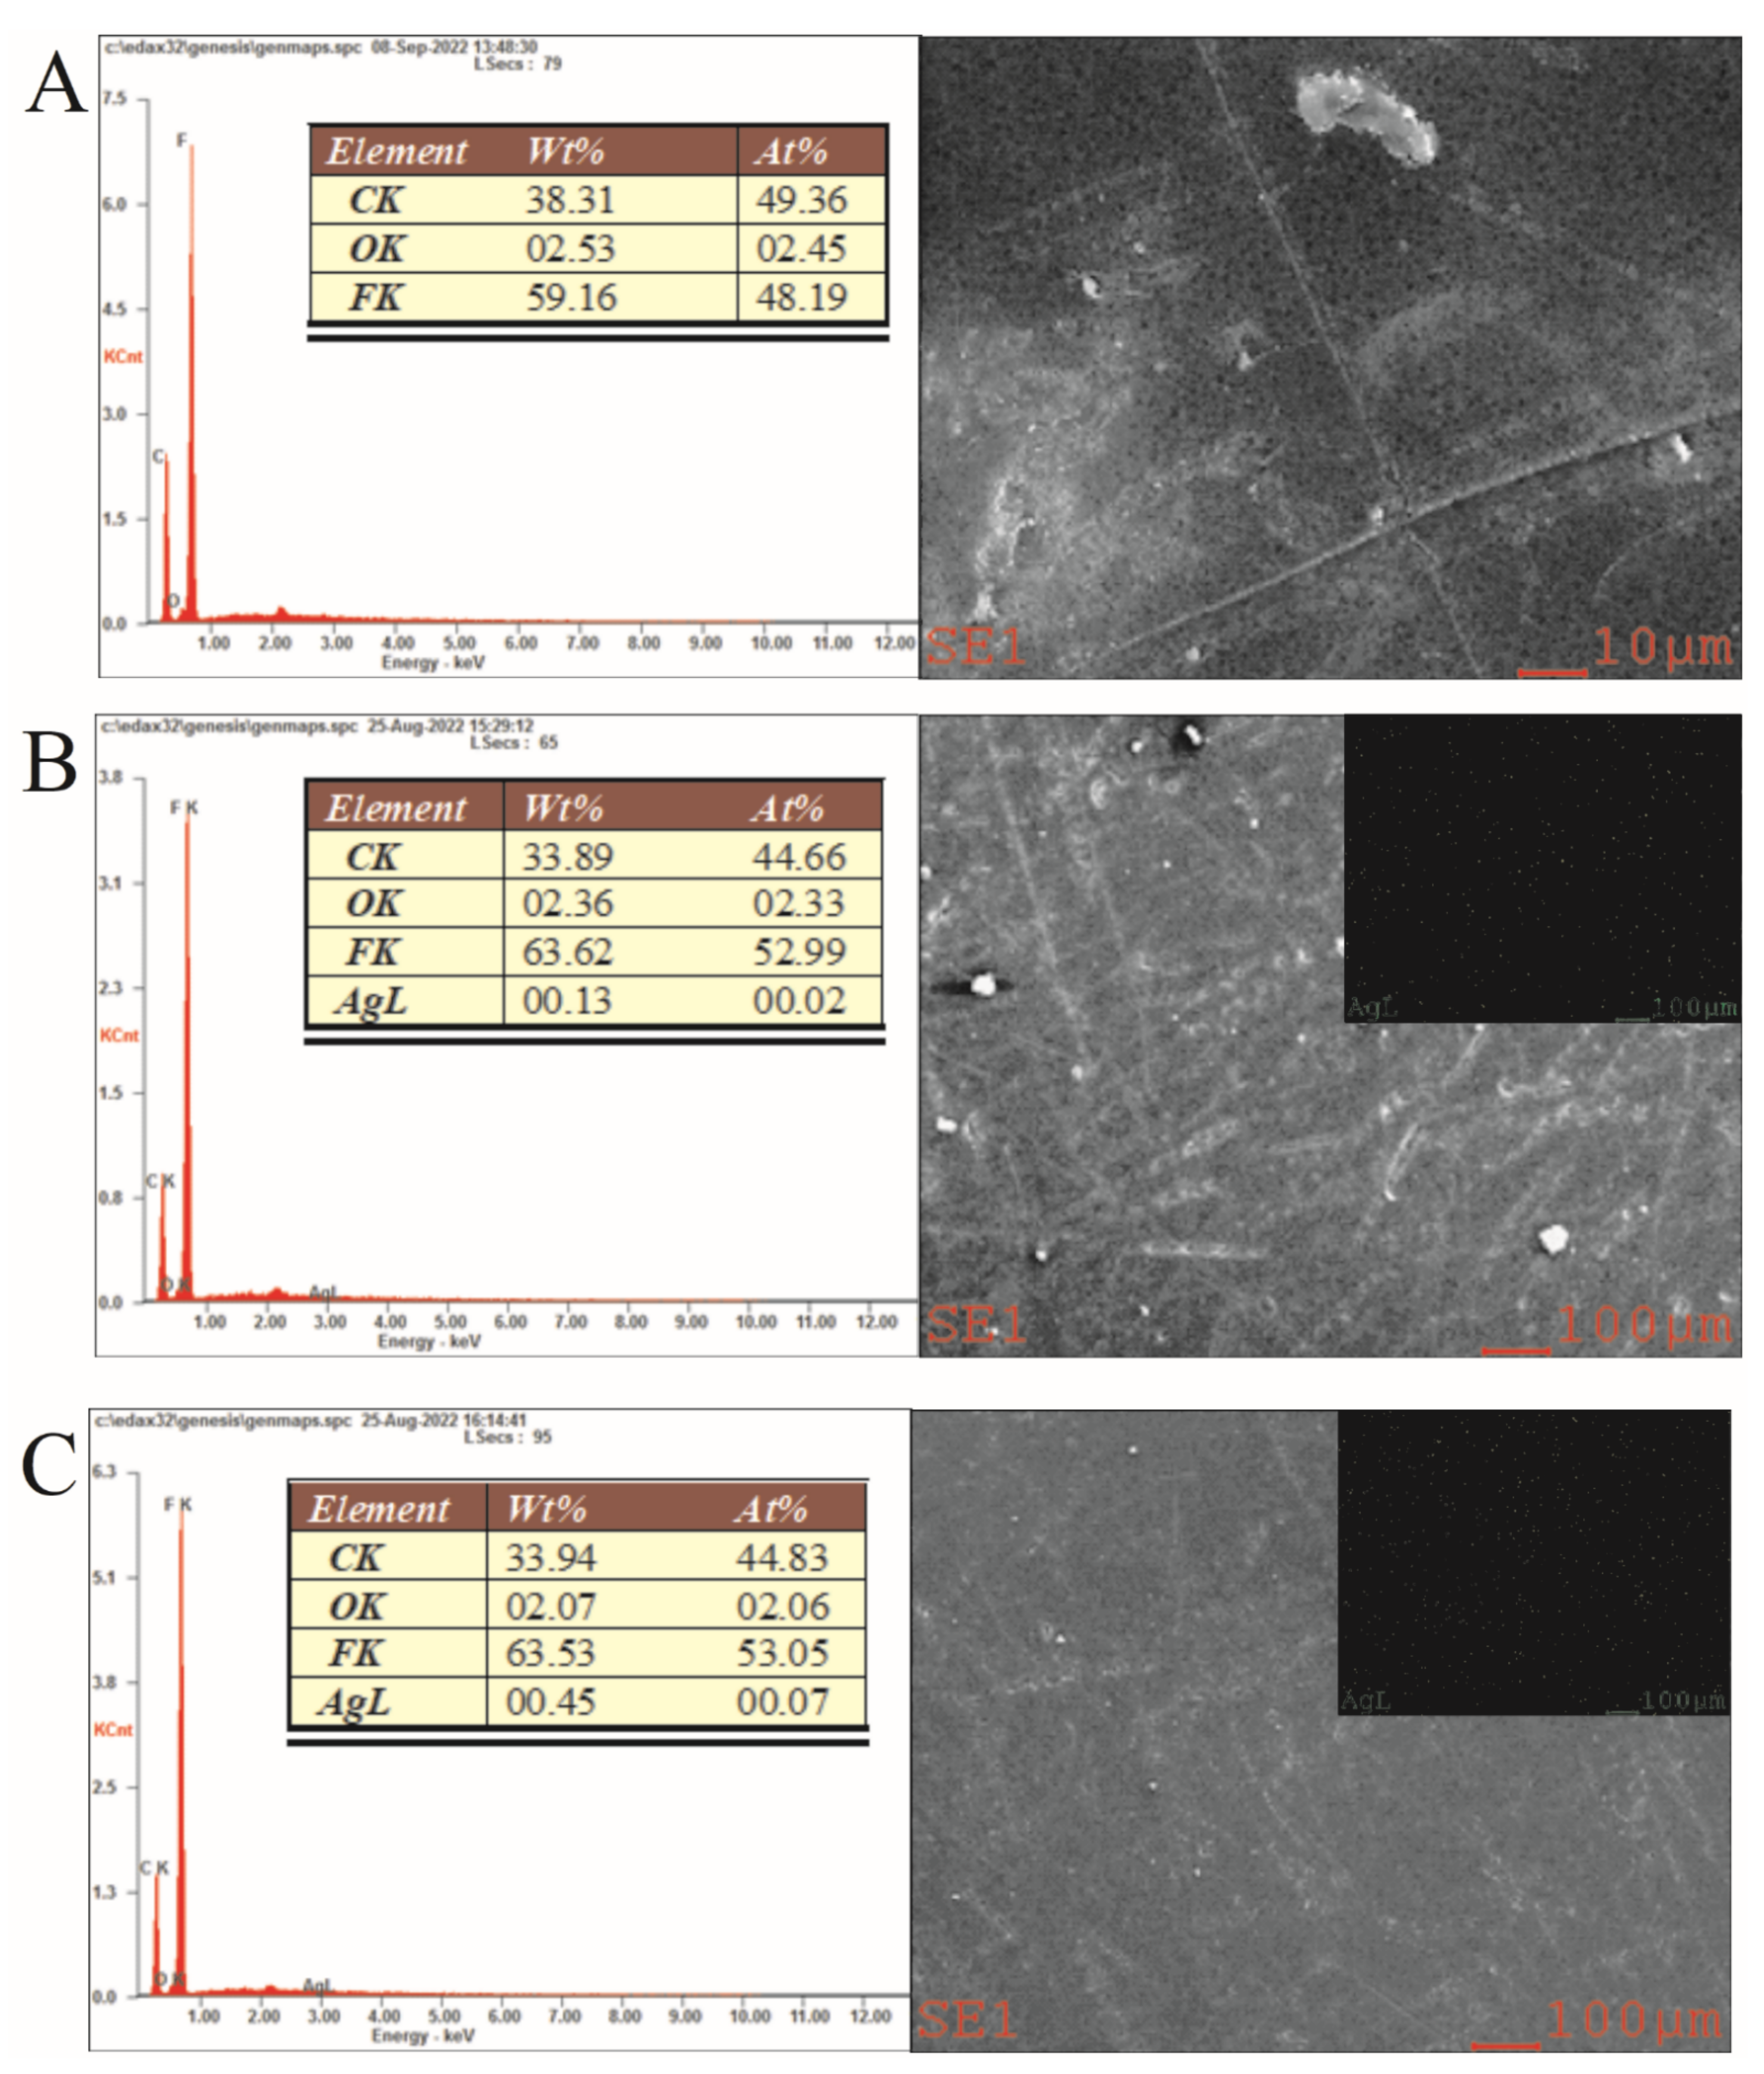
The FESEM images of surface morphology for PVDF membranes with 0, 0.06, and 0.1 wt% of Ag−GOQD are displayed in Figure 6A–C. The pure PVDF membrane (Membrane A) showed a similarly smooth surface with PVDF membranes incorporated with 0.06 and 0.1 wt% of Ag−GOQD (Membranes D and F). In addition, no apparent interfacial voids were spotted on the PVDF membranes incorporated with Ag−GOQD compared to the pure membrane, which suggested that the nanocomposite was compatible with the polymeric membrane.
Figure 6D–F shows the FESEM images of cross-sectional morphology for PVDF membranes incorporated with 0, 0.06, and 0.1 wt% of Ag−GOQD. All the membranes exhibited asymmetric structures comprising dense separation layers, finger-like porous sub-layers, and bottom sponge-like layers. There was a noticeable difference in the finger-like structures of the membranes after incorporating Ag−GOQD, except for the narrow pore structure at the top separation layer. The narrower pore structure of the Ag−GOQD-modified PVDF membrane could benefit the membrane retention capability. Membranes D and F displayed wider and longer finger-like microvoids than the pure PVDF membrane, which could be related to the higher exchange rate between NMP and water. In addition, the Ag−GOQD in the dope solution may induce chemical interactions at the Ag−GOQD and water interface. The interactions could be explained mainly by the formation of hydrogen bonding at tertiary alcohols, which encouraged the water molecules to penetrate the dope solution at a higher speed while replacing the NMP from the dope solution.
The instability of the casting solutions could encourage a faster transfer rate between solvent and non-solvent and cause the development of large pore columns in the membranes [30]. In addition, the formation of microvoids allowed a higher water permeation rate across the membrane due to the lower internal resistance by the membrane matrices. The low internal resistance could enhance the permeability of the PVDF membranes modified with Ag−GOQD.
Membrane F showed slightly narrower finger-like microvoids than Membrane D. The high loading of Ag−GOQD in the casting solution could delay the phase inversion process, resulting in the development of membranes with narrower and shorter finger-like structures and hence poor water permeability. Thermodynamic improvement played the principal role in impacting membrane pore structure by adding a certain amount of Ag−GOQD (up to 0.06 wt%) into the casting solutions. At higher loadings of Ag−GOQD (more than 0.06 wt%), the kinetic hindrance could be influential in determining the membrane pore formation during the phase inversion by restricting the diffusivities of additives in the dope solution.
An EDX analysis was applied to evaluate the embedment of the Ag−GOQD nanocomposites within the PVDF membrane matrices. The EDX elemental analysis of the pure PVDF membrane and Ag−GOQD-incorporated PVDF membranes is displayed in Figure 7. Membranes D and F showed significant characteristic peaks of Ag. The characteristic peaks indicated the successful blending of the nanocomposites into the membrane. Additionally, the intensity of Ag peaks in the EDX spectrum increased with the loading of Ag−GOQD.
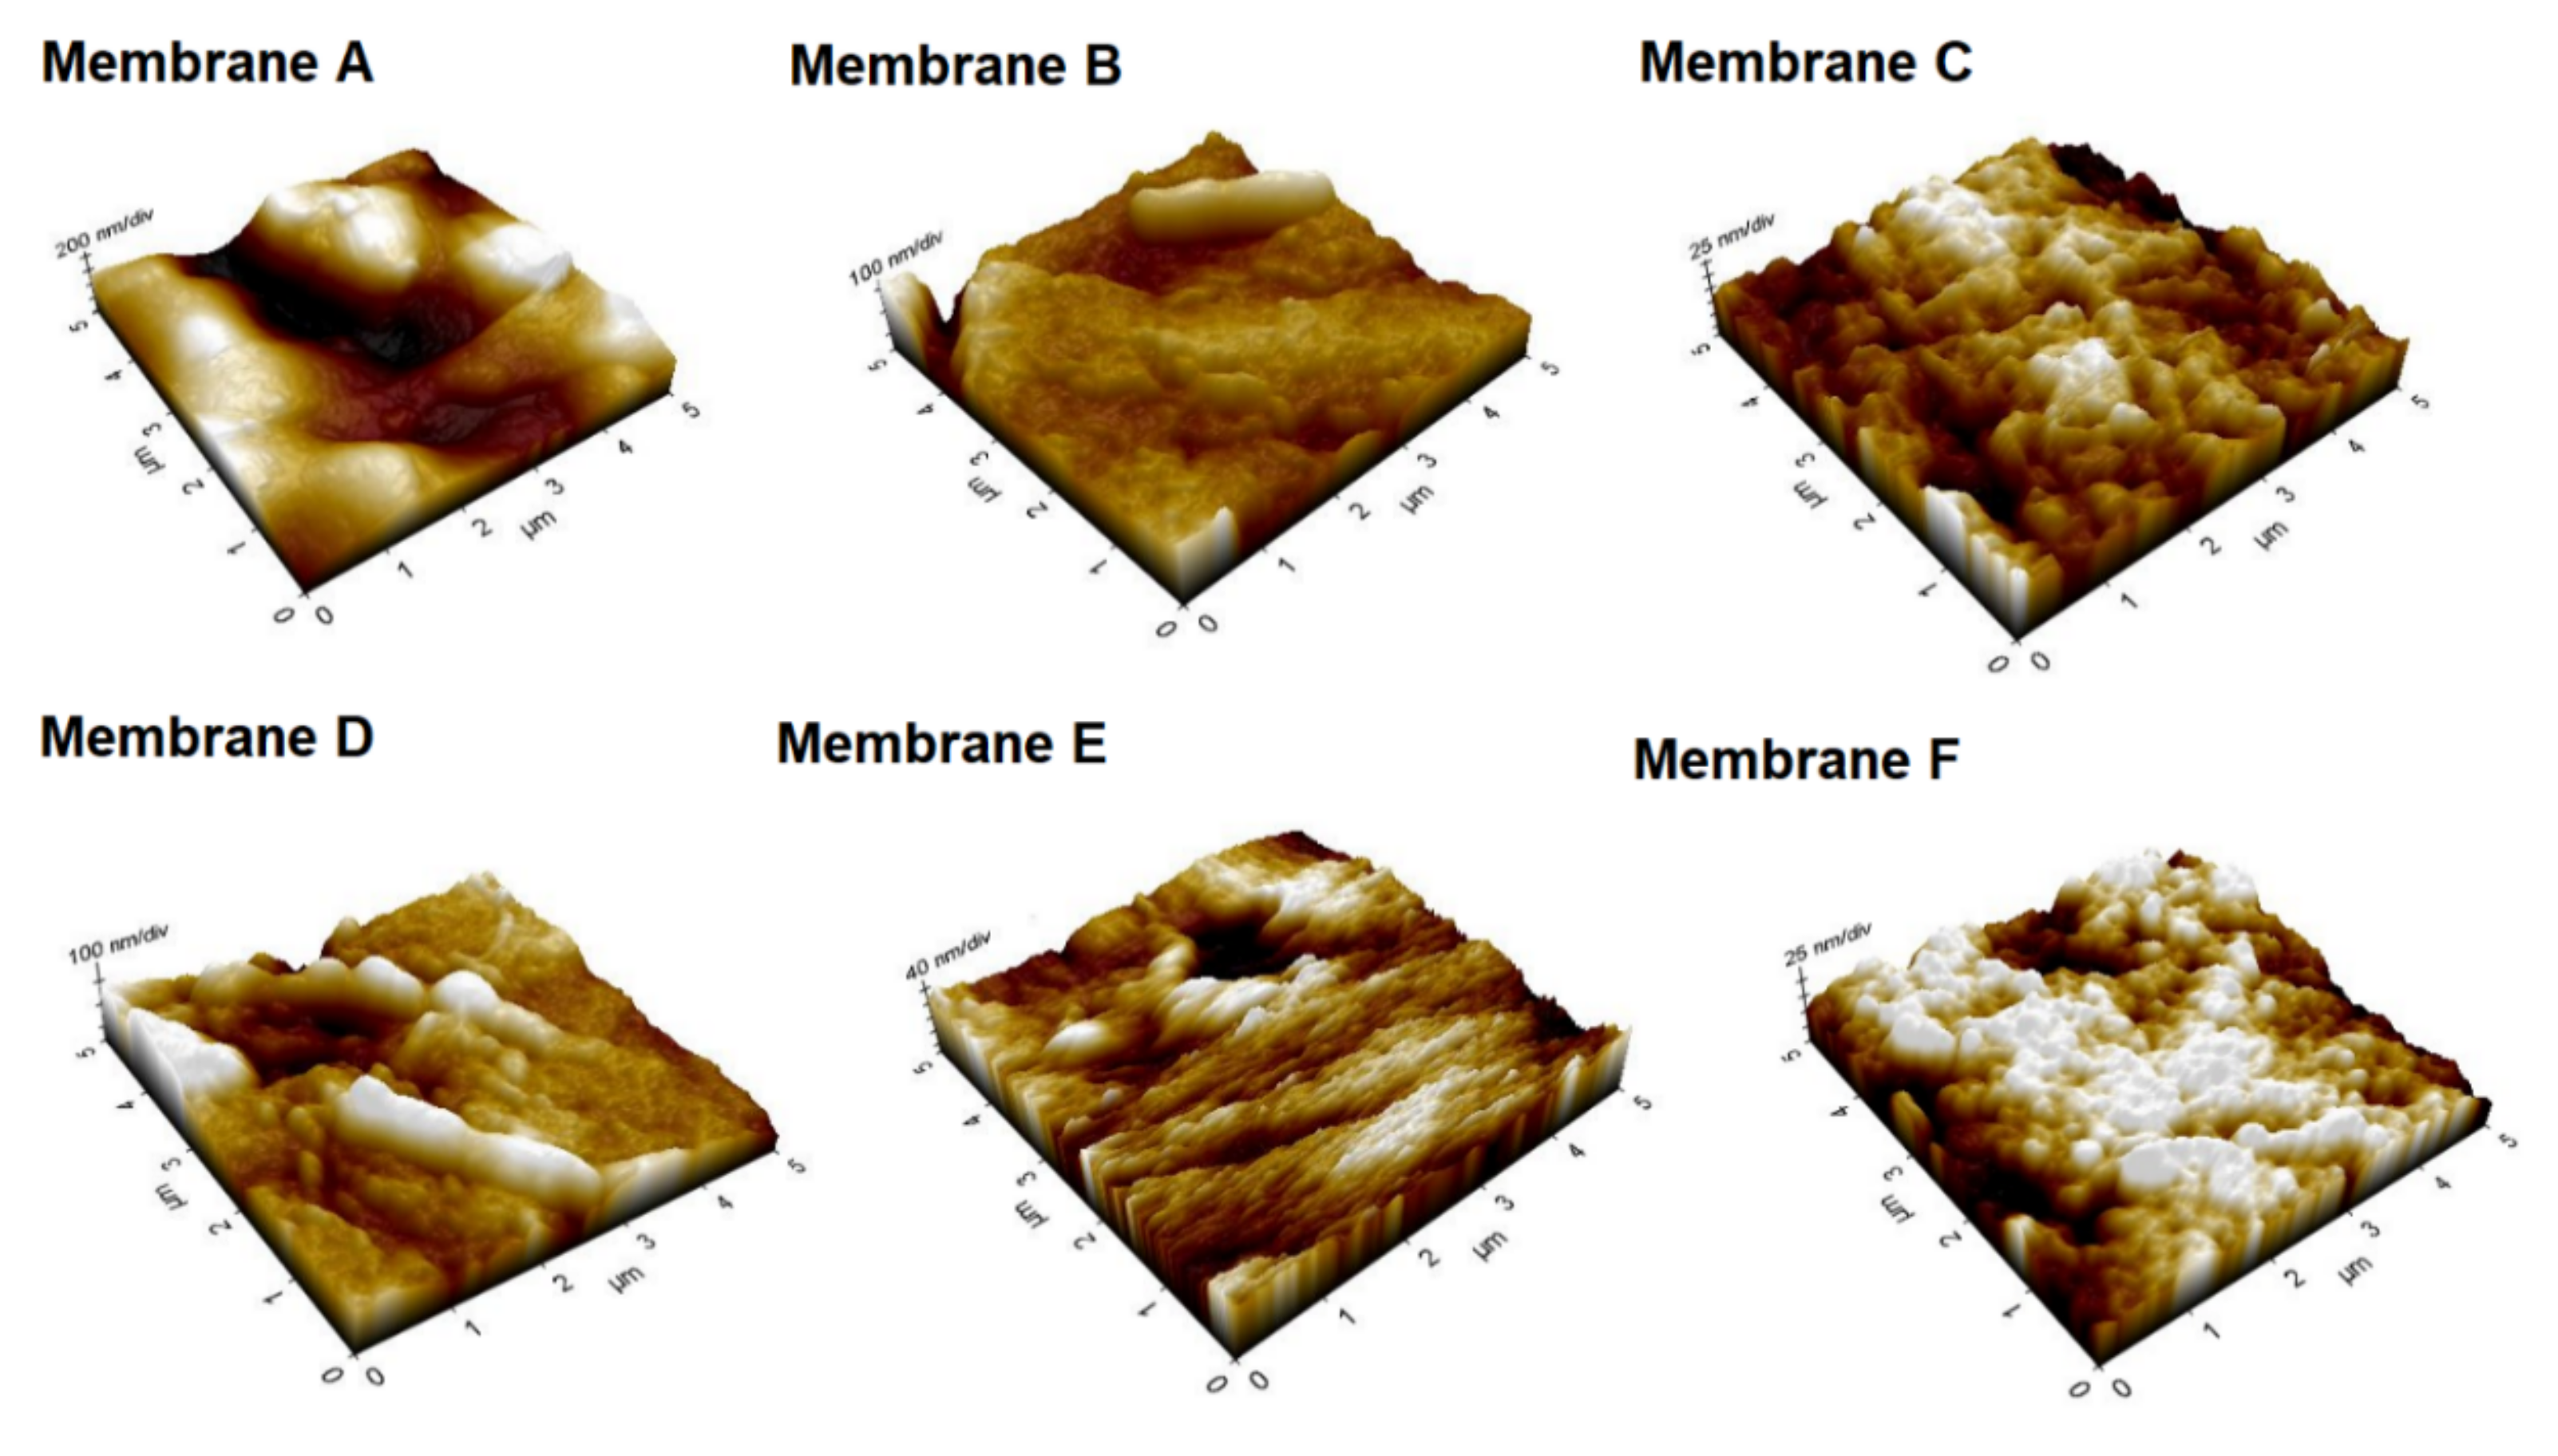
An AFM analysis was conducted to analyze the impact of Ag−GOQD embedment on the surface roughness of the PVDF membranes. The surface roughness is critical in assessing the membranes’ fouling resistance. The three-dimensional AFM figures shown in Figure 8 showed the surface morphology of the membranes. The pure PVDF membrane (Membrane A) showed significant valleys and peaks (indicated by the darker and bright regions, respectively) and had a rougher surface than the PVDF membranes incorporated with nanocomposites. According to Table 2, Membrane F displayed the lowest values in terms of the mean surface roughness (Sa), root mean square surface roughness (Sq), and the difference between the five highest peaks and lowest valleys (Sz) among the six PVDF membranes. The results proved that the PVDF membranes incorporated with nanocomposites showed smoother surfaces than the pure PVDF membrane. When the concentration of Ag−GOQD elevated from 0 to 0.10 wt%, Sa, Sq, and Sz decreased from 123.80, 148.10, and 870.90 nm to 13.10, 16.60, and 120.90 nm, respectively. The introduction of nanocomposites in the dope solution could increase the membranes’ smoothness due to the hydrophilic property of nanocomposites, which could induce a high exchange rate between water and NMP during the phase inversion. However, the membrane became slightly rougher when 0.06 wt% of nanocomposites were incorporated. Sa, Sq, and Sz for Membrane D were 32.90, 45.20, and 342.10 nm, respectively, even slightly higher than those of membranes incorporated with lower Ag−GOQD (0.02 and 0.04 wt%) and higher loadings of Ag−GOQD (0.08 and 0.1 wt%). The aggregation of nanocomposites could cause defects on the membrane surface [31], increasing the surface roughness. The agglomerated nanocomposites could hinder the counter exchange between water and NMP. The membrane with a smooth surface could have a better anti-fouling property where the foulants could be weakly attached to the membrane surface [32]. A rough membrane surface could cause the accumulation of foulants within the valleys of the membranes. Hence, the membrane with a rough surface is more prone to fouling during a filtration process. The surface roughness of the membranes, which can impact the interactions between the foulants and the membrane surfaces, also plays a dominant part in the magnitude of bacterial adhesion [33]. The enhanced membrane surface smoothness may positively affect the foulant rejection, anti-fouling, and anti-biofouling capabilities of the membranes.
The membrane surface hydrophilicity is essential in impacting the membrane’s permeability and anti-fouling property. As shown in Table 3, the surface hydrophilicity of the pure PVDF and Ag−GOQD-incorporated PVDF membranes was studied based on the contact angle between the water droplet and membrane surface. The contact angle of the pure PVDF membrane (Membrane A) obtained was greater than that of the PVDF membranes incorporated with 0.02–0.1 wt% of Ag−GOQD (Membranes B, C, D, E, and F). The contact angle reduced from 79.06 ± 4.53 to 53.60 ± 4.75 ° when the nanocomposite loading increased from 0 to 0.10 wt%. The contact angle of the pure PVDF membrane was 79.06 ± 4.53°, indicating the hydrophobic nature of this type of polymeric membrane. When nanocomposites were blended with PVDF, the oxygenated functional groups on the nanocomposites’ surfaces interact with the water molecules effortlessly via hydrogen bonding, thus improving the membrane hydrophilicity. The contact angle of the membrane incorporated with 0.06 wt% of Ag−GOQD was 73.06 ± 1.40°, slightly higher than those incorporated with a lower loading of Ag−GOQD (0.04 wt%) and higher loadings of Ag−GOQD (0.08 and 0.1 wt%). The results for the contact angle of 0.06 wt% Ag−GOQD-incorporated PVDF membrane was in line with the data from the membrane surface roughness study (surface roughness of 0.06 wt% Ag−GOQD-incorporated PVDF membrane). The agglomeration of nanocomposites might block the membrane pores due to the addition of Ag−GOQD at 0.06 wt% loading, which decreased the number of hydrophilic groups exposed on the membrane surface [34]. The expanded dimension of agglomerated nanocomposites played a significant factor in causing the contact angle to become higher. However, all of the Ag−GOQD-modified PVDF membranes displayed enhanced hydrophilicity of the membrane surfaces, which may benefit the permeability and anti-fouling performances of the membranes.

3.3. Performance of Pure PVDF Membrane and Ag−GOQD-Incorporated PVDF Membranes

3.3.1. Permeability and Rejection Capability of the PVDF Membranes

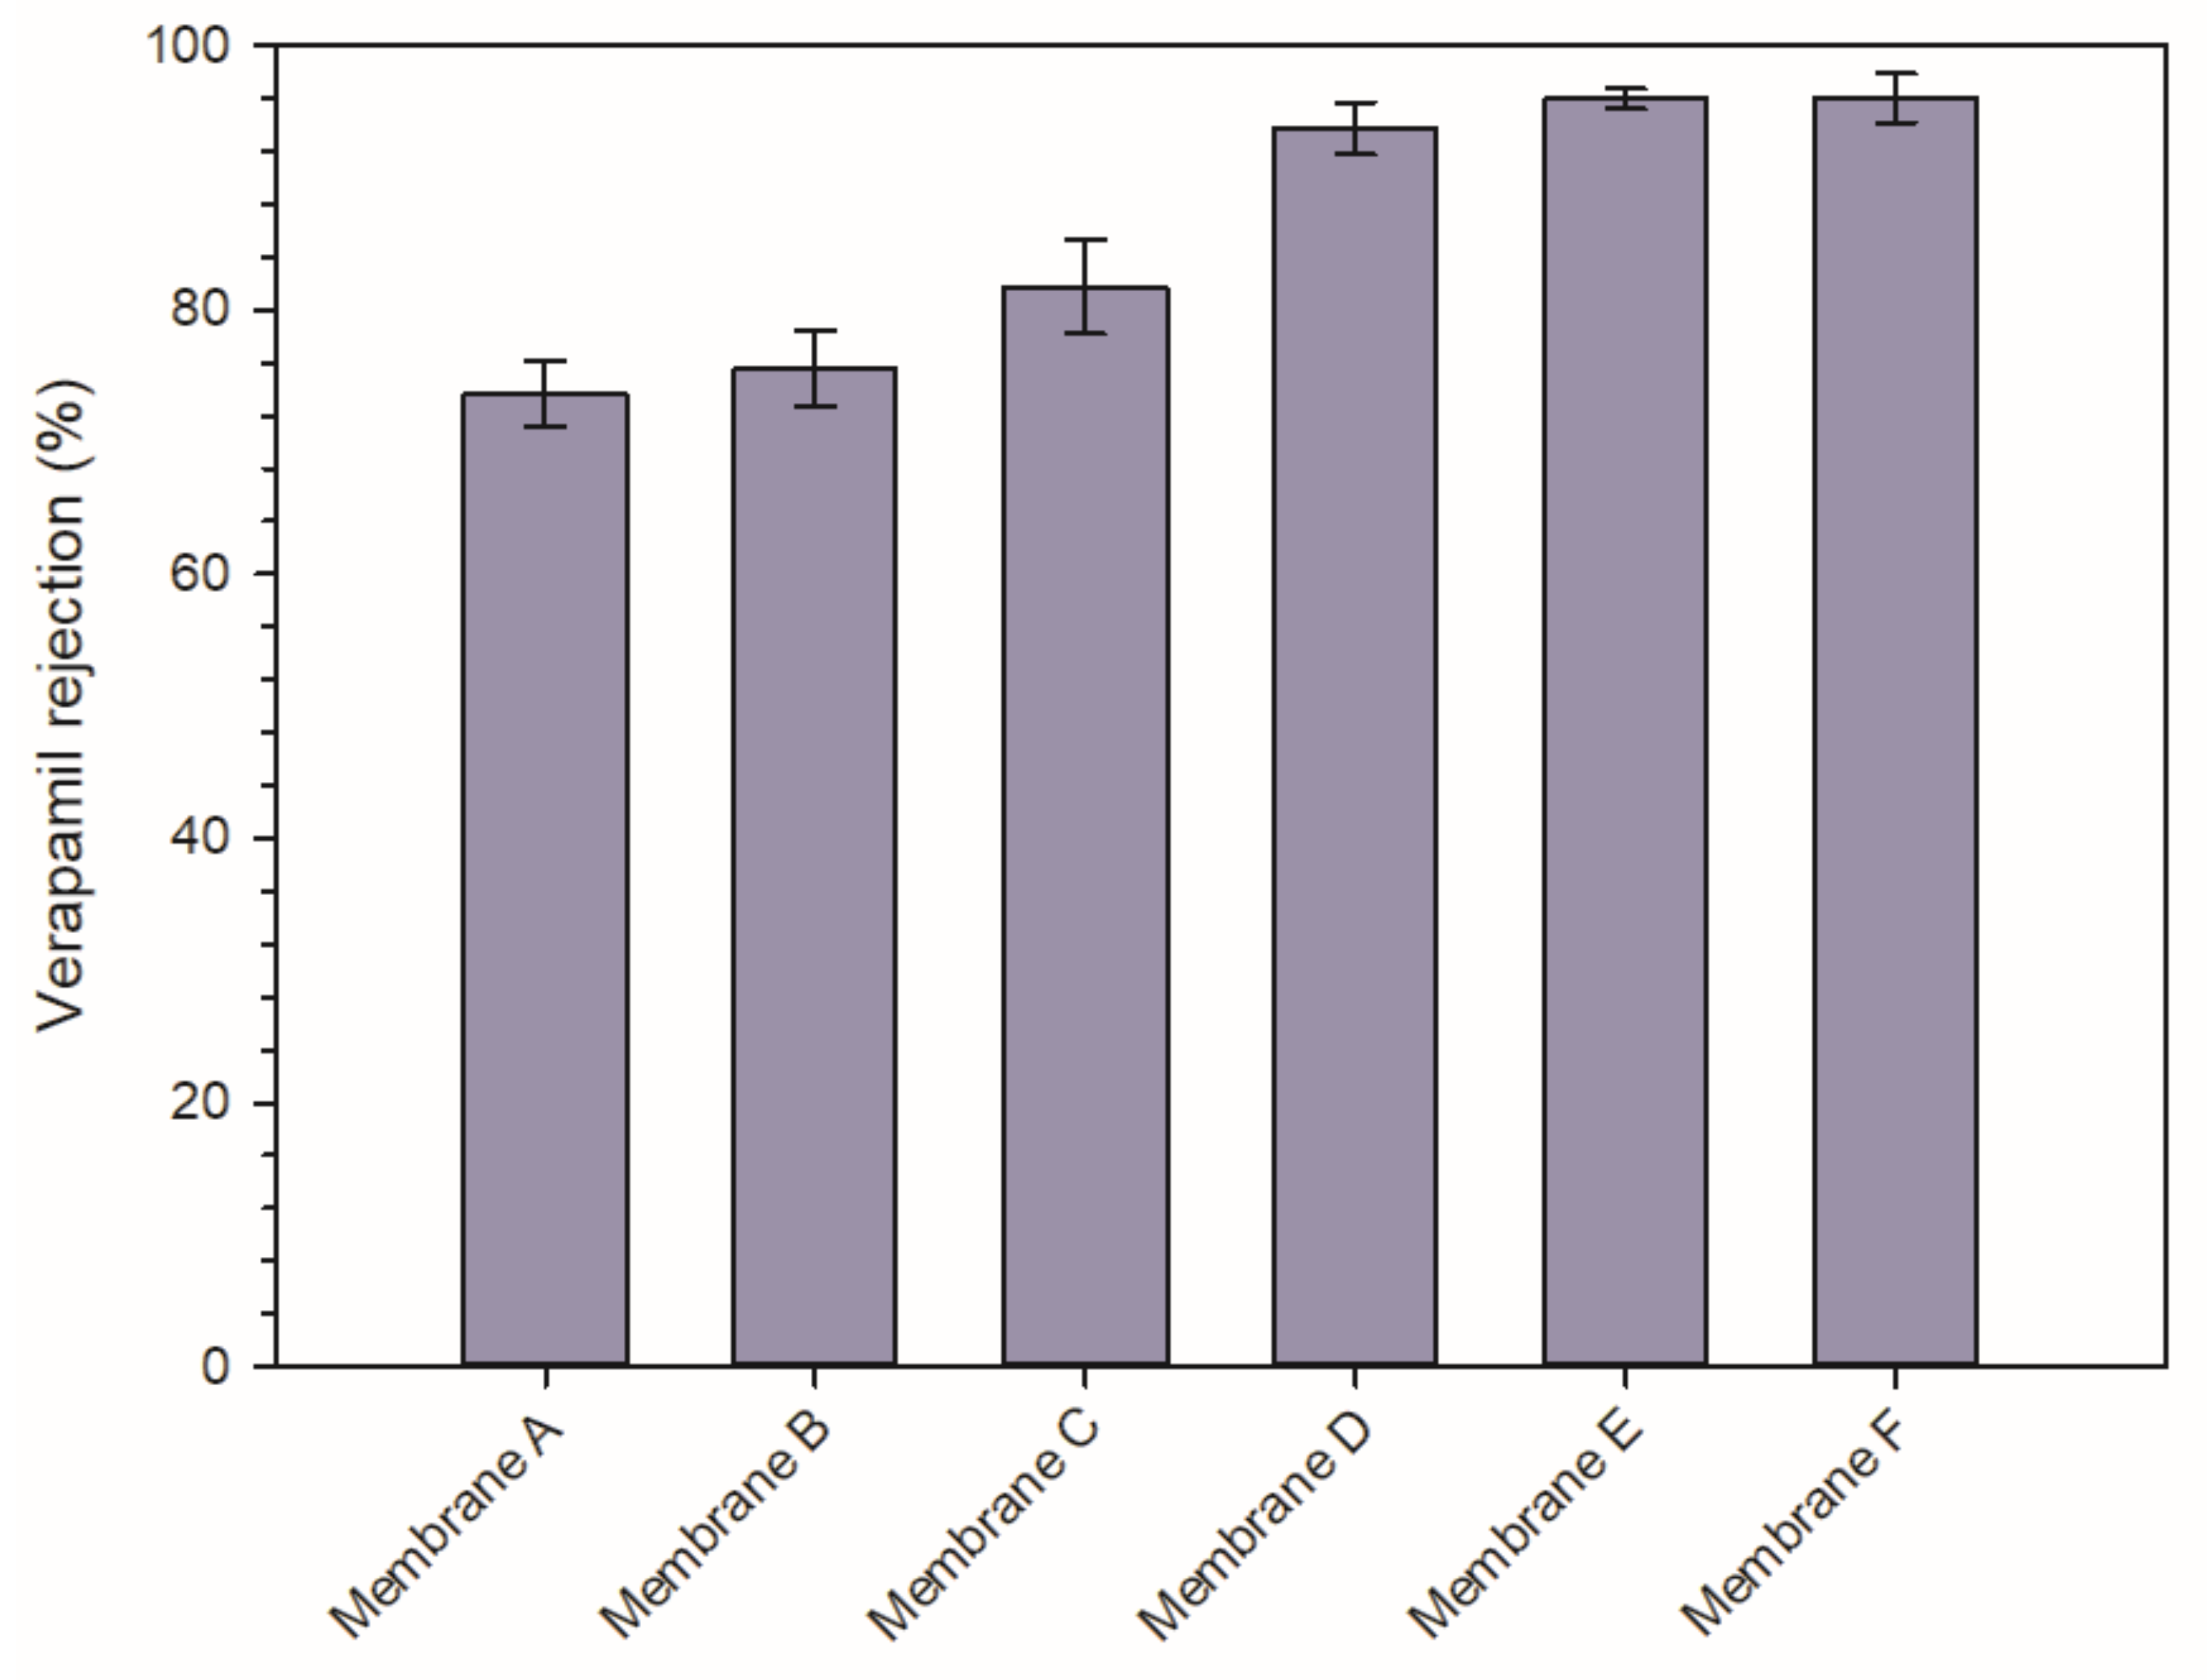
The effects of Ag−GOQD incorporation on the membrane permeability and verapamil rejection capability were studied and depicted in Table 4 and Figure 9, respectively. The pure water flux of the PVDF membrane (Membrane A) was 18.90 ± 0.81 LMH. The incorporation of Ag−GOQD into the PVDF membranes led to a considerable increase in membrane permeability, 25.89 ± 3.75 LMH for Membrane B, 31.64 ± 0.76 LMH for Membrane C, 64.52 ± 1.53 LMH for Membrane D, 21.37± 2.44 LMH for Membrane E, and 19.73 ± 2.16 LMH for Membrane F. The pure water permeability results can be related to the changes in membrane hydrophilicity. The enhanced hydrophilicity of the membranes could attract more water molecules and increase the water transfer rate across the membrane. The hydrophilic groups of Ag−GOQD, such as OH groups, greatly increased the affinity of water toward the membrane surface, hence increasing the membrane permeability.
When the concentration of Ag−GOQD elevated from 0 to 0.10 wt%, the rejection for verapamil increased from 73.66 ± 2.45% to 96.04 ± 1.82%. The high rejection capabilities of the Ag−GOQD-incorporated PVDF membranes could be explained by the improved hydrophilicity and cross-sectional morphology of the membranes. As verapamil is highly hydrophobic, a hydration layer that prevents verapamil molecules from passing through and in close contact with the membrane surface can be produced by the firmly attached water molecules on the membrane surface. Besides, the enhanced rejection capability of the Ag−GOQD-incorporated PVDF membranes toward the verapamil molecules could be explained by narrower pores near the membrane separation layers, which is in accordance with the cross-sectional morphology analysis, as previously discussed.

3.3.2. Anti-Fouling Performance

Fouling is an imperative parameter in the practical use of the membranes, which leads to a reduction in flux and an increase in operating expenditure. The anti-fouling performances of the membranes were analyzed using a verapamil solution. Before the flux measurements, all the PVDF membranes were compacted for 30 min to eliminate the effect of membrane compaction.
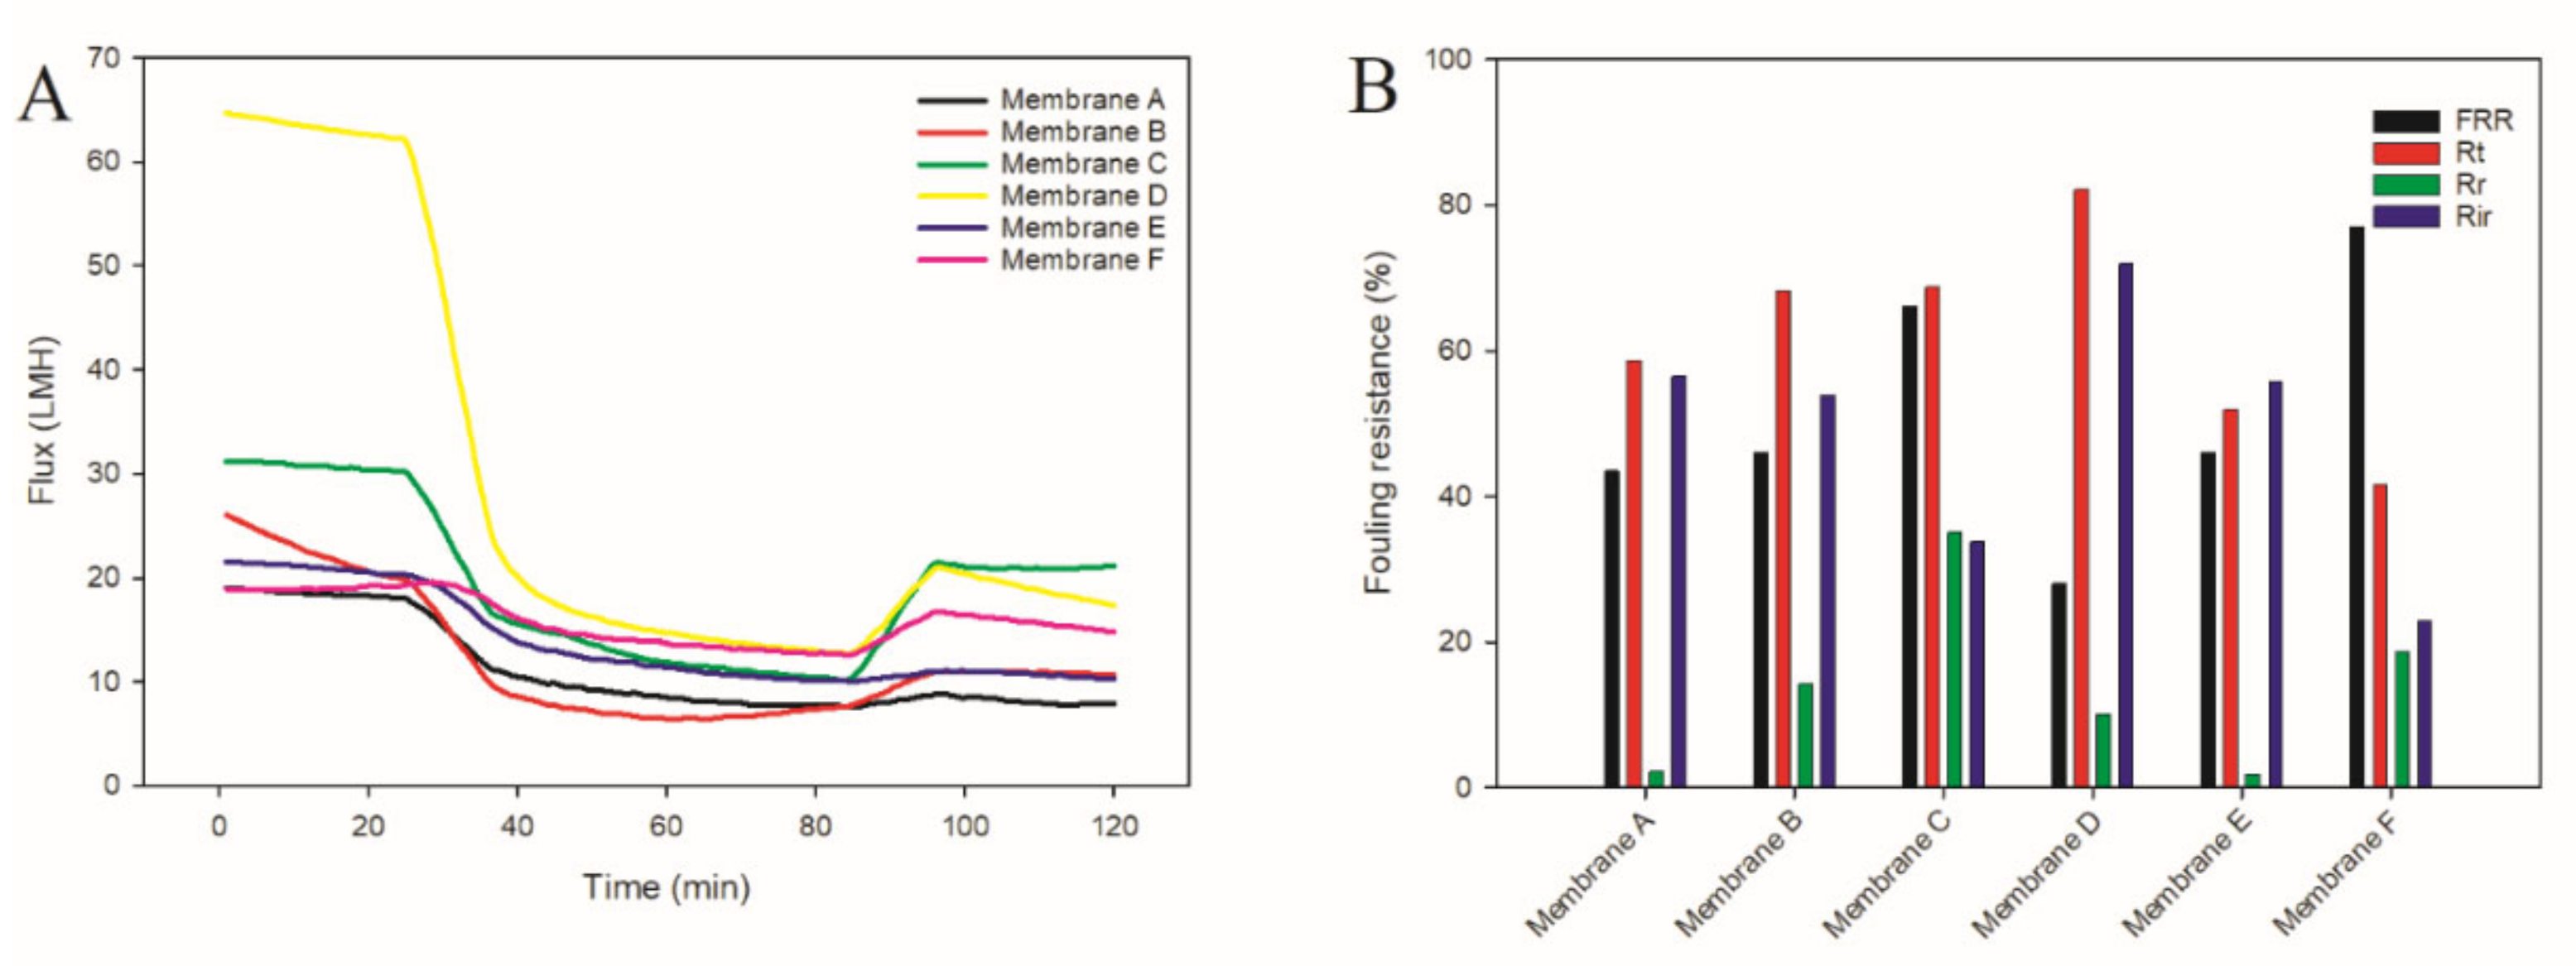
The flux of the membranes as a function of time is illustrated in Figure 10A. A significant decline in flux was observed for all the PVDF membranes when the verapamil solution was used as the feed solution. Membrane D exhibited the highest pure water flux and most severe flux loss of 71.98%. High water permeation and severe flux loss during the verapamil rejection test could be associated with the continuous pore structure from the top separation layer to the bottom support layer, as confirmed by the analysis of the Membrane D cross-sectional morphology. The continuous pore structure could minimize the internal resistance to the verapamil permeation through the membrane. However, the high permeation of the solution across Membrane D also led to the increased accumulation of verapamil molecules trapped within the membrane pores, causing severe flux loss to the membrane.
The low flux recovery for Membrane D could be described by the formation of a narrower pore structure on the membrane separation layer [30] and the blockages of the pores [35]. Besides, the surface roughness of Membrane D was slightly higher than other Ag−GOQD-modified membranes, possibly leading to lower water flux recovery owing to the trapped verapamil molecules. Hence, the verapamil molecules attached to the membrane surface or penetrated the membrane pores could not be removed by simple rinsing, leading to the decreased water recovery rate upon the addition of the high loading of nanocomposites at 0.06 wt%.
Other than Membrane D, Membranes B, C, E, and F showed slightly better water restoration rates than the pure PVDF membrane (Membrane A), indicating that the hydrophobic interactions between the surface of the pure PVDF membrane and the verapamil molecules were stronger than those between verapamil molecules and surfaces of Membranes B, C, E, and F. The strong hydrophobic interactions between verapamil molecules and the surface of the pure PVDF membrane could be caused by the absence of Ag−GOQD, which led to a high surface hydrophobicity, as confirmed by the contact angle results. Besides, the high surface roughness of the pure PVDF membrane could cause a high deposition rate of verapamil molecules on the membrane surface, causing a more severe fouling and lower water flux restoration. Membrane F showed the lowest flux loss among all the membranes, which was in line with its smooth and hydrophilic membrane surface, as verified by AFM and contact angle results.
The anti-fouling performances of the membranes were analyzed and displayed in Figure 10B. The flux recovery ratio (FRR) is a crucial factor when analyzing the anti-fouling properties of the membranes. When the concentration of Ag−GOQD raised from 0 to 0.10 wt%, the FRR of the membranes elevated from 43.49 to 77.07%. As a result, some verapamil molecules were loosely attached to the membrane surface, which could be removed by simple rinsing. Conversely, the FRR of the 0.06 wt% Ag−GOQD-incorporated membrane was lower than that of the pure PVDF membrane (Membrane A), which might be caused by the high solution flux for Membrane D. The high solution flux in Membrane D may cause more verapamil molecules to penetrate Membrane D, leading to a higher trapping rate of the verapamil molecules in the narrowed pores. The data were in line with the flux loss study for Membrane D, as discussed earlier.
The anti-fouling performances of the membranes were also assessed in terms of Rt, Rr, and Rir. The water flux decline caused by the verapamil molecules is referred to as reversible fouling (Rr) when the rinsing process can recover the flux. On the other hand, the verapamil molecules could cause irreversible fouling (Rir) when blocked within the membrane pores or firmly attached to the membrane surfaces, leading to a loss in the membrane flux after water rinsing.
The pure PVDF membrane (Membrane A) showed Rir of 56.51%, which was higher than the modified membranes (Membranes B, C, E, and F) owing to the strong affinity of verapamil molecules on the pure PVDF membrane surface. Among all the membranes, Membrane D showed the highest Rir of 71.97%, while Membrane F exhibited the least Rir of 22.93%. Based on the earlier discussion, Membrane D was severely fouled owing to the high solution flux and slightly rough membrane surface, which could cause a high accumulation of trapped verapamil molecules within the membrane pores and on the membrane surface. Those verapamil molecules trapped within the narrow pores of Membrane D could not be removed through water rinsing.
The uniform dispersion of Ag−GOQD in PVDF membranes (Membranes B, C, E, and F) could form hydrogen bonds with water molecules and create hydration layers on the membrane surfaces, lessening the affinity of verapamil molecules on PVDF membrane surfaces and minimizing the penetration of verapamil to the membrane pores. Hence, Rir was decreased and observed in modified PVDF membranes with good dispersions of Ag−GOQD. The good dispersion of the Ag−GOQDs could enhance the hydration properties of the PVDF membrane surfaces while reducing the membrane irreversible fouling tendency in the presence of verapamil molecules.

3.3.3. Antibacterial Activity of Pure PVDF and Ag−GOQD-Incorporated PVDF Membranes

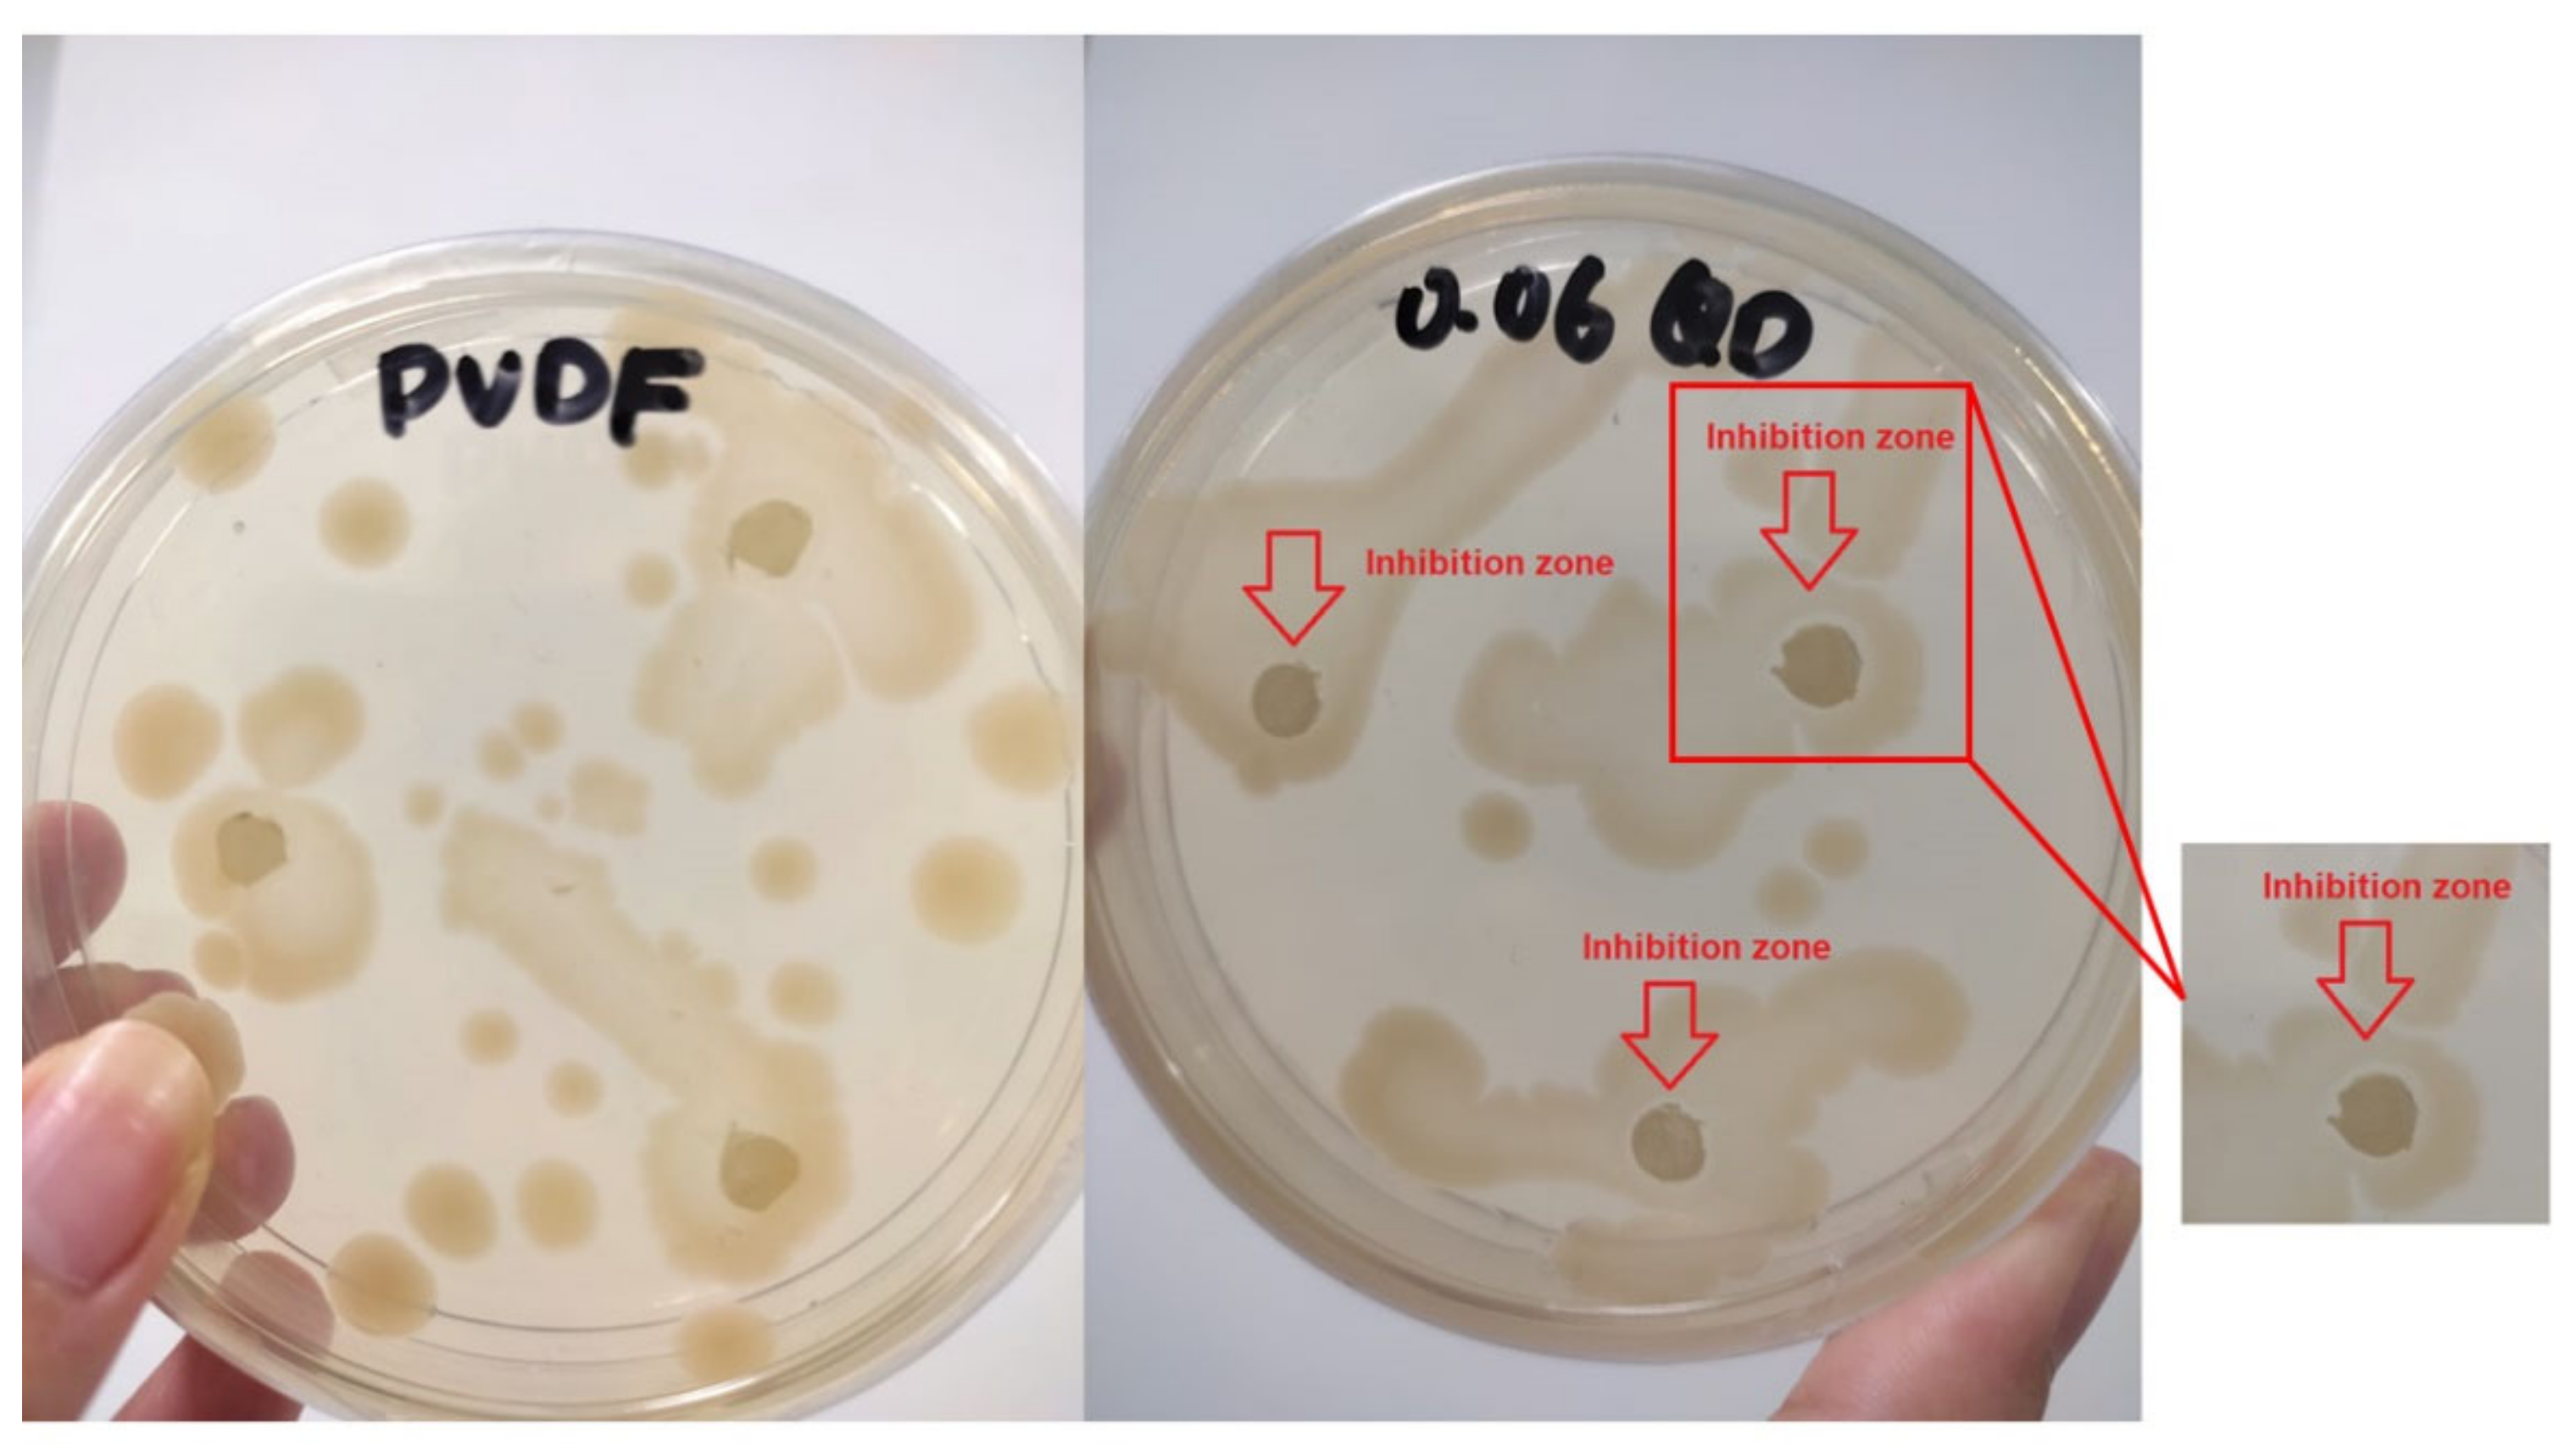
The antibacterial test is vital in determining the durability of a membrane in resisting the biofouling phenomenon during a filtration process. The antibacterial performances of the membranes were analyzed using a disc diffusion test. As shown in Figure 11, clear inhibition zones were spotted in the agar plate placing Membrane D. In the opposite, no clear inhibition zone was spotted and bacteria were observed to grow around the membrane in the agar plate placing Membrane A. The Ag−GOQD in this study showed a bactericidal effect, which caused the E. coli to grow at a distance away from the membrane containing the nanocomposites. The bactericidal effect of the Ag−GOQD-modified membrane toward the E.coli could be explained by several reasons. Firstly, an electrostatic repulsion may occur due to the interactions between the negatively charged carboxylic groups of GOQD and the negatively charged bacteria, leading to no bacteria growth around the membrane. The active edges of GOQD exposure of the membrane surface may cause oxidative stress, meaning it is difficult for the bacteria to survive near the membrane. Besides, the Ag nanoparticles could destroy the biofouling layer structure and decrease the attachment of biofoulants on the membrane. The antibacterial effect of Ag nanoparticles relies on the release of Ag ions from Ag nanoparticle surfaces, followed by the contact of Ag ions with the thiol groups of proteins, which causes the disruption in DNA replication.

4. Conclusions

For the first time, this current study has evaluated the ability of using a modified PVDF membrane to remove verapamil molecules from the aqueous solution. Besides, this study also has demonstrated the great potential of incorporating Ag−GOQD into PVDF membranes to improve the membranes’ surface characteristics, solvent permeabilities, and verapamil removal capabilities. The sustainable source of raw materials from the empty fruit bunches has been successfully converted into GOQDs for Ag decoration to ensure an even distribution of the Ag for enhanced antibacterial properties. The addition of Ag−GOQD (0.02 to 0.10 wt%) enhanced the hydrophilicity and smoothness of the PVDF membrane surface. The improved membrane surface hydrophilicity in the Ag−GOQD-modified PVDF membrane allows for a faster water transfer rate across the membrane while minimizing the attachment of verapamil molecules to the membrane surface. The increased smoothness of the Ag−GOQD-modified PVDF membrane surface reduces the accumulation of verapamil molecules on the membrane surface, causing the rejection capability and anti-fouling performance to increase. Membrane D showed the highest pure water flux (64.52 LMH) among all the membranes, which is associated with possession of longer and wider finger-like structures. Membrane F (0.10 wt% of Ag−GOQD) showed the highest verapamil rejection of 96.04% and the lowest Rir of 22.93%, showing the enhanced rejection capability and anti-fouling capability of the membrane because of the incorporation of the high loading of nanocomposites. The antibacterial activity of the membranes has been confirmed through the disc diffusion test. The membranes incorporated with Ag−GOQD showed good water permeabilities, excellent verapamil rejections, and antibacterial properties in this study. The characteristics of the Ag−GOQD-modified PVDF membranes could be helpful for pharmaceutical wastewater treatment and water purification. However, the leaching of nanocomposites from the PVDF membranes and quantifying the antibacterial ability of the nanocomposites blended membrane could be studied more explicitly in future studies.

Author Contributions

W.Y.T., L.Y.N., C.Y.N., E.M., Y.P.L. and L.C.S. designed the study, conducted the experiments, analyzed the data, wrote the manuscript, and permitted the manuscript as displayed. All authors have read and agreed to the published version of the manuscript.

Funding

This work was supported by Universiti Tunku Abdul Rahman [IPSR/RMC/UTARRF/2020-C1/N03]; and UCSI University [REIG-FETBE-2020/066].

Institutional Review Board Statement

Not applicable.

Informed Consent Statement

Not applicable.

Data Availability Statement

The data shown in the current study are available upon request from the corresponding author.

Conflicts of Interest

The authors declare no conflict of interest.

References

  1. Kleywegt, S.; Payne, M.; Ng, F.; Fletcher, T. Environmental loadings of Active Pharmaceutical Ingredients from manufacturing facilities in Canada. Sci. Total Environ. 2019, 646, 257–264. [Google Scholar] [CrossRef]
  2. Santos, L.H.M.L.M.; Gros, M.; Rodriguez-Mozaz, S.; Delerue-Matos, C.; Pena, A.; Barceló, D.; Montenegro, M.C.B.S.M. Contribution of hospital effluents to the load of pharmaceuticals in urban wastewaters: Identification of ecologically relevant pharmaceuticals. Sci. Total Environ. 2013, 461–462, 302–316. [Google Scholar] [CrossRef] [PubMed] [Green Version]
  3. Berghmans, S.; Butler, P.; Goldsmith, P.; Waldron, G.; Gardner, I.; Golder, Z.; Richards, F.M.; Kimber, G.; Roach, A.; Alderton, W.; et al. Zebrafish based assays for the assessment of cardiac, visual and gut function—Potential safety screens for early drug discovery. J. Pharmacol. Toxicol. Methods 2008, 58, 59–68. [Google Scholar] [CrossRef] [PubMed]
  4. Li, Z.-H.; Li, P.; Randak, T. Ecotoxocological effects of short-term exposure to a human pharmaceutical Verapamil in juvenile rainbow trout (Oncorhynchus mykiss). Comp. Biochem. Physiol. Part C Toxicol. Pharmacol. 2010, 152, 385–391. [Google Scholar] [CrossRef] [PubMed]
  5. Steinbach, C.; Fedorova, G.; Prokes, M.; Grabicova, K.; Machova, J.; Grabic, R.; Valentova, O.; Kroupova, H.K. Toxic effects, bioconcentration and depuration of verapamil in the early life stages of common carp (Cyprinus carpio L.). Sci. Total Environ. 2013, 461–462, 198–206. [Google Scholar] [CrossRef] [PubMed]
  6. Semaan, F.É.; Der, É.; Cavalheiro, É.; Brett, C. Electrochemical Behavior of Verapamil at Graphite–Polyurethane Composite Electrodes: Determination of Release Profiles in Pharmaceutical Samples. Anal. Lett. 2009, 42, 1119–1135. [Google Scholar] [CrossRef]
  7. Zhu, B.; Zonja, B.; Gonzalez, O.; Sans, C.; Pérez, S.; Barceló, D.; Esplugas, S.; Xu, K.; Qiang, Z. Degradation kinetics and pathways of three calcium channel blockers under UV irradiation. Water Res. 2015, 86, 9–16. [Google Scholar] [CrossRef] [PubMed]
  8. Krishna, S.; Ceriani, E.; Marotta, E.; Giardina, A.; Špatenka, P.; Paradisi, C. Products and mechanism of verapamil removal in water by air non-thermal plasma treatment. Chem. Eng. J. 2016, 292, 35–41. [Google Scholar] [CrossRef]
  9. Kovalova, L.; Siegrist, H.; von Gunten, U.; Eugster, J.; Hagenbuch, M.; Wittmer, A.; Moser, R.; McArdell, C.S. Elimination of Micropollutants during Post-Treatment of Hospital Wastewater with Powdered Activated Carbon, Ozone, and UV. Environ. Sci. Technol. 2013, 47, 7899–7908. [Google Scholar] [CrossRef] [PubMed] [Green Version]
  10. Subedi, B.; Balakrishna, K.; Sinha, R.K.; Yamashita, N.; Balasubramanian, V.G.; Kannan, K. Mass loading and removal of pharmaceuticals and personal care products, including psychoactive and illicit drugs and artificial sweeteners, in five sewage treatment plants in India. J. Environ. Chem. Eng. 2015, 3, 2882–2891. [Google Scholar] [CrossRef]
  11. Mahmoudi, E.; Ang, W.L.; Ng, C.Y.; Ng, L.Y.; Mohammad, A.W.; Benamor, A. Distinguishing characteristics and usability of graphene oxide based on different sources of graphite feedstock. J. Colloid Interface Sci. 2019, 542, 429–440. [Google Scholar] [CrossRef]
  12. Panáček, A.; Kvítek, L.; Prucek, R.; Kolář, M.; Večeřová, R.; Pizúrová, N.; Sharma, V.K.; Nevěčná, T.; Zbořil, R. Silver Colloid Nanoparticles:  Synthesis, Characterization, and Their Antibacterial Activity. J. Phys. Chem. B 2006, 110, 16248–16253. [Google Scholar] [CrossRef] [PubMed]
  13. Ahsani, M.; Hazrati, H.; Javadi, M.; Ulbricht, M.; Yegani, R. Preparation of antibiofouling nanocomposite PVDF/Ag-SiO2 membrane and long-term performance evaluation in the MBR system fed by real pharmaceutical wastewater. Sep. Purif. Technol. 2020, 249, 116938. [Google Scholar] [CrossRef]
  14. Yu, L.; Zhou, W.; Li, Y.; Zhou, Q.; Xu, H.; Gao, B.; Wang, Z. Antibacterial Thin-Film Nanocomposite Membranes Incorporated with Graphene Oxide Quantum Dot-Mediated Silver Nanoparticles for Reverse Osmosis Application. ACS Sustain. Chem. Eng. 2019, 7, 8724–8734. [Google Scholar] [CrossRef]
  15. Li, S.; Gao, B.; Wang, Y.; Jin, B.; Yue, Q.; Wang, Z. Antibacterial thin film nanocomposite reverse osmosis membrane by doping silver phosphate loaded graphene oxide quantum dots in polyamide layer. Desalination 2019, 464, 94–104. [Google Scholar] [CrossRef]
  16. Kovalova, L.; Siegrist, H.; Singer, H.; Wittmer, A.; McArdell, C.S. Hospital Wastewater Treatment by Membrane Bioreactor: Performance and Efficiency for Organic Micropollutant Elimination. Environ. Sci. Technol. 2012, 46, 1536–1545. [Google Scholar] [CrossRef] [PubMed] [Green Version]
  17. Nasir, S.; Hussein, M.Z.; Yusof, N.A.; Zainal, Z. Oil palm waste-based precursors as a renewable and economical carbon sources for the preparation of reduced graphene oxide from graphene oxide. Nanomaterials 2017, 7, 182. [Google Scholar] [CrossRef] [PubMed] [Green Version]
  18. Wang, L.; Wang, Y.; Dai, J.; Tian, S.; Xie, A.; Dai, X.; Pan, J. Coordination-driven interfacial cross-linked graphene oxide-alginate nacre mesh with underwater superoleophobicity for oil-water separation. Carbohydr. Polym. 2021, 251, 117097. [Google Scholar] [CrossRef]
  19. Mahmoudi, E.; Ng, L.Y.; Ba-Abbad, M.M.; Mohammad, A.W. Novel nanohybrid polysulfone membrane embedded with silver nanoparticles on graphene oxide nanoplates. Chem. Eng. J. 2015, 277, 1–10. [Google Scholar] [CrossRef]
  20. Das, M.R.; Sarma, R.K.; Saikia, R.; Kale, V.S.; Shelke, M.V.; Sengupta, P. Synthesis of silver nanoparticles in an aqueous suspension of graphene oxide sheets and its antimicrobial activity. Colloids Surfaces B Biointerfaces 2011, 83, 16–22. [Google Scholar] [CrossRef]
  21. Wang, M.; Pan, F.; Yang, L.; Song, Y.; Wu, H.; Cheng, X.; Liu, G.; Yang, H.; Wang, H.; Jiang, Z.; et al. Graphene oxide quantum dots incorporated nanocomposite membranes with high water flux for pervaporative dehydration. J. Memb. Sci. 2018, 563, 903–913. [Google Scholar] [CrossRef]
  22. Kumar, A.; Sadanandhan, A.M.; Jain, S.L. Silver doped reduced graphene oxide as a promising plasmonic photocatalyst for oxidative coupling of benzylamines under visible light irradiation. New J. Chem. 2019, 43, 9116–9122. [Google Scholar] [CrossRef]
  23. Liu, H.; Xu, A.; Feng, Z.; Long, D.; Chen, X.; Lu, M. pH-dependent fluorescent quenching of graphene oxide quantum dots: Towards hydroxyl. Mater. Sci. Eng. B 2020, 260, 114627. [Google Scholar] [CrossRef]
  24. Colburn, A.; Wanninayake, N.; Kim, D.Y.; Bhattacharyya, D. Cellulose-graphene quantum dot composite membranes using ionic liquid. J. Membr. Sci. 2018, 556, 293–302. [Google Scholar] [CrossRef] [PubMed]
  25. Cao, X.; Ma, C.; Zhao, J.; Guo, H.; Dai, Y.; Wang, Z.; Xing, B. Graphene oxide mediated reduction of silver ions to silver nanoparticles under environmentally relevant conditions: Kinetics and mechanisms. Sci. Total Environ. 2019, 679, 270–278. [Google Scholar] [CrossRef]
  26. Kumar, S.V.; Huang, N.M.; Lim, H.N.; Marlinda, A.R.; Harrison, I.; Chia, C.H. One-step size-controlled synthesis of functional graphene oxide/silver nanocomposites at room temperature. Chem. Eng. J. 2013, 219, 217–224. [Google Scholar] [CrossRef]
  27. Song, X.; Zhou, Q.; Zhang, T.; Xu, H.; Wang, Z. Pressure-assisted preparation of graphene oxide quantum dot-incorporated reverse osmosis membranes: Antifouling and chlorine resistance potentials. J. Mater. Chem. A 2016, 4, 16896–16905. [Google Scholar] [CrossRef]
  28. Zhao, J.; Zhu, Y.; Pan, F.; He, G.; Fang, C.; Cao, K.; Xing, R.; Jiang, Z. Fabricating graphene oxide-based ultrathin hybrid membrane for pervaporation dehydration via layer-by-layer self-assembly driven by multiple interactions. J. Memb. Sci. 2015, 487, 162–172. [Google Scholar] [CrossRef]
  29. Hassanzadeh, S.; Adolfsson, K.H.; Hakkarainen, M. Controlling the cooperative self-assembly of graphene oxide quantum dots in aqueous solutions. RSC Adv. 2015, 5, 57425–57432. [Google Scholar] [CrossRef] [Green Version]
  30. Zhao, G.; Hu, R.; Li, J.; Zhu, H. Graphene oxide quantum dots embedded polysulfone membranes with enhanced hydrophilicity, permeability and antifouling performance. Sci. China Mater. 2019, 62, 1177–1187. [Google Scholar] [CrossRef]
  31. Yang, Z.; Wu, Y.; Guo, H.; Ma, X.-H.; Lin, C.-E.; Zhou, Y.; Cao, B.; Zhu, B.-K.; Shih, K.; Tang, C.Y. A novel thin-film nano-templated composite membrane with in situ silver nanoparticles loading: Separation performance enhancement and implications. J. Memb. Sci. 2017, 544, 351–358. [Google Scholar] [CrossRef]
  32. Hosseinifard, S.M.; Aroon, M.A.; Dahrazma, B. Application of PVDF/HDTMA-modified clinoptilolite nanocomposite membranes in removal of reactive dye from aqueous solution. Sep. Purif. Technol. 2020, 251, 117294. [Google Scholar] [CrossRef]
  33. Zhang, M.; Field, R.W.; Zhang, K. Biogenic silver nanocomposite polyethersulfone UF membranes with antifouling properties. J. Memb. Sci. 2014, 471, 274–284. [Google Scholar] [CrossRef]
  34. Saraswathi, M.S.S.A.; Rana, D.; Divya, K.; Alwarappan, S.; Nagendran, A. Fabrication of anti-fouling PVDF nanocomposite membranes using manganese dioxide nanospheres with tailored morphology, hydrophilicity and permeation. New J. Chem. 2018, 42, 15803–15810. [Google Scholar] [CrossRef]
  35. Xu, S.; Li, F.; Su, B.; Hu, M.Z.; Gao, X.; Gao, C. Novel graphene quantum dots (GQDs)-incorporated thin film composite (TFC) membranes for forward osmosis (FO) desalination. Desalination 2019, 451, 219–230. [Google Scholar] [CrossRef]
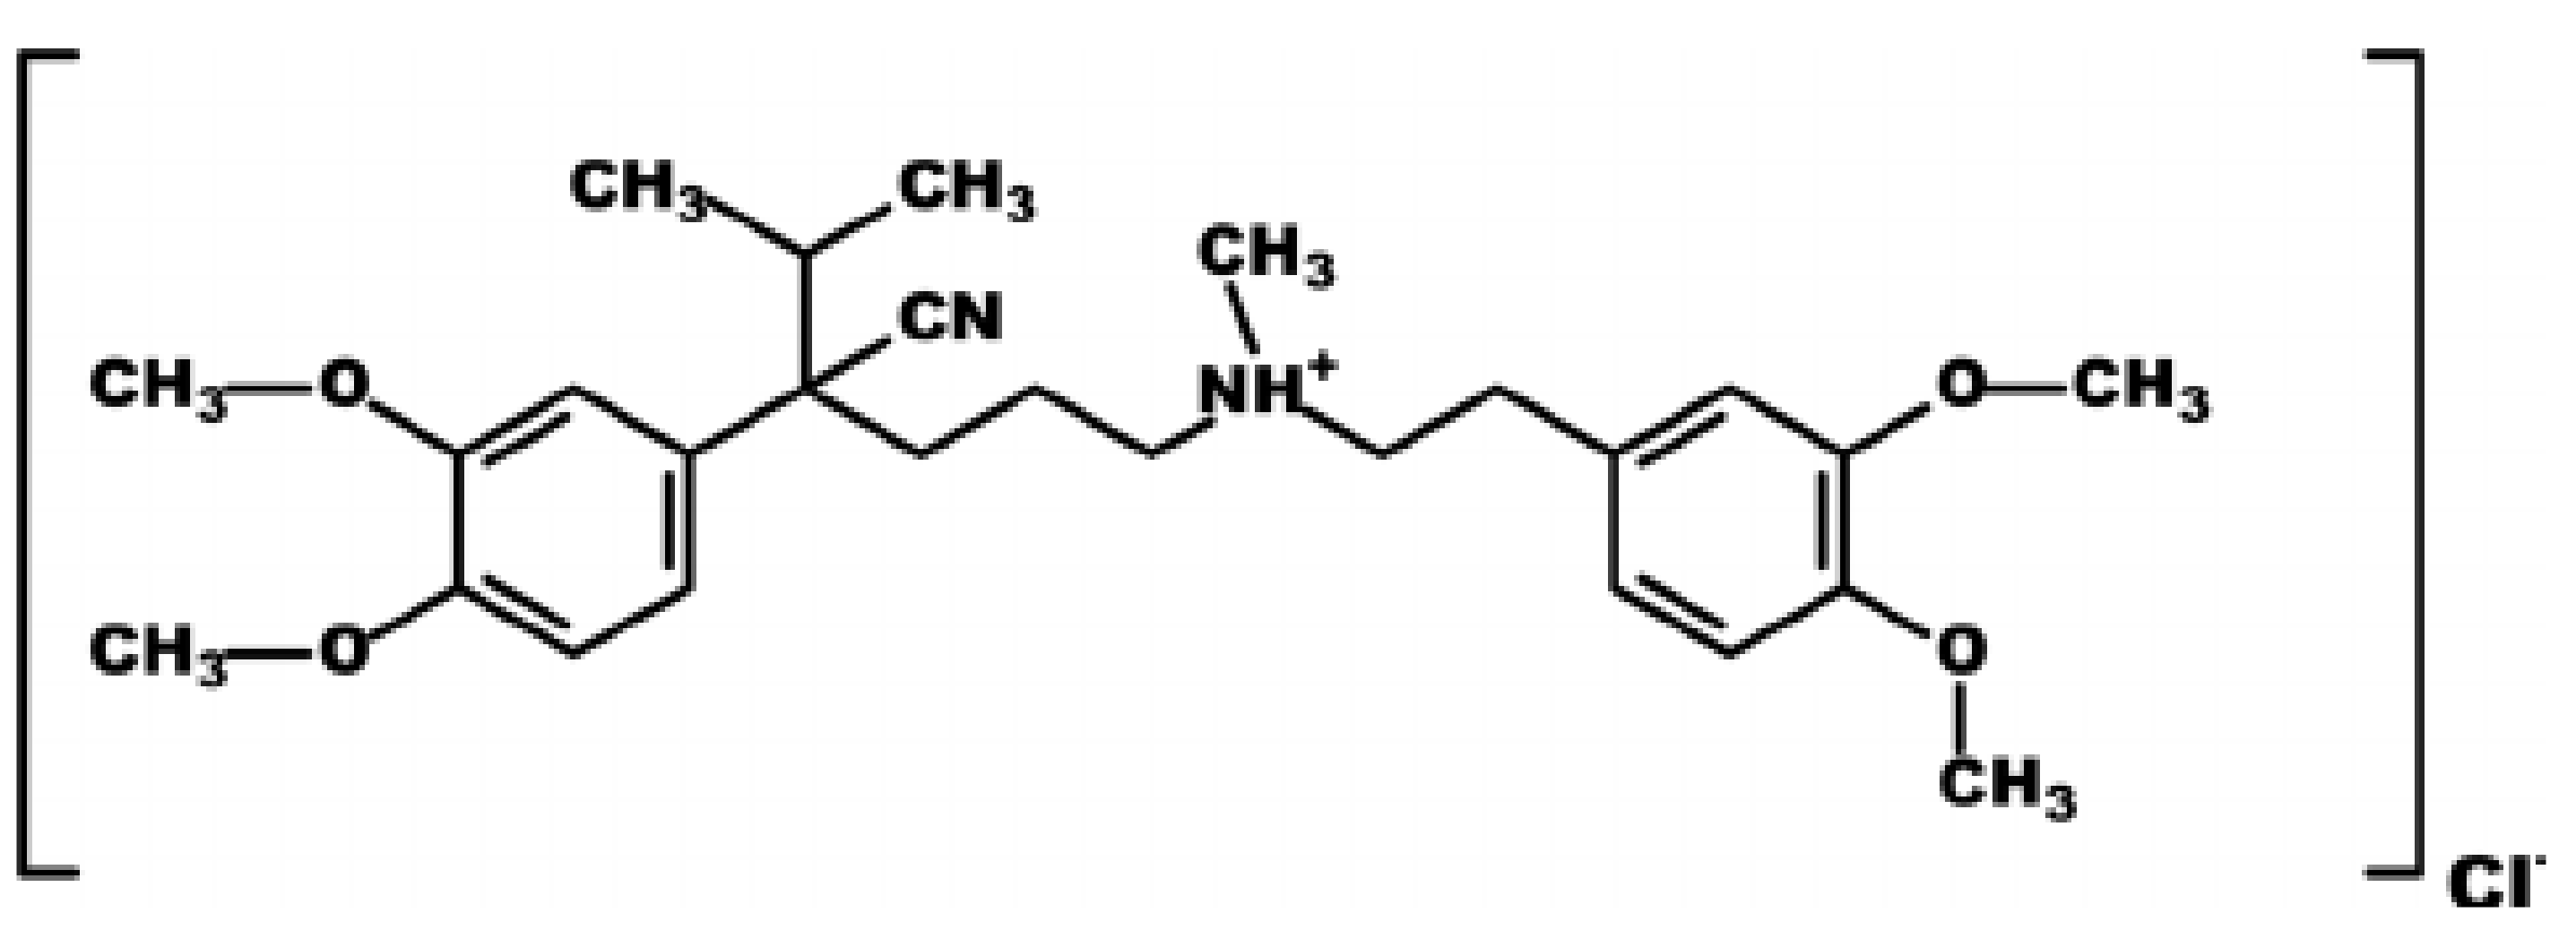
Figure 1. Molecular structure of verapamil hydrochloride. Reprinted/adapted with permission from Semaan, F.É. [6].
Sustainability 14 15843 g001
Figure 2. TEM image (A) and FESEM image (B) for GOQD. TEM image (C) and FESEM image (D) for Ag−GOQD. EDX analysis for (E) GOQD and (F) Ag−GOQD.
Sustainability 14 15843 g002
Figure 3. XPS spectrum of Ag−GOQD (A) survey, (B) C 1s, (C) O 1s, and (D) Ag 3d.
Sustainability 14 15843 g003
Figure 4. FTIR spectra of (A) GOQD and (B) Ag−GOQD.
Sustainability 14 15843 g004
Figure 5. Zeta potential curves for GOQD and Ag−GOQD.
Sustainability 14 15843 g005
Figure 6. FESEM surface images of (A) Membrane A, (B) Membrane D, and (C) Membrane F. FESEM cross-sectional images of (D) Membrane A, (E) Membrane D, and (F) Membrane F. Membrane A refers to pure PVDF membrane. Membrane D refers to 0.06 wt% of Ag−GOQD-incorporated PVDF membrane. Membrane F refers to 0.08 wt% of Ag−GOQD-incorporated PVDF membrane.
Sustainability 14 15843 g006
Figure 7. EDX results of (A) Membrane A, (B) Membrane D, and (C) Membrane F. Membrane A refers to pure PVDF membrane. Membrane D refers to 0.06 wt% of Ag−GOQD-incorporated PVDF membrane. Membrane F refers to 0.08 wt% of Ag−GOQD-incorporated PVDF membrane.
Sustainability 14 15843 g007
Figure 8. Three-dimensional images of Ag−GOQD-incorporated PVDF membranes. Membrane A refers to pure PVDF membrane. Membrane B refers to 0.02 wt% of Ag−GOQD-incorporated PVDF membrane. Membrane C refers to 0.04 wt% of Ag−GOQD-incorporated PVDF membrane. Membrane D refers to 0.06 wt% of Ag−GOQD-incorporated PVDF membrane. Membrane E refers to 0.08 wt% of Ag−GOQD-incorporated PVDF membrane. Membrane F refers to 0.10 wt% of Ag−GOQD-incorporated PVDF membrane.
Sustainability 14 15843 g008
Figure 9. Verapamil rejections of pure PVDF membrane and Ag−GOQD-incorporated PVDF membranes.
Sustainability 14 15843 g009
Figure 10. (A) Time-dependent flux to verapamil and (B) fouling resistance of pure PVDF membrane and Ag−GOQD-incorporated PVDF membranes.
Sustainability 14 15843 g010
Figure 11. The antibacterial capability of pure PVDF membrane (Membrane A) and 0.06 wt% of Ag−GOQD-incorporated PVDF membrane (Membrane D).
Sustainability 14 15843 g011
Table 1. PVDF Composite Membranes.
Sample LabelingPVDF Beads (wt%)NMP (wt%)Ag−GOQD (wt%)
Membrane A22780
Membrane B2277.980.02
Membrane C2277.960.04
Membrane D2277.940.06
Membrane E2277.920.08
Membrane F2277.90.1
Table 2. Surface roughness of Ag−GOQD-incorporated PVDF membranes.
MembraneSa (nm)Sq (nm)Sz (nm)
Membrane A123.80148.10870.90
Membrane B30.1039.70311.30
Membrane C16.6020.90148.00
Membrane D32.9045.20342.10
Membrane E15.4020.40210.20
Membrane F13.1016.60120.90
Table 3. Contact angles of pure and Ag−GOQD-incorporated PVDF membranes.
MembraneContact Angle (°)
Membrane A79.06 ± 4.53
Membrane B75.10 ± 3.32
Membrane C71.66 ± 1.68
Membrane D73.06 ± 1.40
Membrane E68.37 ± 3.36
Membrane F53.60 ± 4.75
Table 4. Pure water fluxes of pure and Ag−GOQD-incorporated PVDF membranes.
MembranePure Water Flux (LMH)
Membrane A18.9 ± 0.81
Membrane B25.89 ± 3.75
Membrane C31.64 ± 0.76
Membrane D64.52 ± 1.53
Membrane E21.37± 2.44
Membrane F19.73 ± 2.16
Publisher’s Note: MDPI stays neutral with regard to jurisdictional claims in published maps and institutional affiliations.