Article

Establishment of an Ecological Security Pattern under Arid Conditions Based on Ecological Carrying Capacity: A Case Study of Arid Area in Northwest China

1
College of Earth and Environmental Sciences, Lanzhou University, Lanzhou 730000, China
2
Cooperative Innovation Center for Transition of Resource-Based Economics, Shanxi University of Finance & Economics, Taiyuan 030006, China
3
Research Institute of Resource-Based Economics, Shanxi University of Finance & Economics, Taiyuan 030006, China
4
Tianjin Key Laboratory of Water Resources and Environment, Tianjin Normal University, Tianjin 300387, China
5
College of Geography and Environmental Science, Northwest Normal University, Lanzhou 730070, China
*
Author to whom correspondence should be addressed.
Sustainability 2022, 14(23), 15799; https://doi.org/10.3390/su142315799
Submission received: 19 September 2022 / Revised: 3 November 2022 / Accepted: 9 November 2022 / Published: 28 November 2022
(This article belongs to the Special Issue Remote Sensing Monitoring of Resources and Ecological Environment)

Abstract

:
With the expansion of the social economy and adjustment of environmental policies, particularly with the onset of development policies for the western region, ecosystems in the arid areas of Northwest China have undergone profound changes. This study collected soil, topographical, climate, and nighttime light data to develop a set of ecological vulnerability assessment indexes based on the background ecological characteristics of the arid areas of Northwest China. The spatiotemporal evolution of ecological carrying capacity was analyzed by our team using Spatial Principal Component Analysis (SPCA) in 2000, 2007, 2012, and 2018 to construct an ecological security pattern. The results revealed that the ecological carrying capacities of the arid areas in the northwest were primarily weak, albeit decreasing, while those areas with strong carrying capacities were increasing. In terms of spatial distribution, the ecological carrying capacities of the Hexi, Northern Xinjiang, and Western Inner Mongolia regions were on the rise, while those of the Southern Xinjiang region were declining. The Minimum Cumulative Resistance (MCR) model was used to extract 51 road-type, river-type, and green corridors with a total length of 7285.43 km. A total of 71 nodes representing important patches, wet rivers, and ecologically fragile areas were extracted. According to the calculated results, the arid region of the northwest was divided into 16 ecological security patterns, which were optimized according to changes in their ecological carrying capacities.

1. Introduction

With relentlessly increasing demands for natural resources, conflicts between human civilization and the natural environment are becoming increasingly intense [1]. The resource-carrying capacity of the environment is beyond the limits of affordability; thus, investigations into the ecological carrying capacities of different regions have attracted the attention of many ecologists, geographers, and economists [2]. This is particularly the case since the central government began to promote the development of ecosystems, wherein the evaluation of their carrying capacities has transitioned from the research to the practical implementation level. It is critical to establish monitoring and early warning mechanisms that are sensitive to the carrying capacity of ecosystems while implementing restrictive measures on overloaded areas. Through the supervision and evaluation of the overload status of the natural resources of a given region, the diagnosis and prediction of sustainable development lay the foundation for the development of differentiated and operable restrictive measures, which are the basis of regional spatial and overall functional area planning.
Ecological carrying capacities are the most fundamental and critical content for the study of those resource environments, where the status of ecological carrying capacities directly determines the development and changes in regional resource environment carrying capacities [3,4]. Filgueira et al. [5] regard ecological carrying capacities as the self-sustainability of environmental resources supporting external socioeconomic pressures. For the arid regions of Northwest China, the application of the ecological carrying capacity concept translates to ensuring sustainable social and economic development while regulating the rational exploitation and utilization of resources toward the establishment of a virtuous cycle of ecological management [6].
From the standpoint of research, scholars from different disciplines have conducted in-depth investigations into ecological carrying capacities via state space [7], comprehensive evaluation [8], ecological footprint [9], socioecological index system [10], and other methods [11]. Li et al. [12] selected 16 indexes from the three dimensions of ecological function elasticity, resource and environment capacity, and socioeconomic coordination to conduct a quantitative evaluation of the ecological carrying capacity of Beijing using the state space method. Jian Peng et al. [13] evaluated the regional ecological carrying capacity of Dali in Yunnan Province from the perspectives of ecological pressure and elasticity based on a comprehensive evaluation of the carrying capacity model. Further, Xie et al. [14] analyzed the dynamic changes and driving factors of the ecological footprint in the Yellow River Delta. These experts evaluated and analyzed ecological carrying capacities using different research domains [15,16]. Although this research improves our understanding of regional ecological carrying capacities, several issues remain. For the evaluation of ecological carrying capacities, the statistical spatial interpolation method has been extensively employed to evaluate the impacts of anthropogenic activities on ecosystems. However, in the study of the arid areas of Northwest China, which include sparsely populated areas, the spatial interpolation method does not accurately reflect anthropogenic interference with the ecological environment.
The index system evaluation method is a method to describe the status of ecological carrying capacity by establishing a series of index systems and evaluating them. The index system of evaluation method for the evaluation of ecological carrying capacity should first be chosen to represent the main characteristics of the ecological carrying capacity index, including social economy, the land use index; second, the analysis of each index, the bearing capacity of ecological instruction meaning, then, to measure these characteristics factor, determine the weight coefficient of each characteristic factor in the ecological carrying capacity. Finally, the evaluation system of ecological carrying capacity is established to evaluate the ecological carrying capacity. Consequently, for the development of an index system, this study took the objectivity of the index into full consideration and selected nighttime light data as an index for the evaluation of human social pressures [16]. Nighttime light data have the following advantages in the evaluation of human activities [17]. Firstly, nighttime light data are suitable for the monitoring of human activities over a large area. Secondly, the nighttime light data are not affected by clouds and fog; thus, they have strong objectivity. Thirdly, nighttime light data can reflect population [18] and economic densities [19], the urbanization level [20], roads, and other information [21], which are highly comprehensive [22].
Ecological security pattern is theoretically supported by landscape ecology [23], which essentially refers to a potential spatial pattern of ecosystems in the landscape [24]. At present, the construction method of ecological security patterns has become increasingly mature, and the research framework of “identifying source areas, constructing resistance surfaces, and extracting corridors” has become the basic mode of ecological security pattern construction [25,26]. The ecological source refers to the habitat patches with important significance or radiation function for regional ecological security, which is the basis for constructing ecological security patterns [27]. As another core element in the construction of ecological security patterns, the resistance surface is generally obtained through the assignment of land classes. Because the direct assignment is too subjective, ignores the internal differences under the same land cover type, and disguises the influence of human activities on the ecological resistance coefficient, the revision of resistance surface has been focused on in recent years.
The arid regions of Northwest China typically have low ecological carrying capacities in China [28]. Recently, with changing climatic conditions and multiple anthropogenic interventions, ecosystems in the arid areas of Northwest China have generally become degraded. These aspects include low vegetation coverage, high land degradation index, low biological abundance index, high resource pressure, unreasonable economic structure, and so on. Therefore, it is urgent to formulate reasonable ecological restoration policies to promote the restoration of the ecological environment. Although there have been a lot of studies on the construction of ecological security patterns in the study area, there are still the following problems: (1) The previous studies mainly focused on a single watershed without an integrated analysis of the whole study area, and the policies formulated were not comprehensive. (2) In the identification of ecological source areas, a single land use factor is often considered, resulting in the identification of ecological source areas that cannot form radiation function to the study area.
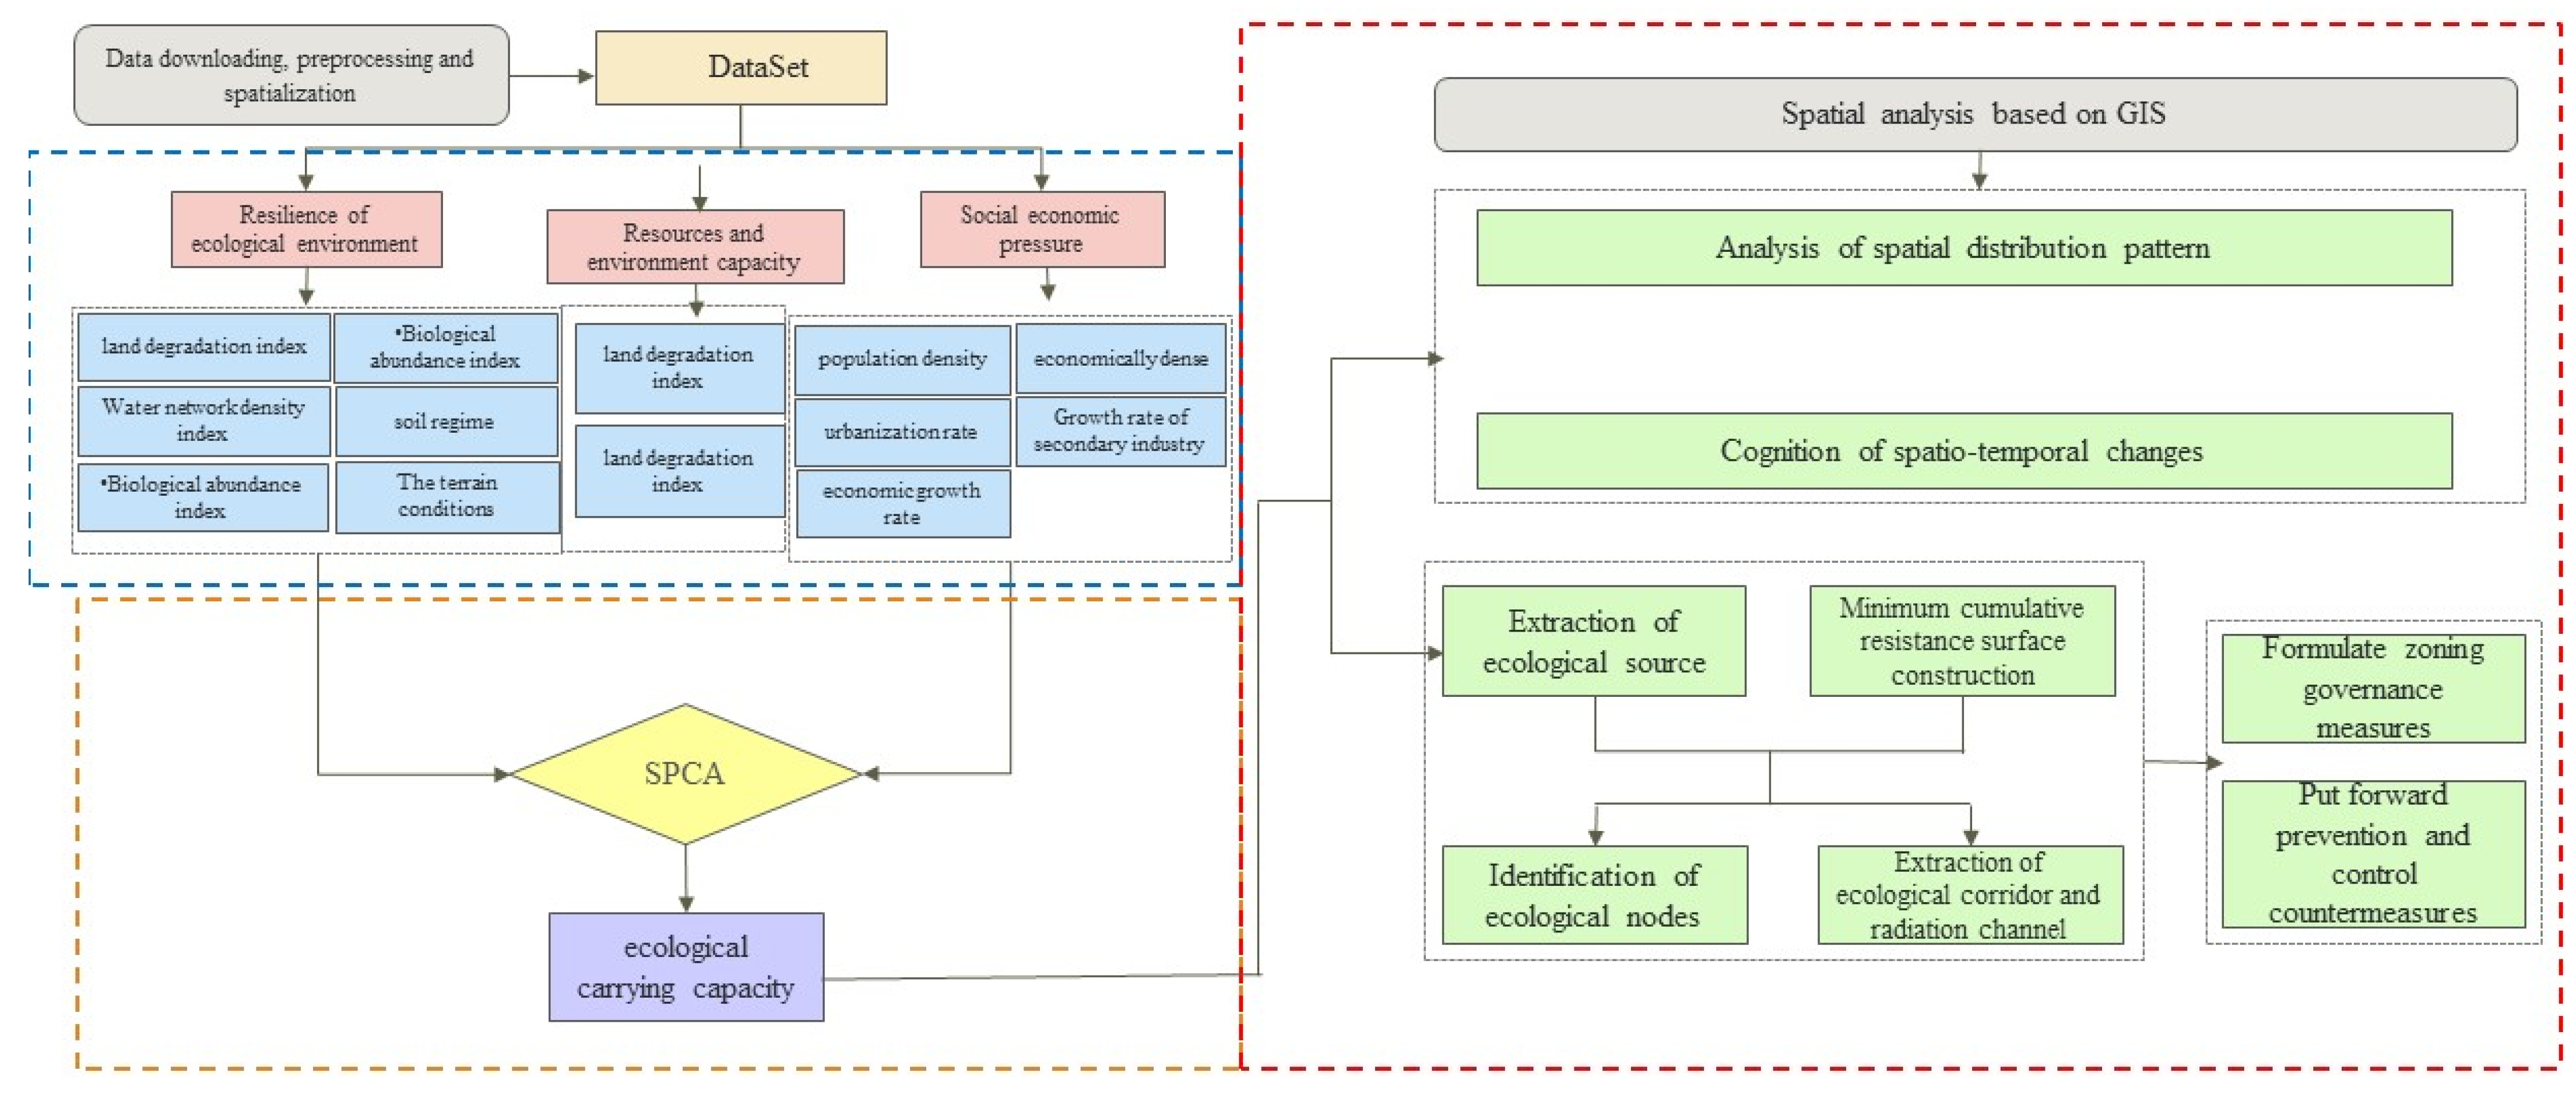
In 2000, the central government began to implement the “Western Development Policy”, which aims to use the surplus economic development capacity of the eastern coastal areas to raise the level of economic and social development in the western regions. After that, the economic development of the western region increased rapidly. This study takes the year 2000 as the background to analyze the ecological environment situation in the western region without large-scale economic development. In 2007, the central government adopted the “11th Five-Year Plan” for the Development of the Western Region, which further improved the economic development speed of the western region. The GDP growth rate of each province exceeded 10%, which further improved the economic development speed of the western region, but at the same time, exposed many ecological problems. In 2012, the central government put forward the environmental protection theory that “clear water and green mountains are gold and silver mountains”, and local governments began to pay attention to ecological environmental issues. In 2018, six years after the introduction of ecological and environmental policies, we analyzed the ecological and environmental conditions in the western region after the adjustment of ecological and environmental policies. This investigation selected four stages of changes in eco-environmental policies in the study area in 2000, 2007, 2012, and 2018 and selected 13 indexes, including topography, hydrology, soil, vegetation, population, and nighttime light data. Spatial principal component analysis [23] and the coding method [24] were employed to monitor and evaluate the ecological carrying capacities of the arid regions of Northwest China (Figure 1). Thus, to analyze the spatiotemporal variations, those areas with high ecological carrying capacities were selected as ecologically advantaged areas, whereas intersects were chosen as ecological sources; thus, the final ecological resource areas were obtained through their combination with important water sources and forested lands. Based on the minimum cumulative resistance model [24], the arid areas in Northwest China were segmented into sixteen ecological security pattern regions, from which three ecological corridors and three ecological nodes were extracted. Based on the variable trends of ecological carrying capacities in the study area, ecological security patterns were designed and optimized to provide suggestions and countermeasures for ecological protection and development.

2. Materials and Methods

2.1. Study Area

The arid areas of Northwest China [29] are bounded by Helan Mountain in the East, and the Kunlun, Altun, and Qilian Mountains in the South, located between 73° E–107° E and 35° N–50° N (Figure 2). The administrative region primarily includes the Xinjiang Province, the Hexi Corridor of Gansu Province, and the Western region of Inner Mongolia, which specifically includes 14 locations, prefectures, and cities in Xinjiang, Jiu Quan, Jiayuguan, Zhangye, Wuwei, Jinchang of Gansu Province, and the Alxa League of Inner Mongolia, with an area of 2.09 × 10⁶ km2 and altitudes ranging from −154 to 7311 m. The study area is located deeply inland and far away from the sea, with an annual average precipitation of ~<200 mm. The climate is dry, with desert accounting for 64.47% of the total area under a typical temperate continental climate. Furthermore, the terrain of the area is undulating and shallow, and the ecological environment is very fragile; thus, it is difficult to recover following damage.

2.2. Data Resources

The data used in this study included:
(1) Nighttime light data (2000, 2007, 2012, 2018): The National Oceanic and Atmospheric Administration National Geophysical Data Center (NOAA/NGDC) website (http://www.ngdc.noaa, accessed on 10 September 2022), provides DMSP-OLS nighttime light datasets from 1992 to 2013 and NPP-VIIRS nighttime light data from 2012 to 2018. DMSP-OLS data eliminate the influence of clouds, fire, and other noise factors, with a gray value of 0–63 and a resolution of 1 km [17]. For this study, DMSP-OLS data were processed to the Albers and other area projections as the target projection and trimmed using the arid zone boundary in Northwest China. As the NSL data were derived from six different DMSP-OLS satellites (F10, F12, F14, F15, F16, and F18), which lacked continuity and comparability, this paper adopted the method of Wei et al. [16] to correct them. Since DMSP-OLS sensor design has limitations, this paper used the enhanced vegetation index (EVI) to reduce the saturation of DMSP-OLS. The NPP-VIIRS data are monthly data with a resolution of 430 m. The noise factor was not removed from the NPP-VIIRS data, and the DN values of the NPP-VIIRS and DMSP-OLS data were significantly different; thus, we adopted the method of Wei et al. [16], we adopted a simple regression method to adjust them, for correction and fitting.
(2) Land use data, soil organic matter content data, soil erosion spatial distribution data, and soil type distribution data were obtained from the Data Center for Resources and Environmental Sciences, Chinese Academy of Sciences (http://www.resdc.cn, accessed on 10 September 2022), with a resolution of 1 km. The biological abundance index was calculated by referring to the Technical Specification for Ecological and Environmental [22].
(3) Temperature and precipitation data were derived from monthly scale data of the meteorological stations of the China Meteorological Data Network. Based on the ArcGIS10.8 software platform, the kriging interpolation method was employed to perform the spatial interpolation of station data so as to obtain spatial distribution data of the average temperature and annual precipitation in 2000, 2007, 2012, and 2018 in the arid regions of Northwest China. The resolution was 1 km.
(4) Digital elevation data (DEM) were derived from a geospatial data cloud platform (http://www.gscloud.cn, accessed on 10 September 2022). Based on DEM data and referred to the relevant research results of Sheshukov et al. [30], the topographic potential index and river network density in the arid region of Northwest China were calculated with a resolution of 1 km.
(5) Vegetation cover data (2000, 2007, 2012, and 2018) were derived from the monthly scale products of NASA’s EOS/MODIS dataset with a resolution of 1 km.
(6) Social statistical data were calculated based on population distribution raster data and cultivated land and forest land raster data, with a spatial resolution of 1 km.

2.3. Establishment of Index System

The purpose of this study was to monitor and evaluate the ecological carrying capacity of the arid region of Northwest China. Therefore, the ecological carrying capacity was considered as the evaluation target layer, whereas the criterion layer was set as the ecological, environmental elastic force [31], resource and environmental capacity [27], and socioeconomic pressure [32]. The elastic force of the ecological environment reflects the background conditions that support the development of the natural environment and human society. In consideration of natural conditions, such as the lack of water resources and sparse vegetation in the arid area of Northwest China, factors such as annual precipitation, biological abundance, topography, and soil should be judged when selecting indexes. Resource and environmental capacities primarily reflect the degree of coordination between resources, the environment, and human society. Therefore, per capita, resource reserves, and economic development levels were primarily considered for the selection of indexes. Social and economic pressures (i.e., pressures on resources and the environment brought about by anthropogenic development) directly reflect the challenges that exist toward socioeconomic development; thus, demographic and economic aspects were selected as indexes. Finally, this study selected 13 indexes with complete structures and easy statistics (Table 1).
Socioeconomic pressures were the cause of state changes and the resulting responses [33]. Since the development of the west (2000), the social economy of the arid area of Northwest China developed quickly, which resulted in the rapid deterioration of the environment. The arid region of Northwest China is widely populated, where the area of urban and rural construction land accounted for only 0.52% of the total area of the study area. The spatial interpolation of statistical data cannot accurately reflect the impacts of anthropogenic activities on ecosystems. Therefore, for this paper, the nighttime light data and land use data were selected as indexes of the pressure of social activities on the ecological environment in the arid area of Northwest China.
The elastic force of the ecological environment reflected the long-term effects of various factors in the study area and was the most direct reflection of the background conditions of the regional ecological environment [34]. Located in the central portion of Eurasia, Northwest China is a typical arid land region with annual precipitation of less than 200 mm, with low vegetation coverage. Therefore, this paper selected soil organic matter content data, soil erosion spatial distribution data, and soil type distribution data to characterize the soil carrying capacity factors of the study area. The average annual precipitation and annual temperature, and river network density were selected to represent the combined hydrothermal status of the study area. The normalized difference vegetation index (NDVI) reflected the biological activities in the study area and indicated the resistance of organisms to environmental change. The topographic potential index was selected as the topographic and geomorphic bearing capacity of the study area.
Resource and environment capacities are targeted measures put forward by human society to promote the sustainable development of the ecological environment. Per capita cultivated land and forested areas reflect the situation of human society with agricultural resources. Higher per capita cultivated land and forested areas can significantly improve the response capacities of humanity to ecological environment change. Consequently, per capita cultivated land and woodland areas were selected as response factors for the evaluation of the ecological carrying capacity in the arid areas of Northwest China.

2.4. Data Processing

To verify whether there was data redundancy in the selected ecological carrying capacity evaluation index, the collinearity between independent variables was diagnosed by SPSS software prior to evaluation. For this study, the variance inflation factor and tolerance were employed as elements of the multivariate collinearity diagnosis. With 10 as the boundary, the greater the variance expansibility factor was, the greater the collinearity. The tolerance value was the reciprocal of the variance expansibility factor, where the smaller the tolerance was, the stronger the collinearity, with 0.1 as the boundary. Based on the ArcGIS10.8 software platform, a 15 km × 15 km fishnet was established in the arid area of Northwest China, and 9327 fish sites were generated (Table 2). Thirteen evaluation indices and ecological carrying capacity indices were extracted from these fish sites for collinearity diagnosis. The results revealed that there was no collinearity between the 13 evaluation indices in the study area, which could be used as the evaluation of the ecological carrying capacity (Table 2).
Due to different dimensions and units, the evaluation indices were not horizontally comparable. According to the impact of each index on the ecological carrying capacity, the evaluation index was divided into a positive and negative index. The larger the negative index value, the smaller the ecological carrying capacity index would be, while the larger the positive index value, the larger the ecological carrying capacity index would be. The positive indices included the vegetation coverage index, biological richness index, average annual precipitation, river network density, per capita, cultivated land area, per capita woodland area, soil organic matter content, and topographic position index. The negative indexes encompassed the annual average temperature, soil erosion intensity, and nighttime light data. The range standardization method was adopted for index standardization, and the formula was as follows [35,36]:
Forward indexes:
R = ( X i X m i n ) / ( X m a x X m i n )
Negative indexes:
R = ( X m a x X i ) / ( X m a x X m i n )
where Ri represents the standardized value of index i, Xi is the actual value of each index, Xmax is the maximum value of each index, and Xmin is the minimum value of each index.
According to the graded assignment method, the evaluation indices were graded and assigned. According to the water conservation capacity of different land uses, various land uses were ranked in descending order: forest land, water body < grassland < cultivated land < construction land < bare land, which were assigned 0–1. According to their ecological environment protection abilities, the soil types in descending order were: chernozemic soil, black soil, black blanket soil, gray cinnamon soil < meadow soil, frozen soil, gray calcium soil, grass blanket soil, tidal soil < irrigated desert soil, gray/brown desert soil < saline soil, desert saline soil < stony soil and aeolian sand soil, with values of 0–1.

2.5. Spatial Principal Component Analysis

Based on the principle of mathematical statistics, spatial principal component analysis (SPCA) converts multiple spatial index data into a few comprehensive layers by rotating the spatial coordinate axes of the feature spectrum. Because there is no artificial mark in the entire calculation process, the bearing capacity evaluation result is more objective. Based on the ArcGIS10.8 software platform, this study conducted spatial principal component analysis on 13 standardized indexes, which determined seven spatial principal components (Table 3) according to the principal component of more than 85%, and finally calculated the ecological carrying capacity index (ECC) in the arid region of Northwest China. The calculation formula was [34]:
ECC = r 1 Y 1 + r 2 Y 2 + r 3 Y 3 + + r n Y n
where ECC is the ecological carrying capacity index, Rn is the nth principal component, and Yn is the corresponding contribution rate of the n principal component.
E C C 2000 = 0.3790 × P 1 + 0.1784 × P 2 + 0.1256 × P 3 + 0.0631 × P 4 + 0.0595 × P 5 + 0.0439 × P 6 + 0.0348 × P 7
E C C 2007 = 0.3175 × P 1 + 0.1987 × P 2 + 0.1321 × P 3 + 0.0795 × P 4 + 0.0573 × P 5 + 0.0458 × P 6 + 0.0357 × P 7
E C C 2012 = 0.3580 × P 1 + 0.1807 × P 2 + 0.1292 × P 3 + 0.0863 × P 4 + 0.0482 × P 5 + 0.0458 × P 6 + 0.0357 × P 7
E C C 2018 = 0.3431 × P 1 + 0.1994 × P 2 + 0.11175 × P 3 + 0.0792 × P 4 + 0.0541 × P 5 + 0.0455 × P 6 + 0.0345 × P 7
ECC2000, ECC2007, ECC2012, and ECC2018 are the ecological carrying capacity indices of 2000, 2007, 2012, and 2018 respectively, and P1–P7 are the first seven principal component factors after the dimensionality reduction of the original data. The cumulative contribution rate of the first seven principal component factors was >85%, and the remaining principal component factors were found to be inconsistent with the actual ecological carrying capacity by comparison; thus, they were identified as noise and discarded [37].

2.6. Standardization and Classification of Ecological Carrying Capacity

To facilitate a temporal comparison of ecological carrying capacities, the results of the ecological carrying capacities in 2000, 2007, 2012, and 2018 were standardized, and the formula was:
S I E C C = E C C i E C C m i n E C C m a x E C C m i n
where SIECC is the standardized value of the ecological carrying capacity index with a range of 0–1, ECCi is the actual value of the ecological carrying capacity index, ECCmin is the minimum value of the ecological carrying capacity index, and ECCmax indicates the maximum value of the ecological carrying capacity index.

2.7. Construction of Ecological Security Pattern

According to the ecological security pattern development method proposed by Yu Kongjian et al. [38]., the monitoring and evaluation results of the ecological carrying capacity in the arid area of Northwest China and the regional characteristics of the region, the “origins” of the regional ecological security pattern were identified. The Minimum Cumulative Resistance (MCR) model was employed to establish the cumulative cost distance surface of the ecological source area, after which the ecological corridor and radiation channel were identified to construct the ecological security pattern using the formula [39]:
MCR = f m i n j = n i = m D i j × R i
where MCR is the minimum cumulative resistance value, Dij is the spatial distance of species from source j to landscape unit I, Ri is the resistance coefficient of landscape unit i to species movement, and f is the positive correlation between minimum cumulative resistance and ecological process.

2.7.1. Determination of Ecological Source Area

Ecological source areas are patches that play important roles in regional ecological environments for sustainable human development. By monitoring and evaluating the ecological carrying capacity of the study area, while identifying ecological source areas based on the special regional characteristics of the arid area in Northwest China, this study ensured their objective and comprehensive selection. Specifically, 3 layers of 13 indices of quantitative analysis were monitored and evaluated for their ecological carrying capacity, ecological environmental elastic force, resource and environmental capacity, and social economic pressure. Next, the ability of sustainable regional ecological development was evaluated and treated as the normalized ecological carrying capacity as the edge area. The top 20% of the plaques of all the dominant ecological areas were combined to obtain the important ecological patches, which were considered the key development areas of pattern optimization, where the intersections of ecologically dominant areas were the ecological source areas. According to the environmental conditions of the study area, this study selected major rivers, lakes, and woodland patches larger than 10 km2 as ecological sources [21] and combined them with the ecological sources obtained through the monitoring and evaluation of ecological carrying capacities to obtain the final ecological sources. Since some small source areas have negligible impacts on the overall ecological environment, patches with areas greater than 10 km2 were selected as the ecological source areas for this study.

2.7.2. Development of Minimum Cumulative Resistance Surface

To reflect the migration and movement of matter and energy between “target sources”, based on the cost-distance module of the ArcGIS10.8 software platform, this investigation adopted the minimum cumulative resistance model (MCR) to calculate the cumulative cost-distance between ecological source areas and other landscape types. Subsequently, the accessibility of each landscape unit to the ecological source area was assessed. According to the ecological attributes of the study area, five factors, including landscape type, elevation, slope, normalized difference vegetation index, and soil type, were selected as resistance factors. Each evaluation index was divided into five levels, with allocated values of 1, 2, 3, 4, and 5, respectively. The lower the value, the less resistance the “source” had to overcome in the process of migration, and vice versa. The evaluation index system of the ecological source resistance surface is shown in Table 4.
To better analyze the minimum cumulative resistance surface, this study used the superposition analysis of production-living-ecological-land and cumulative consumption distance surface to make the ecological security pattern zoning more scientific. The grid calculator of ArcGIS10.8 software was employed to superposition the classification map of the cumulative consumption distance surface and the distribution map of production-living-ecological-land to obtain the landscape ecological function zoning map. The calculation formula was [23]:
E S P = 10 × C o d e A R D + C o d e A G L
where ESP is the type code of the ecological security pattern; CodeARD is the grade 4 cumulative cost distance surface grade code (1–4), wherein 1–4 represent the ecological conservation, optimized buffer, ecological transition, and ecological protection zones, respectively; CodeAGL refers to four types of production-living-ecological-land type codes; and 0–3 represent unused, ecological, production, and living land, respectively. In the calculated ecological security pattern type code, ten digits represent the cumulative cost distance surface classification, and one digit represents the production-living-ecological-land type (e.g., 10 represents the unused land in the ecological conservation area).

2.7.3. Extraction of Ecological Corridor Radiation Channel

The ecological corridor is a low cumulative resistance valley line between “sources” and an important aspect of energy circulation between two adjacent sources, which has important ecological, social, and economic functions. Based on the hydrological analysis module in the ArcGIS10.8 software platform, this study filled the depressions, calculated the flow direction and confluence accumulation based on the accumulated cost distance to the surface, and obtained the threshold values greater than 2000 through the repeated determination of the domain value. Vectorization was then performed, and the vectorized lines were smoothly processed. The minimum cost path between two sources was extracted, and the corridor between any two sources was obtained. The radiative path is the optimal path for the outward diffusion of ecological flow and is a low resistance valley line for the outward diffusion of material with “source” as the center. Based on the accumulated cost distance surface, it will play a key role in the future development of the research area, and its own development will identify the valley lines of low resistance values radiating outward from the center of the “source”.

2.7.4. Identification of Ecological Nodes

Ecological nodes are regions that connect two adjacent ecological sources in ecological space, which play a key role in the landscape ecological process. They are typically distributed in the weak ecological function of the corridor. Based on the unique physical geographical characteristics of the arid area in Northwest China, two methods were used to extract ecological nodes. The first was the intersection of the low resistance valley lines between sources, whereas the second involved seventy-one ecological nodes of the two types being extracted from the ridge line of ecological resistance (e.g., the intersection of the path with the maximum cumulative ecological resistance and low resistance valley line).

3. Results and Discussion

3.1. Overall Characteristics of Ecological Carrying Capacity

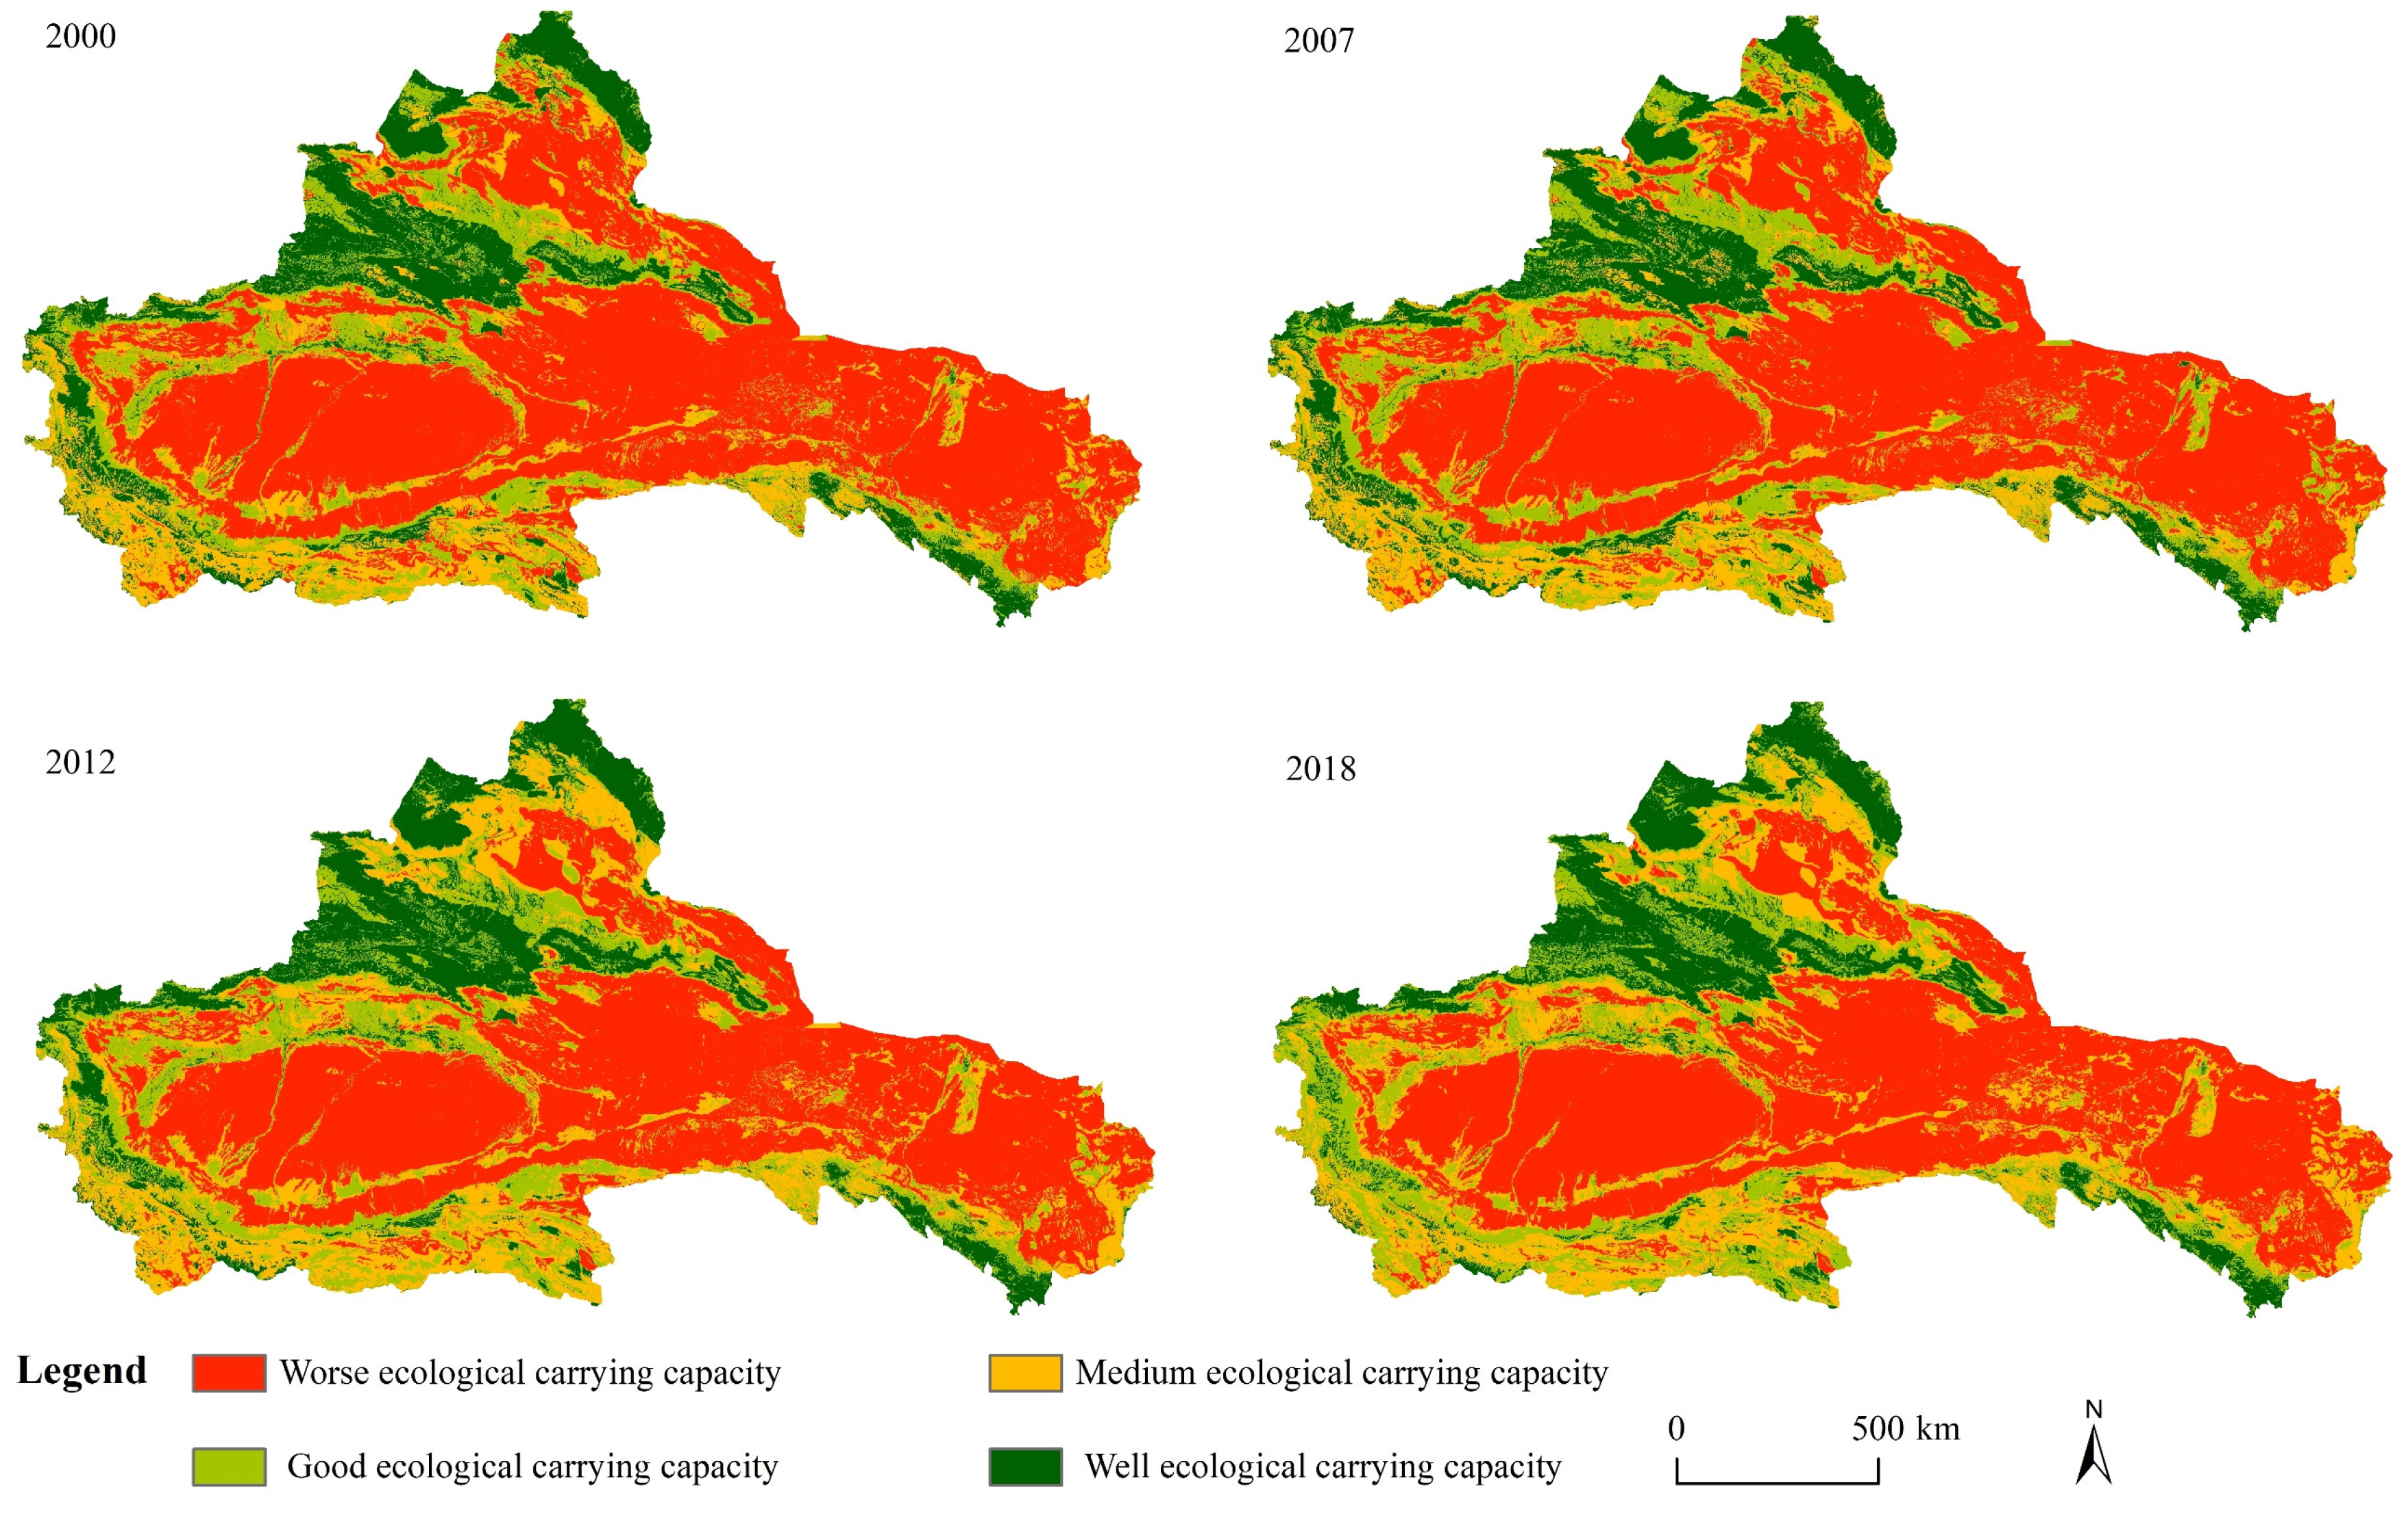
Because the research area is in the hinterland of the Asian and European continents, it is controlled by high pressure in Asia all year round. Precipitation is scarce, vegetation coverage is low, the area of desert and Gobi exceeds 60% of the total study land area, and the ecological carrying capacity of the northwest arid area is typically weak. The Good and Well carrying areas were mainly distributed across the Altai Mountain, Tianshan Mountain, Kunlun Mountain, and Qilian Mountain areas. The Worse and Medium carrying areas were mainly distributed across the Junger Basin, Tarim Basin, and Alashan Plateau region (Figure 3).
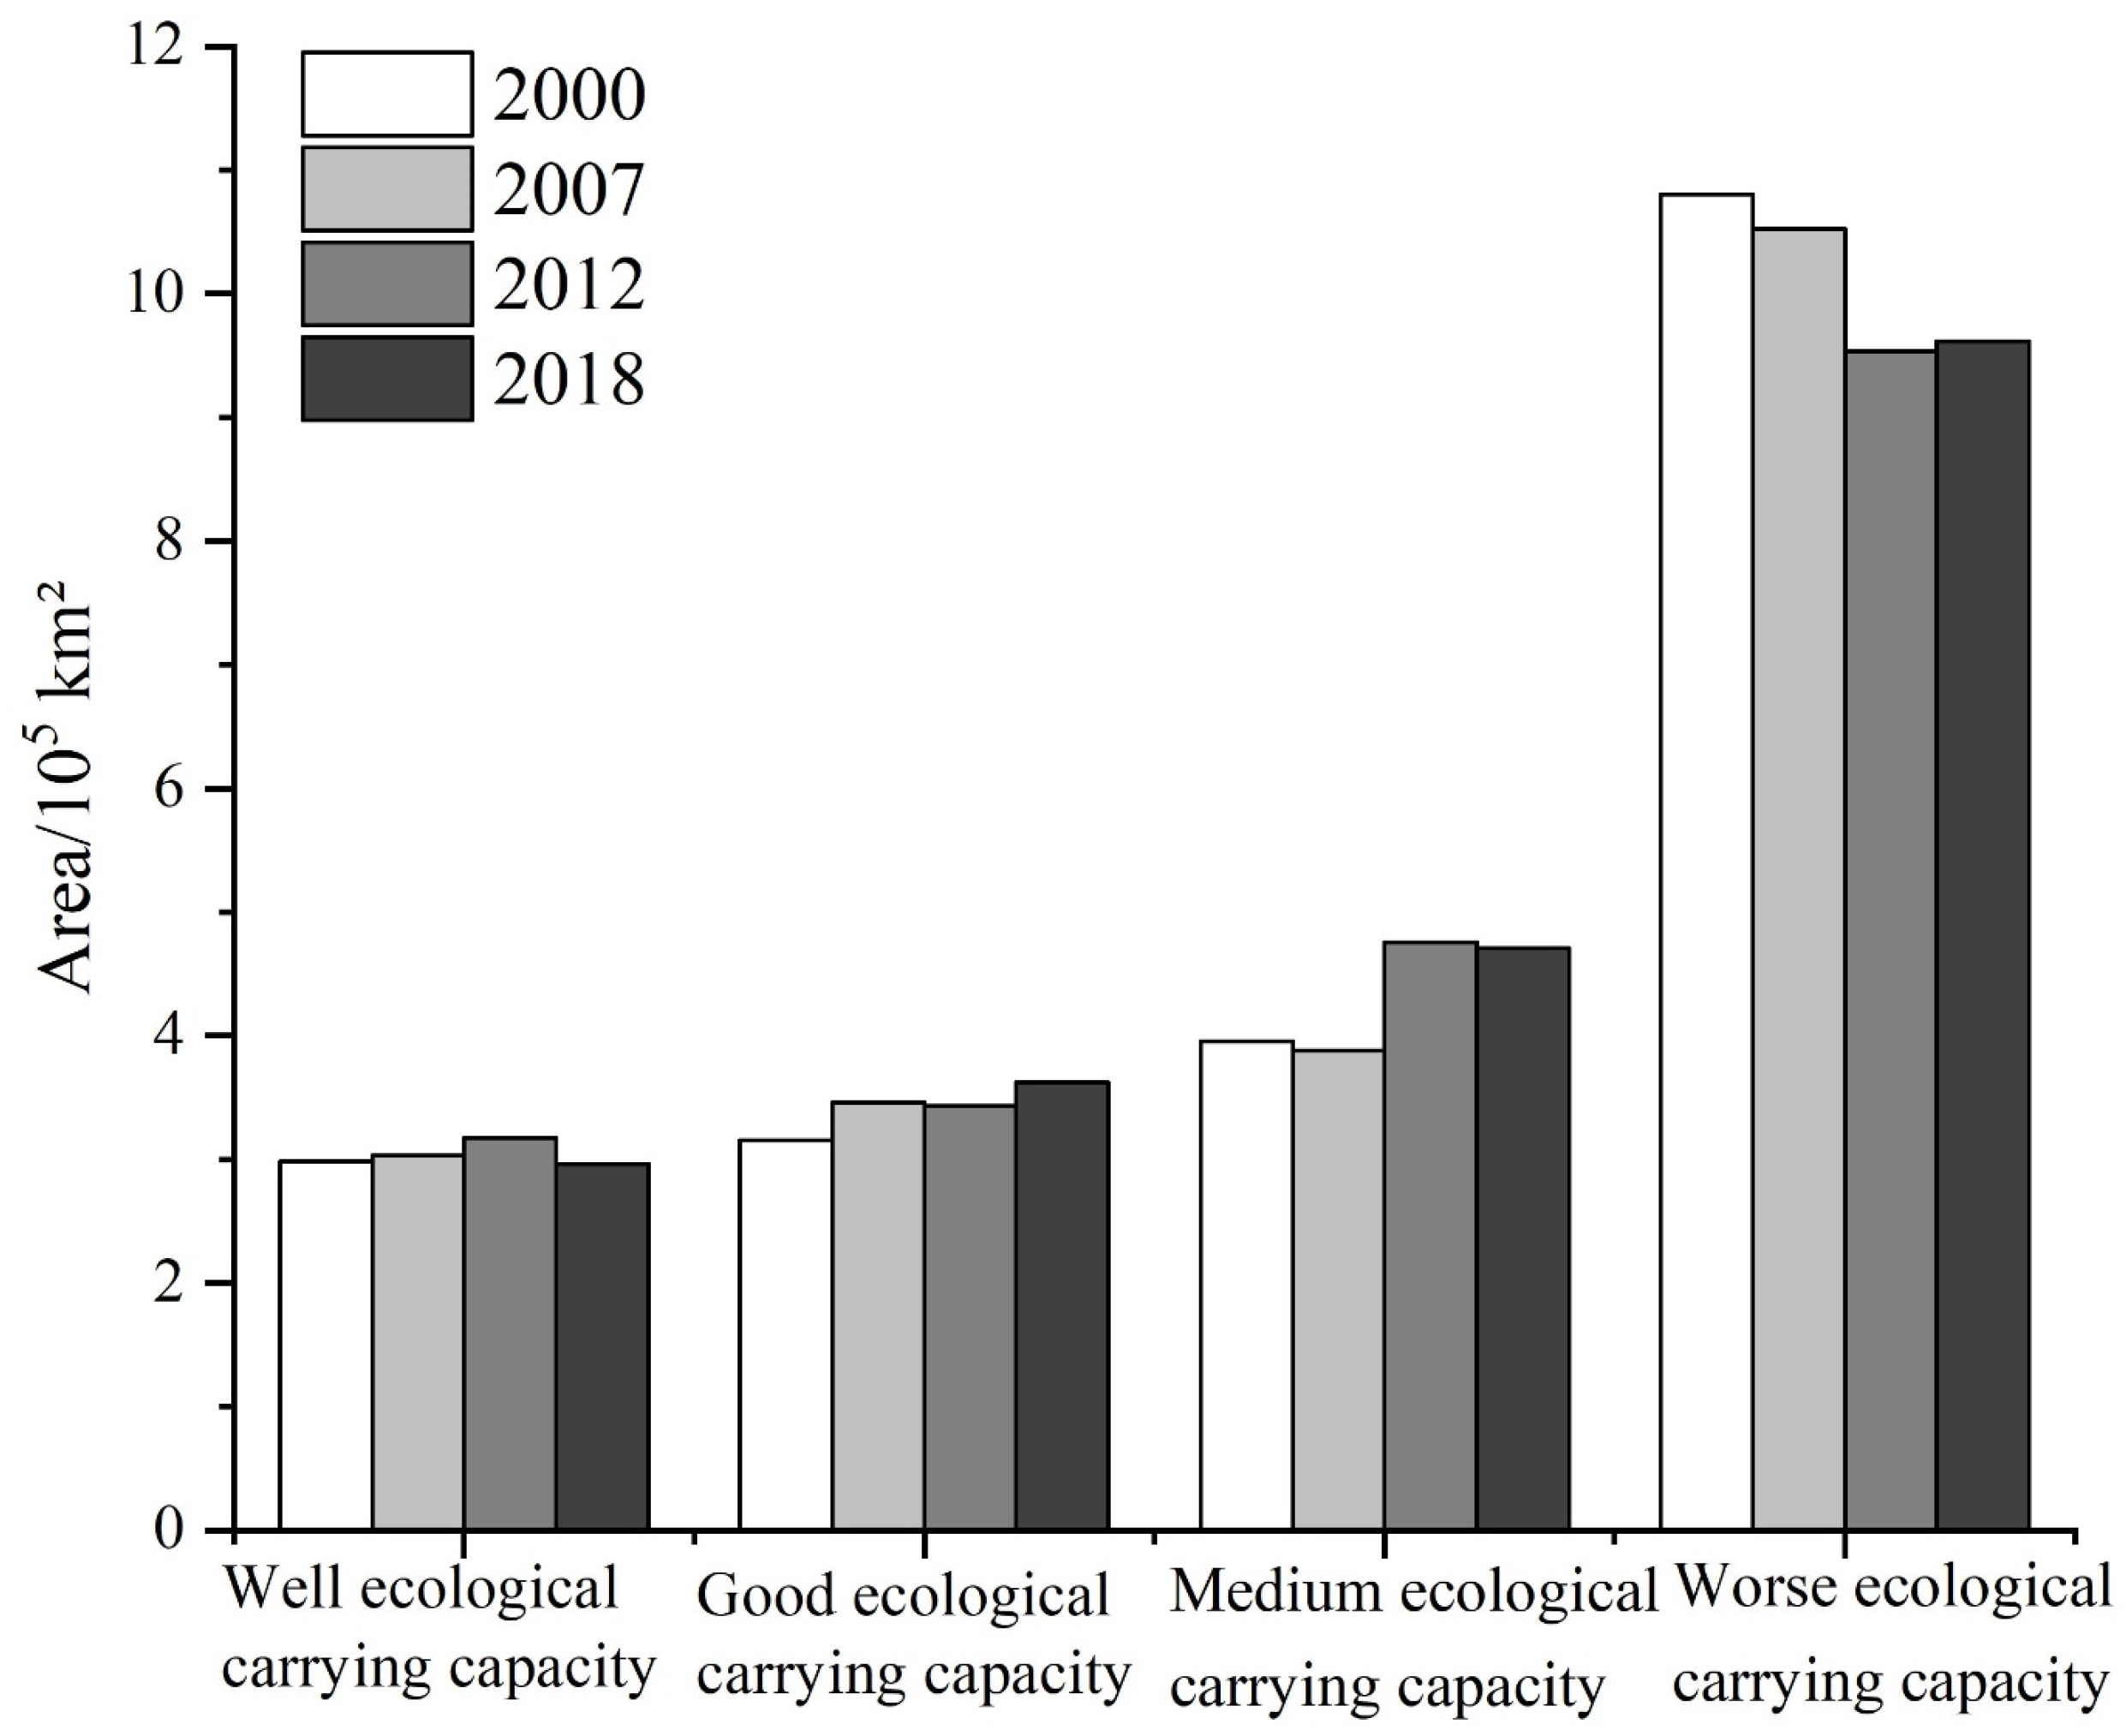
The basic ecological carrying capacity of the northwest arid area under study had no obvious changes. The average ecological carrying capacity decreased from 1.11 in 2000 to 1.07 in 2018, which indicated an improvement in the ecological environment in the northwest arid area (Figure 4). From the distribution of various levels, the Well ecological carrying capacity area was basically unchanged, which was primarily due to it being mainly distributed across the Altai, Tianshan, and Qilian Mountains and other high mountainous areas. These areas have higher altitudes and better ecological background conditions, and most of them are located in the ecological protection core area, which prohibited development; thus, any changes were minimal. The Good and Medium ecological carrying capacity areas are on the rise, and their share of the area increased from 34.02% in 2000 to 39.83% in 2018, which was mainly due to the improvement of the ecological environment in the northwest arid area year by year. Many Worse ecological carrying capacity areas were converted to Medium and Good ecological carrying capacity areas. The Worse ecological carrying capacity area was a rapid decline from 1,080,101 km2 in 2000 to 961,261.6 km2 in 2018, which was primarily related to increasing precipitation in the northwest arid area from 2000–2018, which improved the vegetation conditions and increased ecological protections.
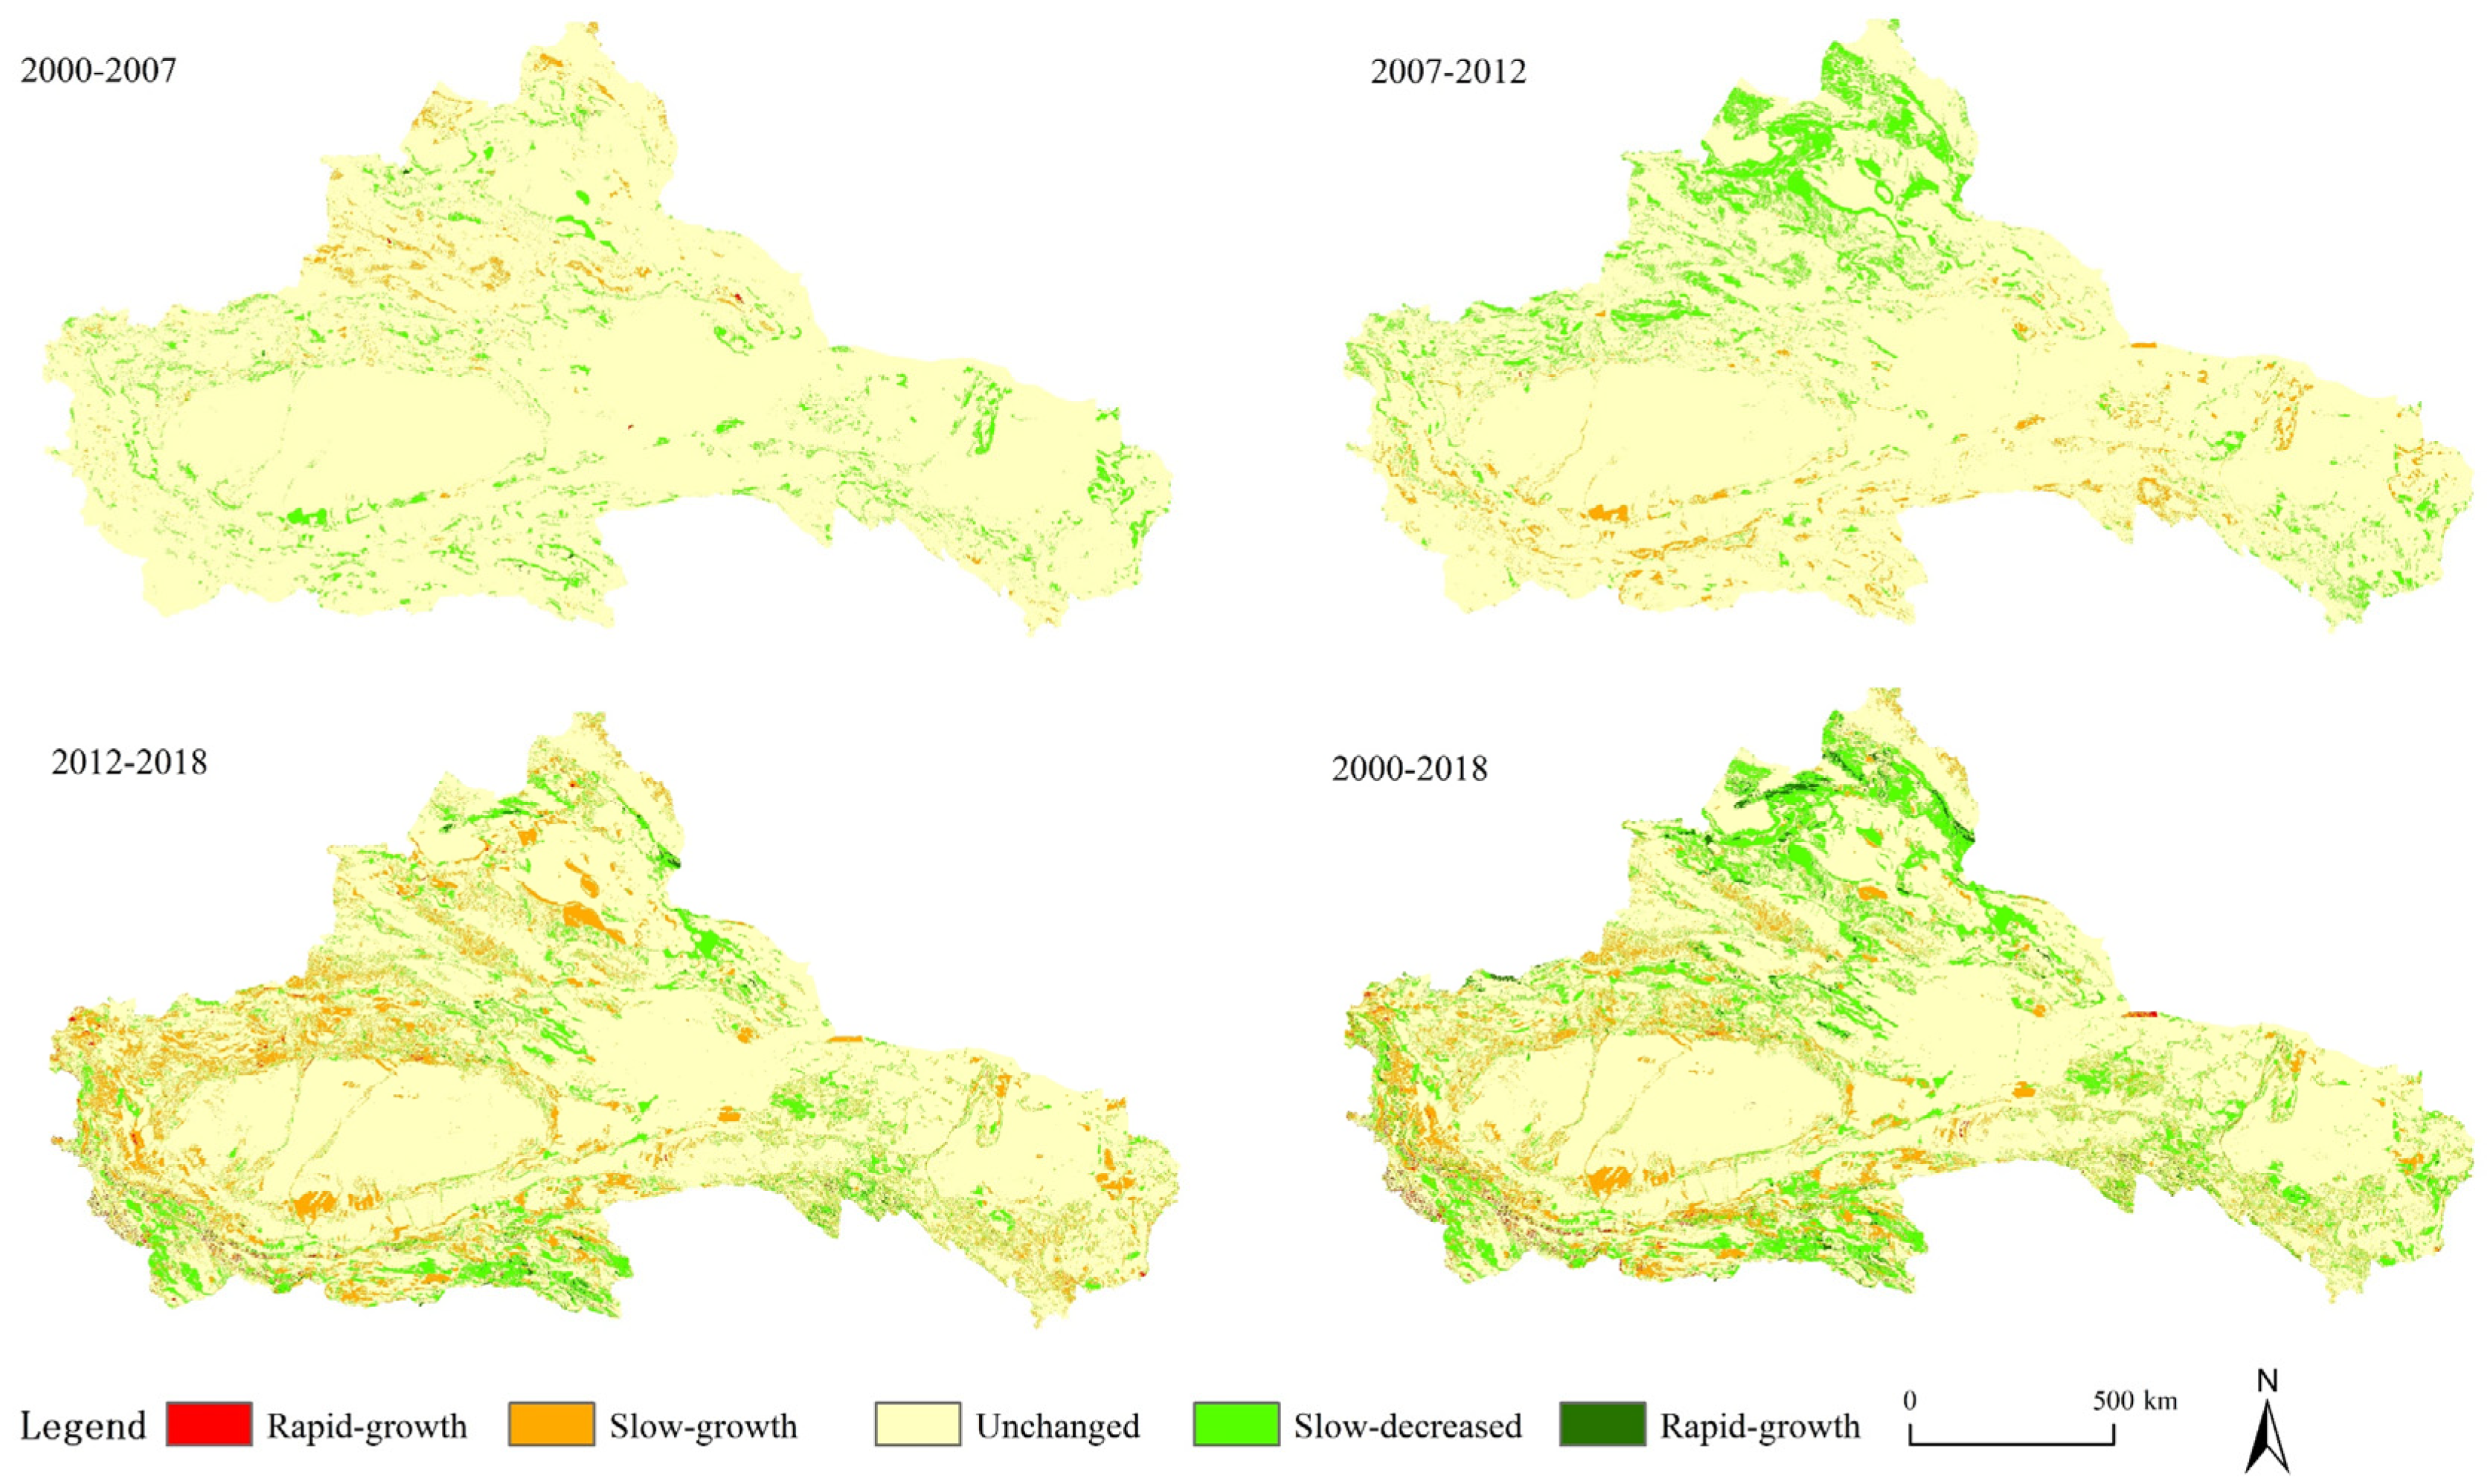
From 2000 to 2007, the ecological carrying capacity of the arid areas of Northwest China was relatively stable, where stable areas accounted for 93.87 percent of the total. The height increase and height reduction areas were sporadically scattered, and the low reduction area was slightly larger than the low increase area. Among them, the low-increase area was mainly distributed across the Tianshan Mountain Range, which is primarily due to the rapid development of the social economy in the early stage of the development of the west. This involved large-scale conversion of grassland to farmland, coupled with the influences of extreme climate. The ecological carrying capacity of the Tianshan area increased from a slight to mild vulnerability. From 2007 to 2012, the overall ecological carrying capacity was relatively stable, the environment continued to improve, the low ecological carrying capacity decreased by 6%, and the distribution of the improved and reduced areas was concentrated.
The area of increase was mainly concentrated in the oasis area of Southern Xinjiang and the Kunlun Mountain Range, and the reduction area is mainly distributed in the northern Xinjiang region. Influenced by climate change, the glaciers in Kunlun Mountain area have melted significantly, with many glaciers degraded to bare rock. However, it still accounted for 79.69 percent of the total area in 2012–2018, although the area of the stable area was 8% lower than from 2007–2012, which was generally stable (Figure 5). The distribution of low-level increase and height reduction areas were more dispersed, the ecological carrying capacity of Kunlun Mountain area decreased, and the ecological carrying capacity of the oasis area and Hexi corridor area of the Taklamakan Desert was on the rise, which was mainly due to the unreasonable development of primary industry, which led to continuous environmental deterioration.
Overall, the ecological environment in the northwest arid area was stable with no obvious changes and improved slightly from 2000 to 2018. Because 60% of the land in the arid areas of Northwest China is the Gobi desert, where there was far less anthropogenic interference, the stable area was the largest, whereas the height increase and height reduction areas were very small, and the sum of the two was less than 2% of the total area. The social economy of the Southern Xinjiang region has developed rapidly in recent years, particularly as relates to the development of primary industry. This has led to a reduction in its ecological background conditions coupled with the increasing population of the region, which has translated to a rapid decline in the per capita ownership of agricultural resources, a steady decline in the ability to cope with changes in the ecological environment, and an increasing ecological carrying capacity.

3.2. Identification and Optimization of Ecological Security Patterns

3.2.1. Identification and Optimization of Ecological Source Areas

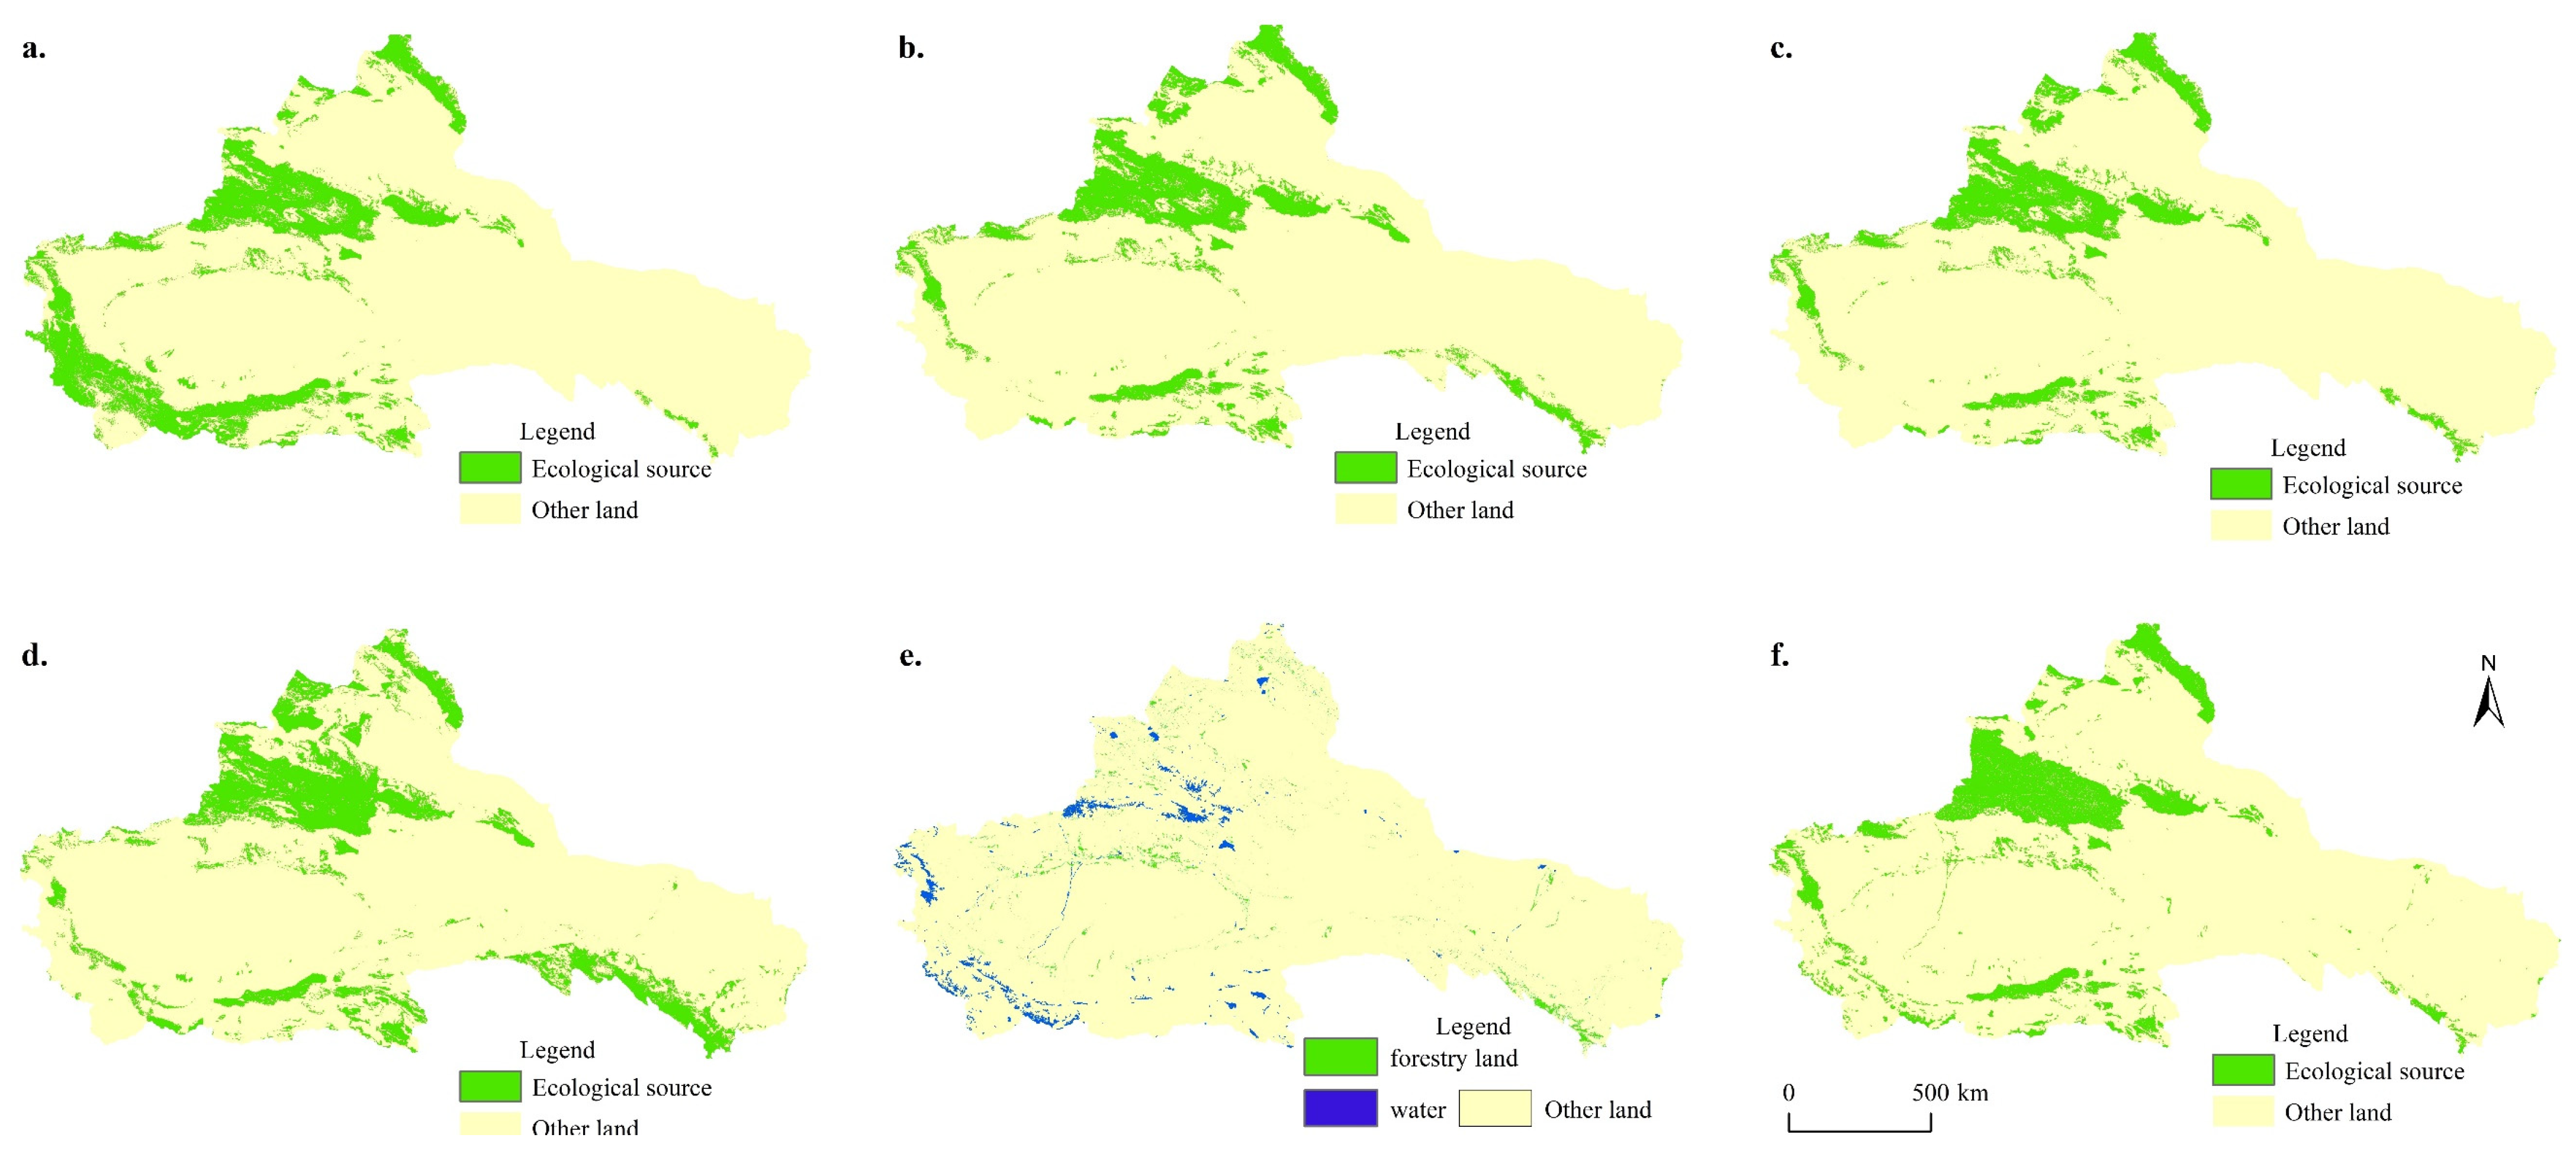
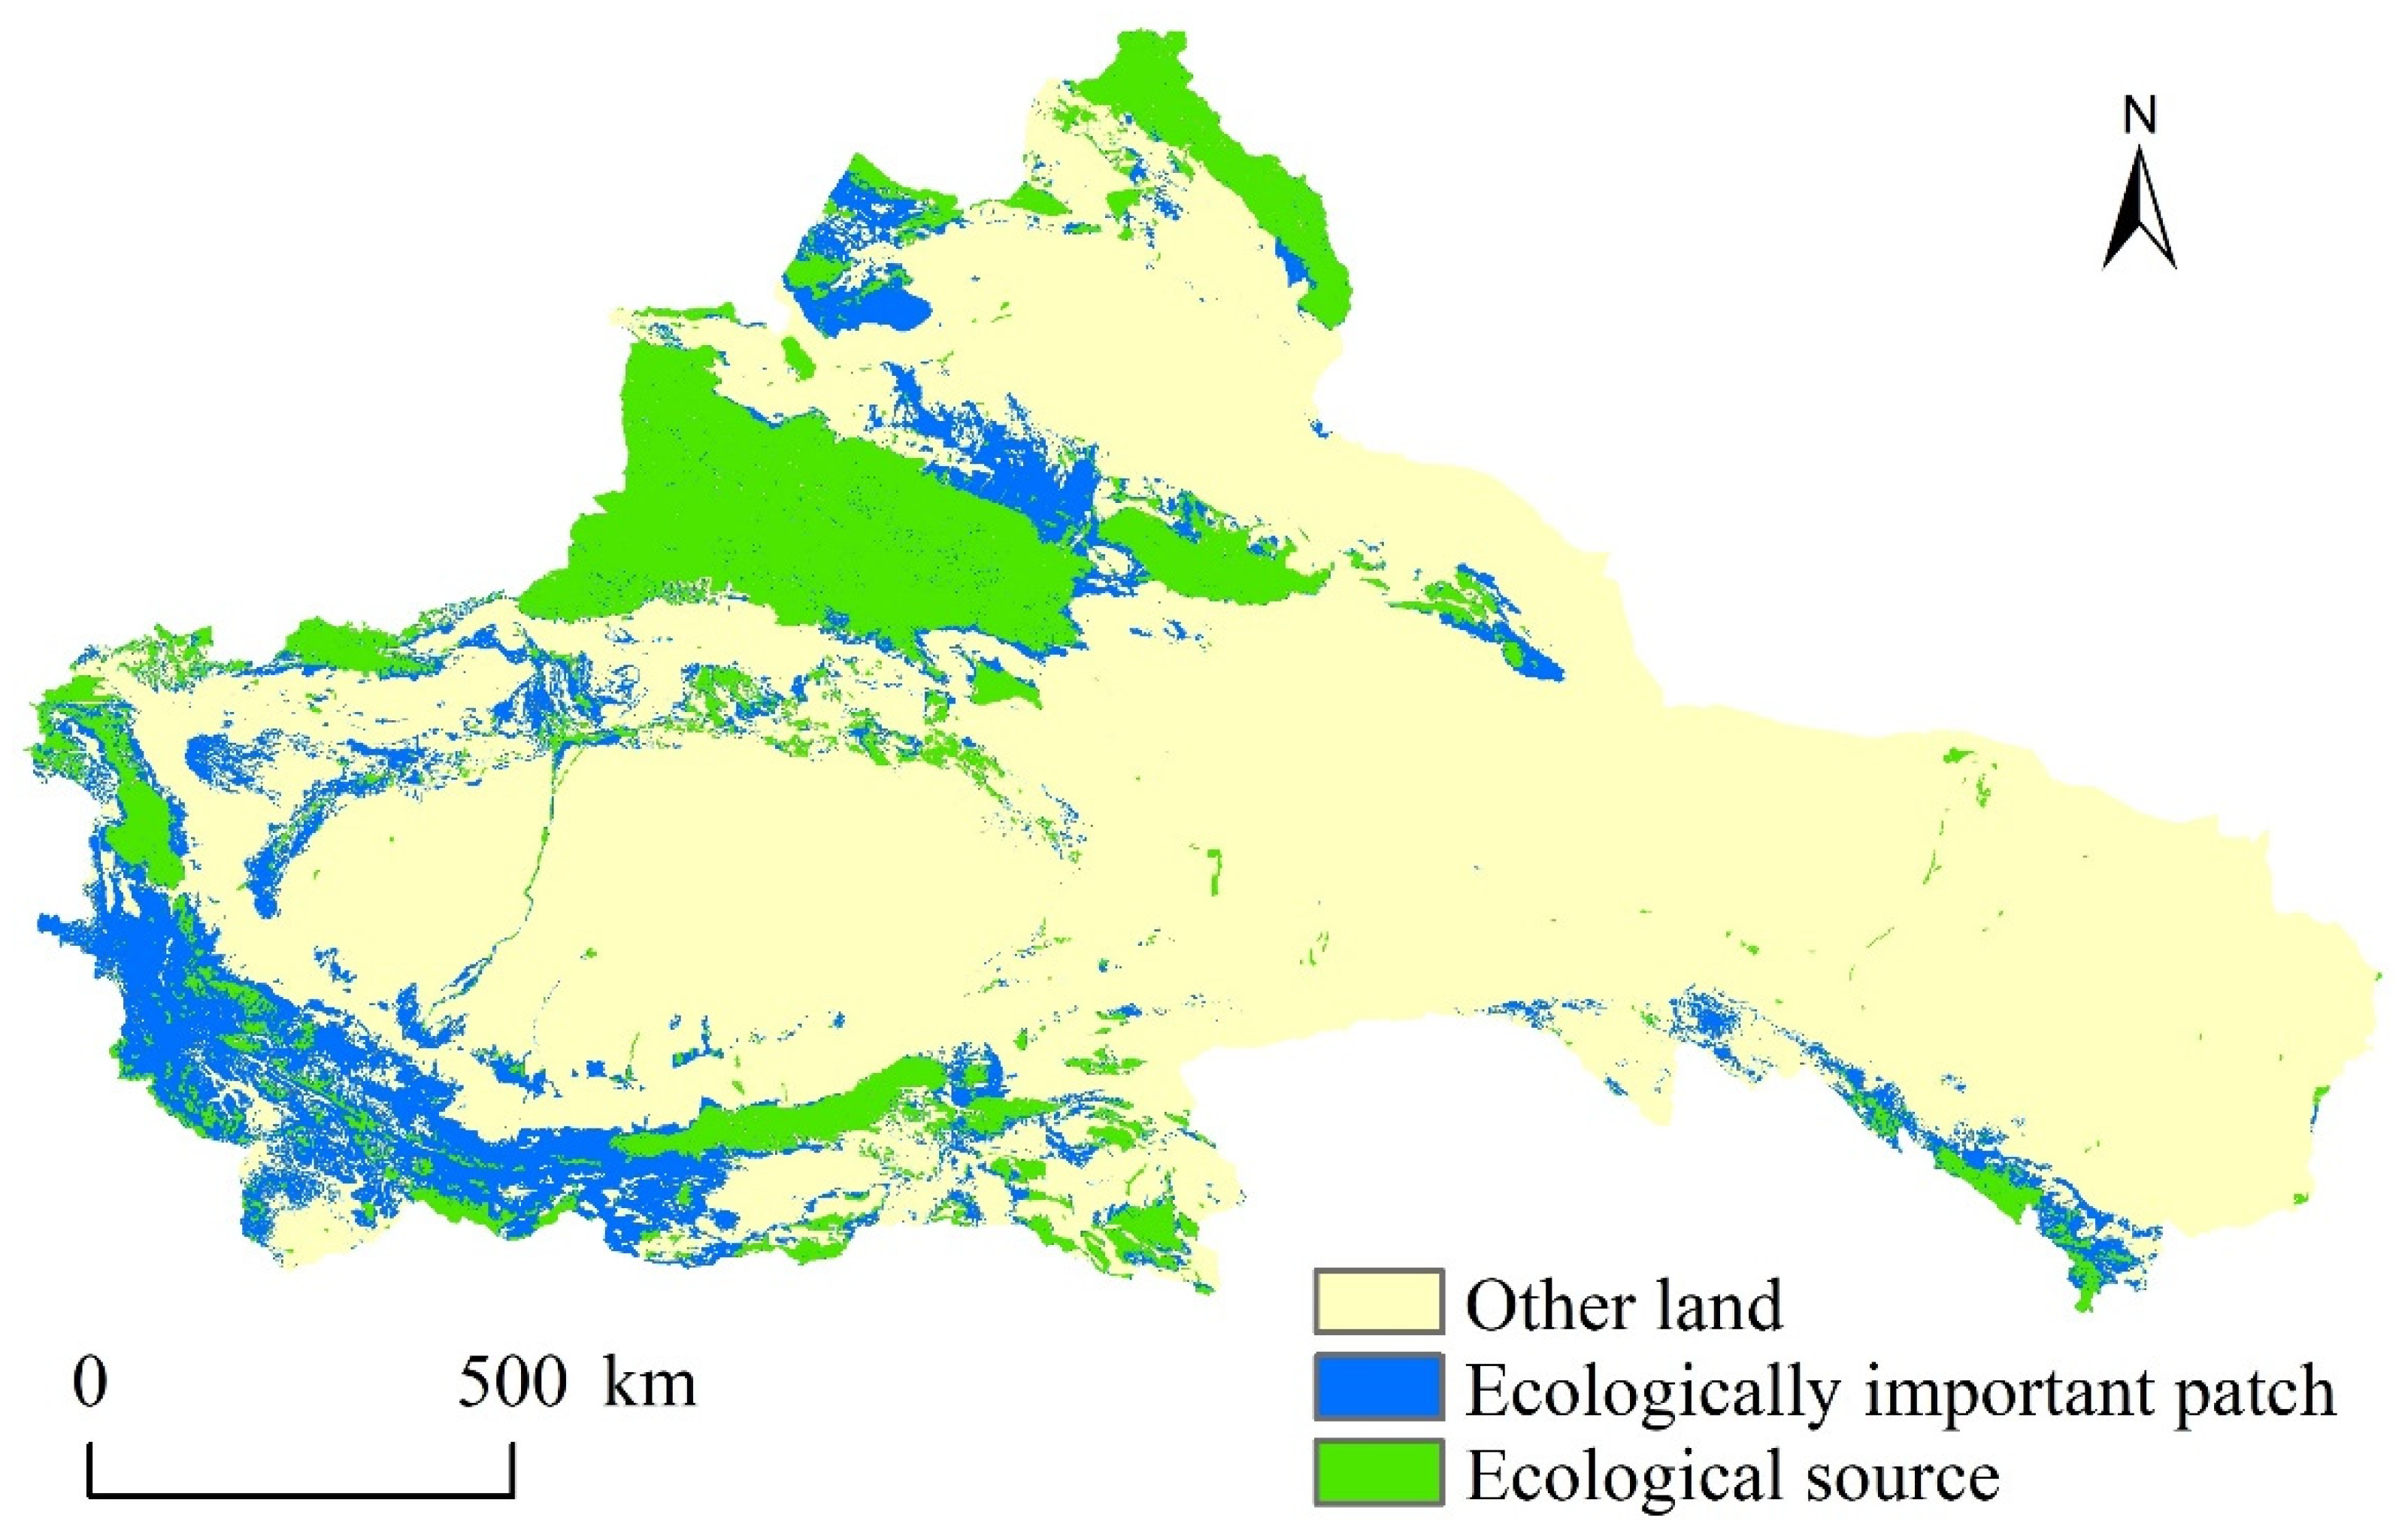
Based on the evaluation results of the ecological carrying capacity in the arid areas of Northwest China, the first 20% of the ecological carrying capacity was selected as the advantage area of ecological carrying capacity (Figure 6a–d) to obtain the ecological sources. Overall, the ecological carrying capacity advantage areas showed a trend of increasing volatility. Consequently, the advantage areas decreased from 337,500 km2 to 255,400 km2 from 2000 to 2012, with the advantage areas increasing to 355,509 km2 from 2012 to 2018. The ecological source of the advantage areas was combined with the forest land and water (Figure 6e) to obtain the final ecological source (Figure 6f). The ecological source area of the northwest arid area was 237,215 km2, which accounted for ~11.35 percent of the total area. Overall, the ecological source of the northwest arid area accounted for a lower proportion of the whole, which was mainly due to the larger proportion of the Gobi Desert in the northwest arid area, where the entire ecological environment was Worse.
Advantage ecological carrying capacity areas have an improved ecological base, where the protection and development of important ecological plaques are conducive to the continuous improvement of the area of the source plaque, which enhances the ecological function of the landscape. As shown in Figure 7, the ecological source of the study area was distributed in the high mountain range area, and the important ecological plaques were distributed in the oasis area around the ecological source area, the Kunlun Mountain area, and the Taklamakan Desert. Relying on Altai Mountain, Tianshan Mountain, Kunlun Mountain, and Qilian Mountain in the northwest arid area, the ecologically protected areas of Altai Mountain, the Tianshan Ecological Reserve, Kunlun Mountain Ecological Reserve, and Qilian Mountain State Reserve were developed to provide ecological protection from socioeconomic development of the northwest arid area.
Judging from the changes in the ecological carrying capacities of the four stages, those of Altai and Tianshan Mountain were smaller, and the ecological environment was better. The ecological carrying capacity of the Kunlun Mountain area gradually decreased, whereas the ecological advantage area decreased continuously, and the ecological advantage area of the Qilian Mountain area increased. Therefore, the monitoring of the glaciers in the Kunlun Mountain area should be strengthened, and a no-go zone should be established to reduce anthropogenic interference and improve the quality of the ecological environment for the important ecological plaque areas under rapid decline.

3.2.2. Landscape Pattern of Ecological Function Zoning

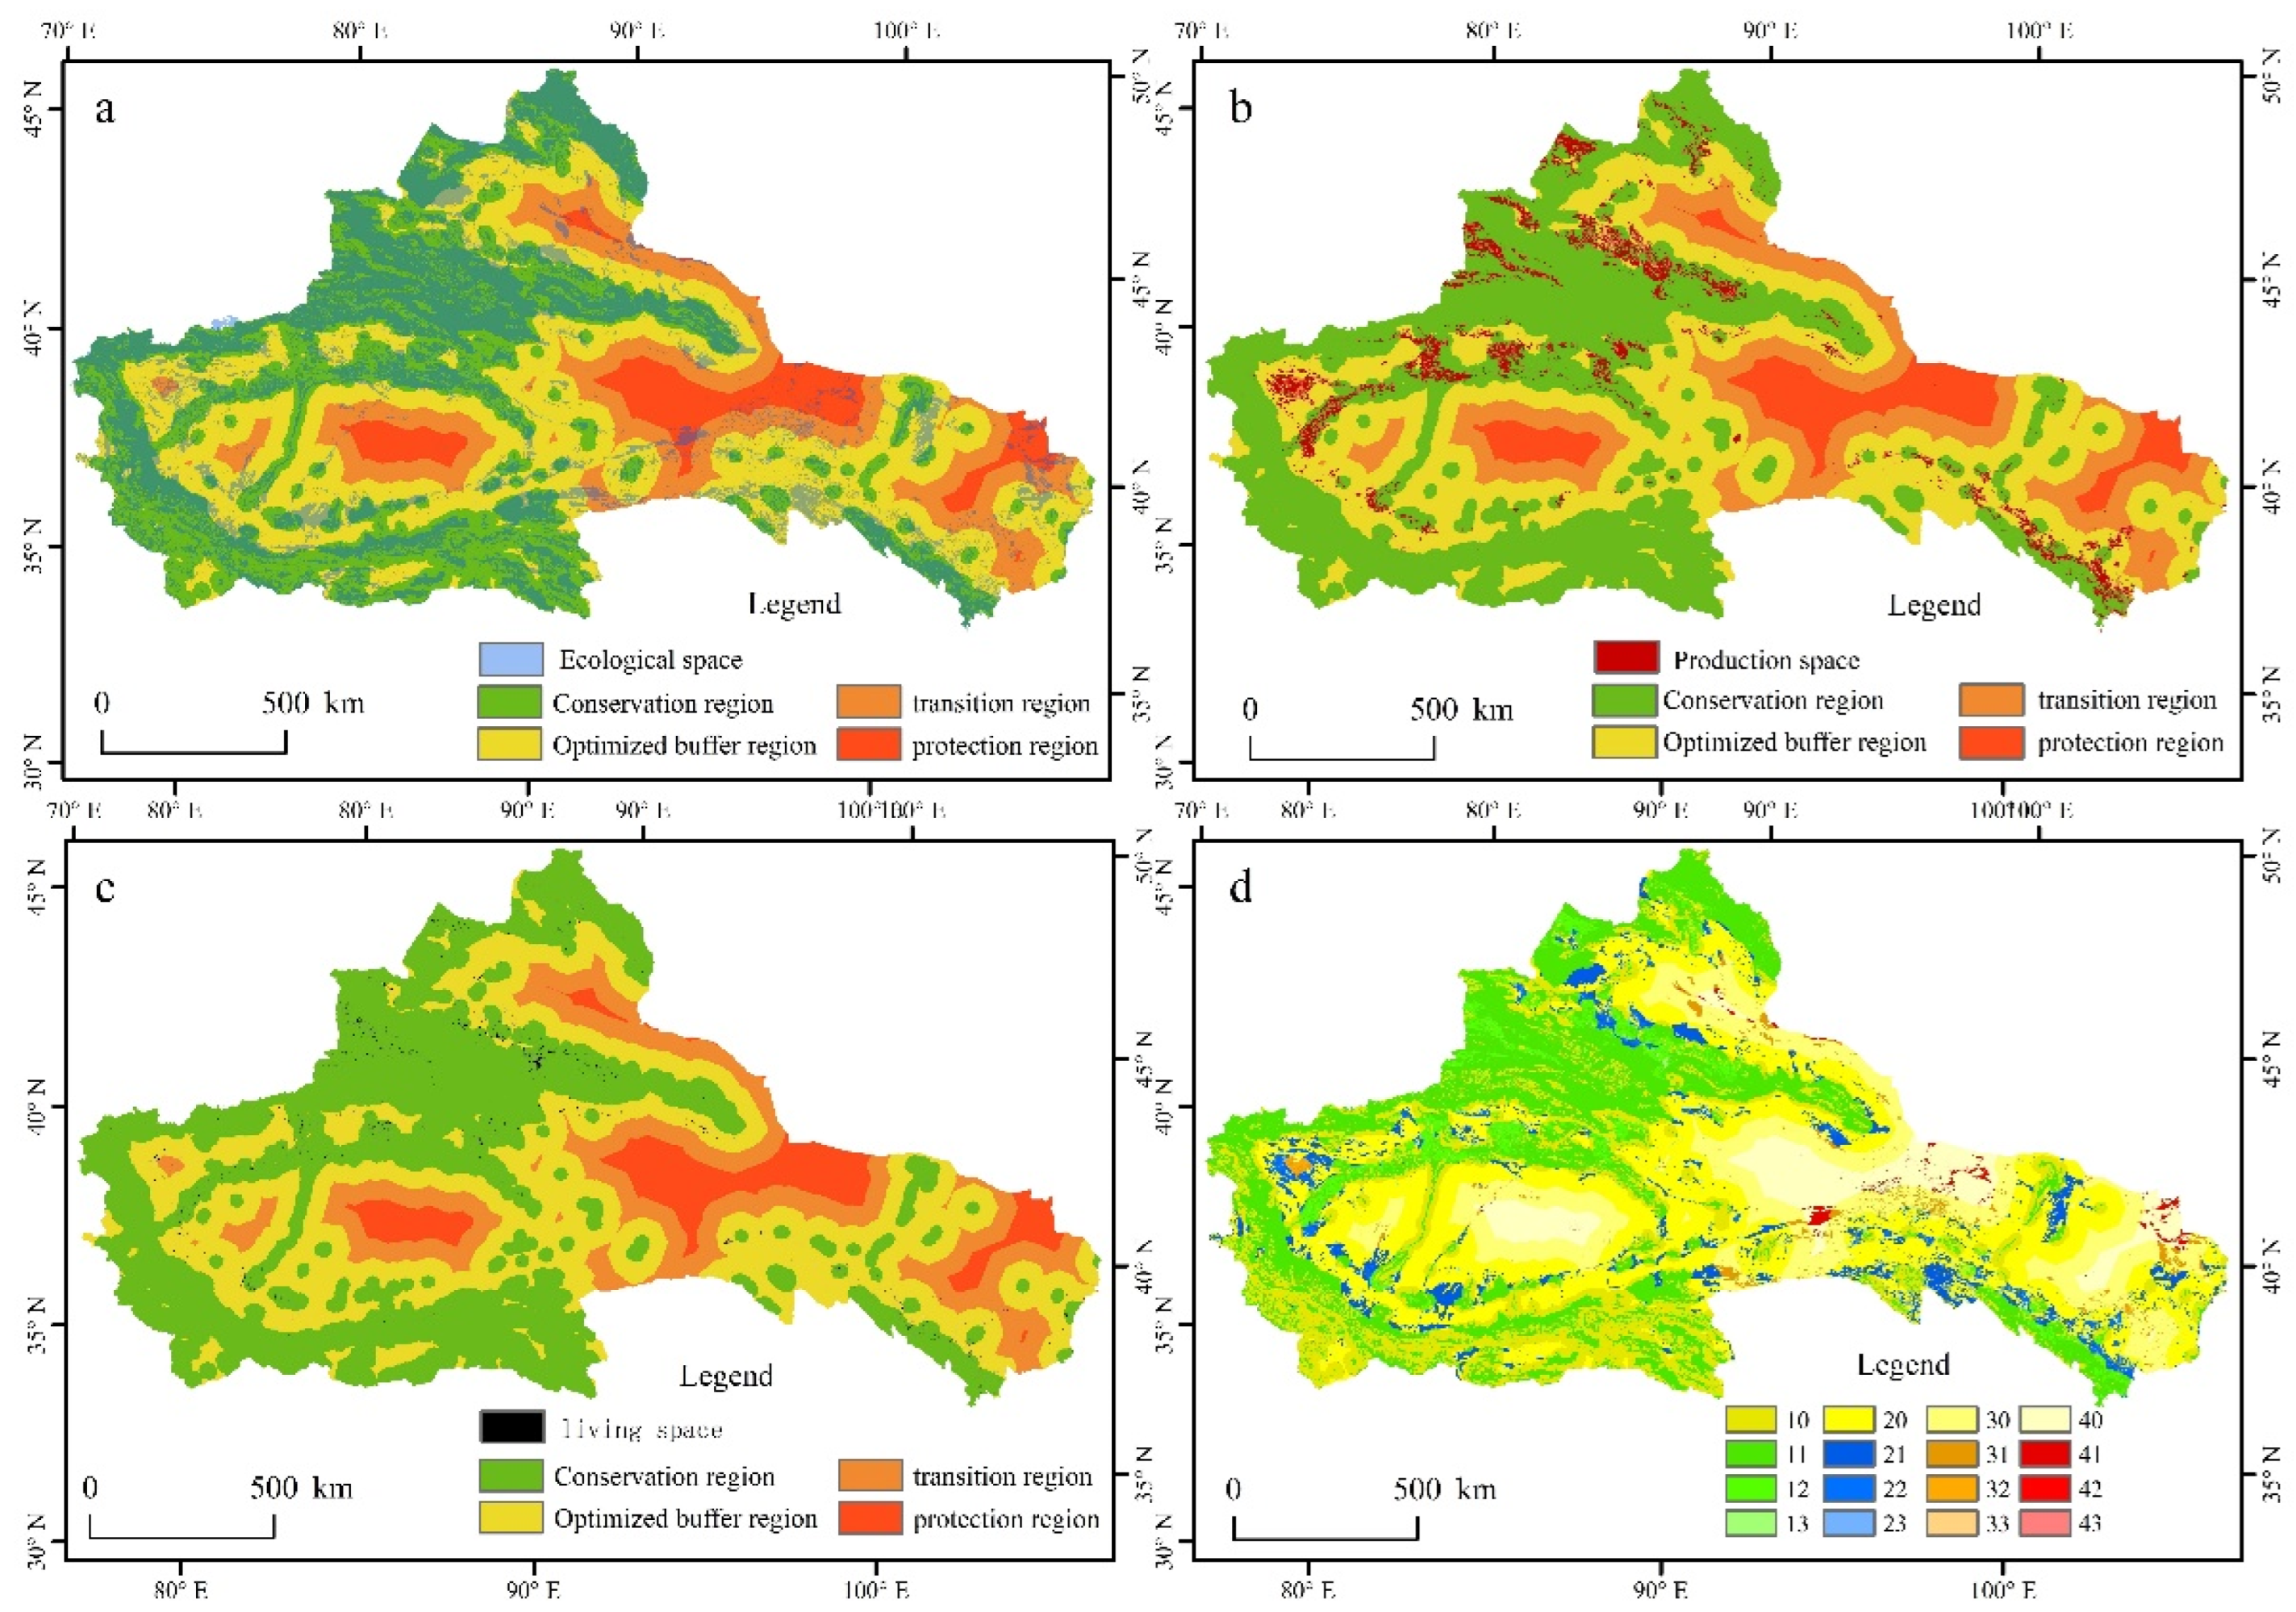
As can be seen in Figure 8, the areas with low cumulative cost were mainly distributed around alpine and water areas, while those with large cumulative consumption distances were primarily distributed in the basin and desert areas, which were further away from the water. Based on the arcGIS10.8 software platform, the study was divided into ecological conservation areas, optimized buffer zones, ecological transition zones, and ecological protection zones by the natural breakpoint method (Figure 8). To better construct the ecological security pattern, this paper superimposed the “three-life land” with the cumulative cost distance to further analyze the ecological security pattern. “Three life” refers to the ecology, production, and living types of land use. Ecoland refers to areas that provide ecological products and services, which include mainly forest land, grassland, and water. Production land refers to functional areas that provide industry and agriculture, primarily arable land, industrial, and mining land, whereas living land refers to the functional areas that provide human habitation, leisure, and recreation, mainly as urban land and rural residential land. For this paper, the land use type in 2015 was used to extract the three-life lands in the arid areas of Northwest China (Figure 8a–c).
The cumulative consumption distance surface and three-way land overlay pattern of the arid areas of Northwest China were calculated according to Equation (9) (Figure 8d). On this basis, we performed a statistical analysis of the ecological security pattern partition (Table 5). The unused area of the optimized buffer zone was mainly distributed in the high mountain range area and the oasis edge area. The ecological environment of the high mountain range area was bad, the ecological environment could be supervised, and the oasis edge area was closer to human settlement areas; thus, it was necessary to reduce human interference to prevent oasis degradation. The results revealed that the ecological environments of the Altai Mountain, Tianshan, and QilianShan Ecological Reserves improved, and their stable development could be maintained. The unused land of ecological conservation areas was mainly distributed across the top of the oasis area and high mountain range; thus, the top area of Kunlun Mountain should be restored and developed from ecological land to other land types. As the unused land of the ecological conservation area of the oasis area was primarily located around the ecological source, it could be enhanced with a vegetation belt to protect its development.
The unused portions of the ecological overuse area and the unused ecological protection area were in the desert hinterland, which strengthened the control of the area and prevented its erosion of the buffer zone. The ecological land of the optimizing buffer zone was mainly distributed in the grasslands of the alpine meadow and oasis areas. Since the ecological environment of the alpine meadow area is extremely fragile, a no-go zone should be established, and the livestock population should be reduced in the oasis areas to prevent grassland degradation. The eco-conservation area production, optimized buffer zone production, optimized buffer zone living, and ecological conservation area living lands were mainly distributed across the oasis area, where most were mainly cultivated lands, in addition to major cities. According to Figure 4, the Southern Xinjiang oasis area should promote the return of farmland to grassland and the development of ecological forests in suitable areas as they have decreased significantly. The ecological environment in the northern foot of Tianshan Mountain and the Hexi area was relatively stable. Ecological transition and protection areas, ecological protection production lands, and ecological protection living spaces are typically grasslands located in the desert. This should serve to reduce the scale of human interference and development while improving the stability of the ecological environment and maintaining the continuity of the source landscape.

3.2.3. Identification and Optimization of Ecological Corridors

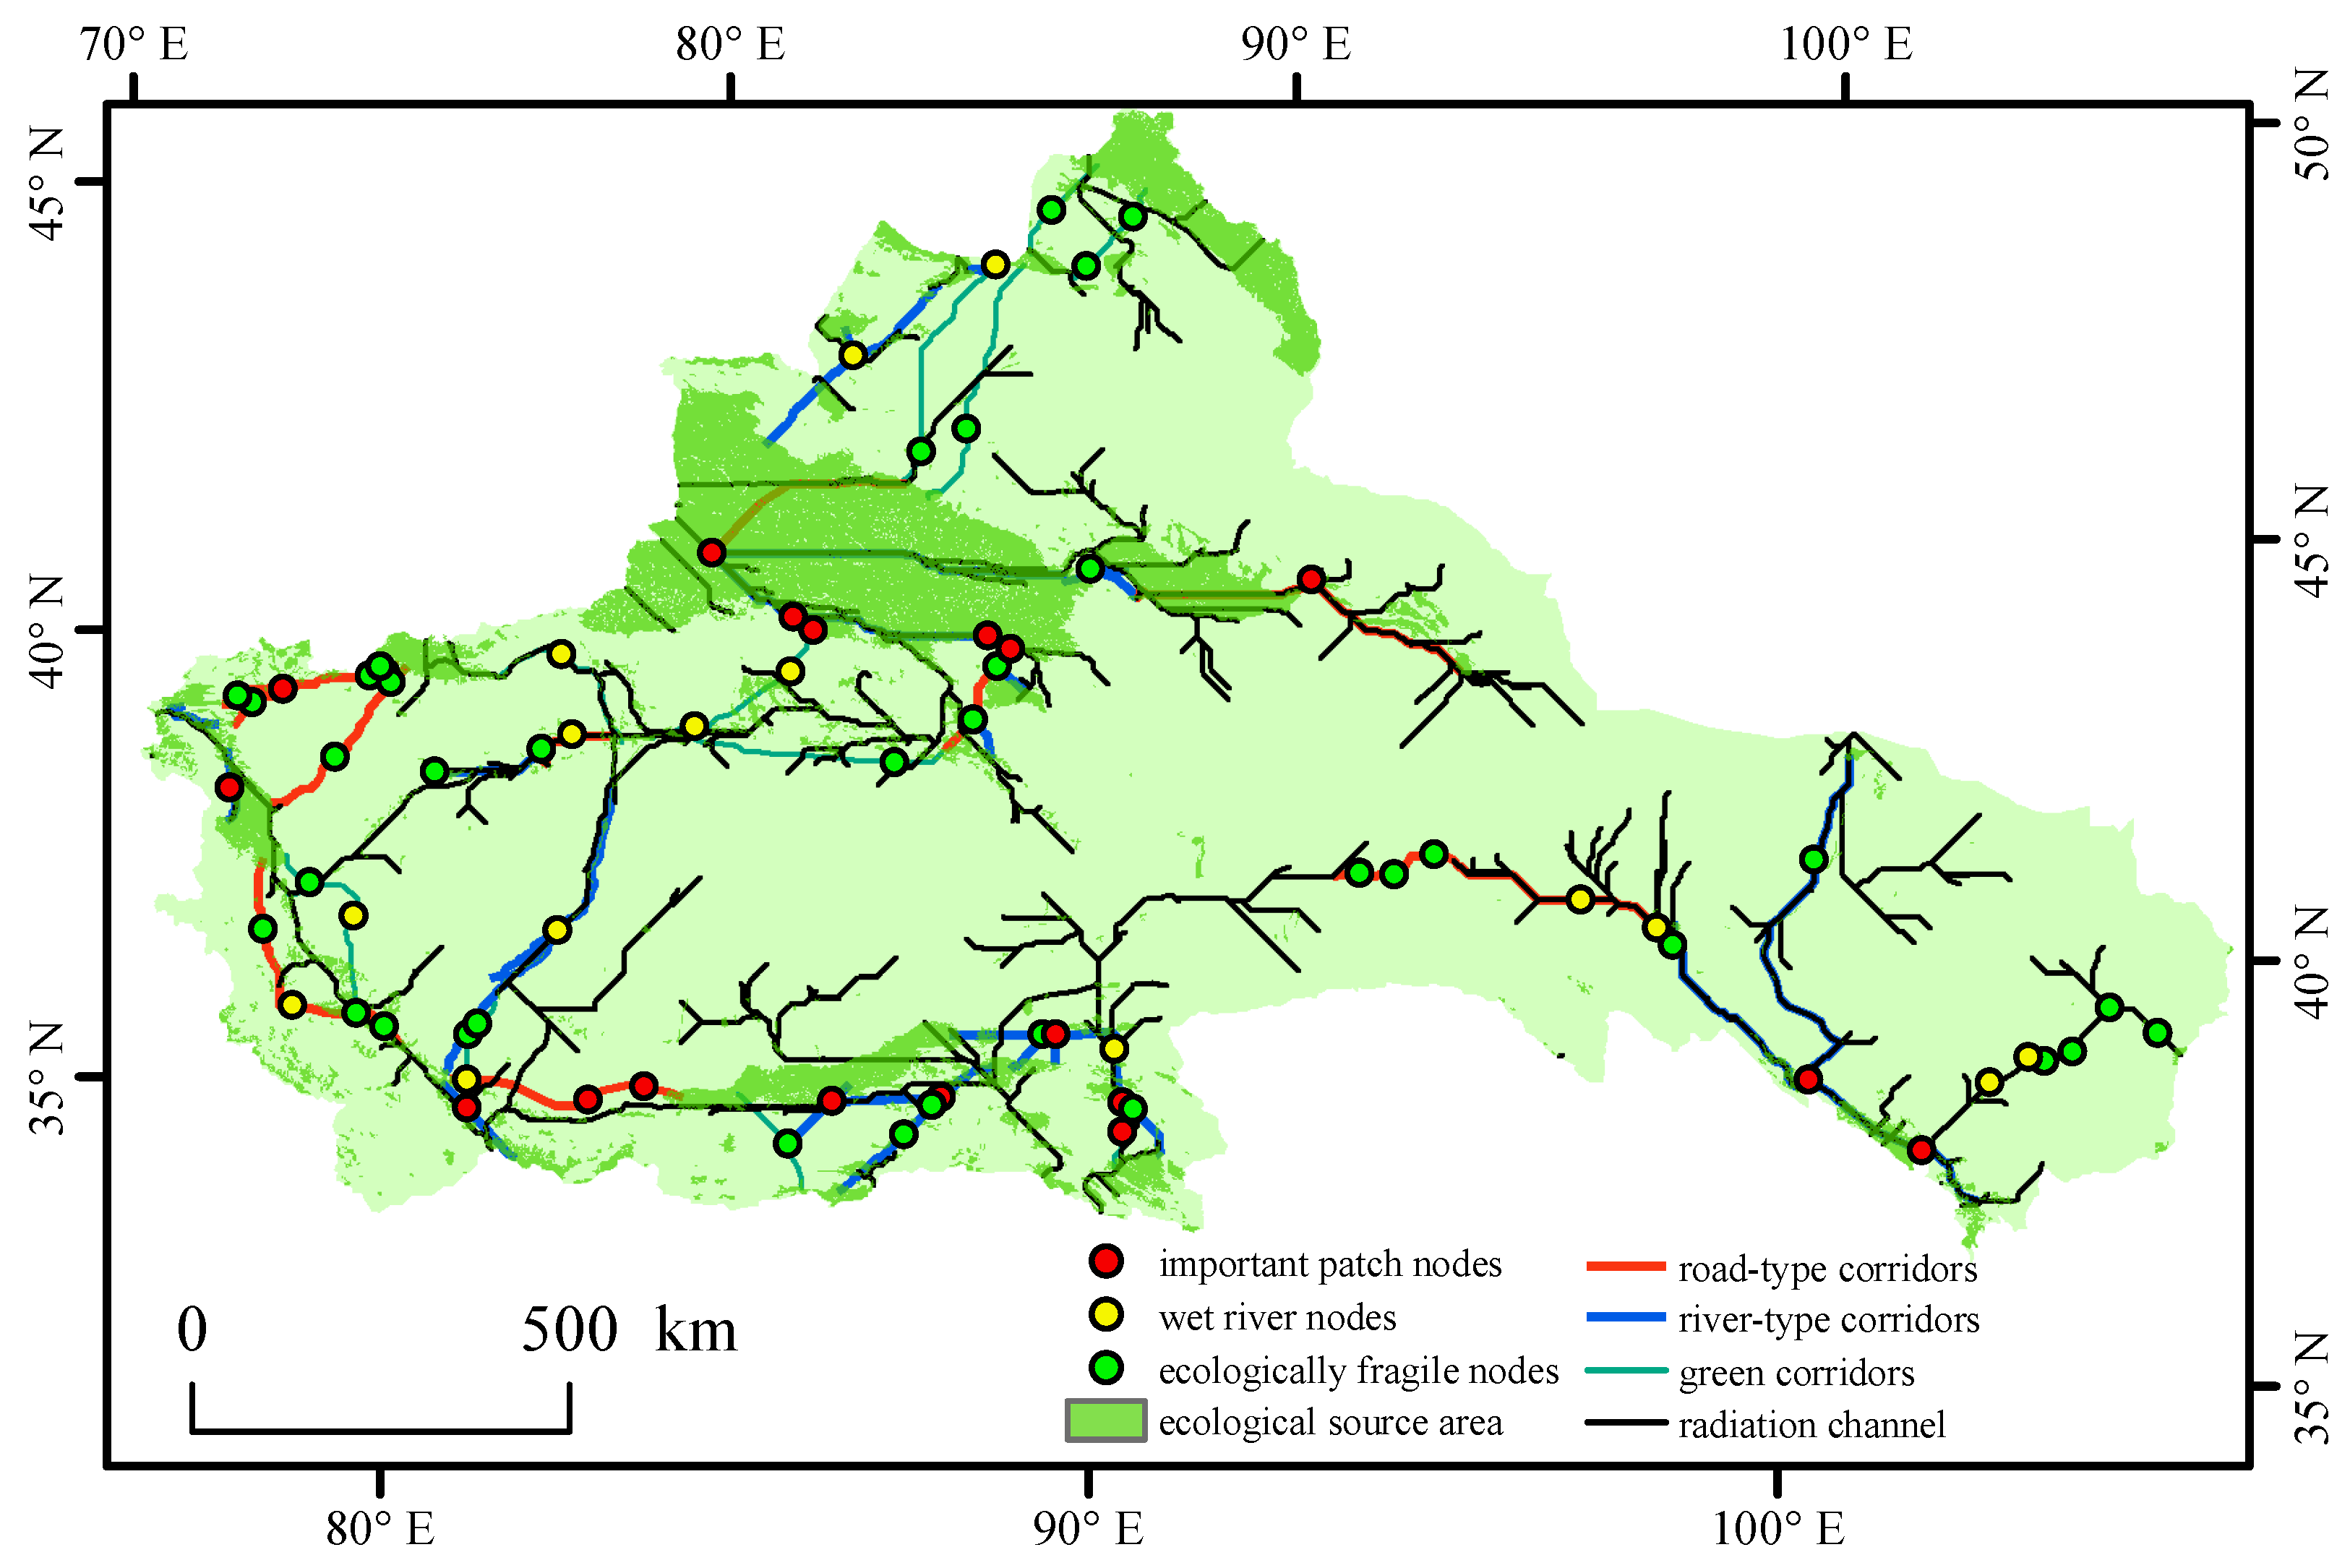
As shown in Figure 9, there were 51 ecological corridors and 949 radiation channels in the study area, with a total length of 7285.43 km, which are mainly distributed in the western region of the study area and less in the central and eastern regions due to the distribution of ecological sources and unique geographical environments. Because of the uneven distribution of ecological sources in the northwest arid area, the network of ecological corridors was low and not conducive to the diffusion of ecological flows. Thus, it was necessary to increase the number of corridors and improve the connectivity of ecological sources through the development of radiation channels in the structure of ecological networks. Strengthening the material circulation of existing corridors and increasing the number of corridors are the two most important ways to optimize corridors.
The results of the optimization pattern (Figure 9) revealed that the existing ecological corridors and radiation corridors were divided into road-type, river-type, and green corridors. Road-type corridors mainly selected G30, G7, G3014, and other high-speed 312, 227, G217, and other countries Lanxin Railway, Xinjiang Railway, and other railways were the focus of road corridor construction in the northwest arid area. The material flow between ecological plates was improved by strengthening the width of the green belts on both sides of the road. The river corridor mainly selected the Shiyang, Black, Dredging, Tarim, and Ili Rivers as its development focus. Because the river flow in the northwest arid area is small, it is necessary to limit the development of the river oasis to protect the river corridor. The green ecological corridor mainly selected the important ecological plaque and continuous oasis as the development focus, which restricted the development of the oasis area and improved the ecological environment quality of the oasis area, which then improved the organic connection between the ecological plates.

3.2.4. Extraction and Analysis of Ecological Nodes

Through the analysis of the “ridge line” and “valley line” of the cumulative cost-distance surface, a total of 71 ecological nodes were extracted. There were 15 ecological nodes distributed across the river flow area, 38 ecological nodes distributed in important ecological plaque areas such as mountains and foothills, and 18 ecological nodes located between important ecological plaques (Figure 9) from the specific location of the distribution of ecological nodes.
According to the concept of ecological nodes and the natural geographical characteristics of the research area, the ecological nodes of the northwest arid area were divided into three categories (important patch nodes, wet river area nodes, and ecologically fragile area nodes). Among them, the ecologically fragile area nodes comprised the largest proportion and accounted for more than 50% of the ecological area. They were primarily located at the intersections between the maximum and minimum consumption paths, where the ecological environment is very fragile. They are important species migration sites; thus, no-go zones should be established to ensure the integrity of regional ecological structures and the circulation of materials. Most of the important plaque nodes were located at the intersections of ecological corridors, with significant material circulation. Recently, the Qilian and Kunlun Mountain areas have been greatly impacted by human activities; thus, the degree of landscape fragmentation has increased.
Therefore, it is necessary to reduce anthropogenic interference in protected areas to maintain the stability of important ecological plaques. Water resources are critical for the restriction of biological activities in the northwest arid area, and rivers are very important to the development of the ecological environment. The rivers in the northwest arid area are mainly inland, and the flow rates are relatively small. Many rivers flow through the desert and other areas where the ambient environment is harsh; thus, the development of nodes in the wet river areas should be reduced when optimizing patterns to maintain their overall ecological integrity.

4. Conclusions

From the development of the western region in 2000 to the popularization of the theory of “two mountains” [35], increasing attention has been paid to the protection of ecosystems in the arid area of Northwest China. With this background, our study employed the spatial main component analysis method (SPCA) to systematically monitor and evaluate the ecological carrying capacity of the arid regions of Northwest China toward the development of sustainable ecological security patterns. The following conclusions were obtained:
(1) On the whole, the ecological carrying capacity of the northwest arid region was weak, with the ecological carrying capacity increasing from east to west. The Good and Well ecological carrying capacity areas were primarily distributed across the Altai, Tianshan, Kunlun, and Qilian Mountains and other regions. The Weak and Medium ecological carrying capacity areas were primarily distributed across the Junger Basin, Tarim Basin, and Alashan Plateau.
(2) From changes in the spatiotemporal characteristics of the ecological carrying capacity, the Weak carrying capacity of these areas decreased, while the Well carrying capacity increased. The Hexi region, Northern Xinjiang region and Western Inner Mongolia showed a general upward trend, while the southern Xinjiang portion showed a downward trend. The Bayingolin Mongol Autonomous Prefecture, Yili Kazak Autonomous Prefecture, Altay City, and Hami City, for the most part, remained unchanged. Overall, the ecological carrying capacities of the northwest arid areas increased slightly but steadily.
(3) Based on the results of the monitoring and assessment of the ecological carrying capacities, as well as the unique geographical characteristics of arid areas of Northwest China, the ecological source area was extracted as 237,215 km2, which accounted for 11.35 percent of the total study area. Generally, the ecological source area accounted for a low proportion of the whole, and the distribution of the ecological source areas was uneven. The ecological sources of the north area were higher than the south, and those of the west were higher than the east. From the topographical perspective, the ecological source areas were mainly distributed across the high mountain range area, with the basin areas having fewer than the mountainous regions.
(4) Based on the MCR model and land use data, the arid areas of Northwest China were divided into sixteen ecological safety pattern partitions, and three types of corridors, such as road, river, and green corridors, were extracted. Further, three types of important plaque nodes were identified, such as river wet area nodes and ecologically fragile area nodes, and then optimized in combination with the ecological carrying capacity monitoring and evaluation results.
However, ecological carrying capacities are complex systems. The comprehensiveness and scientific nature of the selected indexes directly determined the accuracy of the results in the evaluation of ecological carrying capacities. Thus, the ecological carrying capacities were evaluated using spatial principal component analysis (SPCA) from seventeen indexes with three criteria levels, which took into account characteristics of the natural environment, such as hydrology, soil, and vegetation, and the social environment, such as urban, population, and economy. However, the data collection was confronted with great challenges due to the extensive scope, large areas, and significant regional differences, particularly in terms of the accuracy of the spatial rastering of statistics. Therefore, future research work should further study and perfect the aspects of index refinement and data spatialization. However, in terms of the macro-guidance of ecological management and ecological pattern optimization, this study provides new perspectives on the aspects of ideas and methods, which are worthy of attention as references in the future.
Author Contributions

Conceptualization, X.C.; data curation, X.C.; methodology, X.C.; software, X.C.; formal analysis, H.H.; funding acquisition, J.J.; investigation, J.J.; supervision, J.J. and X.L.; validation, W.Z.; visualization, H.W.; writing—original draft, X.C.; writing—review and editing, J.L. All authors have read and agreed to the published version of the manuscript.

Funding

The research was funded by the National Key Research and Development Program of China (Grant No.: 2018YFC1903700). The Fundamental Research Funds for the Central Universities (Grant No.: lzujbky-2020-71).

Institutional Review Board Statement

Not applicable.

Informed Consent Statement

Not applicable.

Data Availability Statement

Not applicable.

Conflicts of Interest

The authors declare no conflict of interest.

References

  1. Gibbs, D.; Longhurst, J. Sustainable development and environmental technology: A comparison of policy in Japan and the European Union. Environmentalist 1995, 15, 196–201. [Google Scholar] [CrossRef]
  2. Rockström, J.; Steffen, W.; Nossone, K.; Persson, Å.; Chapin, F.S., III; Lambin, E.; Lenton, T.M.; Scheffer, M.; Folke, C.; Schellnhuber, H.J.; et al. Planetary Boundaries: Exploring the Safe Operating Space for Humanity. Ecol. Soc. 2009, 14, 140232. [Google Scholar] [CrossRef]
  3. Costanza, R. Economic growth, carrying capacity, and the environment. Ecol. Econ. 1995, 15, 89–90. [Google Scholar] [CrossRef]
  4. Graymore, M.L.M.; Sipe, N.G.; Rickson, R.E. Sustaining Human Carrying Capacity: A tool for regional sustainability assessment. Ecol. Econ. 2010, 69, 459–468. [Google Scholar] [CrossRef]
  5. Filgueira, R.; Guyondet, T.; Thupaki, P.; Sakamaki, T.; Grant, J. The effect of embayment complexity on ecological carrying capacity estimations in bivalve aquaculture sites. J. Clean. Prod. 2021, 288, 125739. [Google Scholar] [CrossRef]
  6. Świąder, M.; Lin, D.; Szewrański, S.; Kazak, J.K.; Iha, K.; van Hoof, J.; Belčáková, I.; Altiok, S. The application of ecological footprint and biocapacity for environmental carrying capacity assessment: A new approach for European cities. Environ. Sci. Policy 2020, 105, 56–74. [Google Scholar] [CrossRef]
  7. Myötyri, E.; Pulkkinen, U.; Simola, K. Application of stochastic filtering for lifetime prediction. Reliab. Eng. Syst. Saf. 2006, 91, 200–208. [Google Scholar] [CrossRef]
  8. Reza, M.I.H.; Abdullah, S.A. Regional Index of Ecological Integrity: A need for sustainable management of natural resources. Ecol. Indic. 2011, 11, 220–229. [Google Scholar] [CrossRef]
  9. Niccolucci, V.; Bastianoni, S.; Tiezzi, E.B.P.; Wackernagel, M.; Marchettini, N. How deep is the footprint? A 3D representation. Ecol. Model. 2009, 220, 2819–2823. [Google Scholar] [CrossRef]
  10. Banos-González, I.; Martínez-Fernández, J.; Esteve-Selma, M.Á. Dynamic integration of sustainability indicators in insular socio-ecological systems. Ecol. Model. 2015, 306, 130–144. [Google Scholar] [CrossRef]
  11. Wei, X.; Shen, L.; Liu, Z.; Luo, L.; Wang, J.; Chen, Y. Comparative analysis on the evolution of ecological carrying capacity between provinces during urbanization process in China. Ecol. Indic. 2020, 112, 106179. [Google Scholar] [CrossRef]
  12. Li, Y.; Zhou, G.Z.J. Establishment of Evaluation Index System of Ecological Carrying Capacity in Changping District Pusalu Village. Procedia Environ. Sci. 2011, 11, 899–905. [Google Scholar] [CrossRef] [Green Version]
  13. Peng, J.; Du, Y.; Liu, Y.; Hu, X. How to assess urban development potential in mountain areas? An approach of ecological carrying capacity in the view of coupled human and natural systems. Ecol. Indic. 2016, 60, 1017–1030. [Google Scholar] [CrossRef]
  14. Fuju, X.I.E.; Mingxi, Z.; Hong, Z. Research on Ecological Environmental Carrying Capacity in Yellow River Delta. Energy Procedia 2011, 5, 1784–1790. [Google Scholar] [CrossRef] [Green Version]
  15. Wu, X.; Hu, F. Analysis of ecological carrying capacity using a fuzzy comprehensive evaluation method. Ecol. Indic. 2020, 113, 106243. [Google Scholar] [CrossRef]
  16. Wei, W.; Zhang, X.; Cao, X.; Zhou, L.; Xie, B.; Zhou, J.; Li, C. Spatiotemporal dynamics of energy-related CO2 emissions in China based on nighttime imagery and land use data. Ecol. Indic. 2021, 131, 108132. [Google Scholar] [CrossRef]
  17. Wei, W.; Zhang, X.; Zhou, L.; Xie, B.; Zhou, J.; Li, C. How does spatiotemporal variations and impact factors in CO2 emissions differ across cities in China? Investigation on grid scale and geographic detection method. J. Clean. Prod. 2021, 321, 128933. [Google Scholar] [CrossRef]
  18. Amaral, S.; Câmara, G.; Monteiro, A.M.V.; Quintanilha, J.A.; Elvidge, C.D. Estimating population and energy consumption in Brazilian Amazonia using DMSP night-time satellite data. Comput. Environ. Urban Syst. 2005, 29, 179–195. [Google Scholar] [CrossRef]
  19. Levin, N.; Duke, Y. High spatial resolution night-time light images for demographic and socio-economic studies. Remote Sens. Environ. 2012, 119, 1–10. [Google Scholar] [CrossRef]
  20. Saksena, S.; Fox, J.; Spencer, J.; Castrence, M.; DiGregorio, M.; Epprecht, M.; Sultana, N.; Finucane, M.; Nguyen, L.; Vien, T.D. Classifying and mapping the urban transition in Vietnam. Appl. Geogr. 2014, 50, 80–89. [Google Scholar] [CrossRef]
  21. Keola, S.; Andersson, M.; Hall, O. Monitoring Economic Development from Space: Using Nighttime Light and Land Cover Data to Measure Economic Growth. World Dev. 2015, 66, 322–334. [Google Scholar] [CrossRef]
  22. Huo, T.; Li, X.; Cai, W.G.; Zuo, J.; Wei, H. Exploring the impact of urbanization on urban building carbon emissions in China: Evidence from a provincial panel data model. Sustain. Cities Soc. 2020, 56, 102068. [Google Scholar] [CrossRef]
  23. Goigel, T.M. LANDSCAPE ECOLOGY: The Effect of Pattern on Process. Annu. Rev. Ecol. Syst. 1989, 20, 171–197. [Google Scholar]
  24. Aminzadeh, B.; Khansefid, M. A case study of urban ecological networks and a sustainable city: Tehran’s metropolitan area. Urban Ecosyst. 2009, 13, 23–36. [Google Scholar] [CrossRef]
  25. Vergnes, A.; Kerbiriou, C.; Clergeau, P. Ecological corridors also operate in an urban matrix: A test case with garden shrews. Urban Ecosyst. 2013, 16, 511–525. [Google Scholar] [CrossRef]
  26. Mandle, L.; Douglass, J.; Lozano, J.S.; Sharp, R.P.; Vogl, A.L.; Denu, D.; Walschburger, T.; Tallis, H. OPAL: An open-source software tool for integrating biodiversity and ecosystem services into impact assessment and mitigation decisions. Environ. Model. Softw. 2016, 84, 121–133. [Google Scholar] [CrossRef]
  27. Pierik, M.E.; Dell’Acqua, M.; Confalonieri, R.; Bocchi, S.; Gomarasca, S. Designing ecological corridors in a fragmented landscape: A fuzzy approach to circuit connectivity analysis. Ecol. Indic. 2016, 67, 807–820. [Google Scholar] [CrossRef]
  28. Yue, D. RS & GIS-based Spatial Analysis on Ecological Carrying Capacity Pattern of Northwest China: Does Supply Meet Demand? Quat. Int. 2012, 279–280, 551. [Google Scholar]
  29. Wei, W.; Guo, Z.; Zhou, L.; Xie, B.; Zhou, J. Assessing environmental interference in northern China using a spatial distance model: From the perspective of geographic detection. Sci. Total Environ. 2020, 709, 136170. [Google Scholar] [CrossRef]
  30. Sheshukov, A.Y.; Sekaluvu, L.; Hutchinson, S.L. Accuracy of topographic index models at identifying ephemeral gully trajectories on agricultural fields. Geomorphology 2018, 306, 224–234. [Google Scholar] [CrossRef]
  31. Wang, Y.; Chen, X. Natural resource endowment and ecological efficiency in China: Revisiting resource curse in the context of ecological efficiency. Resour. Policy 2020, 66, 101610. [Google Scholar] [CrossRef]
  32. D’Alpaos, C.; D’Alpaos, A. The Valuation of Ecosystem Services in the Venice Lagoon: A Multicriteria Approach. Sustainability 2021, 13, 9485. [Google Scholar] [CrossRef]
  33. Haberl, H.; Gaube, V.; Díaz-Delgado, R.; Krauze, K.; Neuner, A.; Peterseil, J.; Plutzar, C.; Singh, S.J.; Vadineanu, A. Towards an integrated model of socioeconomic biodiversity drivers, pressures and impacts. A feasibility study based on three European long-term socio-ecological research platforms. Ecol. Econ. 2009, 68, 1797–1812. [Google Scholar] [CrossRef] [Green Version]
  34. Kang, P.; Xu, L. The urban ecological regulation based on ecological carrying capacity. Procedia Environ. Sci. 2010, 2, 1692–1700. [Google Scholar] [CrossRef] [Green Version]
  35. Wei, W.; Guo, Z.; Xie, B.; Zhou, J.; Li, C. Quantitative simulation of socio-economic effects in mainland China from 1980 to 2015: A perspective of environmental interference. J. Clean. Prod. 2020, 253, 119939. [Google Scholar] [CrossRef]
  36. Zhang, M.; Liu, Y.; Wu, J.; Wang, T. Index system of urban resource and environment carrying capacity based on ecological civilization. Environ. Impact Assess. Rev. 2018, 68, 90–97. [Google Scholar] [CrossRef]
  37. Dallas, M.D.; Kerzee, R.G.; Bing-Canar, J.; Mensah, E.K.; Oroke, K.G.; Swager, R.R. An Indicator of Solid Waste Generation Potential for Illinois Using Principal Components Analysis and Geographic Information Systems. J. Air Waste Manag. Assoc. 1996, 46, 414–421. [Google Scholar] [CrossRef]
  38. Kongjian, Y. Security patterns and surface model in landscape ecological planning. Landsc. Urban Plan. 1996, 36, 1–17. [Google Scholar]
  39. Wang, Z.; Shi, P.; Zhang, X.; Tong, H.; Zhang, W.; Liu, Y. Research on Landscape Pattern Construction and Ecological Restoration of Jiuquan City Based on Ecological Security Evaluation. Sustainability 2021, 13, 5732. [Google Scholar] [CrossRef]
Figure 1. Methodological framework.
Sustainability 14 15799 g001
Figure 2. Overview of research area. Note: (a) Normalized difference vegetation index; (b) Nighttime light data.
Sustainability 14 15799 g002
Figure 3. Ecological carrying capacity of northwest arid region from 2000 to 2018.
Sustainability 14 15799 g003
Figure 4. Area distribution of ecological vulnerability in the northwest arid region.
Sustainability 14 15799 g004
Figure 5. Dynamic monitoring of ecological vulnerability in the northwest arid region.
Sustainability 14 15799 g005
Figure 6. Ecological source of the northwest arid region. Note: (a): Ecological carrying capacity advantage area in 2000; (b): Ecological carrying capacity advantage area in 2007; (c): Ecological carrying capacity advantage area in 2012; (d): Ecological carrying capacity advantage area in 2018; (e): Woodland waters greater than 10 km; (f): Ultimate ecological source.
Sustainability 14 15799 g006
Figure 7. Map of ecological source area and important ecological patches.
Sustainability 14 15799 g007
Figure 8. Different cumulative distances from the surface of the three land superpositions. Note: (a): Surface superposition of ecological land use and accumulated distance consumed; (b): The surface superposition of production land and accumulated consumption distance; (c): The surface of living land and accumulated distance consumed is superimposed; (d): ecological security pattern.
Sustainability 14 15799 g008
Figure 9. Optimization diagram of corridor and node patterns.
Sustainability 14 15799 g009
Table 1. Index system of ecological vulnerability assessment.
Target LayerCriterion LayerBasic Index Layer
Ecological carrying capacitySocial economic pressureNighttime light data (X1), Land cover (X2), Population (X3)
Ecological environmental elastic forcePrecipitation (X4), Temperature (X5), River density (X6), Soil erosion intensity (X7), NDVI(X8), Soil organic matter content (X9), Terrain Index (X10), Soil types (X11)
Resource and environmental capacityPer capita arable land (X12), Per capita forest area (X13)
Table 2. Multivariate collinearity diagnosis results.
Basic IndexToleranceVariance Inflation Factor
X90.60 1.67
X50.43 2.30
X60.70 1.43
X110.42 2.38
X100.35 2.82
X80.16 6.47
X70.97 1.03
X40.29 3.44
X120.76 1.31
X130.97 1.03
X20.16 6.24
X30.28 3.30
X10.19 5.57
Table 3. Results of spatial principal component analysis.
Principal ComponentEigenvaluesPercent of Eigenvalues/%Accumulative of Eigenvalues/%
2000 2007 2012 2018 2000 2007 2012 2018 2000 2007 2012 2018
P1 0.102 0.100 0.100 0.104 37.896 31.749 35.800 34.312 37.896 31.749 35.800 34.312
P2 0.048 0.063 0.051 0.060 17.840 19.866 18.070 19.942 55.736 51.615 53.870 54.254
P3 0.034 0.042 0.036 0.035 12.556 13.214 12.920 11.749 68.293 64.829 66.790 66.003
P4 0.017 0.025 0.024 0.024 6.308 7.955 8.632 7.920 74.600 72.784 75.421 73.923
P5 0.016 0.018 0.014 0.016 5.948 5.728 4.823 5.413 80.549 78.512 80.244 79.337
P6 0.012 0.016 0.013 0.014 4.390 5.053 4.576 4.554 84.938 83.565 84.820 83.891
P7 0.009 0.011 0.010 0.010 3.483 3.529 3.574 3.447 88.421 87.094 88.394 87.338
Table 4. Evaluation system and values of ecological source resistance.
Ecological Source Resistance12345
Elevation (m)>35002500–35002000–25001500–2000<1500
Slope (°) >4030–4020–3010–20<10
Type of landscapeWatersForestGrasslandCultivated landConstruction land, unused land
NDVI (%)>7050–7030–5010–30<10
Soil types Cold permafrost, black calcium soil, grass felt soil, black felt soilIrrigation soil, meadow soil, gray calcium soilBlack earth, gray-brown desert, sandy soilSalt, moisture, gray brownStone soil, desert salt soil
Table 5. Regional statistics of ecological security pattern.
CodeSecurity Landscape PartitioningArea (km2)Percentage (%)Main Distribution Area
20Optimization buffer areas unused568,820.67 27.21Tall mountain range, oasis edge
11Ecological protection areas production land498,439.92 23.84Altai Mountain Ecological Reserve, Tianshan Ecological Reserve, Kunlun Mountain Ecological Reserve, Qilian Mountain Ecological Reserve
10Ecological conservation areas unused land 348,726.95 16.68Top of tall mountains, oasis area
30Ecological overuse areas underutilize293,402.56 14.03Main desert area
40Ecological protection areas unused land137,653.67 6.58Main desert area
21Optimize the buffer areas ecological land109,551.53 5.24Meadow-based, meadow belt of major mountains
12Ecological conservation areas production land65,770.21 3.14Oasis area around Taklamakan Desert, Northern Foothills of Tianshan, Hexi Region
22Optimize buffer areas production land26,965.18 1.29Oasis area around Taklamakan Desert, Northern Foothills of Tianshan, Hexi Region
31Ecological transition areas ecological land22,912.67 1.09The oasis area of the desert hinterland is mainly grassy
41Ecological protection areas ecological land9434.26 0.45The oasis area of the desert hinterland is mainly grassy
13Ecological conservation areas land for living4292.86 0.21Oasis area around Taklamakan Desert, Northern Foothills of Tianshan, Hexi Region
32Ecological transition areas production land2315.72 0.11Shiyang River Basin, Yelp River Basin
23Optimize buffer areas living space1609.30 0.07Optimize buffer zone production land
33Ecological transition areas living space77.33 0.01Shiyang River Basin, Yelp River Basin
42ecological protection areas production land18.81 0.01An oasis in the heart of the desert
43Ecological protection areas living space10.45 0.01An oasis in the heart of the desert
Publisher’s Note: MDPI stays neutral with regard to jurisdictional claims in published maps and institutional affiliations.