Article

Research on Water Rights Trading and Pricing Model between Agriculture and Energy Development in Ningxia, China

1
State Key Laboratory of Simulation and Regulation of Water Cycle in River Basin, China Institute of Water Resources and Hydropower Research, Beijing 100038, China
2
Department of Water Resources, China Institute of Water Resources and Hydropower Research, Beijing 100038, China
*
Author to whom correspondence should be addressed.
Sustainability 2022, 14(23), 15748; https://doi.org/10.3390/su142315748
Submission received: 5 August 2022 / Revised: 21 November 2022 / Accepted: 22 November 2022 / Published: 26 November 2022

Abstract

:
The contradiction between the supply and demand of water resources has become increasingly prominent, and water rights trading is an effective approach to increase the efficiency of water resource utilization and allocation so as to achieve sustainable use of water resources. Current transferring cost and price in China are both underestimated, taking into account the construction and maintenance fee of water conservation project and the irrigation risk compensation fee but ignoring the renovation and reconstruction fee of water conservation projects, and the compensation fee for farmers. This paper takes assignee rights, assignee capacity, and compensation to third parties into comprehensive considerations in Ningxia Hui Autonomous Region, where the contradictions between water, energy and food are most prominent in China. Tradable water use rights were analyzed based on a water transfer pricing model. The results show that there is an obvious negative correlation between shadow water price and water usage, and the shadow price of water resources is between 10.91 and 40.52 CNY/m3, which is an optimal solution under the constraint of water usage from 6.65 to 7.03 billion m3. The reasonable water transfer price is 10.91 CYN/m3, of which the earning of the agricultural assignor was 5.96 CNY/m3. This price guarantees the interests of the assignee and is also affordable to the assignee. This research provides a specific calculation method for the transfer pricing of water rights under non-market conditions, which is of important theoretically and has practical significance.

1. Introduction

Due to urbanization, population growth, and increases in food production, energy and industrial water demand, people will confront 40% water shortages globally in the next 15 years [1]. By 2050, the global water demand is expected to increase by 20−30%, with more than 20 billion people facing water crisis [2]. With the acceleration of economic globalization, energy and food are traded between countries and regions, so water, energy and food are relatively independent and closely related mutual-feeding systems [3,4], as well as a hot topic in the world [5,6,7]. The concepts, goals and approaches of water resources management have changed greatly for coping with water resource crises [8]. In order to meet the increasing demands for water, transaction water rights in the market can be used to improve the efficiency of water resource use and allocation, and to promote the conversion of water use from low-benefit to high-benefit economic industries [9].
Introducing economic measures into water resources management is a globally necessary response to water scarcity. Under the market economy, dealing with the relationship between the government and the market is the core issue of water management in various countries [10]. The United States established a water rights system that combines regional and basin-based water rights. As for the distribution of surface water rights, the eastern coastal area is rich in water resources, so the riparian rights system is adopted; in arid and dry areas, the principle of priority of occupation system is adopted [11]. The Israeli water rights transfer system is similar to that in China, where water resources are national resources which are owned and controlled by the government, and industrial and agricultural water quotas are implemented to limit uncontrolled water use [12,13]. Australian water rights are broken down level by level from state, town, irrigation district, to farmers. The individual or company’s water credits are determined based on years of water flow and water use for a river (around 10 years) and ownership of the land [14,15,16]. In Chile, water rights are mainly traded within agricultural water users and between agriculture and cities. The price of water rights trading will change with the main body of the transaction, region, climate conditions, expected earnings, transaction costs and other factors [17]. From the perspective of the water rights transfer in various countries, the conversion of water rights shifts the use of water resources towards higher benefits [18], which brings direct economic benefits to agriculture and other water users and improves the level of water management. The water price that fully reflects market supply and demand and resource scarcity guarantees the implementation of water rights trading [19].
The transfer pricing of water rights is an important part of the transfer of water rights. The differences in the evaluation of water resources between buyers and sellers are the main limit to the trading of water rights. Under the condition that the water market has not been established yet, the evaluation of water rights is an important part of determining the reasonable transfer price [20]. Current methods for the evaluation of water resources, values, and prices include the shadow price method, supply and demand pricing method, cost pricing method, and fuzzy mathematical model pricing method [21,22]. Under market economy conditions, the price formation should be the market equilibrium price under the joint action of supply and demand [23]. The differences in the valuation of water resources between buyers and sellers are the main factors contributing to water rights trading [24]. In countries with abundant water resources, such as the United States and Canada, the cost of water is used as the water price [25,26]. The pricing of water rights in these countries are all based on a combination of government and market. It is measured by companies or third parties that provide water supply services. The government authorities or regulators then review and approve the water price. Sometimes it is necessary to consult with water users. Finally, the government publishes the final water price. The role of the government in water rights trading is as regulator and supervisor [27].
Although China has formed a set of water rights ideas that “clarify water rights and introduce markets”, at present, during the formulation of water prices for water rights allocation, the administrative approach still occupies a dominant position and the market approach is relatively subordinate, which neglects the interests of involved parties, the balanced supply of water resources, and the equilibrium price between water supply and demand under the effect of the market [28,29].
Compared with agriculture and other industries, the energy industry has high economic benefits with small water consumption, which is an important driving force for the economic and social development of the western region in China [30]. Ningxia Hui Autonomous Region has abundant coal and non-metallic resources, which makes it a national key development zone and an important national large-scale coal base and coal chemical industry base, as well as a “west-to-east power generation” thermal power base. However, the basic conditions include a serious shortage of water resources. Based on the theory of water resources value, this paper defines the relationship between the rights and interests of water rights assignors, assignees, and third parties, and analyzes the value and structure of water resources for each entity. A reasonable evaluation method was put forward for each type of price composition analysis, and a practice analysis was carried out in a typical district of Ningxia Hui Autonomous Region to quantitatively evaluate the transfer price of water rights and the distribution among various stakeholders. The goal of this paper is to improve the technical method system of the water rights and water market, make up for the current disadvantages of reasonable pricing, provide technical support for the water rights and water market, and protect the interests of all parties involved.

2. Materials and Methods
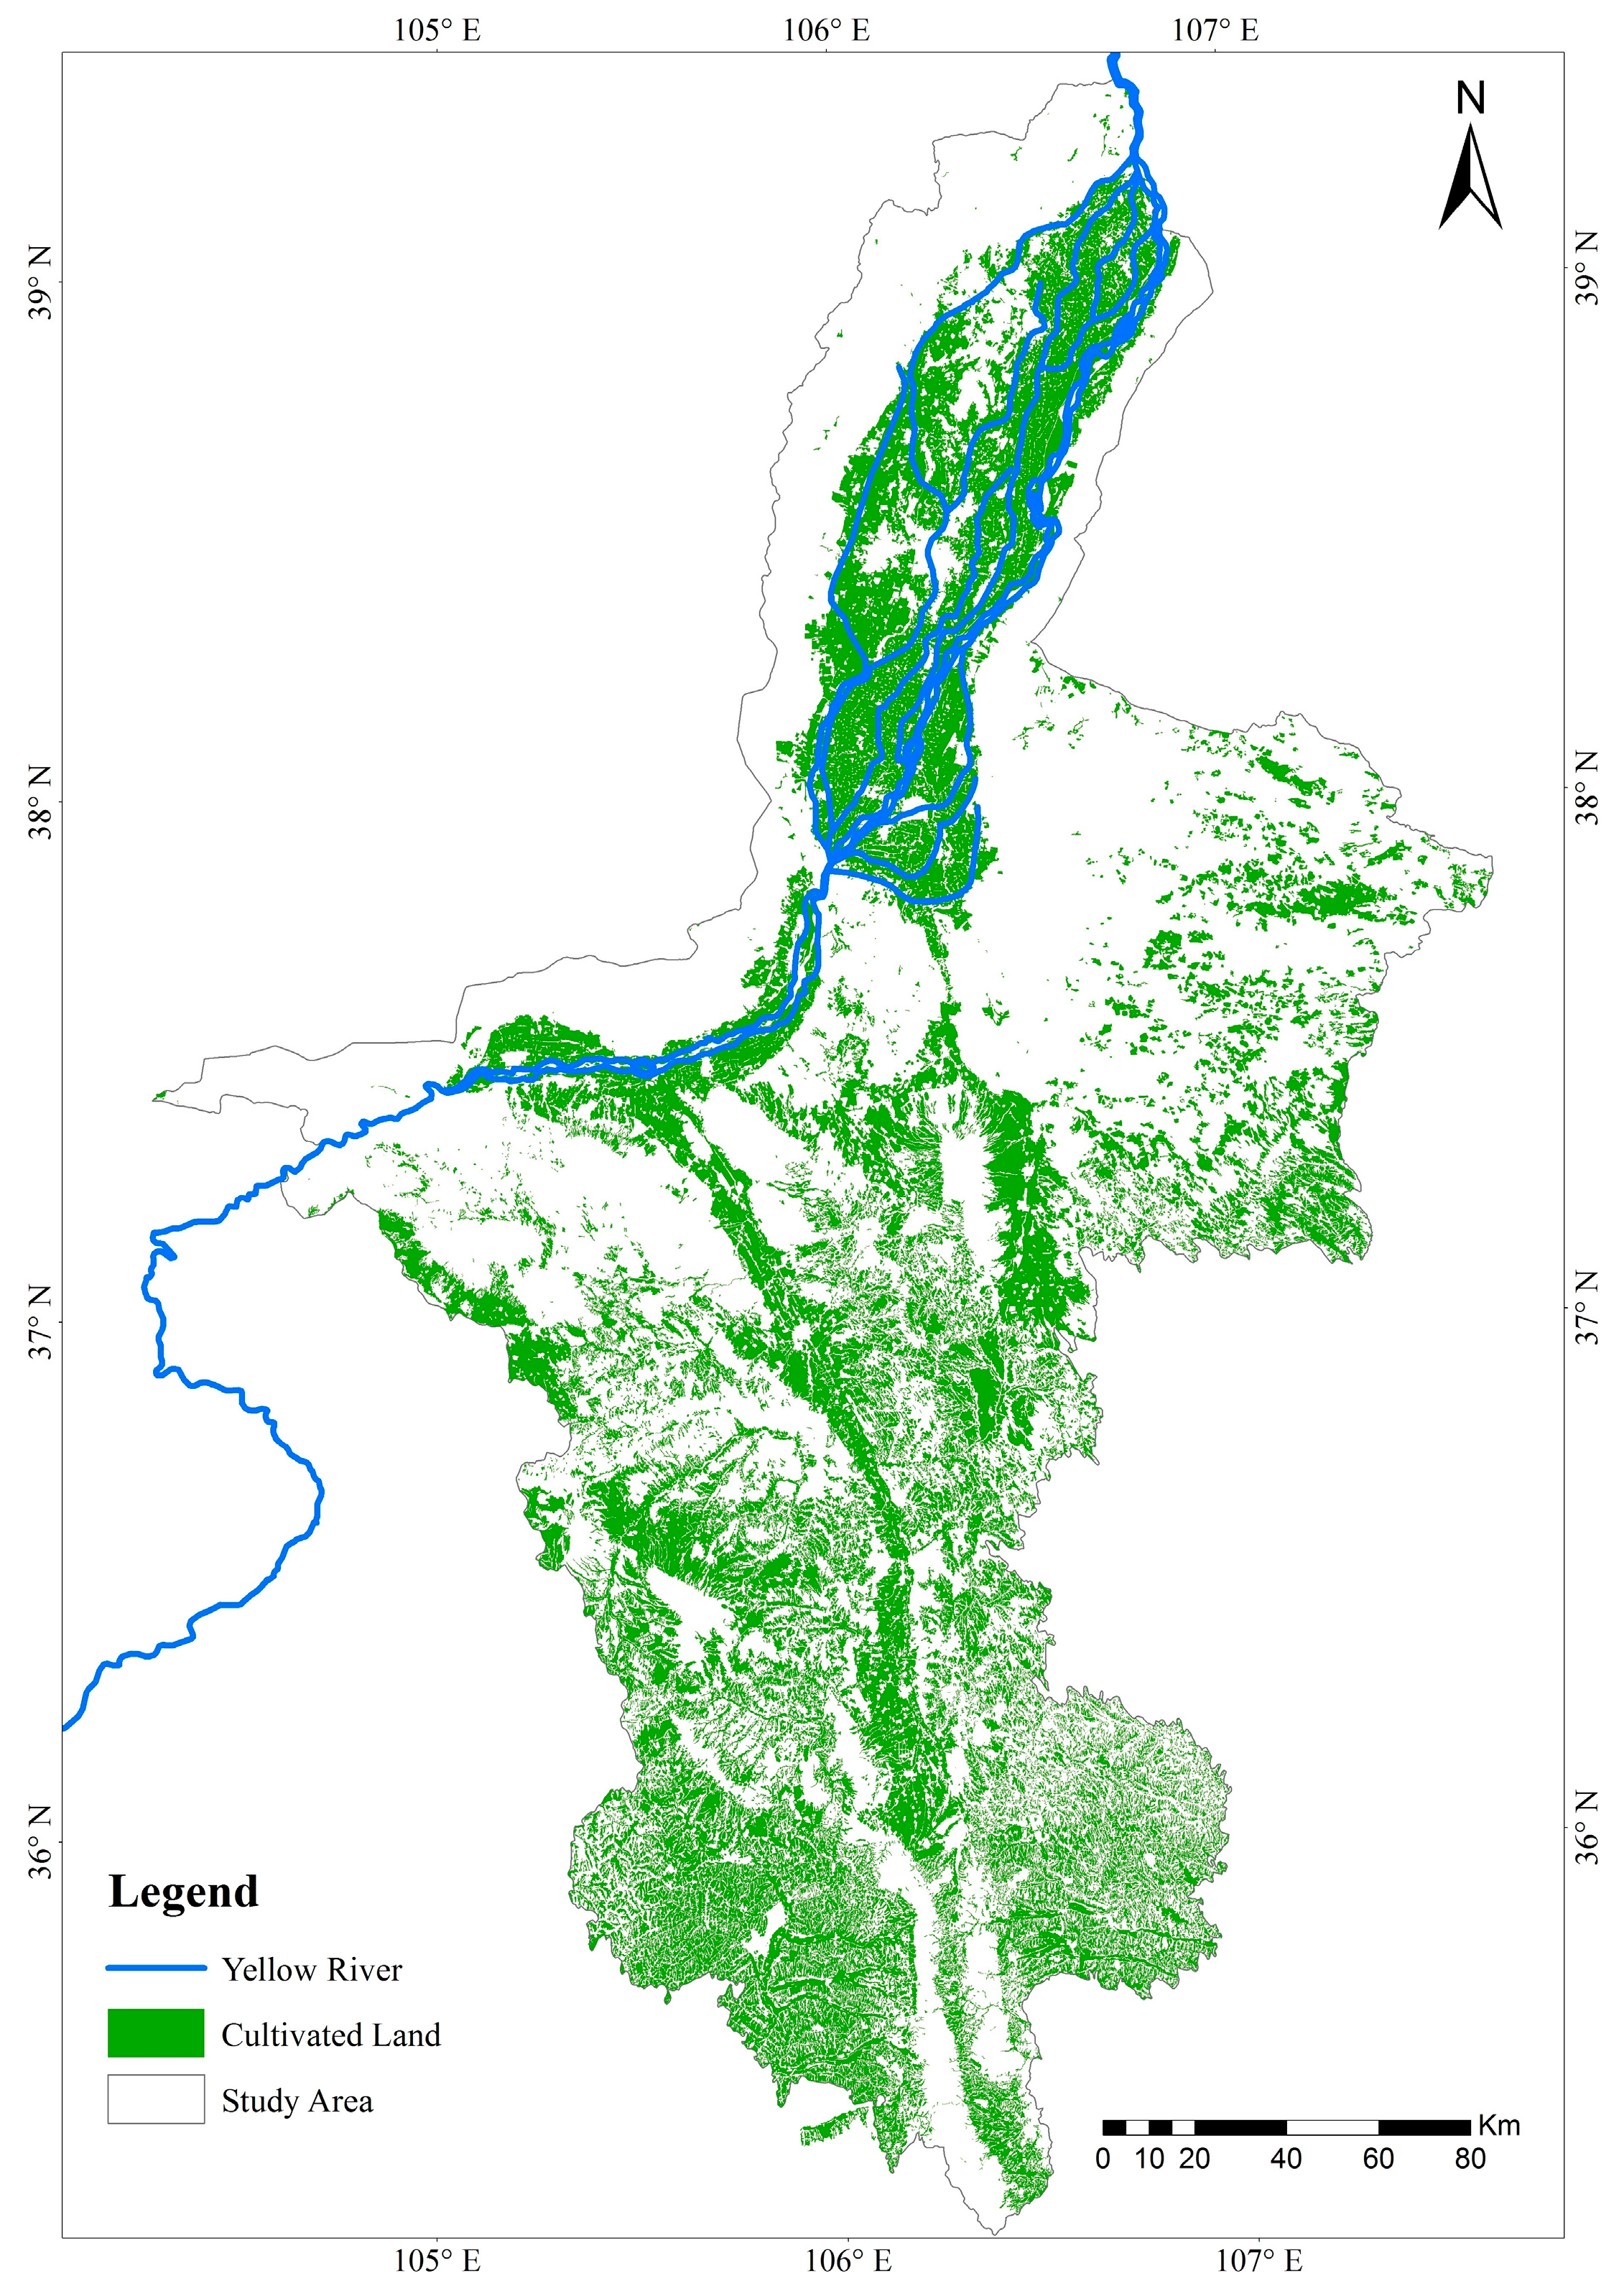
2.1. Study Area

Ningxia Hui Autonomous Region, or Ningxia, is a province in northwestern China with scarce water resources. Annual rainfall is between 200 and 400 mm. The per capita water resource is about 1/3 of the national average. Agriculture is the largest water user in Ningxia, accounting for 88% of the total water use (Figure 1). The canal water utilization rate is only 0.48 and more than half of the water is wasted in the water transfer process [31]. In 2020, the local water resources amounted to 1.1 billion m3, while the total water consumption was 7.2 billion m3 (Figure 2). Economic and social development totally depends on the limited distribution of the Yellow River’s migrating water.
In order to solve the “bottleneck” of water resource constraints, Ningxia was selected by the Ministry of Water Resources to implement the water rights strategy as a pilot that transfers water saved in agriculture to industrial projects [32], implementing the large-scale and industry-oriented water rights conversion by “water-saving investment and water rights transfer”. In the process of industrial water rights transfer in Ningxia, the agricultural assignor of water rights is passive; that is, the government and enterprises invested in the construction of water-saving projects for water transport, and transferred the water that was saved during the water transfer processes to the industry. The planned investment in the water rights transfer project is CNY 2.15 billion, the investment in monitoring equipment is CNY 38 million, the total static investment in the project is CNY 2.8 billion, and the transferred water volume is 494 million m3. However, farmers have not actually benefited from it. From the perspectives of supply, demand, and the involved third party, this article examined the water rights conversion in Ningxia to determine transaction prices that guarantee the interests of the assignors, is affordable to the assignee, and effectively compensates the third parties, which provides a pricing reference for water rights conversion under non-market conditions.

2.2. The Water Rights Transfer Price Model

2.2.1. The Structure of the Model

Taking into account the rights and interests of the water rights assignor, compensation to third parties, the affordability for water rights assignee parties, the overall condition of the national economy, and the scale of water resources supply, the water rights transfer pricing model was designed. It includes the supply price evaluation module, the demand price evaluation module, the equilibrium price evaluation module and the pricing module. The supply price evaluation module includes the assessment of the water rights transfer fee of the water rights assignor, the total cost of the water supply, and the evaluation of compensation to third parties. The demand price evaluation module includes the assessment of the affordability for enterprises and residents. The equilibrium price evaluation module is based on the analysis of the balance between water supply and water demand in national economic development. The pricing module determines the final transfer pricing based on the water volume constraints and regulatory objectives. See Figure 3 for details.

2.2.2. Supply Price Evaluation Module

The supply price evaluation module is used to evaluate the water rights assignor and third-party pricing. For the assignor of water rights, the transfer price shall reflect the loss of economic value caused by the transfer of water rights and the input of labor value, represented by the water transfer fee and the total cost of water supply, respectively. For the third-party, the transfer price should reflect the economic profit loss caused by water rights transfer, presented by the compensation price:
E s = E 1 + E 2 + E 3
where Es denotes the supply price of water rights transfer, CNY/m3; E1 denotes the water right transfer fee, which refers to the loss of opportunity cost to the assignor by giving up the use of water resources, CNY/m3; E2 denotes the total cost of transfer per unit of water, including the related investment and operating costs, land and property loss, reconstruction costs, resettlement fees, management labor costs, transportation costs, taxes, profits, etc., in the transfer process, CNY/m3; E3 is the compensation price for the impact on third parties, CNY/m3.
(1)
Evaluation method of water rights transfer fee
The water rights transfer fee reflects the water economic loss due to the water rights transfer, from which is calculated the water rights transfer fee by deducting the non-water cost in this paper.
E 1 = T V W I r / Q I r , G × b
where the subscript Ir stands for irrigated farming and the subscript G stands for gross irrigation water. TVWIr is the economic value of water in plantation, CNY; QIr,G is the gross amount of irrigation water in plantation, m3; b is the loss coefficient of agriculture transferring to industry.
The economic value of water in plantation can be calculated by the following formula:
T V W I r = X I r F N W , I r
where XIr is the total production (production value) of plantation, CNY; FNW,Ir is the non-water cost (exclusion of the water factor cost) of plantation, CNY.
In the real transfer, due to the difference in the probability of water supply between agriculture and industry, the unit water amount that transfers from agriculture to industry should consider the loss coefficient caused by the change in probability of water supply, which is the ratio of the planning water of the industry water supply probability (WF95) over that of the agriculture (WF75), that is:
b = W F 95 W F 75
where the subscript F95 represents a 95% water supply guarantee rate, and the subscript F75 represents a 75% water supply guarantee rate.
(2)
Evaluation method for the total cost of water supply
The total cost of water supply is the ratio of the total cost during the water rights transfer over the amount of transferred water:
E 2 = T 2 / Q
where T2 is the cost during the water rights transfer, including investment and operating costs, land and property loss, reconstruction costs, resettlement fees, management labor costs, transportation costs, taxes, and profits, CNY. Q is the amount of transferred water, m3.
(3)
Evaluation method of compensation price
The compensation price is calculated based on the actual impact of the water rights transfer on other relevant stakeholders. ① Impacts on water use in downstream rivers and outside rivers. Water rights transfer may result in reduced flow and lower water level in the downstream river channels, thereby affecting certain water use in river channels, such as shipping, hydroelectric power generation, tourism and recreation, and river species’ breeding. ② Impact on groundwater users. Water rights transfer may result in more exploitation of the groundwater by the assignor and may reduce the recharging of groundwater, leading to a drop in groundwater level (especially in dry years and continuous dry years), affecting the use of water in downstream areas and adjacent areas, and increasing the cost of pumping. ③ Impacts on the ecological environment. If the transfer of water rights causes downstream flow to reduce to a certain threshold, it may affect the growth of plants on river banks and the lives of fish in the river, and also may affect wetlands, lakes, etc. For inland river basins, reductions in river flow may shorten the length of rivers and reduce the oasis area of the river tail and the quality of vegetation; also, the low river flow will reduce the ability of the water body to dilute contaminants that deteriorate the water quality. ④ The change of water use by water rights will lead to the transfer of sewage and emissions, resulting in worse water quality.

2.2.3. The Demand Price Evaluation Module

For the water rights assignee, obtaining water rights is to obtain the use value of water resources, using water resources in a certain way to gain the value increment. Therefore, the transferring price should reflect the value increment, that is:
E d = E 4
where Ed is the demand price of water transfer, CNY/m3. E4 is the added value of water use, that is social value, and economic value for residential living and production which can be reflected by affordability for residents and enterprises, respectively, CNY/m3.
The demand side in this paper is high-efficient industrial water users, so the demand price reflects the economic value of water. The industrial water use amount has two metrics: water intake (supply of the new water amount) and the total water use (including the recycling amount). Due to the incomparability of the total water use amount between industries, the water intake amount is used here to calculate the economic value of industrial water:
E 4 = T V W I / Q I
where the subscript I stands for type of industry and the subscript W stands for the type of water. T V W I is the economic value of industrial water intake, CNY; Q I is the water intake amount, m3.
The economic value of industrial water intake can be calculated by the following formula:
T V W I = X I F N W , I
where X I is the total industrial production (production value), CNY; F W , I is the non-water cost of industry (excluding the water factor cost), CNY.

2.2.4. The Equilibrium Price Evaluation Module

This is a general linear programming model based on the input–output model of water resources in this paper. An equilibrium equation of water resources in the production process and consumption process, government behavior and foreign trade transactions is constructed. By calculating the duality solution of the water amount index with the object of maximizing the national economic profit, the trading price of water ( E e ) in the virtual market state is obtained. The objective function of the established is:
A X + Y = X X A 1 X V X l X X h Y l Y X V l V X j = 1 n a w j X j W 0 W j W j h
where the subscript l represents the lower limit value, and the superscript h represents the upper limit value. B is the total profit of the national economic industry, CNY; a v i is the profit rate of industries, that is, the ratio of earning over total production; X is the total production of industries, CNY; A represents the direct consumption coefficients in the input–output table; Y is the final use of each product, CNY; A 1 represents the intermediate input coefficients in input–output table; V is the added value of industries, CNY; X l , X h are the lower and upper limits of X as set by the model, and take 0.8 and 1.2 times X; Y l is the lower of Y that was set by the model, and takes 0.8 times Y; V l is the lower of V that was set by the model, and takes 0.8 times V; a w j represents the direct water use coefficients of industries, that is, the ratio of water use over total production, m3/CNY; W is the total amount of water supply, m3; and W j is the water use of each industry, m3.
In the process of water rights transfer, the supplier and the third-party stakeholders are the compensated side, and the demand side is the compensation side. The final water rights transfer price should be able to compensate the interests of the supply side and the third party, but it should also be less than the demand prices. Then it could protect the interests of all stakeholders and achieve the optimization of the comprehensive benefits of water rights transfer. The final price of water rights transfer is as follows:
E = E e   ,   E s E e E d E s   ,   E e E s E d E d   ,   E s E d E e
where E is the price of water rights transfer, CNY/m3.
If the demand price is less than the supply price, the water rights transaction in theory cannot be implemented, and the transaction needs to be concluded through negotiation, subsidies and other means. This paper does not involve the analysis and calculation of this situation.

2.3. Data

This study mainly used the water consumption data of different industries and input–output tables to calculate the economic value of water in Ningxia. The detailed data sources are presented below (Table 1).

3. Results

In the process of exchange, the value of water resources is finally reflected through price. From the perspective of supply side, the property right value of water resources is reflected in the form of water resources fees, and the national management and maintenance investment in the process of water resources management is also reflected in water resources fees; the labor value invested by producers is reflected as the production cost, and the value of water environment degradation caused in the process of development and utilization is reflected by the water environment compensation fee. At present, the water environment compensation fee is collected in the form of a sewage treatment fee. From the perspective of demand, water prices should reflect the social value of the consumer sector and the economic value of the production sector. In the optimal state of water resource allocation, the price of water resources should be determined by the market, and reach the equilibrium point between supply and demand price according to the scarcity of water resources, which is reflected in the market equilibrium price. This paper evaluates the equilibrium price of the water resource market by building a water rights transfer pricing model (Figure 4).

3.1. Supply Price of Supply Side

3.1.1. Water Rights Transfer

According to the 2017 Input–Output Table, the economic value of agricultural water accounted for 3.0% of the total agricultural production value and the total agricultural production value was 51.74 billion CNY. Based on this ratio, the economic value of agricultural water in 2017 was calculated to be 1.6 billion CNY. The total agricultural water consumption for the year was 5.8 billion m3, equivalent to 0.27 CNY/m3 economic value per unit of water. With the improvement of agricultural production efficiency, the economic value of agricultural water is increasing. Calculating the economic value of agricultural water uses the data of agricultural added value and total output value. According to statistical data, the average annual agricultural added value growth index is 182.9% from 2007 to 2017, which means an average annual growth rate of 16.6%. This value is used in this paper as average annual economic value of agricultural water. The growth rate is based on this value. Considering the growth factors of the economic value of water in the next 25 years, the average amount of water rights grants is 0.44 CNY/(m3 year). The coefficient of impairment b was provisionally taken as 1.3, and the calculated cost per m3 of water rights was 0.57 CNY.

3.1.2. Total Cost of Water Supply

According to the actual condition in Ningxia, from the perspective of the government supporting the local economy, the project investment involved in the transfer of water rights is the responsibility of the administrative department, so no taxes or other fees are charged, and there is no need to consider the profit of investment. The assumed water conservation project construction period is 3 years, and the investment is distributed evenly in each year. Interest during the construction period of the project was 286.7 million CNY, and the total investment in fixed assets was the sum of static investment and interest during the construction period, which was 2.480 billion CNY. The payback period is calculated as 25 years and the annual depreciation expense is 99.2 million CNY. As for the operation fee, the operation and maintenance fee takes 2% of the total project investment based on Economic Evaluation of Water Conservancy Projects (SL72–94), which is 43.9 million CNY, plus the annual water monitoring costs and experimental research costs of 3.8 million CNY for each project. The annual total operating fee is 47.7 million CNY. The water price for the transfer of water rights is 3.3 CNY/m3.

3.1.3. Compensation Price of the Third Parties

Due to the water rights transfer, the agricultural non-point source pollution, which is free, was changed to point source pollution by industries and the wastewater treatment fee charged to enterprises was 1.50 CNY/m3. This part of the cost is calculated into the third-party compensation price. According to the current water fee standard in Ningxia, the water resource fee for surface water for industrial use is 0.15 CNY/m3. This part of the fee is required to be paid to the government management department directly and is also included in the third-party compensation price.
Through the above calculations, the minimum water rights transfer price that industrial demand parties need to pay is 5.52 CNY/m3.

3.2. Demand Price of Demand Side

The demand price of the assignee reflects the benefit increment brought by the water rights transfer; that is, the value increment of water economic value. Consistent with agricultural calculations, the economic value of industrial water is also calculated by deducting the non-water cost. According to input–output tables for 2017, the total industrial output value for the year was 427.7 billion CNY, and the economic value of industrial water accounted for 3.7% of the total industrial output value. Based on this ratio, the 2017 industrial water value was calculated. The economic value was 15.8 billion CNY, and the total industrial water consumption for the year was 420 million m3, equivalent to the economic value of unit water volume of 37.6 CNY/m3. The highest water rights transfer price that the industry can afford is 37.6 CNY/m3.

3.3. The Equilibrium Price Based on Market Trading Pattern

Through the combination of input–output tables and water resource utilization, we established the link between water use and national economic output and set the target of maximizing production profits in the industry, then calculated the shadow price of water resources as a reference for the water rights transfer price under the market trading pattern. A coefficients of linear programming model could be calculated based on the matrix of direct consumption coefficients of six water users of Ningxia water in 2017, including Agriculture, Industry, Construction, Transportation and Telecommunication, Wholesale, Retail and Catering, and others, which are shown in Table 2. The direct consumption coefficient of industry is the largest, indicating that the total expenditure of each sector on industrial products accounts for the largest proportion.
Based on the 2017 Ningxia input–output table and Ningxia Water Resources Bulletin, the values of the model parameter in eq. 10 are calculated (Table 3). In industry, the lower and upper limits of the total production are 197.8 billion CNY and 395.6 billion CNY, and the profit rate of industry is 0.036. From the model, under different water constraints, the duality solution is calculated between 10.91 and 40.52 CNY/m3. The marginal production for unit water is 10.91~40.52 CNY/m3, from which the water rights transfer price can be chosen.

3.4. Payment Standard

The transfer price that should be paid by industrial demand parties is from 5.52 to 37.6 CNY/m3 (Table 4), while it is calculated that the water resource price in Ningxia in 2017 was between 10.91 and 40.52 CNY/m3 under the market supply and demand conditions, with the result that 10.91 CNY/m3 is recommended as the transfer price of water rights when considering the bearing capacity of industrial sectors and the incentive mechanism of water price. The transfer price obtained from the consideration of the transferee and the third party is 5.52 CNY/m3, which is 5.39 CNY/m3 different from the recommended price. In terms of market regulation, the balance between the supply and demand sides reflects the degree of resource scarcity. In terms of ownership conditions, property owners enjoy the benefits of resources. At present, the Chinese water price is lower due to strong public welfare features and an unsound water market, which does not reflect the property rights value of water resources. Therefore, the difference in price should be distributed to the owner of the water rights. The opportunity cost for the transfer of water rights for agriculture is 0.57 CNY, and the earnings from property rights are 5.39 CNY/m3. The transfer price of agriculture in the water rights transfer should be the sum of the two, that is, 5.96 CNY/m3.

4. Discussion

4.1. Rationality Analysis

Theoretically, on the basis of defining the subject of water rights transfer and the full cost method, the water supply fee, total water supply cost and third-party compensation price are taken into account to calculate the water supply price. This method has been widely applied to the calculation of water value input in agriculture and other industries [33]. Based on the shadow price, the market equilibrium price module calculated the optimal planned price to have been used [34,35]. From the perspective of market regulation, the balance between the price supplier and the demand side reflects the degree of resource scarcity. The advantage of this method is that it can synthesize the economic and social benefits of different industries and coordinate various aspects.
This paper combines markets and policies with a view to considering new industries as high-efficiency water users. According to results, there is obvious negative correlation between shadow water price and water usage (Figure 5); the model has an optimal solution under the constraint of water usage from 6.65 to 7.03 billion m3, and the shadow price of water resources is between 10.91 and 40.52 CNY/m3. The water rights transfer price that the industry can afford is from 5.52 to 37.6 CNY/m3; however, the ability of enterprises to bear the price of water will increase yearly due to the improvement of production water efficiency. A value of 10.91 CNY/m3 is recommended as the transfer price of water rights, which is within the affordable range of the industry. The method of water rights transfer price in this paper is applicable to the pricing of the agricultural water resources conversion industry. It is universally applicable to and feasible in areas where agricultural water rights account for a relatively large proportion.

4.2. Comparative Analysis

Industrial water use in Ningxia takes up about 7% of the water, while the proportion for agricultural water is as high as 88%. Transferring the water resources saved by agriculture to industry can solve the problem of industrial water shortage, and it can also provide an important reference for improving the efficiency and profit of water resources. Ningxia carried out the water rights conversion pilot project in 2003. The water conservancy conversion price was determined by the Yellow River Conservancy Commission and the water administrative department of Ningxia Autonomous Region according to the total water rights conversion fee/(the water rights conversion period* annual water conversion volume). In the conversion cost, only the construction fee, maintenance fee, and agricultural irrigation risk compensation fee for water-saving projects are calculated, and the conversion price for water rights is calculated at 0.297 CNY/m3. The government did not consider the cost of water-saving projects during the pricing process, as well as the compensation of farmers as water users, so the water rights conversion costs and prices were underestimated and did not fully reflect the benefits of farmers’ water rights and economic losses [36]. That is contrary to the goal of water rights transfer.
Based on the theory of water resources value, this article takes into account the role of policies and the market, and each type of price composition could be analyzed by the use of a reasonable evaluation method. The opportunity cost for the transfer of water rights for agriculture and the earning from property rights are especially considered, and 5.96 CNY/m3 should be paid for agricultural transfer. These can promote the optimal allocation of water resources and achieve a rational distribution and allocation model.

4.3. Policy Implications

The energy industry has high economic benefits with a small total amount of consumption, which is an important driving force for the economic and social development of Ningxia, and even Northwest China [37]. However, Ningxia is relatively scarce in water resources, and energy bases are many in number and dispersed, so there are certain difficulties in ensuring water supply for the energy industry. By coordinating the relationship between energy and water security, agriculture, and energy development, as well as economic and social development, the energy industry in Ningxia can be supported by maximizing water resources under the premise of ensuring the safety of the water system. This requires accelerating the improvement of the water rights trading system between energy industry and agriculture, and establishing and improving the water rights trading platform, legal basis and technological support.
The payment method for the transfer fee of water rights can be considered from the cost of compensation for the investment in water conservation projects and the operating expenses and the reduction of benefits. With regard to compensation fees for investment and operating costs of water-saving projects, the one-time payment of compensation fees is relatively large, and simultaneous investment with the construction investment of the assignee’s industrial project will increase the financial pressure on the assignee. Therefore, it is advised to divide the payment to the construction and management units of water saving projects into three phases: paying 20% of the total compensation for investment and operating expenses at the beginning of the project construction period, then paying 40% at the final year and at the fifth operating year of the construction period, respectively. In the dry year after the water rights transfer project operation, the water consumption of the agricultural water users in the water-saving irrigation areas will be reduced to varying extents, and the benefits will be lost. Therefore, the benefit reduction compensation fee will be paid to the water users in the water-saving irrigation area through the annual compensation method. In addition to the cash compensation, sharing holding and employment arrangements may also be considered as the compensation to the farmers.

5. Conclusions

Implementing the strategy of maximizing the support of water resources for the energy industry will help solve the development problems in Ningxia and provide assistance for accelerating the formation of a domestic large-scale circular development pattern. Water rights pricing is determined by market allocation, which will ignore long-term interests and overall social interests, and fail to ensure fairness and externalities; however, water rights pricing with excessive administrative intervention will lead to inefficient resource allocation. Based on the value of water resources, this paper simulated and built a virtual water market system, used the Market Equilibrium Price Theory to evaluate the supply and demand equilibrium price of water resources, and formulated reasonable water rights transfer prices that objectively reflect the value attributes of water resources, for both sides’ benefit of the transaction. The real interests of the company are to optimize the allocation of water resources, to improve the efficiency of water use and water efficiency, to promote the establishment and improvement of the water market, and to provide price control measures for total control and quota management.
The value attribute of water resources for stakeholders in the process of water rights transfer should be considered, so in the transfer price of water rights, comprehensive consideration is given to the rights and interests of water rights transferees, compensation to third parties, affordability for water rights transfer parties, the overall condition of the national economy, and the scale of water resources supply. Water rights trading involves complex relationships and has extensive impact. During the conversion process, farmers’ interests are easily damaged; therefore, a mechanism for protecting farmer’s interests must be considered. Through analysis, the agricultural water rights supply price is 3.87 CNY/m3, and the third-party compensation price is 1.65 CNY/m3. The lowest transfer water price that the industrial demand side needs to pay is 5.52 CNY/m3, and the highest affordable transfer water price is 37.6 CNY/m3. The acceptable range of pricing in water rights transfer is 5.52 CNY/m3~37.6 CNY/m3. Using the linear programming model, the water price of Ningxia’s 2017 supply and demand conditions was calculated to be between 10.91 and 40.52 CNY/m3. Taking into account what new industrial users can afford, and the water price incentive mechanism, the recommended transfer price of water rights is 10.91 CNY/m3. The difference between the determined transfer price and the supply price is 5.39 CNY/m3, which should be covered by the initial water rights owner households. Considering the opportunity cost for the transfer of agricultural water rights is 0.57 CNY, the earning of water rights transfer farmers is 5.96 CNY/m3.
As the engine of economic development in Ningxia, industry will have a relatively rapid development in the near future. Industrial water shortage will become a major constraint to regional development. In addition, the irrigation projects are aged and in disrepair, and the water use efficiency is low, so the irrigation water-saving potential is relatively large. Using industry to support agriculture, resulting in agricultural comprehensive water-saving, and water rights paid conversion to industry for efficient water use, and using the hand of the market to direct the flow of water resources across the border, are of great significance to the protection of industrial water use in the region. The results show that the current transferring cost and price are both underestimating the construction and maintenance fee of water conservation projects and the irrigation risk compensation fee, but have ignored the renovation and reconstruction fee of water conservation projects, and the compensation fee for farmers. This research provides a specific calculation method for the transfer pricing of water rights under non-market conditions. It fully embodies the benefits of farmers’ water rights, and loss of economic benefits, which is of important theoretical and practical significance.

Author Contributions

C.Q. wrote the paper; S.J. revised this paper; Y.Z. (Yong Zhao) supported analysis tools; Y.Z. (Yongnan Zhu) put forward some opinions and guidance; Q.W. and L.W. analyzed the data and drafted the manuscript; J.Q. checked the language mistakes; M.W. checked the language mistakes. All authors have read and agreed to the published version of the manuscript.

Funding

This research was funded by the National Nature Science Fund of China (NSFC) (Nos. 71573274, 51809282) and National Key Research and Development Program of China (No. 2021YFC3200204).

Institutional Review Board Statement

Not applicable.

Informed Consent Statement

Not applicable.

Acknowledgments

We are grateful to the editor and anonymous reviewers. The help provided by Liqin Ge is also appreciated.

Conflicts of Interest

The authors declare no conflict of interest.

References

  1. The United Nations. World Water Development Report 2015-Water for a Sustainable World; The United Nations Educational, Scientific and Cultural Organization: Paris, France, 2019. [Google Scholar]
  2. The United Nations. World Water Development Report 2019-Leaving No One Behind; The United Nations Educational, Scientific and Cultural Organization: Paris, France, 2019. [Google Scholar]
  3. Chang, Y.; Li, G.; Yao, Y.; Zhang, L.; Yu, C. Quantifying the water-energy-food nexus: Current status and trends. Energies 2016, 9, 65. [Google Scholar] [CrossRef] [Green Version]
  4. Zhang, P.; Zhang, L.; Chang, Y.; Xu, M.; Hao, Y.; Liang, S.; Liu, G.; Yang, Z.; Wang, C. Food-energy-water (FEW) nexus for urban sustainability: A comprehensive review. Resour. Conserv. Recycl. 2019, 142, 215–224. [Google Scholar] [CrossRef]
  5. Hoff, H. Understanding the nexus. In Proceedings of the Background Paper for the Bonn 2011 Conference: The Water, Energy and Food Security Nexus Stockholm, Bonn, Germany, 16–18 November 2011. [Google Scholar]
  6. Adnan, H. Water, Food, and Energy Nexus in Asia and the Pacific; United Nations Economic and Social Commission for Asia and the Pacific: Bangkok, Thailand, 2013. [Google Scholar]
  7. Bieber, N.; Ker, J.H.; Wang, X.; Triantafyllidis, C.; van Dam, K.H.; Koppelaar, R.H.E.M.; Shah, N. Sustainable planning of the energy-water-food nexus using decision making tools. Energy Policy 2018, 113, 584–607. [Google Scholar] [CrossRef]
  8. He, C.; Harden, C.P.; Liu, Y. Comparison of water resources management between China and the United States. Geogr. Sustain. 2020, 1, 98–108. [Google Scholar] [CrossRef]
  9. Ghosh, S.; Cobourn, K.M.; Elbakidze, L. Water banking, conjunctive administration, and drought: The interaction of water markets and prior appropriation in southeastern Idaho. Water Resour. Res. 2015, 50, 6927–6949. [Google Scholar] [CrossRef]
  10. Maggioni, E. Water demand management in times of drought: What matters for water conservation. Water Resour. Res. 2015, 51, 125–139. [Google Scholar] [CrossRef]
  11. Grantham, T.E.; Viers, J.H. 100 years of California’s water rights system: Patterns, trends and uncertainty. Environ. Res. Lett. 2014, 9, 084012. [Google Scholar] [CrossRef]
  12. Berck, P.; Lipow, J. Real and ideal water rights: The prospects for water-rights reform in Israel, Gaza, and the West Bank. Resour. Energy Econ. 1994, 16, 287–301. [Google Scholar] [CrossRef]
  13. Murthy, S.L.; Williams, M.; Baskin, E. The Human Right to Water in Israel: A Case Study of the Unrecognised Bedouin Villages in the Negev. Isr. Law Rev. 2012, 46, 25–59. [Google Scholar] [CrossRef]
  14. Poirier, R.; Schartmueller, D. Indigenous water rights in Australia. Soc. Sci. J. 2012, 49, 317–324. [Google Scholar] [CrossRef]
  15. Mckay, J. Water institutional reforms in Australia. Water Policy 2005, 7, 35–52. [Google Scholar] [CrossRef]
  16. Brennan, D. Water policy reform in Australia: Lessons from the Victorian seasonal water market. Aust. J. Agric. Resour. Econ. 2006, 50, 403–423. [Google Scholar] [CrossRef]
  17. Bauer, C.J. Results of Chilean water markets: Empirical research since 1990. Water Resour. Res. 2004, 40, 6–9. [Google Scholar] [CrossRef]
  18. Wang, Y.B.; Liu, D.; Cao, X.; Yang, Z.; Song, J.; Chen, D.; Sun, S. Agricultural water rights trading and virtual water export compensation coupling model: A case study of an irrigation district in China. Agric. Water Manag. 2017, 180, 99–106. [Google Scholar] [CrossRef]
  19. Nguyen-Ky, T.; Mushtaq, S.; Loch, A.; Reardon-Smith, K.; An-Vo, D.A.; Ngo-Cong, D.; Tran-Cong, T. Predicting water allocation trade prices using a hybrid Artificial Neural Network-Bayesian modelling approach. J. Hydrol. 2018, 567, 781–791. [Google Scholar] [CrossRef] [Green Version]
  20. Bjornlund, H.; Rossini, P. Fundamentals Determining Prices in the Market for Water Entitlements: An Australian Case Study. Int. J. Water Resour. Dev. 2007, 23, 537–553. [Google Scholar] [CrossRef]
  21. Cui, J.; Schreider, S. Modelling of pricing and market impacts for water options. J. Hydrol. 2009, 371, 31–41. [Google Scholar] [CrossRef]
  22. Colby, B.G.; Crandall CBush, D. Water right transactions: Market values and price dispersion. Water Resour. Res. 1993, 29, 1565–1572. [Google Scholar]
  23. Zhong, L.J.; Mol, A.P.J. Water price reforms in China: Policy-making and implementation. Water Resour. Manag. 2010, 24, 377–396. [Google Scholar] [CrossRef]
  24. Yoo, J.; Simonit, S.; Connors, J.P.; Maliszewski, P.J.; Kinzig, A.P.; Perrings, C. The value of agricultural water rights in agricultural properties in the path of development. Ecol. Econ. 2013, 91, 57–68. [Google Scholar] [CrossRef]
  25. Meinzen-Dick, R. Property rights and sustainable irrigation: A developing country perspective. Agric. Water Manag. 2014, 145, 23–31. [Google Scholar] [CrossRef]
  26. Michelsen, A.M.; Young, R.A. Optioning Agricultural Water Rights for Urban Water Supplies during Drought. Am. J. Agric. Econ. 1993, 75, 1010–1020. [Google Scholar] [CrossRef]
  27. Matthews, O.P. Fundamental questions about water rights and market reallocation. Water Resour. Res. 2004, 40, W09S08. [Google Scholar] [CrossRef] [Green Version]
  28. Hang, Z.A.; Yl, A.; Jz, B. Understanding water rights and water trading systems in China: A systematic framework. Water Secur. 2021, 13, 100094. [Google Scholar]
  29. Wang, Y. A simulation of water markets with transaction costs. Agric. Water Manag. 2012, 103, 54–61. [Google Scholar] [CrossRef]
  30. He, G.; Liu, H.; Wang, J.; Zhao, Y.; Zhu, Y.; Jiang, S.; Li, H.; Zhai, J.; He, F. Energy-water security challenge: Impact of energy production on water sustainable developments in Northwest China in 2017 and 2030. Sci. Total Environ. 2021, 766, 144606. [Google Scholar] [CrossRef]
  31. Liu, Y.; Lin, Y.; Huo, Z.; Zhang, C.; Wang, C.; Xue, J.; Huang, G. Spatio-temporal variation of irrigation water requirements for wheat and maize in the Yellow River Basin, China, 1974–2017. Agric. Water Manag. 2022, 262, 107451. [Google Scholar] [CrossRef]
  32. Zhang, H.; Zhou, Q.; Zhang, C. Evaluation of agricultural water-saving effects in the context of water rights trading: An empirical study from China’s water rights pilots. J. Clean. Prod. 2021, 313, 127725. [Google Scholar] [CrossRef]
  33. Lange, G.M.; Hassan, R. The Economics of Water Management in Southern Africa: An Environmental Accounting Approach; Edward Elgar Publishing: Cheltenham, UK, 2006. [Google Scholar]
  34. Ziolkowska, J.R. Shadow price of water for irrigation—A case of the High Plains. Agric. Water Manag. 2015, 153, 20–31. [Google Scholar] [CrossRef]
  35. Kiprop, J.K.; Lagat, J.K.; Mshenga, P.; Macharia, A.M. Determining the Economic Value of Irrigation Water in Kerio Valley Basin (Kenya) by Residual Value Method. J. Econ. Sustain. Dev. 2015, 6, 102–107. [Google Scholar]
  36. Sani, Y.; Scholz, M. Gender and Other Vulnerabilities to Water–Energy Accessibility in Rural Households of Katsina State, Northern Nigeria. Sustainability 2022, 14, 7499. [Google Scholar] [CrossRef]
  37. Han, X.; Zhao, Y.; Gao, X.; Jiang, S.; Lin, L.; An, T. Virtual water output intensifies the water scarcity in Northwest China: Current situation, Problem analysis and Countermeasures. Sci. Total Environ. 2020, 765, 144276. [Google Scholar] [CrossRef]
Figure 1. Overview of study area.
Sustainability 14 15748 g001
Figure 2. Water use in Ningxia from 2010 to 2020.
Sustainability 14 15748 g002
Figure 3. The structure of the water rights transfer pricing model.
Sustainability 14 15748 g003
Figure 4. The composition of water rights price.
Sustainability 14 15748 g004
Figure 5. The shadow price of water resources in Ninxia.
Sustainability 14 15748 g005
Table 1. Data Sources.
TypeData Sources
Agricultural water consumption dataWater Resources Bulletin
Economic input–output tableNingxia Municipal Bureau of Statistics
Per capita water consumption dataChina Water Resources Bulletin
Total economic output value of each industryChina Census yearbook
Industrial departments’ water consumption dataChina Economic Census Yearbook
Total industrial water consumption data Water Resources Bulletin
Amount of water transferred Ningxia Water Rights Transfer Strategy
Water resources fee and the supply price of tap Field investigation
Table 2. The direct consumption coefficient matrix of Ningxia in 2017.
AgricultureIndustryConstructionTransportation and TelecommunicationWholesale, Retail and CateringOthers
Agriculture0.1062970.0321720.0001170.0001690.0402120.000822
Industry0.3309510.5977500.5114640.2950290.1735500.159409
Construction0.0000000.0007410.0118540.0011360.0022440.003488
Transportation and telecommunication0.0141460.0444230.0812940.0963880.0292400.023158
Wholesale, retail and catering0.0280510.0150720.0964990.0135750.0188240.052562
Others0.0036060.0433080.0266480.0919770.0917170.158298
Table 3. Coefficients of linear programming model.
Variables X l
(108 CNY)
X h
(108 CNY)
V l
(108 CNY)
W j h
(108 CNY)
a v j a w j
(m3/104 CNY)
Industry
Agriculture231.4462.9119.670.00.05463193.62
Industry1977.93955.8527.25.00.036349.54
Construction619.01238.0168.40.50.05993.21
Transportation and telecommunication235.0470.0117.90.50.03532.12
Wholesale, retail and catering157.7315.4101.60.50.06157.68
Others620.41240.8373.60.50.15815.6
Table 4. The analysis of water rights price.
TypeWater Price (CNY/m3)
Water rights transfer0.57
Cost of water supply3.3
Compensation price of the third parties1.65
Supply price5.52
Demand price37.6
Equilibrium price10.91~40.52
Publisher’s Note: MDPI stays neutral with regard to jurisdictional claims in published maps and institutional affiliations.

