Article

Blending Plastics Waste with Highly Available Jordanian Kaolin for Preparation of Alkali-Activated Mortars

1
Phamacological and Diagnostic Research Center (PDRC), Faculty of Pharmacy, Al-Ahliyya Amman University, Amman 19328, Jordan
2
Faculty of Engineer, Al al-Bayt University, Mafraq 130040, Jordan
3
Zarqa College, Al-Balqa Applied University, Zarqa 13110, Jordan
4
Department of Chemistry, School of Science, The University of Jordan, Amman 11942, Jordan
5
Faculty of Engineer, Al-Ahliyya Amman University, Amman 19328, Jordan
*
Author to whom correspondence should be addressed.
Sustainability 2022, 14(23), 15742; https://doi.org/10.3390/su142315742
Submission received: 11 November 2022 / Accepted: 22 November 2022 / Published: 26 November 2022

Abstract

:
Due to their lower energy demand, alkali-activated materials or geopolymers (GPs) are strong candidates to replace ordinary Portland cement binders in some applications. The present article attempts to investigate the possibility of incorporating plastics waste in place of silica sand filler in the GP mortars. The compressive strength, density, FTIR, XRD, BET and SEM of the prepared mortars were evaluated. Satisfactory compressive strength was achieved for metakaolin (MK)-based GP mortars containing plastic fillers (polyvinylchloride (PV), polystyrene (PS), polypropylene (PP) and polyethylene (PE)) which was dependent on the nature of plastic incorporated in the GP matrix: MKPV (30.3 MPa) > MKPS (15.8 MPa)~MKPP (15.9 MPa) > MKPE (9.1 MPa). The 28-day compressive strength of GP containing polyvinyl chloride was almost equivalent to that containing silica sand. Much lower values were obtained for the corresponding kaolin-based GPs (2.5, 2.8, 1.8 and 2.2 MPa, respectively). As reflected by FTIR absorption bands at 1447 and 1400 cm−1, the addition of plastic filler reduces absorption of CO2 from the atmosphere which enhanced dissolution of Al species from metakaolin. The morphology of GPs containing plastic fillers exhibited amorphous tissue-like structure compared to crystalline structure in the case of GP containing silica sand. However, both types of GPs exhibited lower porosity than previously prepared metakaolin-based GPs. Remarkably, poor adhesion of plastic filler to the GP binder was observed due to the inertness of plastic fillers toward alkali activators.

1. Introduction

The production of Ordinary Portland Cement (OPC) binder requires high energy and emits a great amount of CO2. Calcination of raw materials of OPC such as limestone and clay and burning (fossil) fuels to provide the required temperature (1400 °C) in the kiln accounts for about 5% of world CO2 emissions [1]. Furthermore, considering the 5% worldwide increase in OPC production per annum, the environmental impact is expected to be highly magnified in the future [2]. Accordingly, it is very important to develop new ecofriendly or green binding materials to replace OPC. One of these potential alternatives is alkali-activated materials or geopolymers (GPs), which were first introduced by Davidovits (1991) after the discovery that mixing calcined kaolin (metakaolin, MK) with a highly alkaline solution gives a hard product at a temperature (less than 100 °C) much lower than that used for sintering ceramic [3,4]. The aluminosilicate precursors are obtained from industrial wastes such as coal fly ash (FA) and blast furnace slag (BFS), or from geological sources such as calcined kaolin (MK) [5], among which the most abundant is coal fly ash water, estimated to be about 1.2 billion tons worldwide. Consequently, extensive research has been carried out on utilizing coal fly ash in GP concrete in place of OPC concrete [6].
The key factor in the adoption of GP technology is the local availability of suitable raw materials (precursors and activators), which minimizes the transport energy [7]. Kaolin, rather than coal-fired fly ash, is available in huge amounts in Jordan without any significant use in the ceramic industry due to the high energy cost [8]. Remarkably, it was estimated that kaolin reserve in Jordan is about 13,000 million tons, concentrated in the southern part of the country [9]. Furthermore, the heavy chlorine industry in Jordan results in NaOH by-product, which is the most commonly used alkaline activator in combination with sodium silicate [10]. Calcination of kaolin, which results in destroying the crystal structure, dehydroxylation and “amorphization”, is necessary to produce metakaolin that is highly reactive toward alkali activation. Though this calcination process needs energy, it was estimated that CO2 emissions associated with this process are less than 270 g/kg compared to 809 g/kg for production of OPC clinker [11].
The mechanism of geopolymerization was assumed to involve the dissolution of the aluminosilicate source under the attack of the OH ions of the alkaline activator and consequent liberation silicate and aluminate species. Second: reorientation, in which alumina and silica monomers begin to reorganize into larger groups, followed by release of water molecules. Finally, the three-dimensional network consisting of SiO4 and AlO4 tetrahedra sharing oxygen atoms structures is hardened [12,13,14].
A huge number of reactive and inert fillers are used in the preparation of GP mortars. Among these fillers are carbon fiber, basalt fiber, cotton, wool, graphene and organic polymers (plastics) such as poly(vinyl-alcohol), poly(lactic-acid), poly(acetal) [15]. Plastic fillers seem to be very attractive since they are produced in large amounts and there is a great demand for their recycling. The global production of resins and fibers increased from 2 Mt in 1950 to 380 Mt in 2015. The total amount of organic resins and fibers manufactured from 1950 through 2015 was 7800 Mt. Half of this—3900 Mt—was produced in the last 13 years [16]. The magnification of the plastic crisis will not stop, and about 11 billion metric tons of plastic will be accumulated in the environment by 2025 [17]. Thus, plastic pollution has become a global environmental problem since this waste does not degrade for decades or even for centuries [18]. Moreover, physical abrasion, ultraviolet (UV) radiation, temperature changes, and biological metabolism causes decomposition of the surface of plastic waste into microplastics (1 μm–5 mm) and nanoplastics (1–1000 nm). The negative impact of these fine particles is enhanced by their ability to adsorb and carry other environmental pollutants such as heavy metals and organic contaminants. Furthermore, the leaching of hazardous substances from plastic, such as solvents, initiators, catalysts, plasticizers, surfactants, lubricants, antioxidants, colorants, and flame retardants has adverse effects on the environment and health [17].
A significant part of plastic waste ends up in landfills, which exhausts useful land. On the other hand, the combustion of waste plastic is associated with emissions of carbon monoxide, dioxins, furans, polycyclic aromatic compounds, and heavy metals. Unfortunately, only 9% of plastic waste worldwide is recycled [17]. Hundreds of different plastic materials are commercially available, but there are six dominant types that account for around 70–90% of total demand. These are low-density polyethylene (LDPE), high-density polyethylene (HDPE), polypropylene (PP), polyvinyl chloride (PV), polystyrene (PS) and polyethylene terephthalate (PET) [19]. Some kinds of plastics are more recyclable than others. For example, PV, HDPE and PET are recyclable while PS, LDPE and PP are non-recyclable [20]. The main theme of the present article is to study the incorporation of PV, PS, LDPE and PP in geopolymeric matrix as an attempt to offer a new method for utilizing the accumulated plastic waste for the production of useful construction materials.
Incorporating plastic fillers into a fly-ash (FA)-based GP matrix was found to have variable effects on compressive strength, flexural strength, density and thermal conductivity. Regarding compressive strength, introducing 1.0% volume percent of polyvinyl alcohol into FA-based GPs resulted in a decrease of compressive strength from 44 to 40 MPa [21]. Similarly, the compressive strength of GP composites (fly ash and waste plastic bottle composed of PET activated with NaOH and Na2SiO3) ranges from 10–14 MPa when 1.5 vol% plastic waste was added which was lower than that of PET-free GP (17 MPa) [17]. A compressive strength of 51.95 MPa was reported for FA-based GPs containing 1.5% PVA compared with 40.73 MPa in the case of PVA-free GPs [22]. A drop ranging from 0.5 to 23% in MK/FA-based GPs were observed as a result of introducing 5–15% E-waste plastic [23]. Other works reflected more a dramatic drop in compressive strength due to 25% replacement of sand filler with recycled plastic beads in FA-based GPs, which resulted in reduction of compressive strength from 102.28 to 35.76 MPa [24]. Regarding flexure strength, a drop ranging from 14 to 31% in MK/FA-based GPs were observed as a result of incorporating 5–15% E-waste plastic [23]. Replacement of sand filler with 25% recycled plastic beads in FA-based GPs resulted in a decrease of flexural strength from 7.44 to 4.25 MPa [24]. On the other hand, FA-based GPs exhibited a slight increase in flexure strength by an increase in PVA content [22]. An interesting observation was reported by Shaikh (2020) that BFS/FA-based GPs containing 1–1.5% PET fiber exhibited higher compressive, flexure and tensile strength than OPC containing the same amount of PET fiber [18]. Thus, GP is more effective than OPC as a sink for plastic waste.
Few studies were reported on incorporating plastic waste in MK-based GPs [18,25,26]. MK-based GPs containing 1% polyacetal fiber exhibited flexural strength and compressive strength of 11 MPa and 62 MPa, respectively, compared to 4.5 MPa and 49 MPa, respectively, for fiber-free GPs [15]. Furthermore, PV/MK (60:40)-based GP composite materials were found to have flexural strengths (75 MPa) higher than the pure PV (59 MPa)- and MK-based GPs (15 MPa) [25]. These two studies reflected the positive effect of introducing plastics into MK-based GPs. On the other hand, the compressive strength of MK-based GPs (44.03 MPa) decreased by 14.08, 31.11, and 35.27% as a result of introducing 10, 20, and 30% waste plastic aggregate (mainly high-density polyethylene), respectively. Further, the flexural strength decreased by 7.57, 18.2, and 25.75%, respectively [26]. The present work attempts to extend the possibility of introducing more plastic fillers such as PS, LDPE and PP into the MK-based GP matrix.
Remarkably, replacement of sand filler with recycled plastic beads in FA-based GPs resulted in a drop of density from 2.14 to 1.22 g/cm3 and decrease of thermal conductivity from 1.33 to 0.32 W/mK, which enhances the insulating efficiency of GPs containing plastic waste [
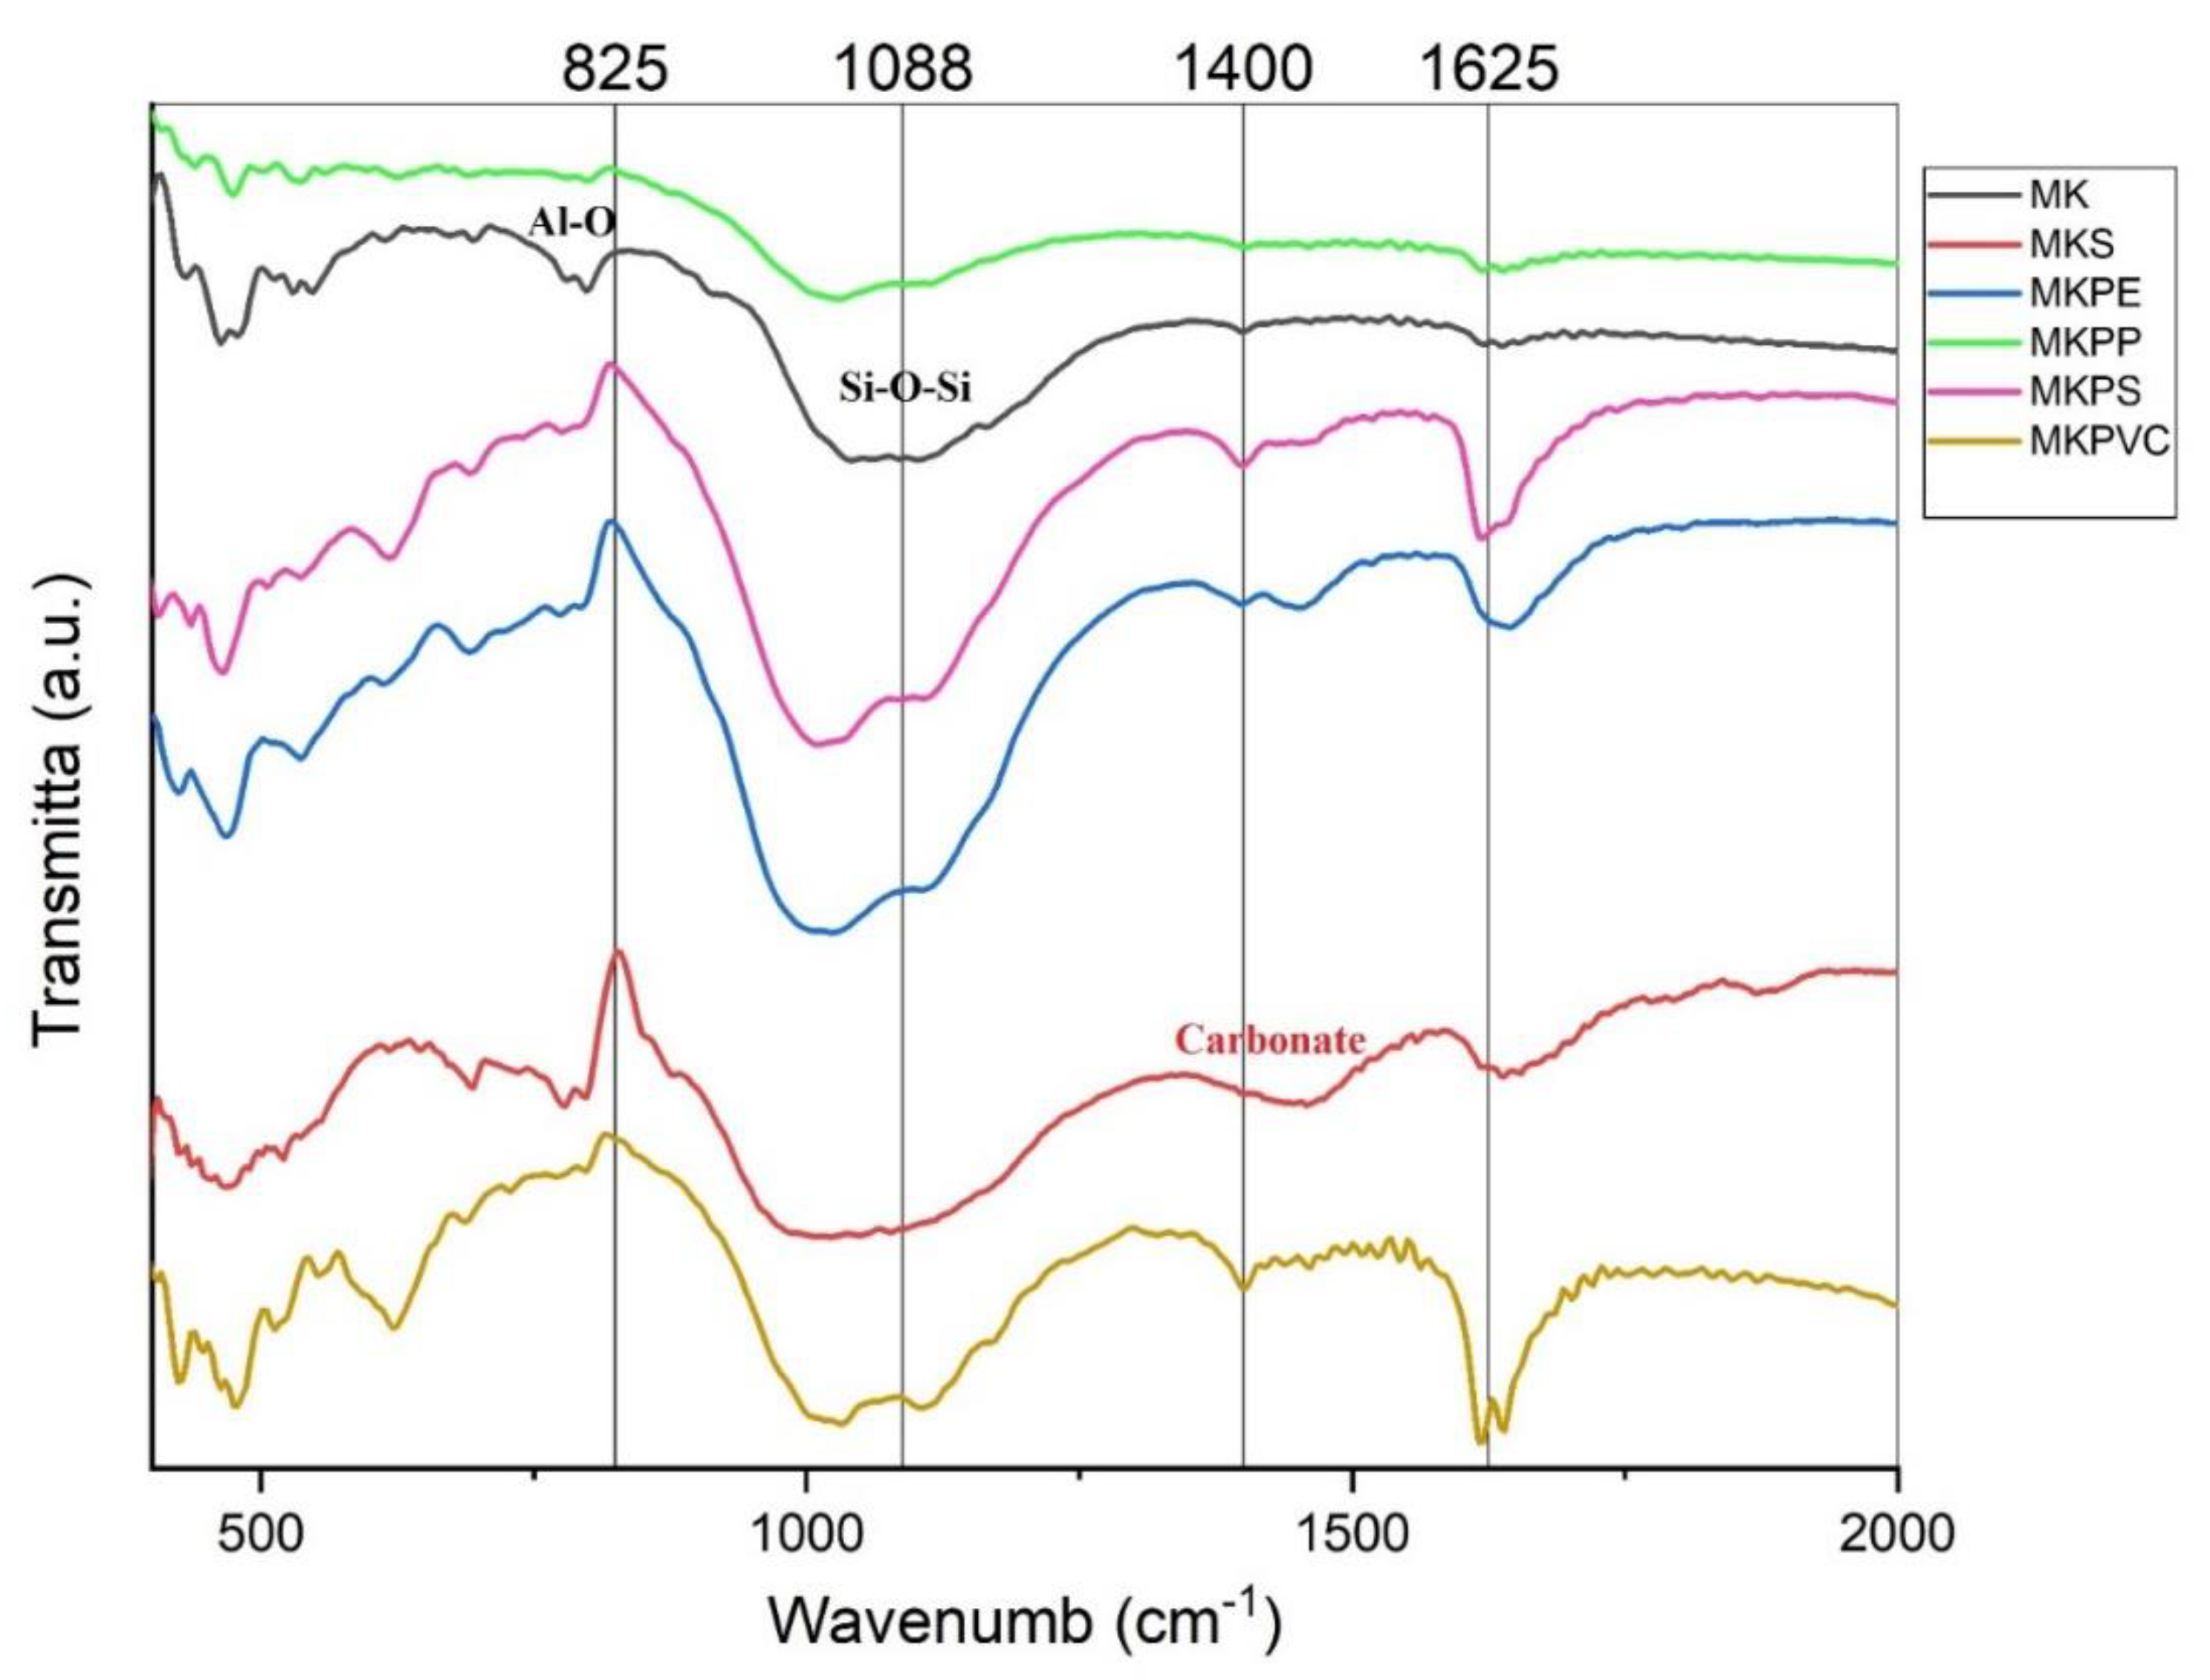
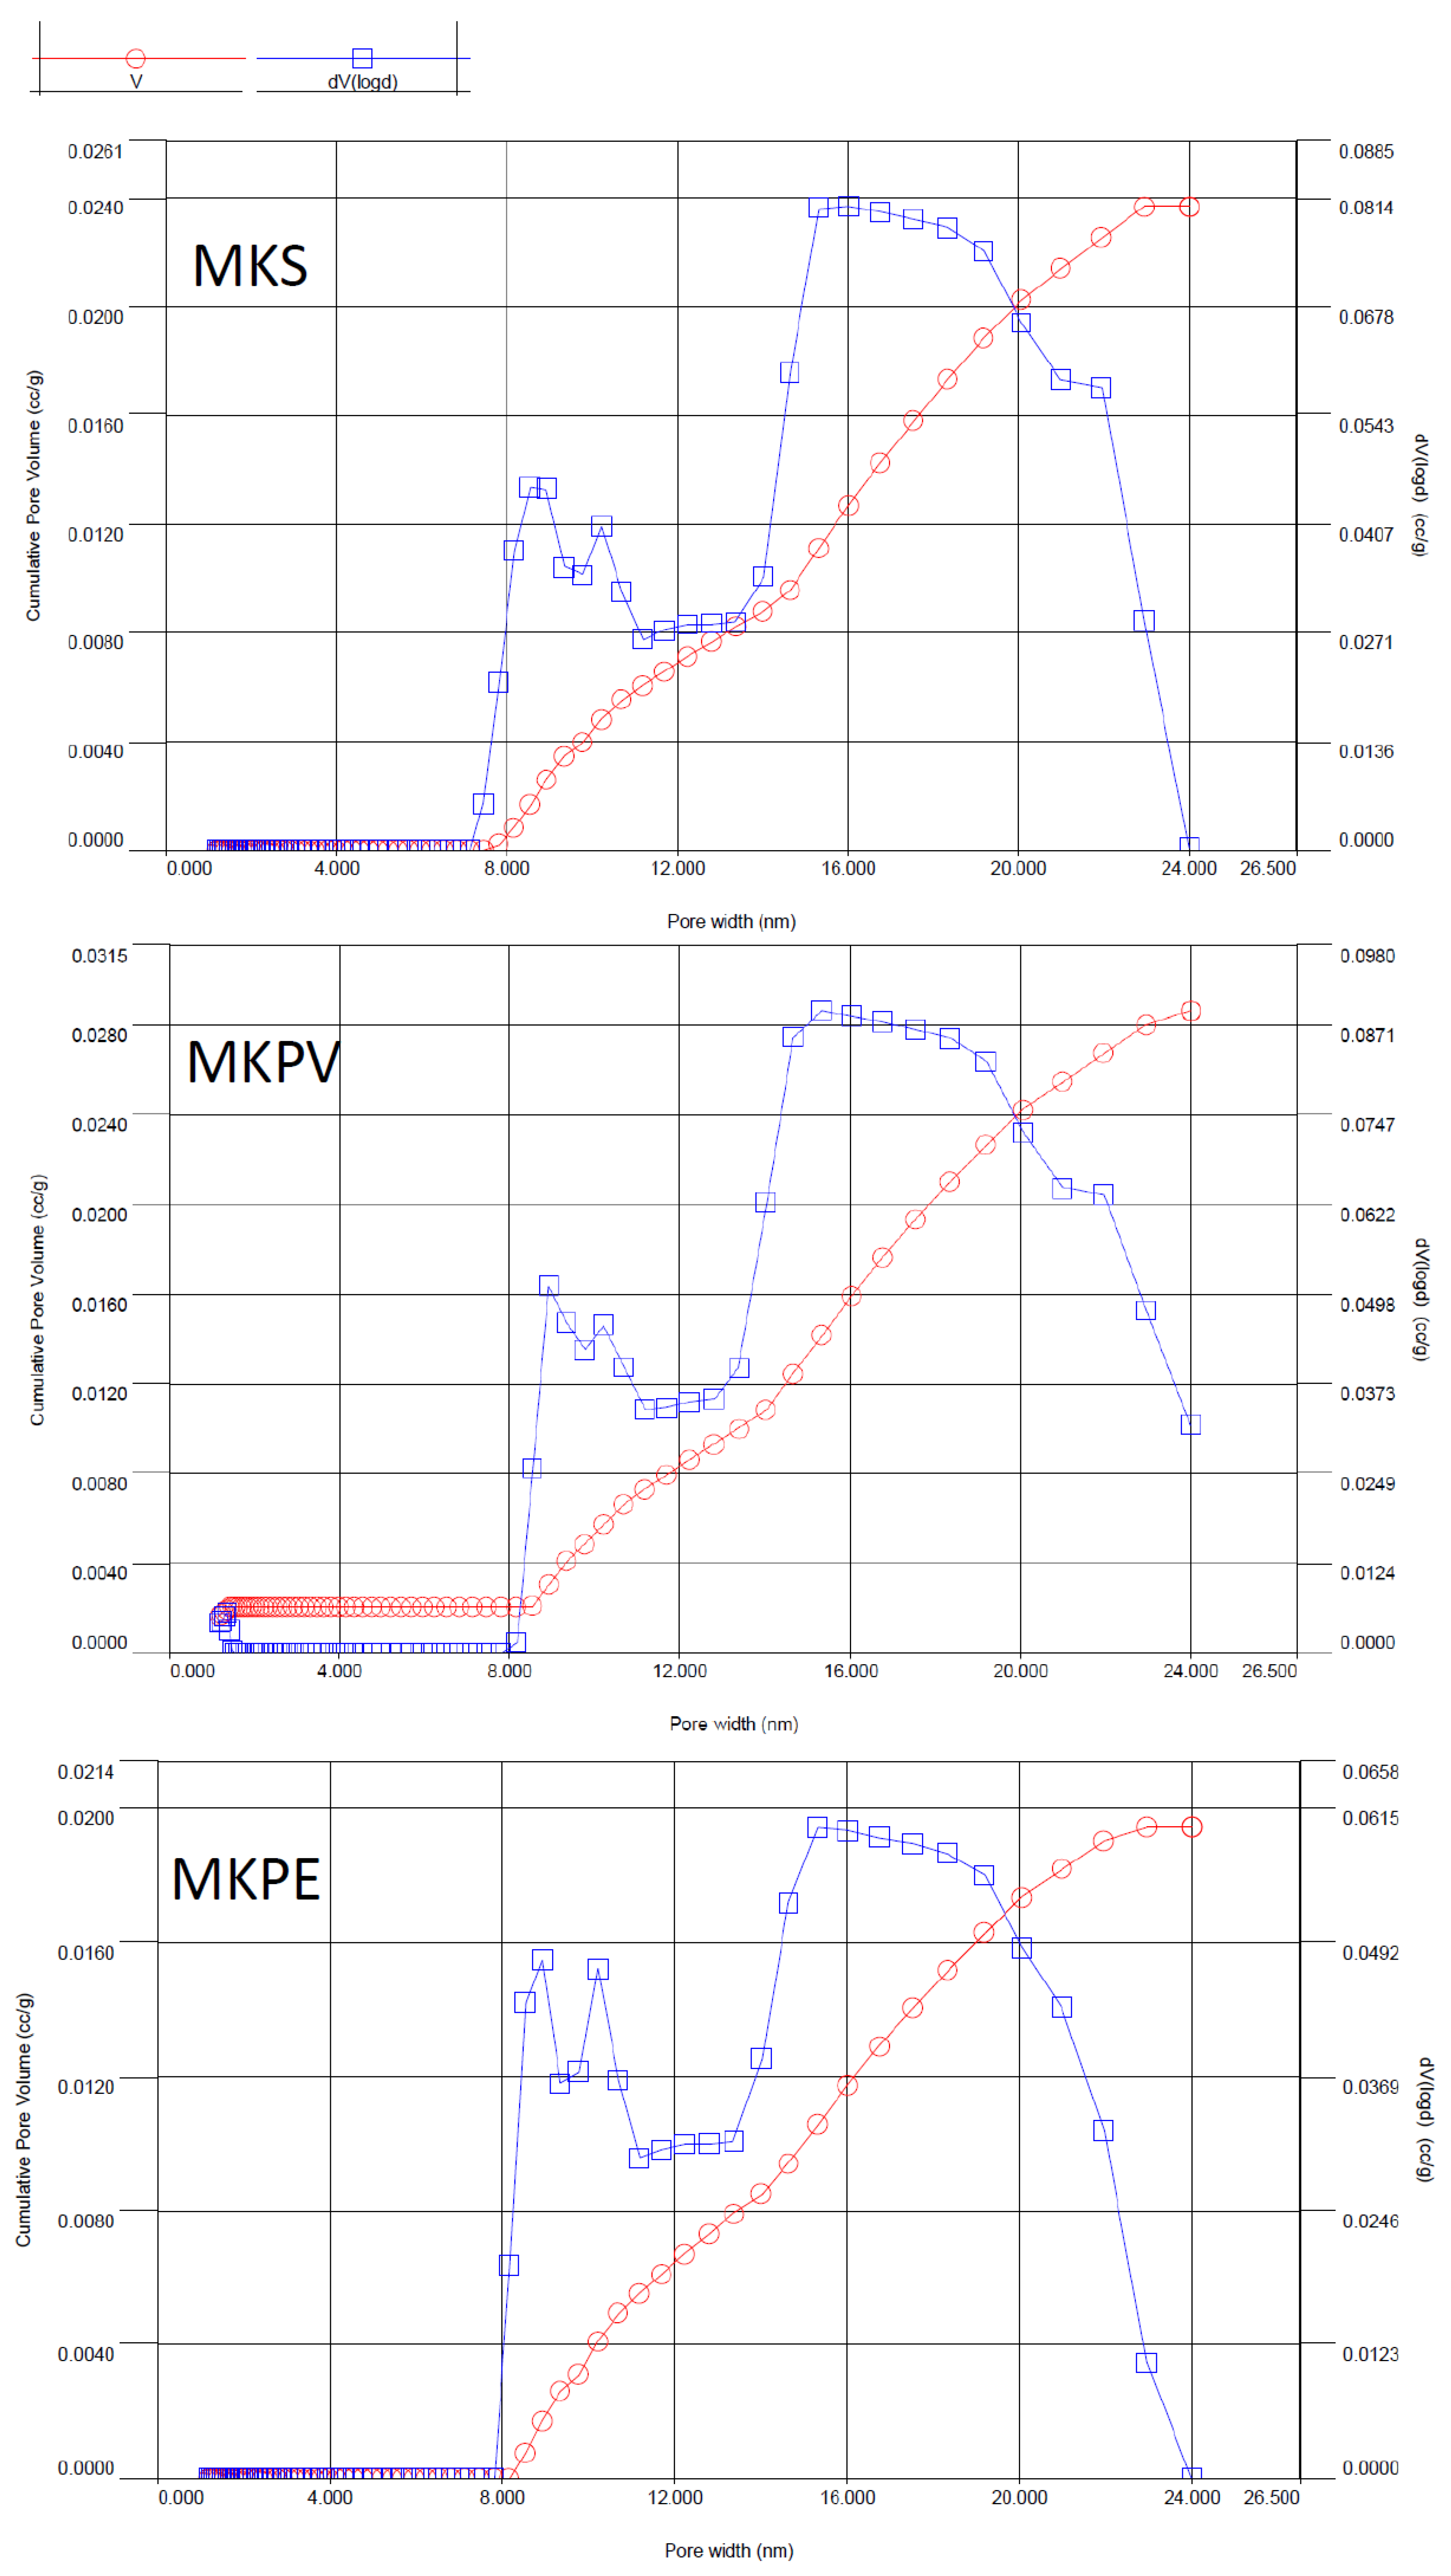
24]. Thus, despite giving an opportunity to reutilize plastic waste, incorporating plastic into the GPs may be useful in increasing the chemical resistance of geopolymers, and the decrease of density and thermal conductivity. The aim of the present work is to study the alkali activation of Jordanian kaolin (K) and metakaolin (MK) containing silica sand/plastic fillers such as recyclable polyvinyl chloride (PV) and nonrecyclable polystyrene (PS), low-density polyethylene (PE) and polypropylene (PP). The compressive strength, density, BET, FTIR, XRD and SEM of the prepared mortars will be evaluated to obtain some insight about the effect of alkaline activators on the bonder and fillers.

2. Materials and Methods

2.1. Materials

Kaolin was obtained from El-Hiswa deposit, which is located 45 km to the east of Al-Quweira town (south of Jordan). Kaolin was dried in the oven at 105 °C and crushed using Jaw crusher (RETCH-BB1A) to a grain size less than 425 mm. Metakaolin was prepared from kaolin by heating in a muffle furnace (model Carbolite CWF1100, UK) at 550 °C for 2 h. The silica sand was procured from Manaseer Company (Jordan) with grain size 250 g passing sieve no. 16 and retained sieve no. 35, 125 g passing sieve no. 35 and retained sieve no. 60, 125 g passing sieve no. 60 and retained sieve no. 125. Sodium hydroxide was obtained from Al-Saif chemical manufacturing (Jordan) and sodium silicate was obtained from Fluka (60 % SiO2, 40 %Na2O). The sources and specifications of plastic fillers are summarized in Table 1.

2.2. Synthesis of Geopolymeric Mortars

The mix proportions for kaolin- and metakaolin-based geopolymeric mortars are given in Table 2. Each sample was prepared by mixing either kaolin or metakaolin and silica sand with the alkaline activating solution, which consists of sodium hydroxide and sodium silicate, in a Bomann mixer for 5 min at 140 ± 5 rpm and 5 min at 285 ± 5 rpm. The produced slurry was then cast into a cubic mold (50 × 50 × 50 mm). The cast cubes were kept sealed at room temperature for 24 h, then cured at 60 °C for 24 h in the oven. After that, samples were left at room temperature and atmosphere for 7 or 28 days before the application of analysis. Silica sand was replaced with plastic samples in those samples prepared in Table 3. Three cubes were prepared from each mix proportion in Table 2 and Table 3.

2.3. Evaluation of Density and Compressive Strength of Geopolymeric Mortars

Density was determined by weighing the specimens to the nearest 0.0001 g, and dividing the mass by the corresponding dimensions of the specimens (i.e., so-called geometrical density). The compressive strength was obtained using an ELE ADR 2000 compression machine according to ASTM C109/C109M-20.

2.4. Microstructure Characterization of Samples

The FTIR spectra were recorded using the KBr pellets method (5% w/sample in KBr) with the FTIR (IRPrestige-21, Shimadzu Incorporation, Tokyo, Japan) instrument. The XRD was recorded using an X-ray diffractometer (XRD-7000, Shimadzu Incorporation, Tokyo, Japan) equipped with a Cu Kα radiation source and a Ni filter operating at 40 kV/30 mA in the range 2° ≤ 2Ɵ ≤ 60°. The scanning speed was 2° per min, and the sampling pitch was 0.02°. The XRD peaks were assigned using MATCH, version 3.14 Build, Copyright 2003–2022 Crystal Impact, H. Putz & K. Brandenburg, GbR, Bonn, Germany. The morphology (SEM images) of the surface of geopolymeric samples was determined using a Phenom XL G2 scanning electron microscope (Thermo Fisher Scientific Inc., Waltham, MA, USA). The SEM images were collected at 0.06–0.04 mbar with 15 kV accelerating voltage. BET samples were recorded using BET Surface Area Analyzer (Autosorb iQ2, Anton Paar India Pvt. Ltd., Mumbai, India).

3. Results and Discussion

3.1. Characterization of Precursors (Kaolin and Metakaolin)

The XRD pattern of Jordanian kaolin (K) obtained from El-Hiswa deposit is shown in Figure 1. Jordanian kaolin was found to contain kaolinite (PDF # 96-900-9231), quartz (PDF # 96-901-3322) and illite (PDF # 96-900-9666). This is consistent with previous reports that kaolin from El-Hiswa contains kaolinite (35–68%) which is associated with other minerals such as quartz (14–48%), mica (muscovite-illite) (2–14%), feldspars, gypsum, alunite (0.2–2.7%), and hematite (1.4–10%) [8]. A comparison between XRD patterns of kaolin and metakaolin (Figure 1) showed that kaolinite peaks disappeared completely after calcination, while those of quartz remained, as expected, unaffected. Thermal treatment of kaolin to produce metakaolin resulted in dehydroxylation and collapse of the 1:1 layer crystal structure of kaolin. Consequently, Al3+ ions change their valence six-coordination to metastable five- and four-coordination to the oxygen which is much more reactive toward alkali activation [27].

3.2. Evaluation of Density, Compressive Strength of Samples

The density of metakaolin-based GPs containing silica sand filler (MKS) was found (2.160 g/cm3) to be higher than that of the corresponding kaolin-based KS (1.968 g/cm3) as shown in Table 4. The reason beyond this observation is that alkali activation of metakolin is more effective than that of kaolin [28], and so the networking of silicate and aluminate is more effective in MKS. Replacement of plastic fillers (PS, PP, PE and PV) resulted in decrease of density (1.288–1.576 g/cm3) as shown in Table 5.
The values of compressive strengths of for alkali-activated kaolin (KS) and alkali-activated metakaolin (MKS) containing silica sand at ageing times of 7, 28, 63, 91, 154, 217, 273 and 364 days are given in Table 4. Duxson et al. reported a 28-day compressive strength of about 60 MPa for alkali-activated MK having Si/Al = 1.7 and Na/Al = 1 without filler, compared with 31 MPa having Si/Al = 1.7 and Na/Al = 0.8 in the present work [29]. MKS samples developed 42% of their final compressive strength after 7 days and 61% after 28 days, considering the final compressive strength after 364 days was 50 MPa. Compared with an analogous work of Rocha et al., the compressive strength of metakaolin-based GPs with silica sand filler and activated with a mixture of NaOH and Na2SiO3 gained approximately 72–81% of their final compressive strength after 3 days and 86–93% after 7 days, considering the final compressive strength after 28 days was 80 MPa [10]. The kaolin-based KS sample had much lower compressive strength (16 MPa) than MKS (50 MPa) samples due to the lower reactivity of kaolin compared to calcined kaolin (metakaolin). Konan et al., 2009 found that kaolin adsorbs alkaline calcium hydroxide in the basal faces and at the edges of the clay particles, which inhibit further dissolution of the clay. The calcination of kaolin to metakaolin, which involves dehydroxylation, amorphization, disintegration and change of Al coordination from 6 to 4 or 5, favors dissolution of clay in the alkaline solution. Consequently, metakaolin exhibited higher pozzolanic activity which facilitated formation of hydrated phases at the interfaces between metakaolin and the alkaline solutions [28].
As shown in Table 5, replacement of the silica sand filler with plastic filler resulted in a reduction of 28-day compressive strength of MK-based GPs, and the reduction was found to be dependent on the kind of plastic used:
MKPV (30 MPa) > MKPS ~MKPP (16 MPa) > MKPE (9 MPa)
where PV gave the highest compressive strength and PE gave the lowest. A compressive strength of 44.03 MPa was reported for MK-based GPs which decreased by 37.83, 30.33, and 28.50% as a result of introducing 10, 20, and 30% waste plastic aggregate (mainly high-density polyethylene), respectively [26]. As presented in Table 5, replacement of silica sand with plastic filler in kaolin-based GPs resulted in a drop of compressive strength from 6.84 MPa in KS to values ranging from 1.75 to 2.84 MPa in (KPS, KPP, KPE and KPV).
Remarkably, the compressive strength of samples containing plastic fillers decreased with increased aging from 7 to 28 days, in contrast with those containing silica sand. This point needs further investigation in the following sections using FTIR, XRD and SEM techniques. Poor adhesion of plastic filler was observed during determination of the compressive strength of samples and it is not necessarily applicable for samples under their rest conditions.

3.3. Microstructure Characterization of Samples

3.3.1. FTIR Study

The FTIR spectrum of metakaolin (MK) is given in Figure 2. The main bands in the range from 900–1200 cm−1 were ascribed to asymmetric Si-O-Si stretching [2,30,31], and the band at 795 cm−1 was assigned to Al-O stretching [30,31,32]. One of the most repeatedly observed changes in the FTIR spectral characteristics of MK upon alkali activation was the shift of the Si-O stretching vibration to a lower frequency, which was ascribed to the partial replacement of Si tetrahedron of metakaolin with Al tetrahedron [33]. This was observed also in the present work; the strong and broad hump band of Si-O stretching vibration at 1042 cm−1 in the case of MK was shifted to a lower frequency at 984 cm−1 in the FTIR spectrum of alkali-activated metakaolin containing silica sand filler (MKS). This shift was less pronounced in the case of MKPV (1030 cm−1), MKPP (1030 cm−1), MKPS (1011 cm−1) and MKPE (1003 cm−1) (Figure 2 and Table 6).
The characteristic carbonate peaks at 1447 (asymmetric stretching) and 1400 (symmetric stretching) [34] were observed significantly in the spectrum of silica sand filler (MKS) rather than in the plastic filler samples (MKPV, MKPP, MKPS and MKPE). Thus, addition of plastic filler reduces absorption of CO2 from the atmosphere. The relative peaks areas of carbonates bands to Si-O stretching are given in Table 6, which support the idea that the incorporation of plastic filler reduces the rate of carbonation. MKS was found to have a carbonation ratio of 0.89, which was much higher than that of MKPV, MKPP, PE and MKPS (0.22–0.68). Carbonation was reported to have an adverse effect on the compressive strength of alkali-activated material, especially when NaOH ad Na2SiO3 are used as binary activators [35], since it consumes part of alkali activator and prevents the effective dissolution of aluminosilicates.
The band at 779 cm−1 assigned to Al-O stretching [30,31,32] was not affected in MKS, while it mostly disappeared in the case of plastic fillers (MKPV, MKST, MKPP, MKPS and MKPE), reflecting more dissolution of Al as a result of more availability of alkaline solution due to preventing carbonation by plastic filler.

3.3.2. XRD Study

The XRD pattern of MKS (alkali-activated metakaolin with silica sand filler) was like that of metakaolin, which is dominated by quartz peaks due to the large amount of silica sand filler in the proportion mix. Additionally, the high silica content in MKS overshadowed the hump between 20 and 30 2θ usually observed in the XRD of MK-based GPs [14].

3.3.3. SEM Study

The SEM analysis of GP samples containing silica sand filler MKS (Figure 3) indicated that the silica sand filler is surrounded with different crystalline phases. On the other hand, the SEM of GP samples containing plastic fillers (MKPV and MKPE, Figure 3) exhibited an amorphous appearance with tissue-like structure. Furthermore, the plastic fillers did not exhibit strong adhesion to the GP matrix, since they were easily removed by blowing the samples with nitrogen gas before carrying out SEM analysis. A similar observation was made by the study of Lazorenko et al., which indicated poor fiber–matrix bonding, leading to pull-out of PET fibers from the GP matrix. This was ascribed to the poor adhesion of the hydrophobic plastic surface to the GP cement matrix [17].

3.3.4. BET Study

MK-based GPs containing plastic fillers (MKPV and MKPE) had, like that containing silica sand (MKS), exhibited low specific surface area and total pore volume, indicating the compact nature of the samples (Table 7). Their pore size distribution occurred in the range from 8 to 24 nm (Table 7 and Figure 4), indicating that the materials belonged to mesoporous materials. MK-based GPs prepared using different initial Si/Al and Na or K/Al molar ratios were reported to have BET surface area in the range of 19–110 m2/g, total pore volume of 0.15–0.4 m2/g and average pore volume of 13.8–32 nm [36]. Thus, it is clear that the samples prepared in the present work have much lower values due to the different nature of Jordanian kaolin. The non-porosity of samples protected them from disintegration when immersed in water as shown in Figure 5.

3.4. The Effect of Alkaline Activator on the Plastic Samples

Ügdüler et al. reported that PET plastic waste undergoes hydrolysis in alkaline medium [37]. Furthermore, PET fiber deterioration was observed in OPC containing PET fiber after 150 days of aging [38]. Thus, it is necessary to investigate the effect of alkaline-activating solution, used in GP preparation, on the plastic fillers of this study. Accordingly, the plastic samples were impregnated in the alkaline activator (NaOH and Na2SiO3) for 7 days to investigate their reactivity toward this solution. In general, plastic fillers were unreactive, except polyvinyl chloride (PV) and polystyrene (PS), which showed some weight loss upon impregnation in the alkaline activator (Table 8). Interestingly, PV exhibited the highest compressive strength as a filler in MKPV mortar (30.3 MPa, Table 5). Thus, hydrolysis of PV may increase compatibility between the organic plastic samples and the inorganic GP matrix.

4. Conclusions

Alkali-activated materials or geopolymers (GPs) are potential green alternatives for some applications of ordinary Portland cement. Incorporating plastic waste into alkali-activated cementing materials is a challenging issue due to poor adhesion between plastic and the GP matrix. However, the work in this field is worthy since it offers a new pathway to reduce the formidable problem of huge plastic accumulation in nature despite improving some properties of GPs, such as lowering density and thermal conductivity and increasing chemical resistance.
Satisfactory compressive strength was achieved for metakaolin-based GP mortars containing plastic fillers which was dependent on the nature of the plastic incorporated in the GP matrix: MKPV (30MPa) > MKPS~MKPP (16 MPa) > MKPE (9 MPa). The 28-day compressive strength of GPs containing PV was almost equivalent to that containing silica sand. As usually observed in previously reported works, the compressive strength of GP samples containing silica sand was found to increase with aging time. On the other hand, the compressive strength of GPs containing plastic fillers was found to decrease with aging time. This was ascribed to the lower rate of carbonation (absorption of atmospheric CO2 gas), as evidenced from the FTIR study. The plastic filler serves as a barrier that minimizes contact of alkali-activated GP gel with the atmosphere and consequently facilitates dissolution of Al species. The morphology of GPs containing plastic fillers exhibited amorphous tissue-like structure compared to crystalline structure in the case of GPs containing silica sand. Both types of GPs had remarkably low porosity which was much lower than usually prepared metakaolin-based GPs.

Author Contributions

F.M. and T.A. carried out all experiments, data curation, software, and writing—original draft. B.Z.M. contributed to supervision, validation, and review and editing. M.E.-T., B.E.-E. and F.K. contributed to conceptualization, methodology, investigation, project administration, data validation, and writing—original draft. All authors have read and agreed to the published version of the manuscript.

Funding

This work was supported by the Deanship of Scientific Research and the Pharmacological and Diagnostic Research Center at Al-Ahliyya Amman University.

Institutional Review Board Statement

Not applicable.

Informed Consent Statement

Informed consent was obtained from all subjects involved in the study.

Data Availability Statement

The data presented in this research are available on request from the corresponding author.

Conflicts of Interest

The authors declare no conflict of interest.

Abbreviations

Kkaolin.
MKmetakaolin.
GPgeopolymer or alkali-activated material.
KSalkali-activated kaolin containing silica sand filler.
KPSalkali-activated kaolin containing polystyrene filler.
KPPalkali-activated kaolin containing polpropylene filler.
KPEalkali-activated kaolin containing low density polyethylene filler.
KPValkali-activated kaolin containing polyvinylchloride filler.
MKSalkali-activated metakaolin containing silica sand filler.
MKPSalkali-activated metakaolin containing polystyrene filler.
MKPPalkali-activated metakaolin containing polpropylene filler.
MKPEalkali-activated metakaolin containing low density polyethylene filler.
MKPValkali-activated metakaolin containing polyvinylchloride filler.
OPCordinary Portland cement.

References

  1. Durastanti, C.; Moretti, L. Environmental Impacts of Cement Production: A Statistical Analysis. Appl. Sci. 2020, 22, 8212. [Google Scholar] [CrossRef]
  2. Xu, H.; Van Deventer, J.S.J. The geopolymerization of aluminosilicate minerals. Int. J. Miner. Process 2000, 59, 247–266. [Google Scholar] [CrossRef] [Green Version]
  3. Davidovits, J. GEOPOLYMERS: Inorganic polymeric new materials. J. Therm. Anal. 1991, 37, 1633–1656. [Google Scholar] [CrossRef]
  4. Adewuyi, Y.G. Recent Advances in Fly-Ash-Based Geopolymers: Potential on the Utilization for Sustainable Environmental Remediation. ACS Omega 2021, 6, 15532–15542. [Google Scholar] [CrossRef] [PubMed]
  5. Zhang, Y.; Sun, W.; Li, Z.; Zhou, X.; Chau, E.C. Impact properties of Geopolymers based extrudes incorporated with fly ash and PVA short fiber. Constr. Build. Mater. 2008, 22, 370–383. [Google Scholar]
  6. Ojha, A.; Aggarwal, P. Fly Ash Based Geopolymer Concrete: A Comprehensive Review. Silicon 2022, 14, 2453–2472. [Google Scholar] [CrossRef]
  7. Provis, J.L. Alkali-activated materials. Cem. Concr. Res. 2018, 114, 40–48. [Google Scholar] [CrossRef]
  8. Khoury, H.N. Review of clays and clay minerals in Jordan. Arab. J. Geosci. 2019, 12, 706. [Google Scholar] [CrossRef]
  9. Ministry of Energy and Mineral Resources. Mineral Status and Future Opportunity; Ministry of Energy and Mineral Resources: Kaolin, Nigeria, 2014.
  10. Thais da Silva, R.; Penteado Dias, D.; Coelho França, F.C.; Rangel de Salles Guerra, R.; Rodrigues da Costa de Oliveira Marques, L. Metakaolin-based geopolymer mortars with different alkaline activators (Na+ and K+). Constr. Build. Mater. 2018, 178, 453–461. [Google Scholar] [CrossRef]
  11. Hanein, T.; Thienel, K.C.; Zunino, F.; Marsh, A.; Maier, M.; Wang, B.; Canut, M.; Juenger, M.C.; Ben Haha, M.; Avet, F.; et al. Clay calcination technology: State-of-the-art review by the RILEM TC 282-CCL. Mater. Struct. 2022, 55, 3. [Google Scholar] [CrossRef]
  12. Palomo, A.; Grutzeck, M.W.; Blanco, M.T. Alkali-activated fly Palomo A, Grutzeck MW, Blanco MT (1999) Alkali-activated fly ashes: A cement for the future. Cem. Concr. Res. 1999, 29, 1323–1329. [Google Scholar] [CrossRef]
  13. Provis, J.L. Geopolymers and other alkali activated materials: Why, how, and what? Mater. Struct. 2014, 47, 11–25. [Google Scholar] [CrossRef]
  14. Duxson, P.; Fern_andez-Jim_enez, A.; Provis, J.L.; Lukey, G.C.; Palomo, A.; Van Deventer, J.S.J. Geopolymer technology: The current state of the art. J. Mater. Sci. 2007, 42, 2917–2933. [Google Scholar] [CrossRef]
  15. Davidovits, J. Reinforced Geopolymers Composites: A critical review, Materials Today. In Proceedings of the The Nuclear Materials Conference, Ghent, Belgium, 24–28 October 2022. [Google Scholar]
  16. Geyer, R.; Jambeck, J.R.; Law, K.L. Production, use, and fate of all plastics ever made. Sci. Adv. 2017, 3, e1700782. [Google Scholar] [CrossRef] [Green Version]
  17. Lazorenko, G.; Kasprzhitskii, A.; Fini, E.H. Sustainable construction via novel geopolymer composites incorporating waste plastic of different sizes and shapes. Constr. Build. Mater. 2022, 324, 126697. [Google Scholar] [CrossRef]
  18. Shaikh, F.U.A. Tensile and flexural behavior of recycled polyethylene terephthalate (PET) fiber reinforced Geopolymers composites. Constr. Build. Mater. 2020, 245, 118438. [Google Scholar] [CrossRef]
  19. Dilkes-Hoffman, L.S.; Pratt, S.; Lant, P.A.; Laycock, B. The Role of Biodegradable Plastic in Solving Plastic Solid Waste Accumulation. In Plastics Design Library, Plastics to Energy; Al-Salem, S.M., Ed.; William Andrew Publishing: Norwich, NY, USA, 2019; pp. 469–505. [Google Scholar] [CrossRef]
  20. Grigore, M. Methods of Recycling, Properties and Applications of Recycled Thermoplastic Polymers. Recycling 2017, 2, 24. [Google Scholar] [CrossRef] [Green Version]
  21. Zhang, P.; Xu, H.; Zheng, Y.; Wan, J.; Hui, D. Effect of PVA fiber on mechanical properties of fly ash-based geopolymer concrete. Rev. Adv. Mater. Sci. 2021, 60, 418–437. [Google Scholar] [CrossRef]
  22. Kaya, M.; Köksal, F. Influences of high temperature on mechanical properties of fly ash based geopolymer mortars reinforced with PVA fiber. Rev. Construcción 2021, 20, 393. [Google Scholar] [CrossRef]
  23. Verma, P.; Dhurvey, P.; Sundramurthy, V.P. Potential Assessment of E-Waste Plastic in Metakaolin Based Geopolymer Using Petrography Image Analysis. Adv. Mater. Sci. Eng. 2022, 2022, 7790320. [Google Scholar] [CrossRef]
  24. Wongkvanklom, A.; Patcharapol, P.; Sahalaph, H.; Vanchai, S.; Ampol, W.; Duangkanok, T.; Prinya, C. Lightweight Geopolymer Concrete Containing Recycled Plastic Beads. Key Eng. Mater. 2019, 801, 377–384. [Google Scholar] [CrossRef]
  25. Song, X.; Cui, X.; Lin, K.; Zheng, G.; He, Y. Hot-pressure forming process of PVC/geopolymer composite materials. Appl. Clay Sci. 2013, 71, 32–36. [Google Scholar] [CrossRef]
  26. Khalil, W.I.; Frayyeh, Q.J.; Ahmed, M.F. Sustainable Metakaolin-Based Geopolymer Concrete with Waste Plastic Aggregate. In Proceedings of the 4TH International Sustainable Buildings Symposium (ISBS2019), Dallas, TX, USA, 18–20 July 2020. [Google Scholar]
  27. Hanzlíček, T.; Perná, I.; Uličná, K.; Římal, V.; Štěpánková, H. The Evaluation of Clay Suitability for Geopolymer Technology. Minerals 2020, 10, 852. [Google Scholar] [CrossRef]
  28. Konan, K.L.; Peyratout, C.; Smith, A.; Bonnet, J.-P.; Rossignol, S.; Oyetola, S. Comparison of surface properties between kaolin and metakaolin in concentrated lime solutions. J. Colloid Interface Sci. 2009, 339, 103–109. [Google Scholar] [CrossRef]
  29. Duxson, P.; Provis, J.L.; Lukey, G.C.; Mallicoat, S.W.; Kriven, W.M.; van Deventer, J.S.J. Understanding the relationship between geopolymer composition, microstructure and mechanical properties. Colloids Surf. A Physicochem. Eng. Asp. 2005, 269, 47–58. [Google Scholar] [CrossRef]
  30. Ilic, B.R.; Mitrovic, A.A.; Milicic, L.R. Thermal treatment of kaolin clay to obtain metakaolin. Hem. Ind. 2010, 64, 351–356. [Google Scholar] [CrossRef] [Green Version]
  31. Lee, W.K.W.; van Deventer, J.S.J. The effects of inorganic salt contamination on the strength and durability of geopolymers. Colloid. Surf. A Physicochem. Eng. Asp. 2002, 211, 115–126. [Google Scholar] [CrossRef]
  32. Tarte, P. Infra-red spectra of inorganic aluminates and characteristic vibrational frequencies of AlO4 tetrahedra and AlO6 octahedral. Spectrochim. Acta Part A Mol. Spectrosc. 1967, 23, 2127–2143. [Google Scholar] [CrossRef]
  33. Yunsheng, Z.; Wei, S.; Qianli, C.; Lin, C. Synthesis and heavy metal immobilization behaviors of slag based geopolymer. J. Hazard. Mater. 2007, 143, 206–213. [Google Scholar] [CrossRef]
  34. Mostafa, N.Y.; Shaltout, A.A.; Omar, H.; Abo-El-Enein, S.A. Hydrothermal synthesis and characterization of aluminum and sulfate substituted 1.1 nm tobermorites. J. Alloys Compd. 2009, 467, 332–337. [Google Scholar] [CrossRef]
  35. Rashad, A.M. A synopsis of carbonation of alkali-activated materials. Green Mater. 2019, 17, 118–136. [Google Scholar] [CrossRef]
  36. Luukkonen, T.; Tolonen, E.T.; Runtti, H. Optimization of the metakaolin geopolymer preparation for maximized ammonium adsorption capacity. J. Mater. Sci. 2017, 52, 9363–9376. [Google Scholar] [CrossRef] [Green Version]
  37. Ügdüler, S.; Kevin, M.; Van Geem, R.D.; Roosen, M.; Mys, N.; Ragaert, K.; De Meester, S. Towards closed-loop recycling of multilayer and colored PET plastic waste by alkaline hydrolysis. Green Chem. 2020, 22, 5376–5394. [Google Scholar] [CrossRef]
  38. Pelisser, F.; Montedo, O.R.K.; Gleize, P.J.P.; Roman, H.R. Mechanical Properties of Recycled PET Fibers in Concrete. Mater. Res. 2012, 15, 679–686. [Google Scholar] [CrossRef]
Figure 1. XRD of raw materials Jordanian kaolin and metakaolin.
Sustainability 14 15742 g001
Figure 2. FTIR bands of metakaolin (MK) and its alkali-activated products in the presence of silica filler (MKS) and plastic fillers (MKPV, MKPP, MKPS and MKPE).
Sustainability 14 15742 g002
Figure 3. SEM analysis of metakaolin-based geopolymer with different fillers: silica sand (MKS), polyvinylchloride (MKPV) and polyethylene (MKPE).
Sustainability 14 15742 g003
Figure 4. Pore size distribution of metakaolin-based geopolymer containing silica (MKS) sand and plastic samples (MKPV and MKPE).
Sustainability 14 15742 g004
Figure 5. Resistance of metakaolin-based GPs containing silica sand (MKS) to disintegration in water, (a) before, (b) immediately after and (c) after 24 h of immersing in distilled water.
Sustainability 14 15742 g005
Table 1. Sources and specifications of plastic fillers used in this work.
Plastic FillersAbbreviationSourceSpecifications
PolystyrenePSSabic, Saudi ArabiaDensity 0.60 g/mL, tensile strength 43 MPa.
Low density polyethylenePEQatar Petrochemical Company, QatarDensity 0.923 g/mL, tensile strength 35 MPa.
PolypropylenePPSabic, Saudi ArabiaDensity 0.905 g/mL, tensile strength 28 MPa.
Polyvinyl chloridePVSabic, Saudi ArabiaSuspension.
Table 2. Mix proportions (in grams) of kaolin (K)- and metakaolin (MK)-based geopolymeric samples using silica sand filler.
CodeKaolinMetakaolinSilica SandNaOH Solution (12 M)Sodium Silicate Solution (Jordan)Sodium Silicate Solution (Fluka)
KS2160500808080
MKS0216500808080
Table 3. Mix proportions (in grams) of geopolymeric samples containing plastic filler.
CodeType of Plastic FillerPlastic FillerKaolinMetakaolinSodium Hydroxide (12 M)Sodium Silicate Solution
KPSPolystyrene275725 160160
KPPPolypropylene275725 160160
KPELow-Density Polyethylene275725 160160
KPVSuspension Polyvinyl Chloride275725 160160
MKPSPolystyrene275 725160160
MKPPPolypropylene275 725160160
MKPELow-Density Polyethylene275 725160160
MKPVSuspension Polyvinyl Chloride275 725160160
Table 4. Density (g/cm3) and compressive strength (MPa) of kaolin- and metakaolin-based geopolymer samples containing silica sand filler.
Type of SampleDensity (g/cm3)Compressive Strength (MPa)
7 Days28 Days63 Days91 Days154 Days217 Days273 Days364 Days
KS1.96806.847.528.549.1211.0113.7816.2
RSD%-01.755.981.992.080.730.510.25
MKS2.16021.1630.6834.1637.8438.0244.7347.9150.43
RSD%-1.840.490.502.670.531.431.170.87
Table 5. Density (g/cm3) and compressive strength (MPa) of kaolin- and metakaolin-based geopolymer samples containing plastic filler.
CodeDensity (g/cm3)Compressive Strength (MPa)
7 DaysRSD %28 DaysRSD %
KPS1.5768.0310.292.8434.71
KPP1.3283.5316.131.753.80
KPE1.2884.49.202.2412.03
KPV1.4883.849.822.5316.47
MKPS1.48016.058.1015.803.47
MKPP1.36017.720.4015.872.76
MKPE1.4089.973.409.057.79
MKPV1.47236.254.1630.32.36
Table 6. FTIR bands of metakaolin (MK) and its alkali-activated products in the presence of silica filler (MKS) and plastic fillers (MKPV, MKST, MKPP, MKPS and MKPE).
FTIR BandMKMKSMKPVMKPPMKPSMKPE
1Al-O stretching779.24779.24 775.38
2Si-O stretching1041.56983.71029.991029.991010.71002.98
3Carbonate 1400.321400.321400.321400.321400.32
1446.61 1459.33
Relative intensity of 3 to 2 0.890.220.290.260.68
Table 7. BET specific surface area, total pore volume and average pore size of samples.
BET Specific Surface Area (m2/g)Total Pore Volume (cm3/g)Average Pore Volume (nm)
MKS2.40.001316.0
MKPV4.30.02915.3
MKPE1.90.01915.3
Table 8. Effect of alkaline activator on the plastic samples.
Plastic SampleInitial MassMass After Impregnation in Alkaline Activator% Mass Change
PP1.0888 g1.0412−4.4
PV1.00430.8179−18.6
PE1.13211.18574.7
PS1.06770.9667−9.5
Publisher’s Note: MDPI stays neutral with regard to jurisdictional claims in published maps and institutional affiliations.

