Article

Assessment of the Sustainability of the Resource-Based Province Shanxi, China Using Emergy Analysis

1
Environment School, Renmin University of China, Beijing 100872, China
2
Collaborative Innovation Center of Extreme Optics, Shanxi University, Taiyuan 030006, China
*
Author to whom correspondence should be addressed.
Sustainability 2022, 14(23), 15706; https://doi.org/10.3390/su142315706
Submission received: 29 September 2022 / Revised: 21 November 2022 / Accepted: 21 November 2022 / Published: 25 November 2022

Abstract

:
According to the BP Statistical Yearbook of World Energy, China’s coal production and consumption have ranked first in the world in recent years. Shanxi, a central China province, plays an important role in China’s energy supply because of its large coal reserves, long mining history, and high output. The aim of this study was to evaluate the sustainability of the eco-economic system in Shanxi Province, a typical resource-based region. Through emergy analysis, this study quantified the sustainable development of the eco-economic system in Shanxi Province from 2013 to 2020 from five dimensions: basic emergy quantity, social subsystem, economic subsystem, environmental subsystem, and capacity for sustainable development. The results show that Shanxi Province has made great progress in recent years in terms of the emergy value of renewable resources, per capita emergy consumption, and electricity emergy ratio, but the proportion of nonrenewable emergy is still large, the intensity of emergy is high, and the exchange rate of emergy is low. Lastly, the sustainable development indicators ESI and EISD reflect that Shanxi Province is gradually improving the utilization efficiency of resources, and Shanxi Province has achieved certain results after experiencing transition pains. This study, combined with the actual situation of Shanxi Province and the problems found, puts forward corresponding countermeasures. The analysis method used in this study provides a theoretical basis for the scientific evaluation of the sustainable development of a resource-based region, and the research results have profound practical significance for improving the quality of Shanxi’s economic development and helping Shanxi’s economic transformation.

1. Introduction

The development of China in recent years has made remarkable achievements; however, there are also some problems such as the excessive consumption of natural resources and the destruction of the ecological environment. According to the BP Statistical Yearbook of World Energy (2022), China’s primary energy consumption accounted for 26.5% of the world total in 2021 [1]. According to the China Mineral Resources Report 2022 issued by The Ministry of Natural Resources of the People’s Republic of China, coal consumption in China accounted for 56.0% of the total primary energy consumption in 2021 [2]. In addition, the massive consumption of fossil fuel around the world has led to an increase in pollutants, waste gases, and global warming. These problems threaten the harmonious relationship between human beings and the economy, society, and environment, thus affecting the balance of social, economic, and environmental objectives [3] and shaking the sustainable development of the ecological and economic system. As a responsible major country, China has seized opportunities and faced challenges since the Rio Conference, actively pushing sustainable development to a new level [4]. How to scientifically evaluate the sustainable development of a region, quantify the role of natural resources in economic development, and correctly analyze and deal with the relationship between man and nature, the environment, and the economy are hot issues in ecological economy research.
This study selected Shanxi Province of China, an important energy base in the world, as the object. In 2021, the raw coal output of industrial enterprises above a designated size in Shanxi Province was 1.19 billion tons [5]. China’s coal output was 4.15 billion tons, and the world’s coal output was 8.17 billion tons [1]. In 2021, Shanxi’s raw coal output accounted for 14.6% of the world total. As China’s most important energy base and an important heavy industrial province in the north of China, Shanxi can be said to be a giant “engine” of China’s economic development [6]. Shanxi has long provided a huge source of energy for the Republic’s construction. By referring to the Shanxi Statistical Yearbook [7] and China Statistical Yearbook [8] in recent years and parsing the primary energy production data, this paper concluded that the primary energy production of Shanxi Province in recent years fluctuated downward from 2011 to 2016 and fluctuated upward from 2017 to 2020. In recent years, the primary energy production of Shanxi decreased to about 20% of China’s total. Figure 1 shows the primary energy production of Shanxi Province and China in recent years.
How to effectively assess the sustainable development of resource-based areas, find local problems, and propose specific solutions is a topic worth exploring. In recent years, Chinese governments at all levels carried out a series of policies to promote the transformation of resource-based regions. Among these policies which have had a profound impact, The National Sustainable Development Plan for Resource-Based Cities (2013–2020) [9] was issued by The State Council of China in November 2013. In this plan, all prefecture-level cities in Shanxi Province, except for Taiyuan (the provincial capital), were listed among resource-based cities. This plan provides the direction and requirement for realizing the sustainable development of resource-based regions. This study takes the changes in the capacity of sustainable development in the eco-economic system of Shanxi Province from 2013 to 2020 as the research object, which has great significance for studying how to better realize sustainable development in resource-based regions and measuring the effect of the National Sustainable Development Plan for Resource-Based Cities (2013–2020) policy of the Chinese government.
In recent years, scholars around the world have conducted several studies assessing regional sustainable development. Some scholars specialized in assessing the sustainability of specific types of regions. Sai Liang and Tian Zhu Zang et al. used the pressure-state-response (DPSR) model and material flow analysis method to evaluate the sustainable development of Suzhou, an export-oriented city in China [10]. Marco Ascione, Luigi, and Campanella et al. assessed the sustainability of the mega-city of Rome [11]. Oleg N. Yanitsky thought that Russia and several other so-called transitional societies were maintaining their sustainability at the cost of non-modernization and the over-exploitation of natural and human resources, as well as discussed how sustainable development in Russia could be achieved [12]. Some scholars also used geographic information technology and mathematical models to help analyze the sustainable development of different regions. Keihan Hassanzadehkermanshahi and Sara Shirowzhan used factorization and F-ANP models to assess and compare levels of sustainability in different regions and at different scales in order to identify areas requiring urgent prevention or mitigation strategies and action plans [13]. Parviz Mohamadzadeh and Samereh Pourmoradian et al. proposed an efficient mapping method based on the application of a spatial decision system and geographic information science, which adopted sustainable development indicators and was successfully applied to the East Azerbaijan Province of Iran, through GIS decision rules and spatial analysis, to measure the sustainable development ability of different districts and counties in the region [14]. Lin Ding and Zhenfeng Shao et al. constructed an urban sustainable development index system from the three aspects of society, economy, and environment, used the TOPSIS-entropy method to measure the sustainable development level of 287 cities in China, and analyzed the spatial distribution to give specific suggestions [15]. Some scholars have also carried out research on the sustainable development of resource-based regions. Zhaorui Jing and Jinman Wang et al. introduced the complex network method to systematically analyze the development process of a typical RBC (Shuozhou) in China from 1989 to 2016 [16]. Li Li and Yalin Le et al. used the data envelopment analysis (DEA) model to evaluate the development of the resource-based city Jiaozuo after the transformation in order to provide a basis for the future development planning of Jiaozuo [17].
The above literature review shows that few scholars evaluated the sustainable development of resource-based regions. Those that did commonly used the following methods: establishing the sustainable development index system, setting up the weight of each index, using the TOPSIS-entropy evaluation method to measure, and combining geographic information technology to distinguish the sustainable development force of different types of regions. However, these methods do not measure the contribution and role of natural resources to economic development. The emergy analysis theory, founded by the famous American ecologist H. T. Odum in the 1980s, transforms different types of matter and energy in the ecological economic system into unified standard emergy values for quantitative research. Emergy, a new scientific concept and metric developed from systems ecology and ecological economics, provides us with a standard to measure the real contribution of natural resources to economic development.
Since its establishment, emergy analysis has been recognized by the governments and scientific research organizations of various countries. Scholars from various countries have published many research results based on the emergy method in various fields. In terms of spatial scale research, Yuxue Pan and Boya Zhang et al. took SiMao of China as an example and then constructed an emergy-based index considering ecosystem services to evaluate the sustainability performance of urban systems [18]. Yigang Wei and Yan Li et al. assessed sustainability and green GDP in the mega-city of Wuhan using emergy analysis [19]. In terms of ecosystem research, ZahraAmiri and Mohammad Reza Asgharipour et al. studied the sustainability of two rapeseed farming ecosystems in Khorramabad, Iran, using emergy analysis and economic analysis, and they concluded that the main reason for the low sustainability of the oilseed rape commercial production system was the large amount of soil organic matter consumed per unit of nonrenewable resources [20]. XiaoHong Zhang and ShiHuai Deng et al. analyzed the sustainability of an urban wastewater treatment ecosystem in Mingjingtan Sewage Treatment Plant in Wanzhou City, Chongqing, based on emergy values, suggesting that STE should be optimized to improve its economic benefits, In addition, a comprehensive wastewater treatment strategy was briefly discussed [21]. In terms of theoretical research on emergy analysis, Brown and Ulgiati proposed, for the first time, an index (ESI) to measure sustainability using emergy analysis, ESI = EYR/ELD (emergy sustainability = emergy productivity/environmental load rate), which made up for the gap in the evaluation index of system sustainability in emergy analysis [22]. Lu Hongfang, Ye Zheng, and Zhao Xinfeng et al. analyzed EISD on the basis of an analysis of the shortage of the sustainability emergy index proposed by Brown and Ulgiati, combined with the concept of sustainable development [23].
At present, scholars from all over the world have carried out many studies on the regional sustainable development of Shanxi Province. Biao Liu, Jinman Wang, and Zhaorui Jing et al. designed an evaluation system that can comprehensively reflect the transformation and coordination of resource-based cities; the entropy weight method and fuzzy membership function were used to calculate the transformation degree (TD), coordination degree (CD), and transformation sustainability coefficient (TSC) of 10 resource-based cities in Shanxi Province of China from 2007 to 2016 [24]. Xia Cao took Shanxi Province as an example to explore the policy and regulatory issues affecting tourism and its sustainability, as well as assess the possible options to foster an improved policy and regulatory framework for China’s sustainable tourism development [25]. Herui Cui and Ruirui Wu established a VAR model of the 3E system in Shanxi province to analyze the dynamic relationship linking energy, the economy, and the environment [26]. GengHong and ZhangKai took small industrial mining cities in Shanxi Province as the research subject, investigated their function transformation and various problems during sustainable development as the main content, and proposed relevant strategies for their sustainable development [27].
Shanxi Province has also been investigated using emergy analysis. Run-ping Wang and Xiang-min Rong used emergy analysis to study the input/output, work efficiency, and environmental load of the agro-ecosystem in Shanxi Province in 2005 [28]. Guo and Dong et al. applied emergy synthesis and information entropy to estimate the urban ecosystem health of Taiyuan (the capital city in Shanxi) during the 2001–2017 period, providing insight into the policy implications [29]. Xiuli Liu and Pibin Guo et al. took Shanxi Province as a case study and applied emergy analysis to build a multi-index sustainability evaluation system of a coal mining area in China during 2006–2015 [30].
The above review shows that, although scholars had many research achievements on the sustainable development of Shanxi Province, most of them failed to include the contribution of nature to and its influence on human development. Although emergy analysis has been used to evaluate the ecological economic system of sustainable development in Shanxi, there have been no studies specifically assessing sustainability across time or the sustainable development of resource-based regions. Through the emergy evaluation of the eco-economic system in Shanxi Province, previous studies used several index studies for evaluation; however, this was not combined with the local development goals of Shanxi Province. Relatively speaking, the literature is not very comprehensive.
This study takes Shanxi Province, China as the research target and uses the metric of emergy to analyze the change in the sustainable development force of Shanxi’s eco-economic system from 2013 to 2020. On the basis of the achievements of Shanxi Agenda 21 and other scholars’ regional sustainable development indices based on emergy analysis, this study also constructed a sustainable development index system of Shanxi’s eco-economic system and then evaluated the local sustainable development ability by sorting and calculating the data of Shanxi Province from 2013 to 2020. The analysis framework of this study is structured as follows: Section 1, research background, study significance, and literature review; Section 2, introduction of the research area, presentation of the research methods, basic data sorting, and calculation and construction of the sustainable evaluation index system; Section 3, evaluation and analysis of the sustainable development force of Shanxi’s eco-economic system from five dimensions; Section 4, identification of the problems encountered in Shanxi’s development, proposal of specific countermeasures, and overview of the limitations of the work and future research directions; Section 5, conclusions.

2. Materials and Methods

2.1. Background of Shanxi Province

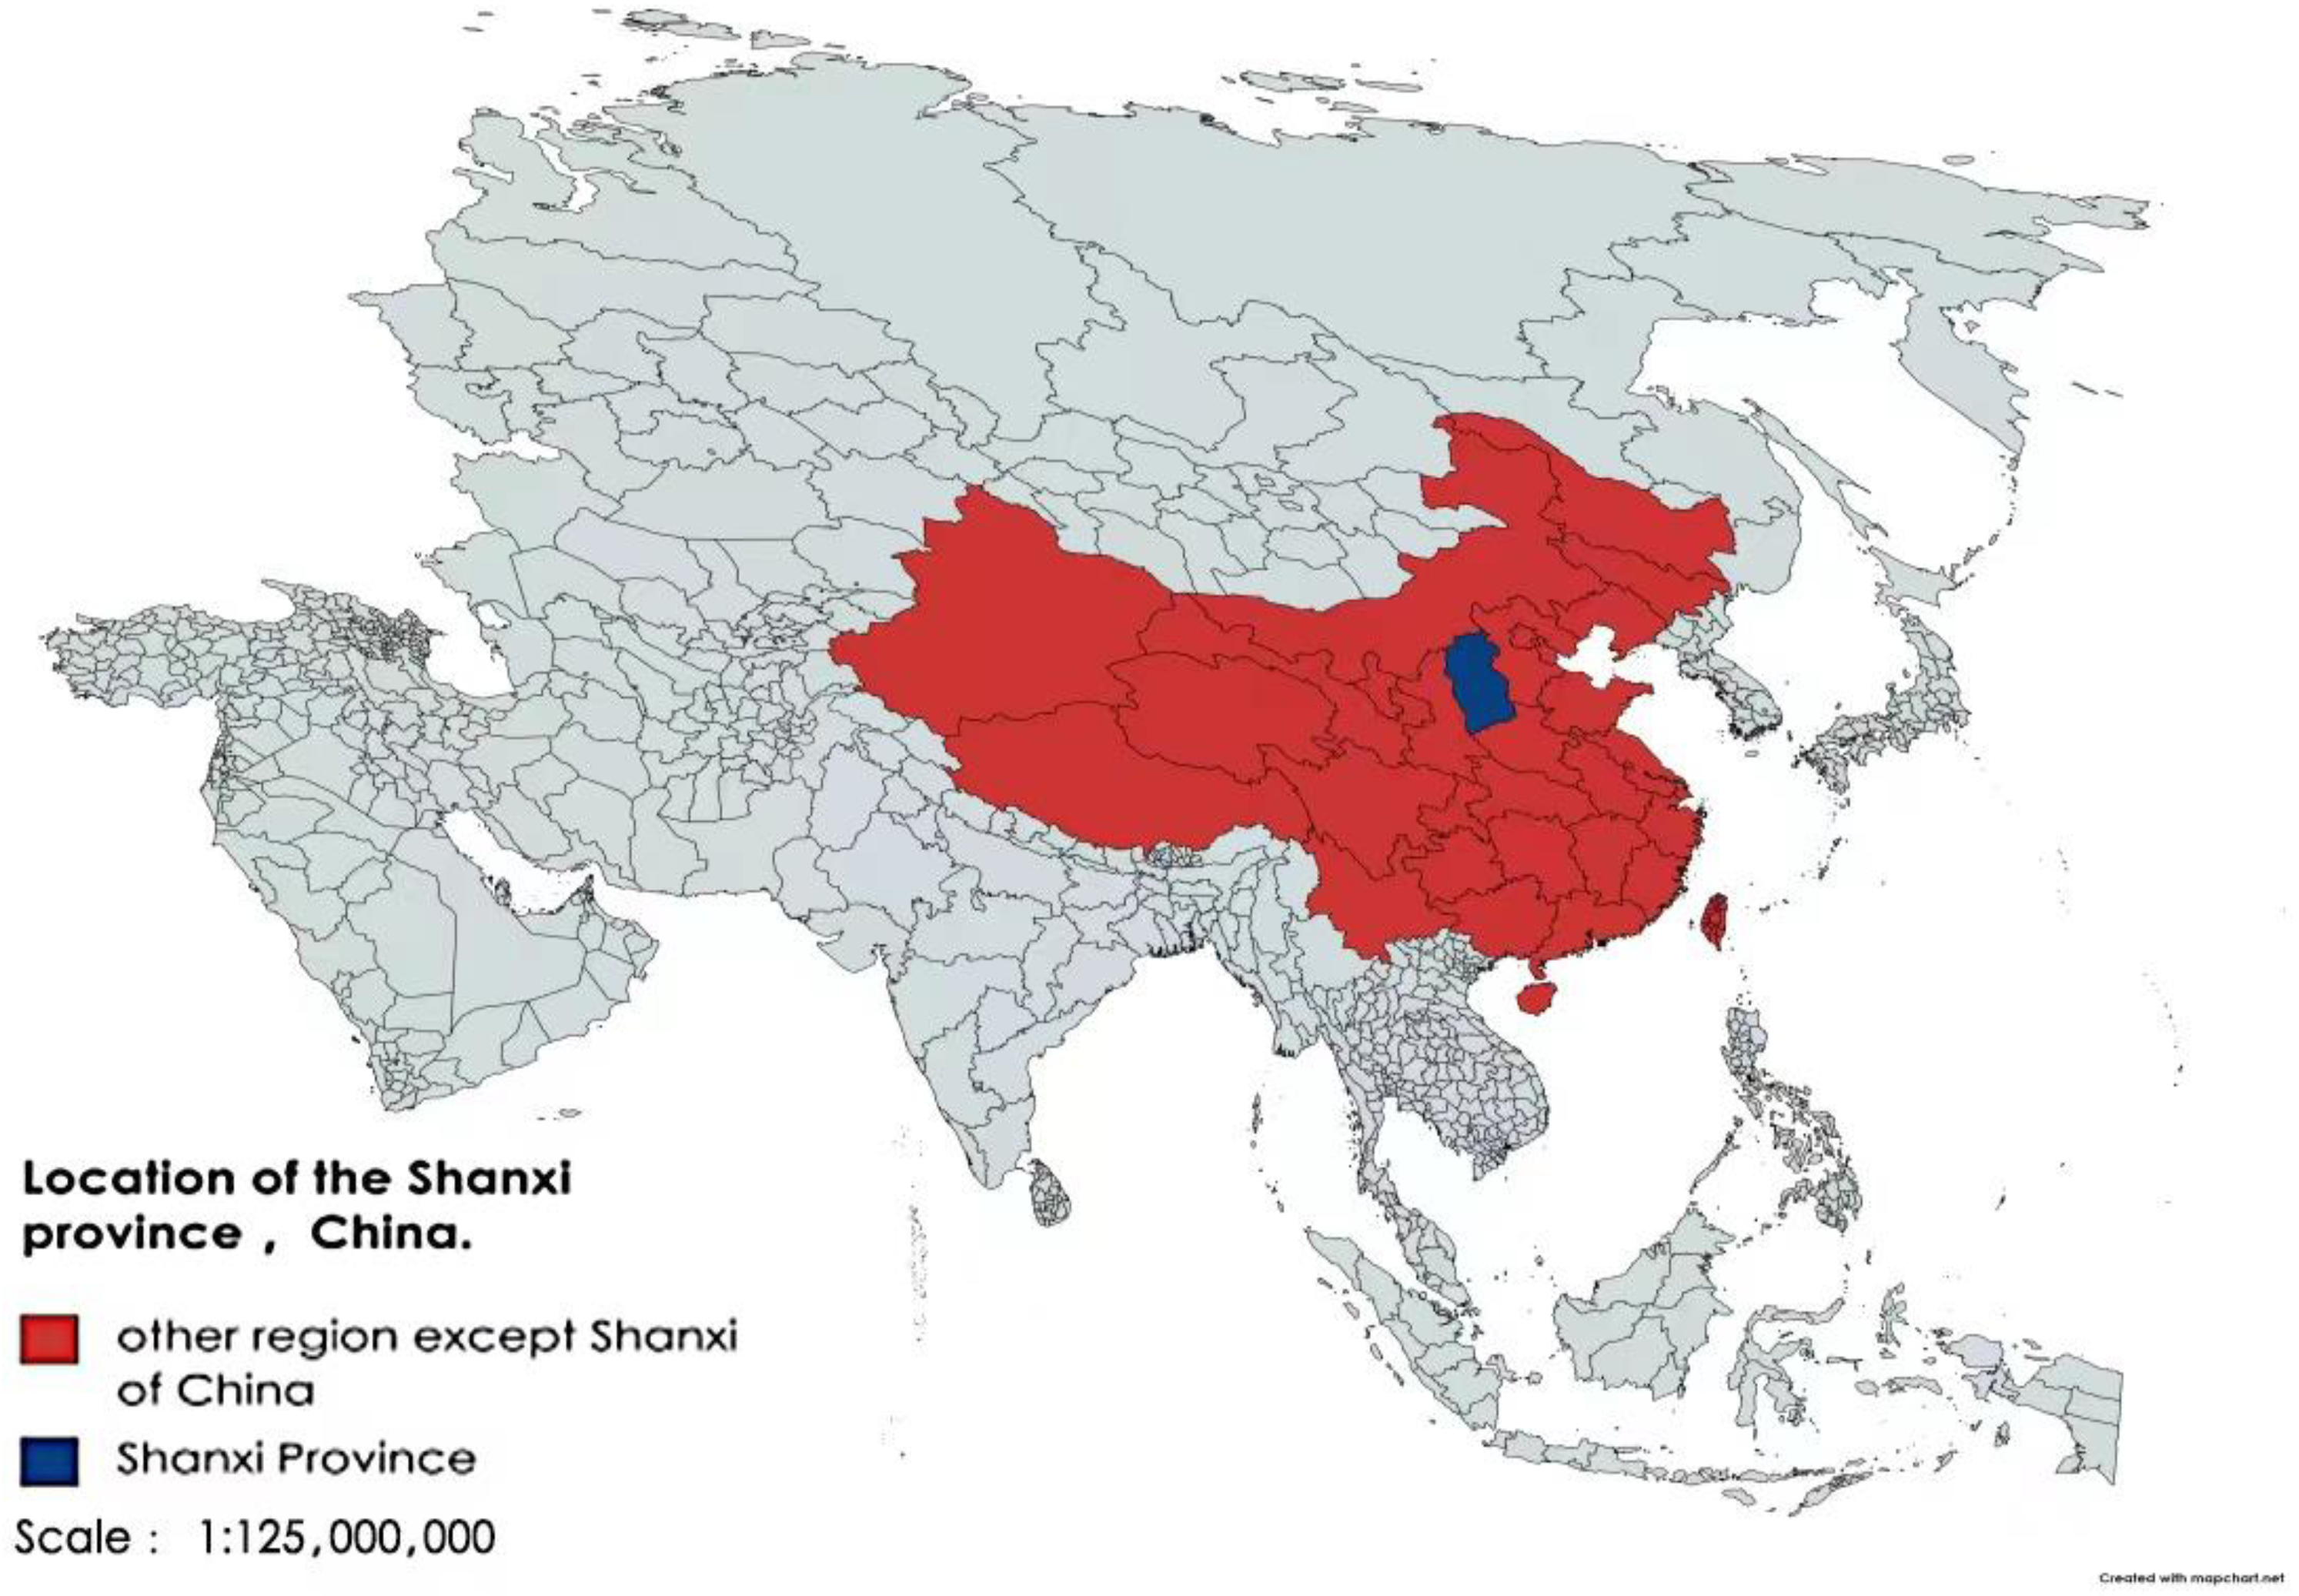
Shanxi Province, referred to as “Jin”, is located in North China, 110°14′–114°33′ E, 34°34′–40°44′ N, with a total area of 156,700 km2 and an average height of 1300 m, as shown in Figure 2 [31]. Shanxi is located on the Loess Plateau; most of the territory is more than 1500 m above sea level, with mountains and hills accounting for 80% of the area, and plains and river valleys accounting for approximately 20% [32]. The overall topography of Shanxi is two mountains sandwiching a river, featuring the mountain plateau to the east and west, with an intermontane basin in the middle. The climate type of Shanxi Province is continental temperate monsoon. Shanxi has four distinct seasons, a sufficiently light and cold winter but hot summer, a large temperature difference between day and night, and obvious climate differences between north and south [33]. The average annual temperature in Shanxi is between 4.2 and 14.2 °C. The temperature is generally low in the east and west, high in the middle and south, and low in the north [33]. The annual precipitation in the province fluctuates around 500 mm, with more precipitation in the summer and autumn and less in the winter and spring, which is greatly affected by the terrain [34].
Shanxi is rich in mineral resources, among which the reserves of coal bed methane, magnesia, refractory clay, bauxite, and dolomite rank first in China. Shanxi has 270.9 billion tons of coal reserves, accounting for approximately 17% of Chinese reserves, along with 230.4 billion cubic meters of coal-bed methane reserves and 1.527 billion tons of bauxite reserves, accounting for 32.44% of Chinese reserves [33]. In 2021, the GDP of Shanxi Province, calculated at constant prices, reached USD 334.03 billion (exchange rate according to the December 2020 standard: USD 1 = RMB 6.5423), with an increase of USD 75.5 billion, ranking seventh in China. In 2021, Shanxi produced 1.19 billion tons of raw coal and exported 43.56 million tons of thermal coal. In 2020, the per capita disposable income of Shanxi residents was USD 3859.6, the per capita income of urban residents was USD 5302.3, and the per capita income of rural residents was USD 2122.1 [35]. By the end of 2020, 7.648 million people had participated in various social security programs, and 261,400 people had received urban subsistence allowances [7].

2.2. Research Methods

Literature analysis: This study consulted a large number of studies on regional sustainable development, sustainable development in Shanxi Province, the application of emergy analysis in regional sustainable development, and the application of emergy analysis in Shanxi Province. Through comprehensive analysis, it was concluded that there were limited research results on the sustainable development of Shanxi Province, with most studies failing to measure the contribution of natural resources to economic development. Scholars have not yet studied the sustainable development of Shanxi Province in the context of The National Sustainable Development Plan for Resource-Based Cities (2013--2020). The authors, through analyzing the literature, decided to use emergy analysis to reflect the contribution of resources to the economy, thereby evaluating the sustainable development capacity of the resource-based region Shanxi Province from 2013 to 2020.
Quantitative analysis: This paper used emergy analysis to transform the resources, commodities, services, and information stored and flowing in the eco-economic system into a unified emergy measurement scale to quantify the basic emergy level, the social and economic indicators, and the trend of sustainable development of the eco-economic system in Shanxi Province.

2.3. Emergy Analysis

Emergy analysis was created by the American ecologist H. T. Odum in the 1980s, who defined emergy as the amount of energy of another type contained by a flowing or stored energy [36]. In real life, the energy of all substances on Earth directly or indirectly comes from the sun; thus, the value of solar energy is used to measure the size of all emergy values in units of solar Em joules [37].
The emergy formula is as follows:
E m = i T i × E i ,
where T i is the emergy conversion rate of different substances or energies, and E i is the input or export flow of different units (mass G or energy J). For example, 1 t of rice contains 1.162 × 10 15 sej solar energy, indicating the energy directly or indirectly derived from the sun.
The emergy conversion rate refers to the solar energy value required for 1 J of a product or service. The emergy conversion rate of a product is equal to its emergy divided by its energy, provided in units of sej/J (some scholars define the emergy conversion rate by constructing a conversion relationship between the quality of a product and the solar energy value) [38]. H. T. Odum [37], M. T. Brown [22], Shengfang Lan [38], Chunhua Sui [39], and Shuang Cheng Li [40] conducted relevant studies on the emergy conversion rate of different substances.
The steps of emergy analysis are generally as follows:
(1)
Collect basic data: After collection, the original data are sorted according to emergy language and classified according to emergy flow, money flow, and waste flow. Energy includes nonrenewable resources and renewable resources;
(2)
Draw an energy system diagram: Symbols are used to express emergy flow, whereby various components in the regional system and their interactions can be clarified through an energy flow diagram;
(3)
Compile an emergy analysis table: According to the system emergy structure chart and emergy analysis table, the basic emergy data of Shanxi’s eco-economic system can be calculated;
(4)
Calculate the emergy index;
(5)
Put forward suggestions and conclusions.
By analyzing the emergy index of the eco-economic system of Shanxi Province, this paper summarizes the problems existing in the development of Shanxi Province and provides scientific suggestions for the future sustainable development of Shanxi Province.
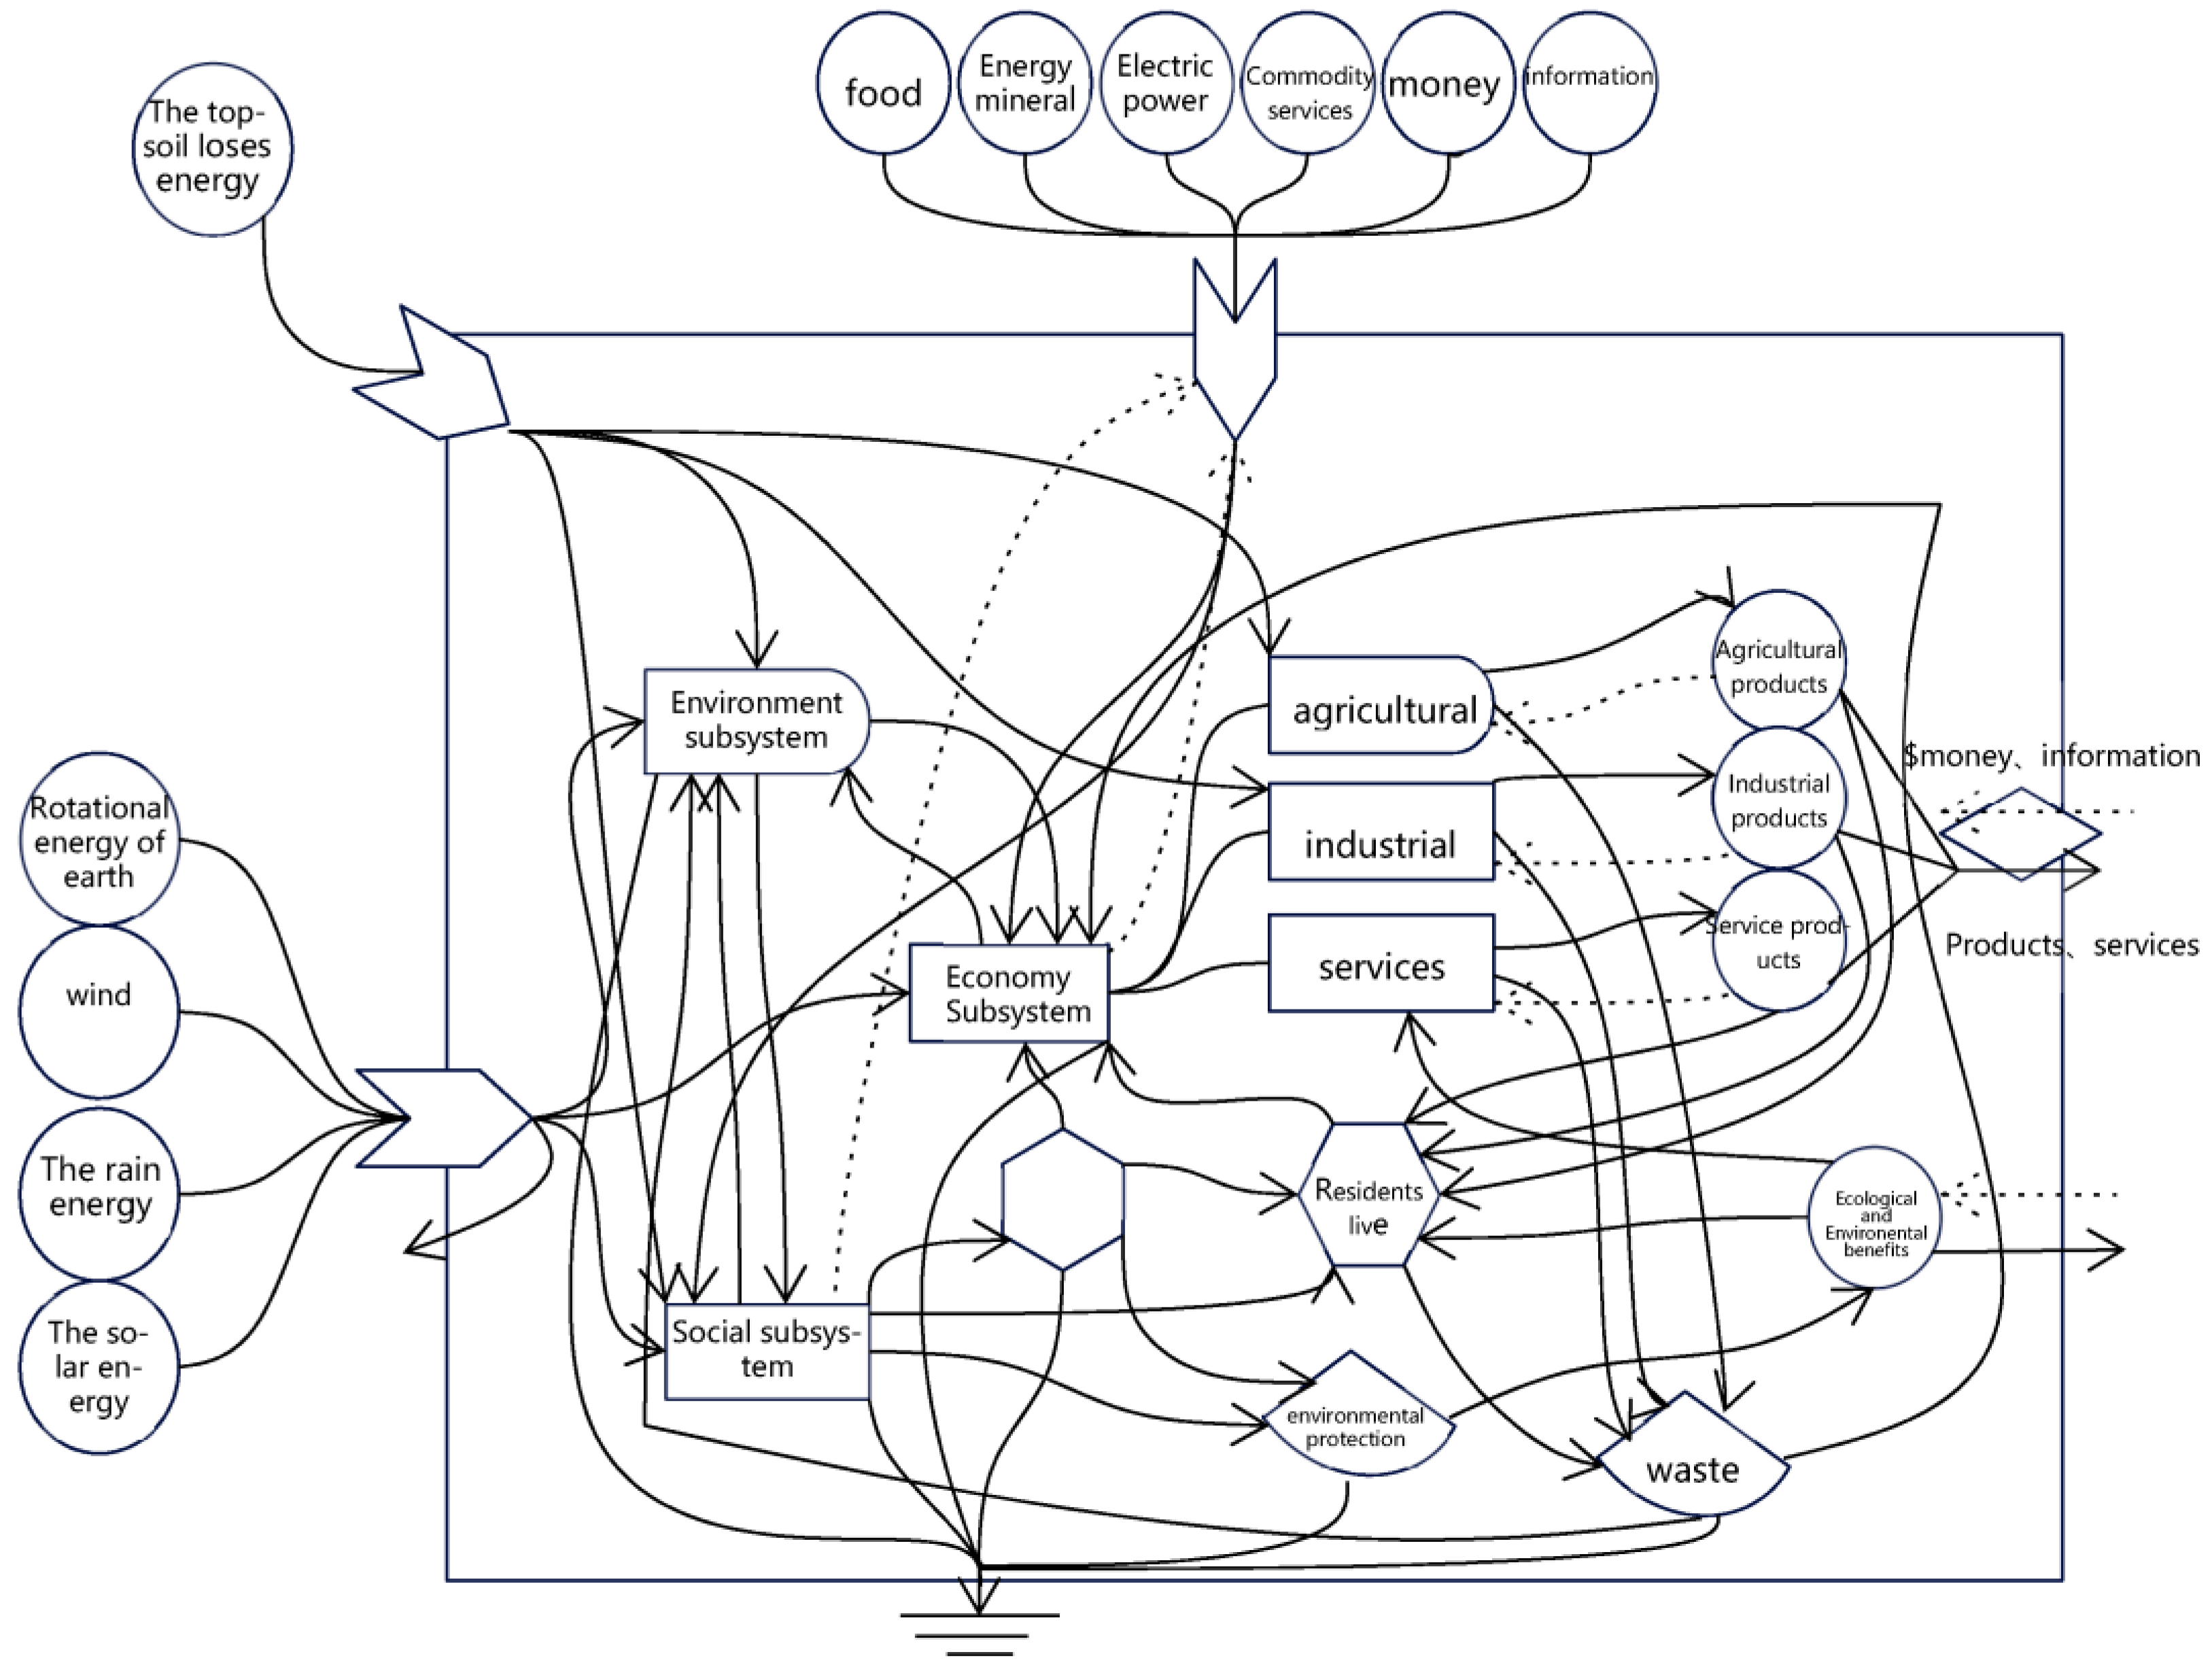
According to H. T. Odum’s standard energy flow diagram, combined with the characteristics of Shanxi Province’s ecological and economic system, a flowchart of the regional emergy was drawn, as shown in Figure 3.

2.4. Emergy Indicators

According to the emergy analysis method, this study considers the following basic emergy indices: local renewable resource emergy (R), local nonrenewable resource emergy (N), local input emergy (I), local output emergy (O), and total emergy (U).
The main emergy indicators are described below.
(1)
Renewable resource emergy (R) is the quantity of local renewable resource emergy in a year, which can be expressed as
R = R1 + R2 + S,
where the renewable environmental resources (R1) include solar energy, wind energy, rainwater chemical energy, and rainwater potential energy. Renewable organic energy (R2) includes hydropower and wind power. Self-produced renewable resource products (S) include food, vegetables, and fruits.
(2)
Nonrenewable resource emergy (N) is the production of local nonrenewable resource emergy in a year, which can be expressed as
N = N1 + N2,
where nonrenewable environmental resources (N1) include topsoil loss energy, and nonrenewable environmental resource products (N2) include raw coal, thermal power, steel, alumina, coke, and cement.
(3)
Total emergy (U) is the consumption of local emergy in a year, which can be expressed as
U = R + N + I,
where U is the total emergy, R is the renewable resource emergy, N is the nonrenewable resource emergy, and I is the local input emergy in a year, including the resources, capital, and commodities imported in Shanxi Province.
In addition, the waste stream (W), as a basic energy index, includes the emergy of waste liquid, waste gas, and waste solid (deduction used), while the output emergy (O) includes the capital, resources, and labor service income exported within the territory of Shanxi Province.
Since the establishment of emergy analysis, there have been various mature evaluation indices proposed through the long-term efforts of scholars, as outlined below.
(4)
The population carrying capacity (PCC) is the number of people that can be supported by renewable resources and input resources under current living standards:
PCC = 8 × (R/U) × P,
where R is the renewable resource emergy, U is the total emergy, and P is the number of local people.
(5)
The emergy density (ED) is the ratio of emergy utilization in a country or region to the area of the country or region, in units of sej/(m2·a). The index is used to measure the intensity and level of local economic development. Generally speaking, a greater intensity of emergy indicates a more developed local economy.
Ed = U/area
Here, U is the total emergy, and area refers to the area of the study region.
(6)
The emergy per person (EPP) refers to the per capita emergy consumption in a region, which is an important indicator to measure the per capita living standard. Generally speaking, a higher regional EPP indicates a higher regional per capita living standard.
EPP = U/P
Here, U is the total emergy, and P is the total number of people in the study region.
(7)
The emergy self-sufficiency ratio (ESR) refers to the ratio of the natural environment emergy input to the total emergy in the study area, whereby a higher ESR indicates a higher self-sufficiency level of the system.
ESR = (R + N)/U
Here, R is the renewable resource emergy, N is the nonrenewable resource emergy, and U is the total emergy.
(8)
The emergy yield rate (EYR) refers to the ratio of the total emergy output of the system to the input emergy, which can measure the contribution of system yield emergy value to economic development. A higher EYR indicates a higher system production efficiency, which can reflect the economic competitiveness of the system.
EYR = U/I
Here, U is the total emergy, and I is the local input emergy in a year.
(9)
The emergy exchange rate (EER) refers to the ratio of emergy input to emergy output of a region in the current year, which is used to evaluate the gains and losses of external economic exchanges. A higher emergy exchange rate indicates a greater emergy wealth obtained by the region in economic trade.
EER = I/O
Here, I is the local input emergy in a year, and O is the local output emergy in a year.
(10)
The emergy investment rate (EIR) refers to the ratio between the feedback emergy value and the input emergy value of the natural environment in the eco-environmental economic system of a certain region in the current year. This index is used to measure the degree of economic development and the tolerance of nature to economic activities. A higher EIR value indicates a higher level of economic development.
EIR = I/(R + N)
Here, I is the local input emergy in a year, R is the renewable resource emergy, and N is the nonrenewable resource emergy.
(11)
The emergy monetary ratio (EMR) refers to the total emergy consumption of a region in the current year, except for the gross national product (GNP) or gross domestic product (GDP), in units of sej/USD·a. Generally speaking, a lower EMR indicates a higher degree of regional development and a developed economy.
EMR = U/GDP
Here, U is the total emergy, and GDP is the gross domestic product of a local area in a year.
(12)
The social emergy value of electricity (SEE) refers to the ratio of the amount of emergy used in municipal life to the total amount of emergy used in an area.
SEE = SE/U
Here, SE is the consumption of municipal living emergy in a region, and U is the total emergy.
(13)
The emergy-to-use ratio of electricity (FEE) refers to the ratio of the amount of electricity emergy used in the current year to the total amount of emergy used in a certain area. The ratio of power emergy value can reflect the degree of industrial development in a region and reflect the quality of life and the degree of modernization of local people. A higher emergy value ratio of electricity indicates a more modern life for local residents.
FEE = E/U
Here, E is the consumption of electrical emergy in a region, and U is the total emergy.
(14)
The environmental load ratio (ELR) refers to the ratio of the sum of the nonrenewable resource input and input emergy to the renewable resource emergy of the system in the current year. A higher ELR value indicates more pressure placed by system activities on the environment.
ELR = (N + I)/R
Here, N is the nonrenewable resource emergy, I is the local input emergy in a year, and R is the renewable resource emergy.
(15)
The emergy waste ratio (EWR) refers to the ratio of waste emergy and total emergy of the system in a certain area, which can be used to evaluate the resilience of the system and the recycling rate of resources. A larger EWR indicates a lower waste utilization rate, a lower resource development efficiency, and a greater waste utilization potential in the region.
EWR = W/U
Here, W is the local waste emergy in a year, and U is the total emergy.
(16)
The sustainable development index (ESI) was proposed by emergy experts Brown and Ulgiati in 1998 [41]. Some experts proposed that ESI < 1 indicates a developed country or region, 1 < ESI < 10 indicates a developing country or region, and ESI > 10 indicates an underdeveloped country or region.
ESI = EYR/ELR
Here, EYR is the emergy yield rate, and ELR is the environmental load ratio.
(17)
The evaluation system sustainable development indicator (EISD) refers to the concept proposed by Chinese scholar Hongfang Lu in 2002 [42]. ESID addresses the shortcomings of the ESI index. A higher ESID value indicates better socioeconomic benefits under the same environmental pressure and, thus, a better sustainable development power of the regional eco-economic system.
ESID = EYR × EER/ELR
Here, EYR denotes the emergy yield rate, EER is the emergy exchange rate, and ELR is the environmental load ratio.
In environmental resources, the chemical energy and potential energy of rainwater account for a large proportion and change greatly, whereas solar energy and wind energy are relatively stable, as is the rotational energy of the Earth. For calculation purposes, this table ignores less than 5% of the emergy stream.

2.5. Data Sources

The main data of this study were from the Shanxi Statistical Yearbook (2013–2020) [7], China Statistical Yearbook (2013–2020) [8], China Meteorological Data Sharing Service Network (2013–2020) [43], Shanxi Provincial Water Resources Bulletin (2013–2020) [34], Shanxi Provincial Government Work Report (2013–2020) [44], Shanxi Provincial Department of Ecology and Environmental Protection Report (2013–2020) [45], etc.
According to the basic energy index and the solar emergy conversion rate, referring to the research results of H. T. Odum, M. T. Brown, and Shengfang Lan, we classified the original data, as shown in Appendix A. The original data were multiplied by the solar emergy conversion rate, leading to the classification in Appendix B.

2.6. Emergy Analysis Tables

In this paper, the setting of the emergy index was based on the relevant research results of H. T. Odum [46] and Shengfang Lan [38], combined with the local development goals of Shanxi Province. After consulting Shanxi Agenda 21 (the development directions and goals of Shanxi Province compiled by Shanxi Provincial government) [47], the authors set up an emergy index of the eco-economic system conforming to the actual situation of Shanxi, China, as shown in Table 1.
According to the emergy evaluation system of Shanxi’s eco-economic system constructed in Table 1, as well as the calculation method of the eco-economic system and the emergy data in Appendix B, the emergy index values of Shanxi’s eco-economic system were obtained, as shown in Table 2.

3. Results

3.1. Basic Emergy Quantity

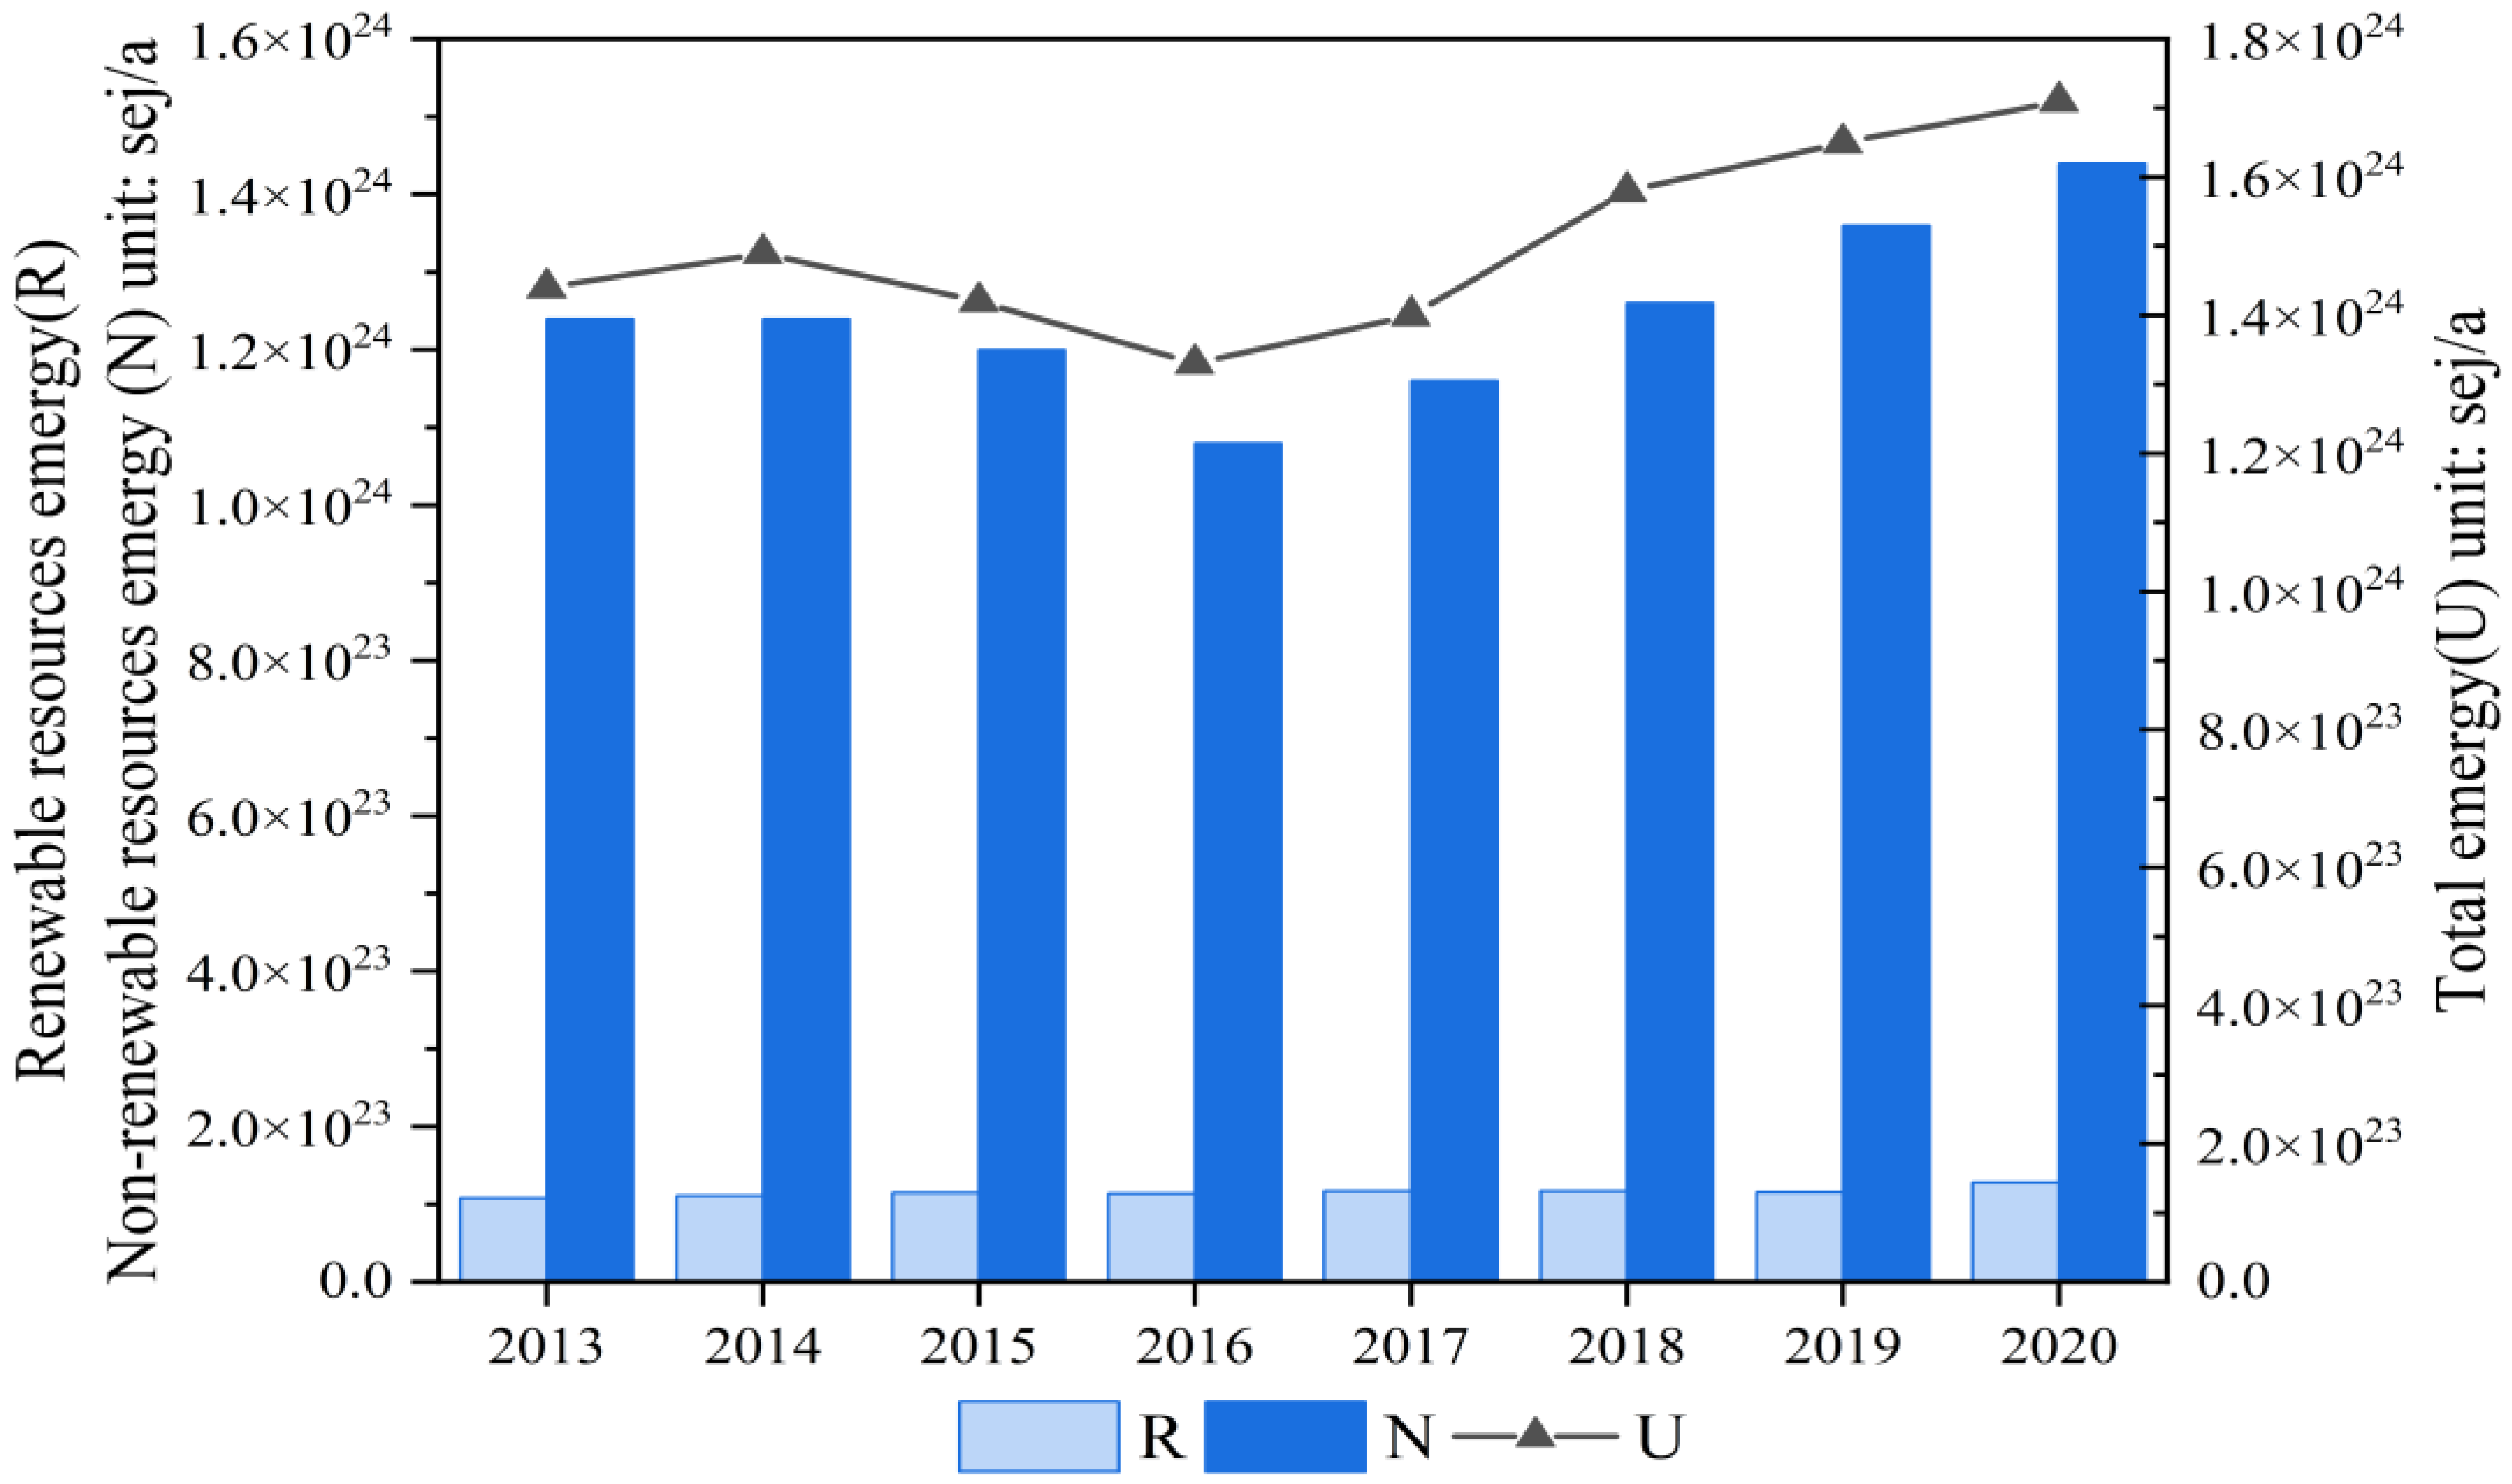
In the eco-economic system of Shanxi Province, the total emergy (U) of Shanxi Province is composed of the emergy of renewable resources I, the emergy of nonrenewable resources (N), and the input emergy (I). R increased from 1.08 × 10²³ sej/a in 2013 to 1.28 × 10²³ sej/a in 2020, with a growth rate of 18.5%; N increased from 1.24 × 1024 sej/a in 2013 to 1.44 × 1024 sej/a in 2020, with a growth rate of 11.25%; U increased from 1.44 × 1024 sej/a in 2013 to 1.71 × 1024 sej/a in 2020, with a growth rate of 18.75% (Figure 4). The growth of emery (R) of renewable resources in Shanxi Province was mainly due to the growth of hydro, photovoltaic, and wind power generation and renewable products (such as the growth of meat, milk, and egg production). The growth of nonrenewable resource emergy (N) in Shanxi Province was mainly due to the fact that the heavy industry dominated by coal production still maintained an overall growth trend from 2013 to 2020. According to the Government Bulletin of Shanxi Province in 2016, the added value of the five industries of coal, metallurgy, electric power, equipment manufacturing, and coke accounted for 86.7% of the province’s industry [48]. This reflects that the economic development of Shanxi Province mainly depends on the consumption of nonrenewable resources.
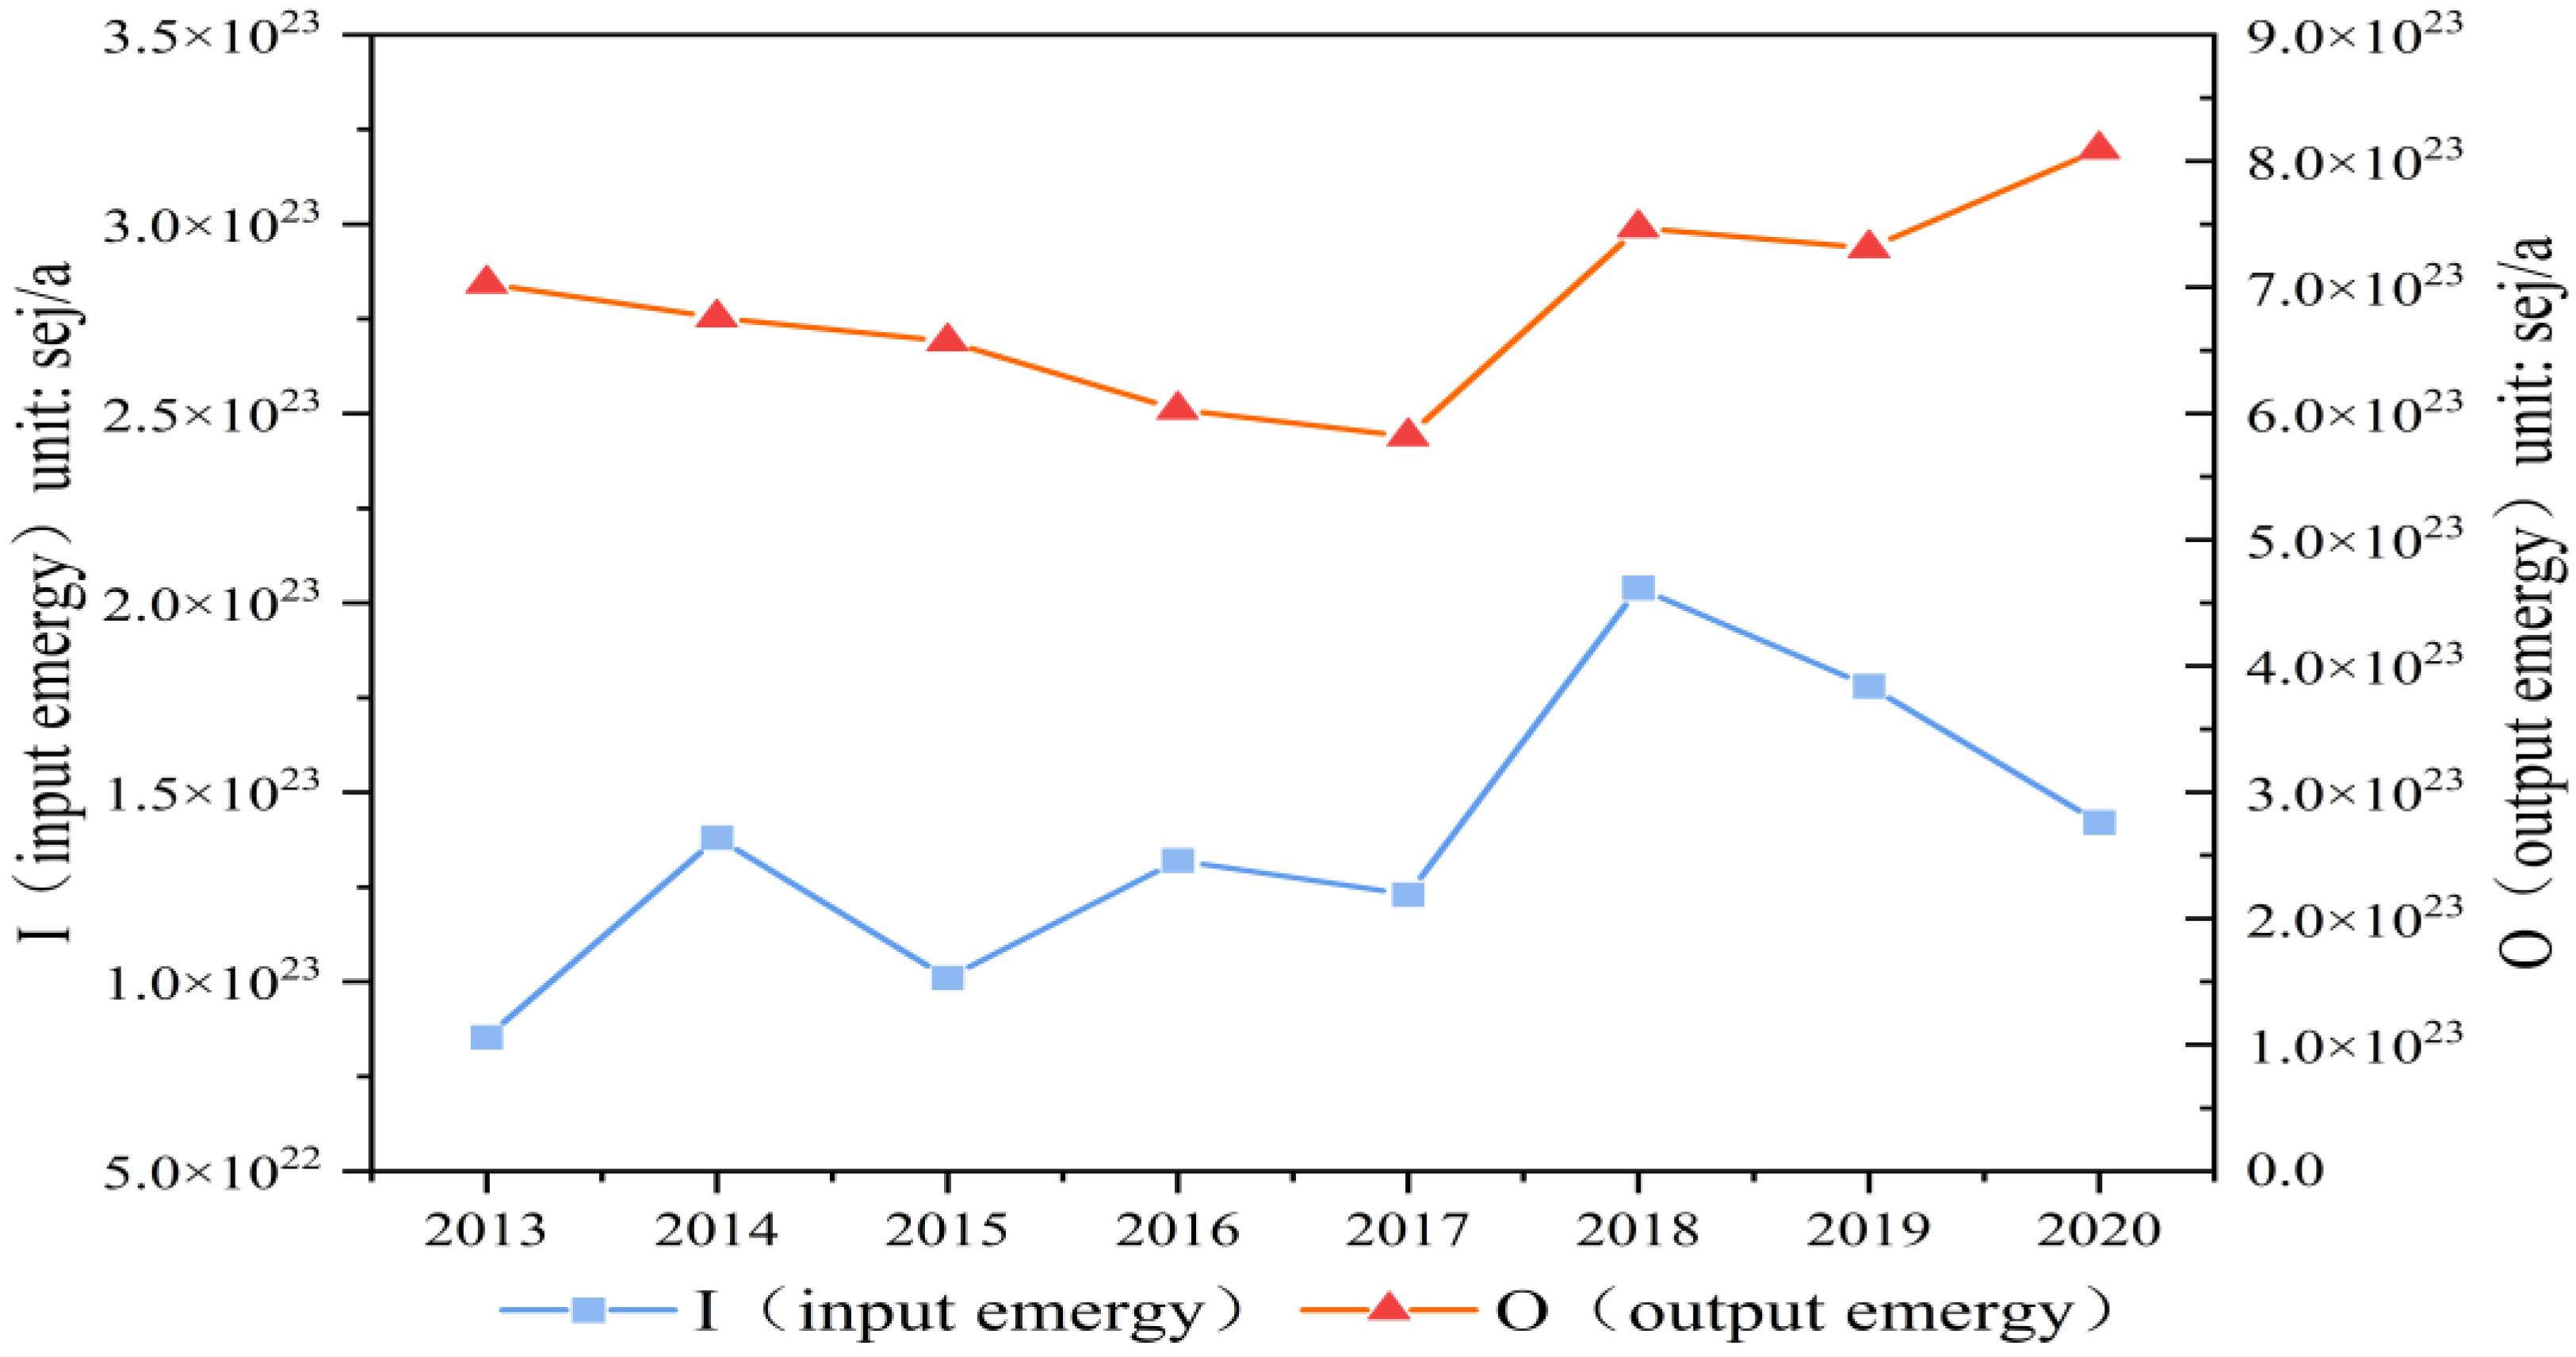
The input emergy (I) and output emergy (O) of Shanxi Province showed an overall upward trend from 2013 to 2020, while the output emergy of Shanxi Province was several times higher than the input emergy for a long period (Figure 5). In 2020, the imported energy of Shanxi Province was equivalent to 93.477 million tons of standard coal, while the energy exported to other provinces was equivalent to 611.712 million tons of standard coal in the same year [7]. However, the self-sufficiency rate of agricultural products in Shanxi was relatively high, and the gap between the import and export of foreign trade in Shanxi was not large. Therefore, the main factors influencing the output emergy and input emergy of Shanxi were the energy input and energy output.
In conclusion, the nonrenewable resource emergy and total emergy in Shanxi Province increased due to increased production (raw coal production, metallurgy, coke, etc.), which led to an increase in nonrenewable resource emergy consumption. The consumption of nonrenewable emergy in Shanxi Province accounted for a large proportion of total emergy consumption, which indirectly led to an increase in total emergy consumption.

3.2. Social Subsystem Evaluation Index

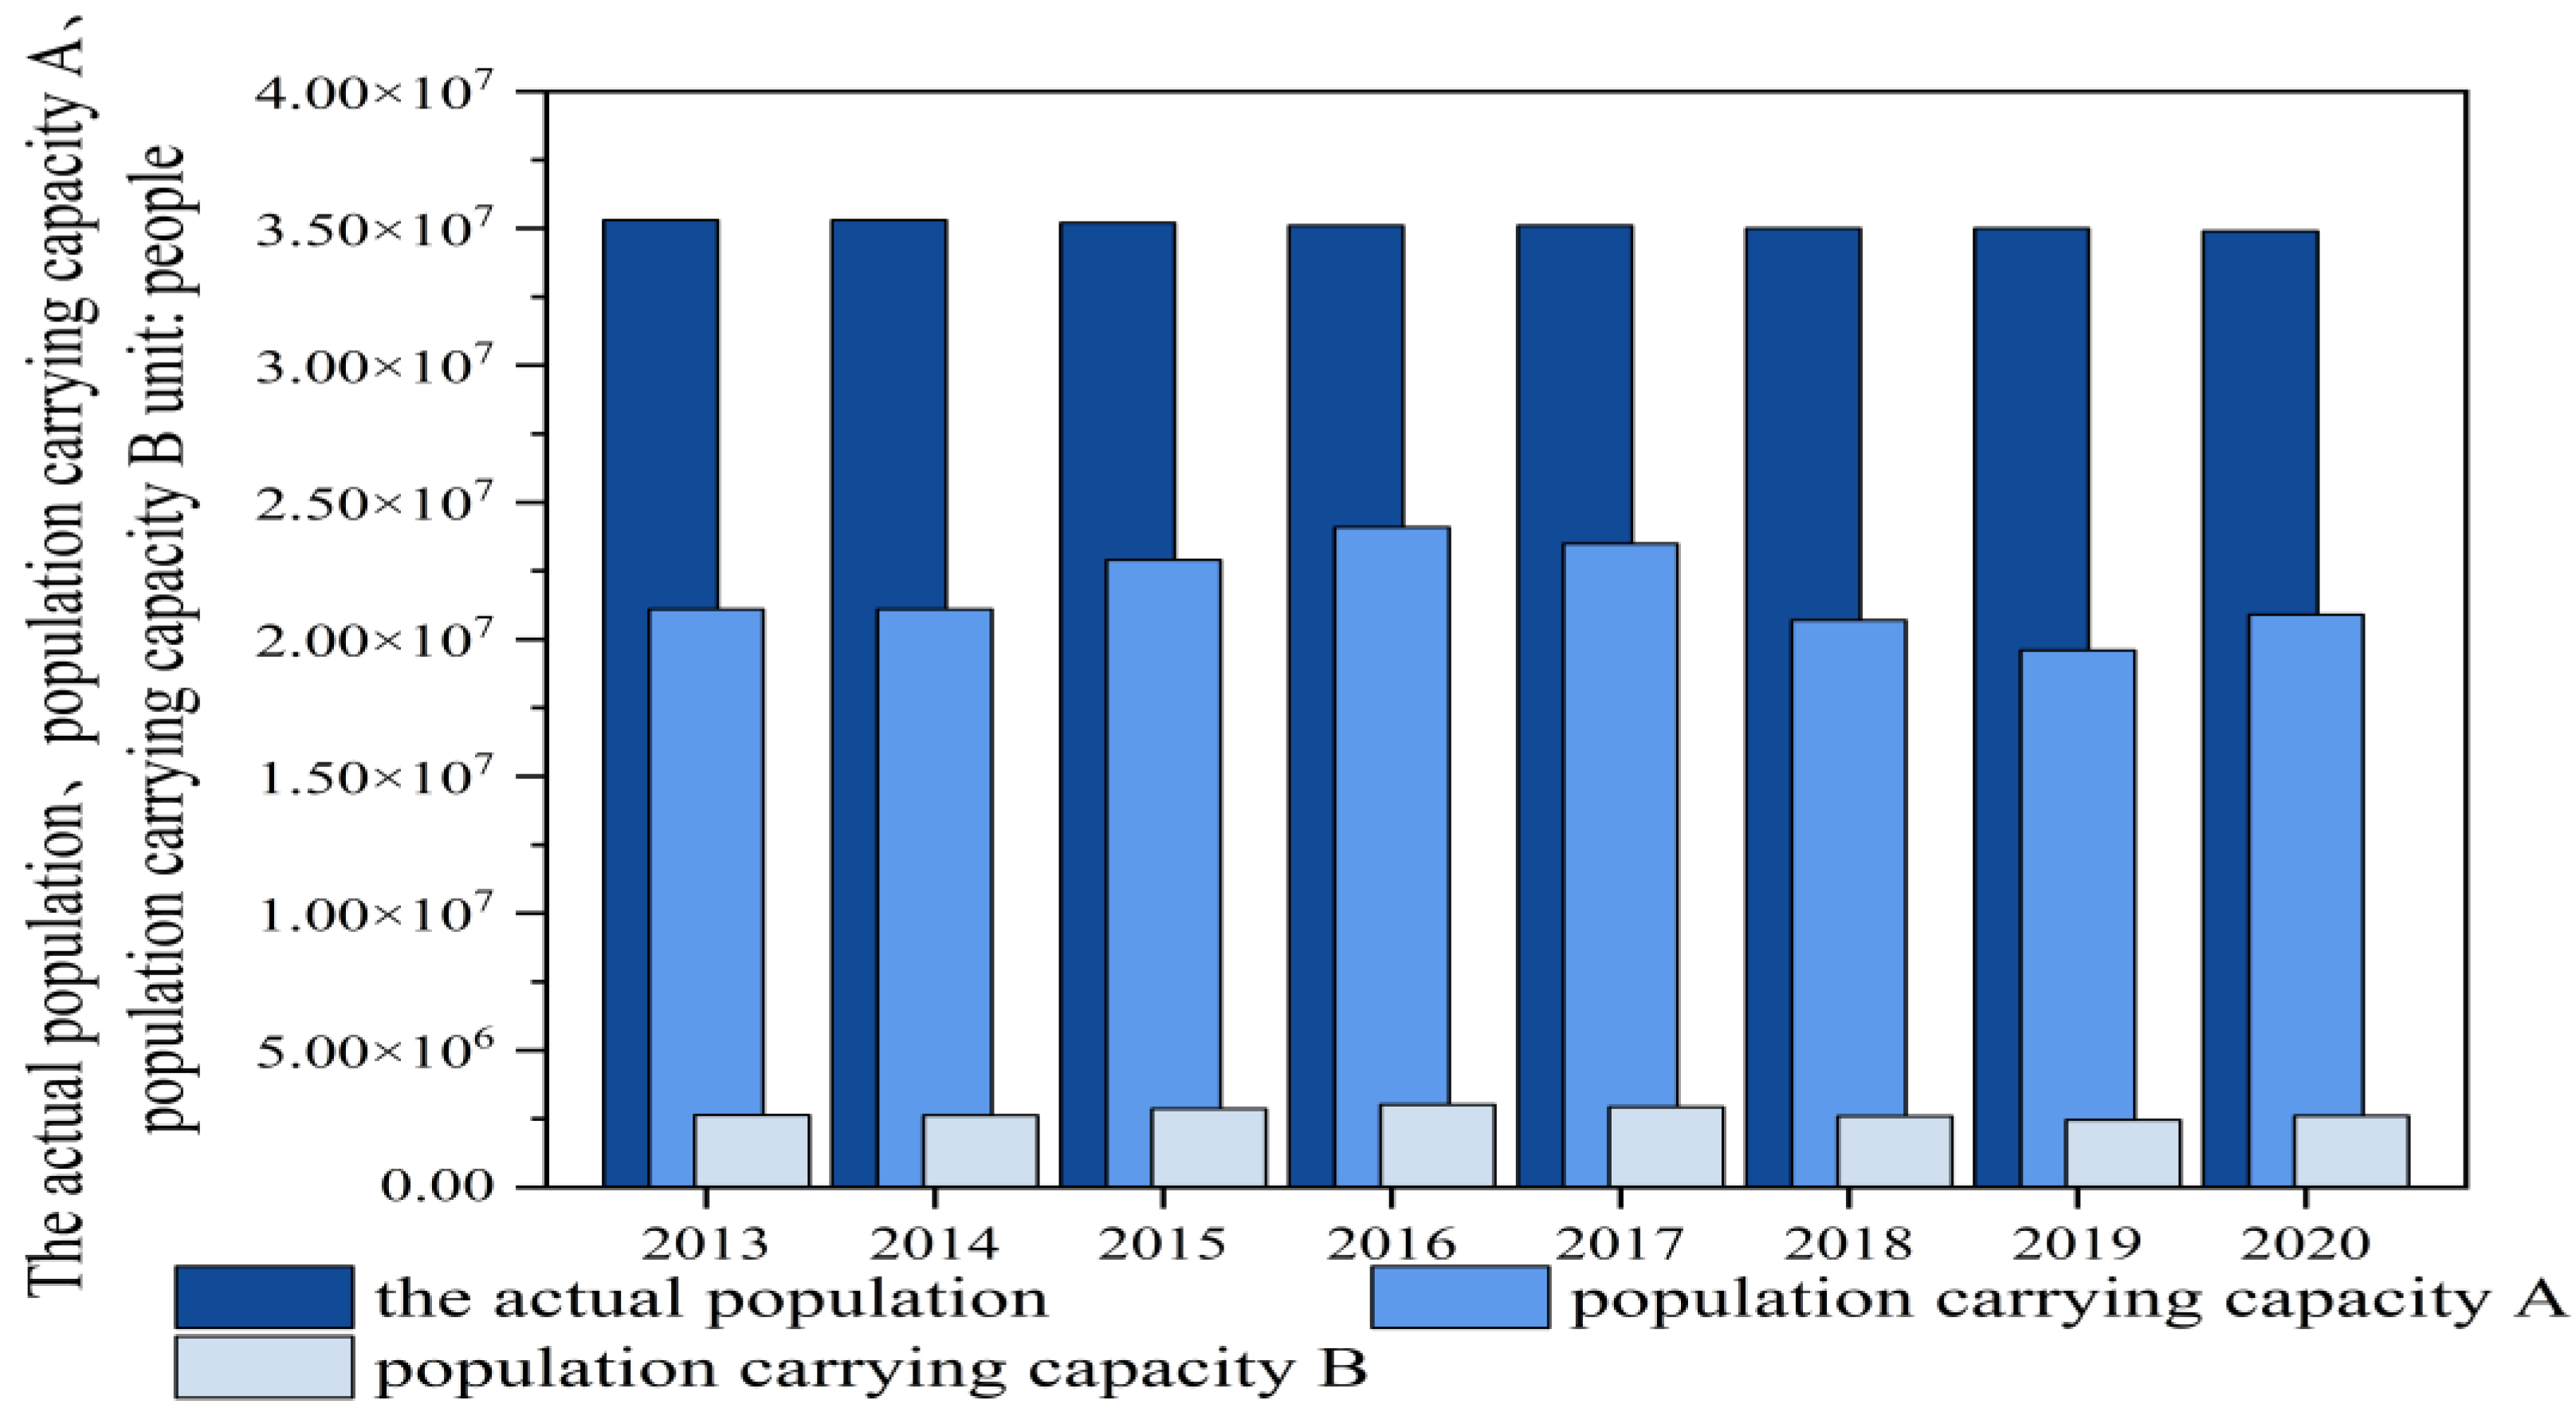
The population carrying capacity (PCC) refers to the population that can be reasonably carried by a certain region at a specific time according to resources and productivity levels (PCC = 8 × (R/U) × P), which represents the population number that can be borne by renewable resources and input resources under the current living standard. The PPC is the upper limit of the regional population carrying capacity under the current living standard. The actual population of Shanxi Province from 2013 to 2020 far exceeded the population carrying capacity. The population carrying capacity increased in 2015 and 2016, with little overall change (Figure 6).
The reasons for the overcapacity of the Shanxi population are analyzed below. The population density of Shanxi Province is 229 people/km2, which is significantly higher than the average population density of China (145 people/km2) and the world (145 people/km2). Thus, Shanxi Province is a region with more people and less land than average. The per capita water resource availability and per capita land area in Shanxi Province are much lower than the global average levels, which leads to a relative lack of water and renewable environmental resources. This results in a low renewable energy value (R) of Shanxi Province. The total emergy of Shanxi Province is mainly determined by the emergy of nonrenewable resources (accounting for 84.2% in 2020). The proportion of raw coal emergy with respect to the total emergy value was as high as 52.3% in 2020. Without changing the economic structure dominated by coal production and processing, it is difficult to optimize the overcapacity of the population. Most of the population in Shanxi is located in the Fenhe River valley basin, Datong Basin, and Changzhi Basin, and the population distribution is not uniform, which leads to the population carrying capacity of Shanxi’s eco-economic system facing greater challenges in the local area.
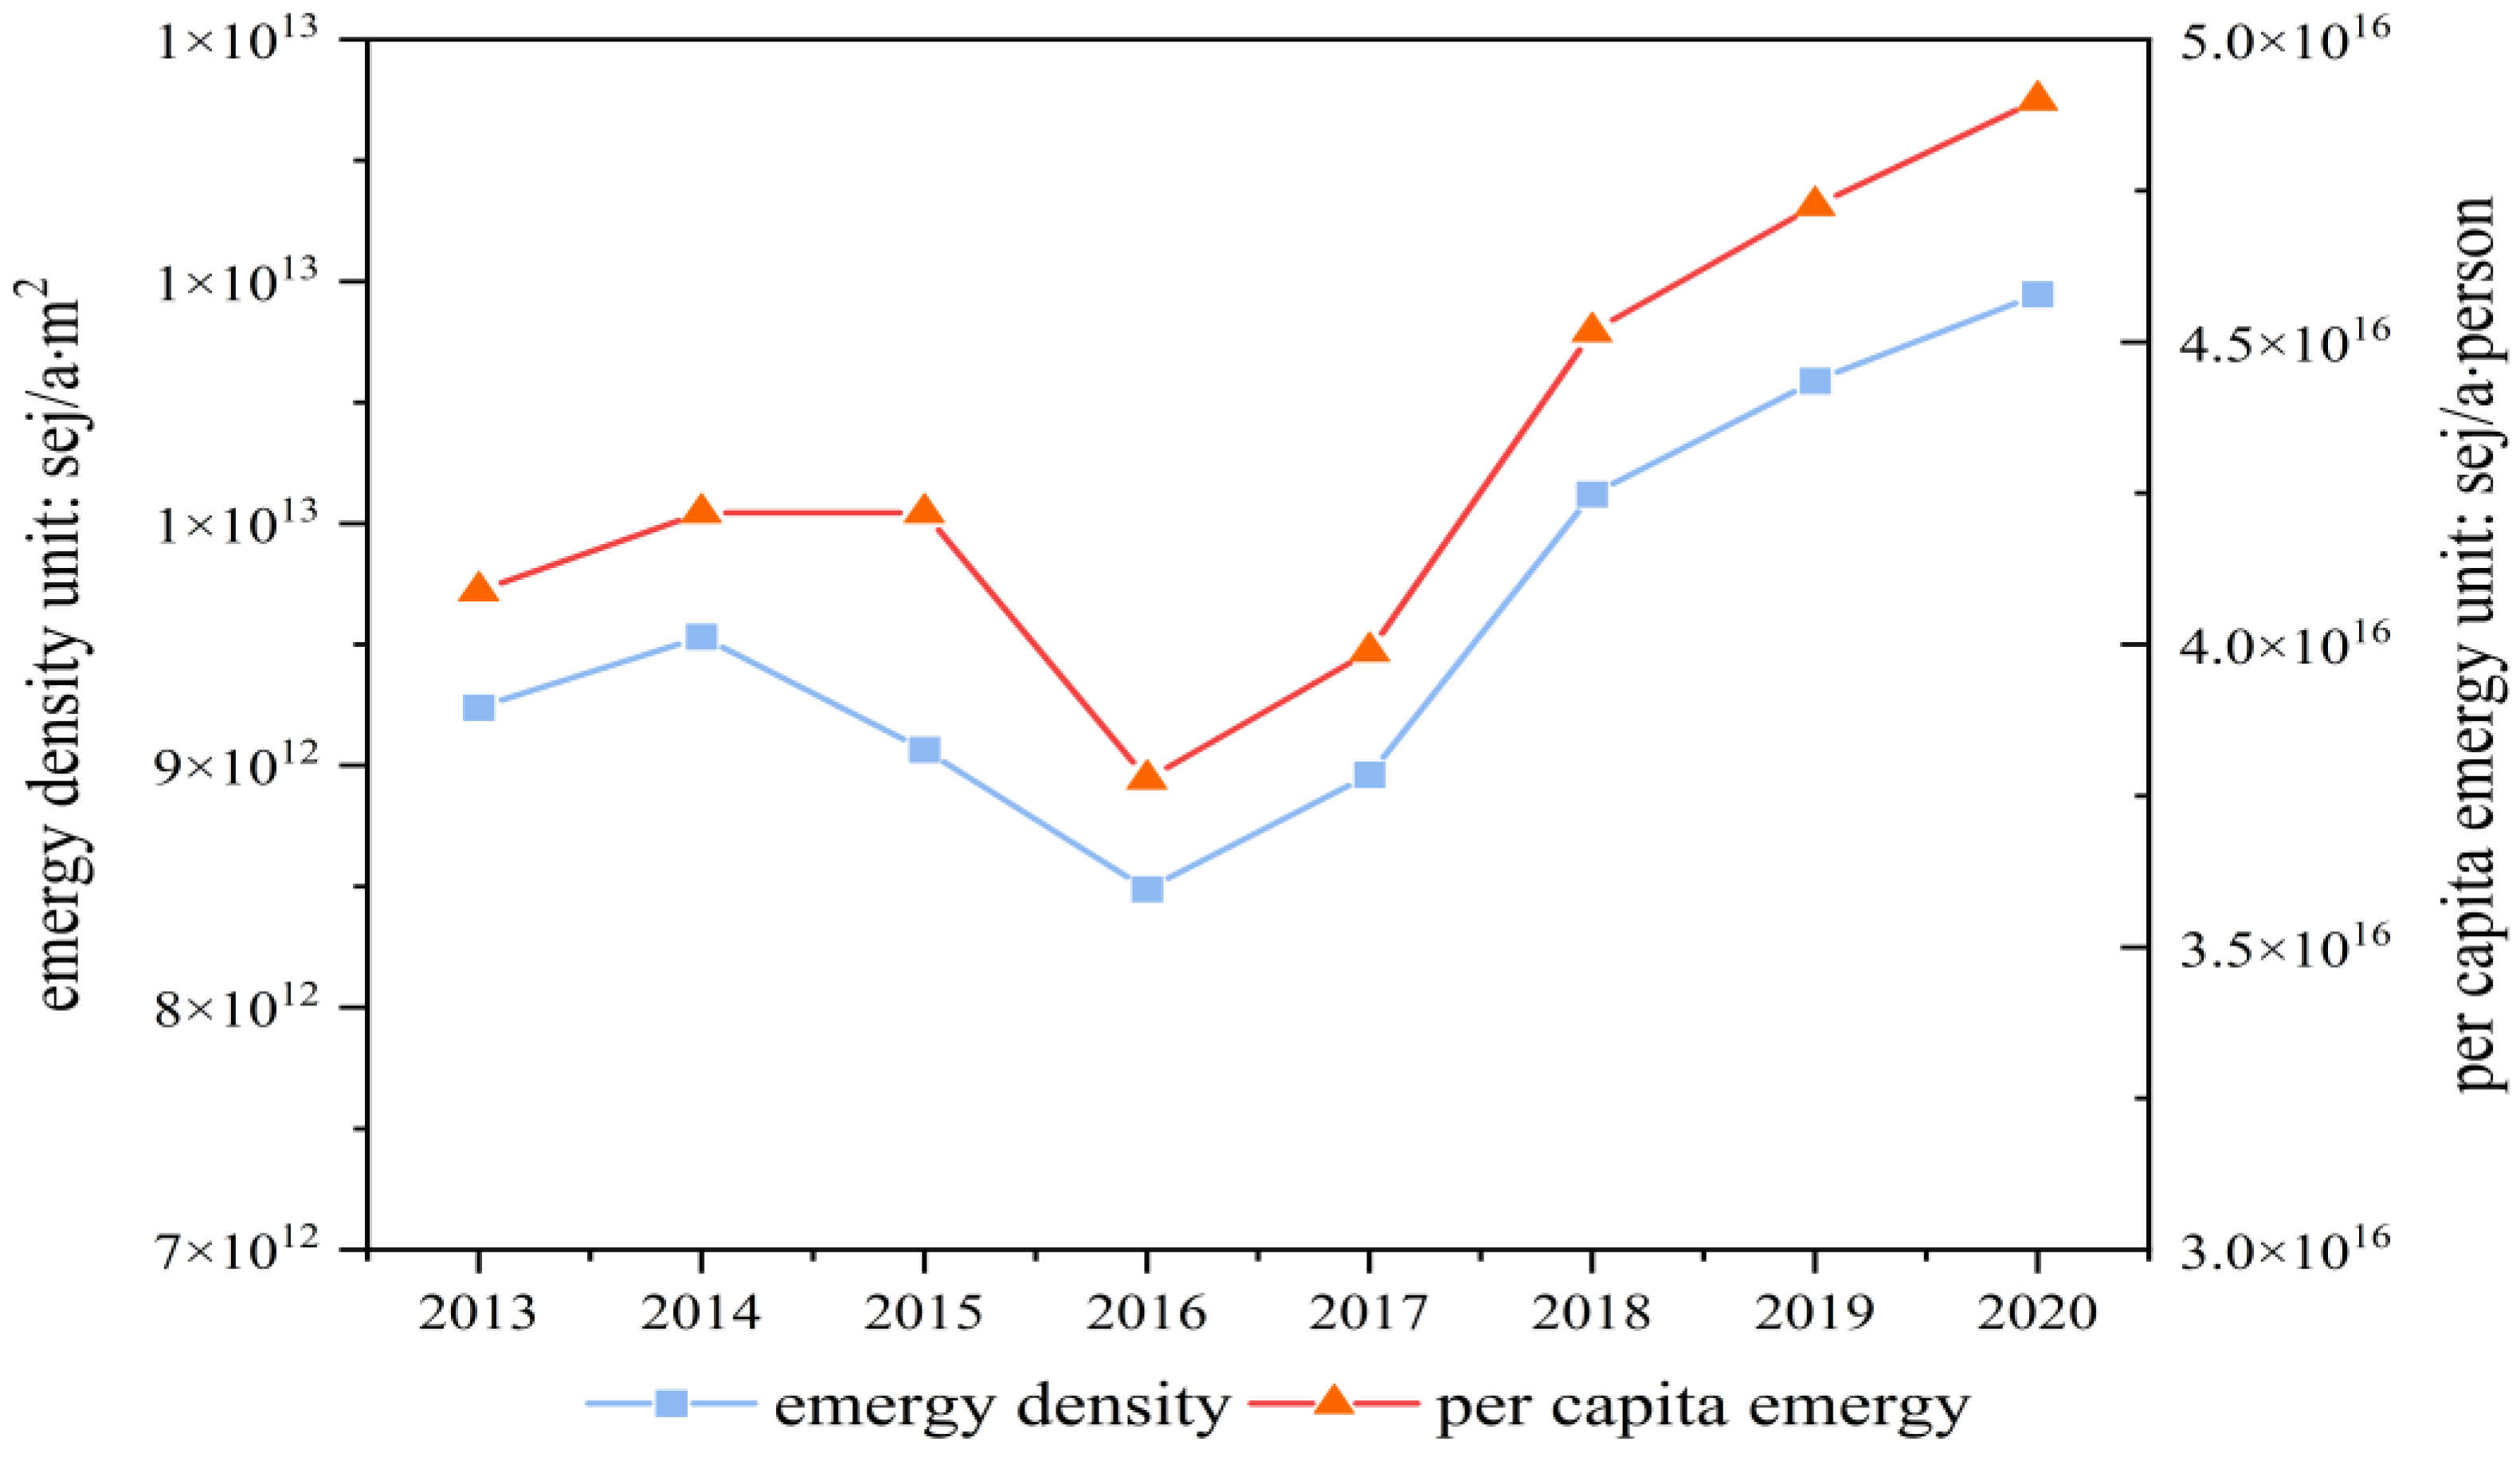
The emergy density (ED) of Shanxi Province increased from 9.24 × 10¹² sej/a in 2013 to 1.09 × 10¹³ sej/a in 2020. Shanxi Province basically showed a stable upward trend from 2013 to 2020, indicating that the economic vitality of Shanxi Province was strengthened in recent years, and the economic development made steady progress. The per capita emergy in Shanxi Province increased from 4.09 × 10¹⁶ sej/a·person in 2013 to 4.90 × 10¹⁶ sej/a·person in 2020. This reflects that, with the economic development of Shanxi Province in recent years, people’s living standards have steadily improved (Figure 7).
In terms of the provincial level, the emergy density of Shanxi Province is at a higher level than average, which is related to Shanxi’s industrial structure and its high energy consumption and carbon emission. The growth of per capita emergy is mainly due to the good economic growth of Shanxi in recent years.

3.3. Economic Subsystem Evaluation Index

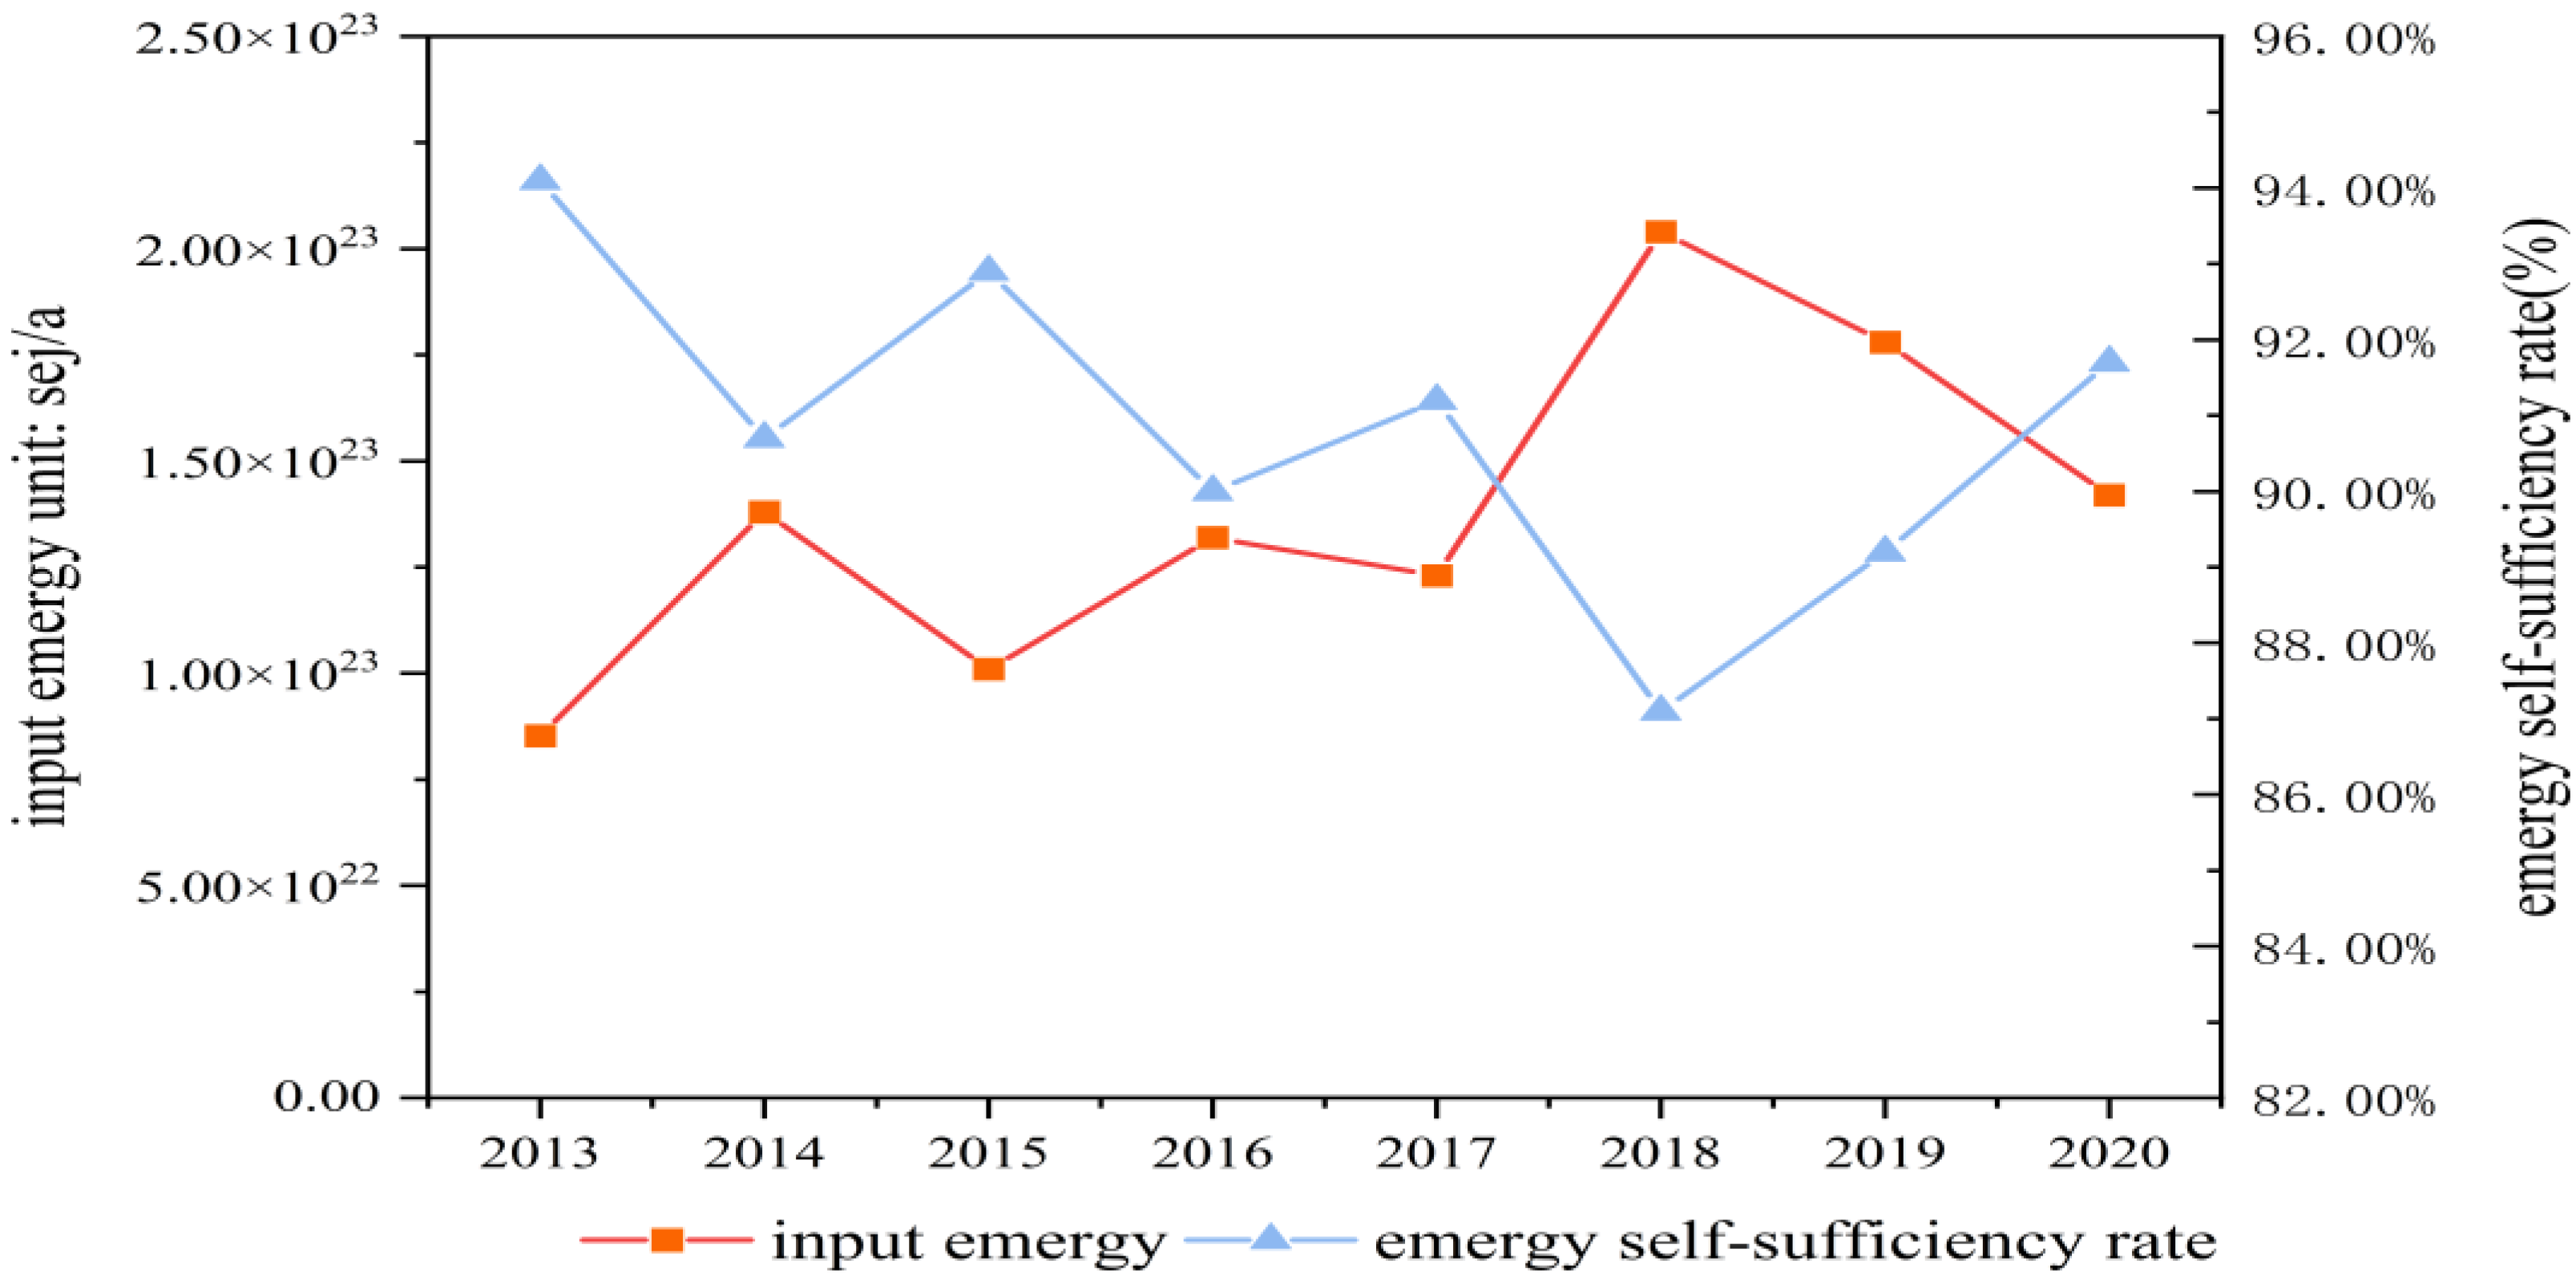
The emergy self-sufficiency rate of Shanxi Province decreased from 94.1% in 2013 to 87.1% in 2018 and then increased from 87.1% in 2018 to 91.7% in 2020 (Figure 8).
The decrease in the emergy self-sufficiency rate (ESR) in Shanxi Province from 2013 to 2018 was mainly due to the steady growth of the input emergy value during the period. The increase in the emergy self-sufficiency rate in Shanxi Province from 2018 to 2020 was mainly due to the decrease in the input emergy value during the period. This shows that Shanxi experienced a transformation from 2013 to 2018, reducing the dependence of economic development on local resources and increasing the input of external resources. However, after 2018, Shanxi Province comprehensively considered the task of ensuring national energy security, supported the construction of sibling provinces, and vigorously exploited local coal resources to provide energy security [49]. As a result, the emergy value of nonrenewable resources in Shanxi Province increased while the input emergy quantity did not change significantly in the same period, thus leading to an increase in the emergy self-sufficiency rate.
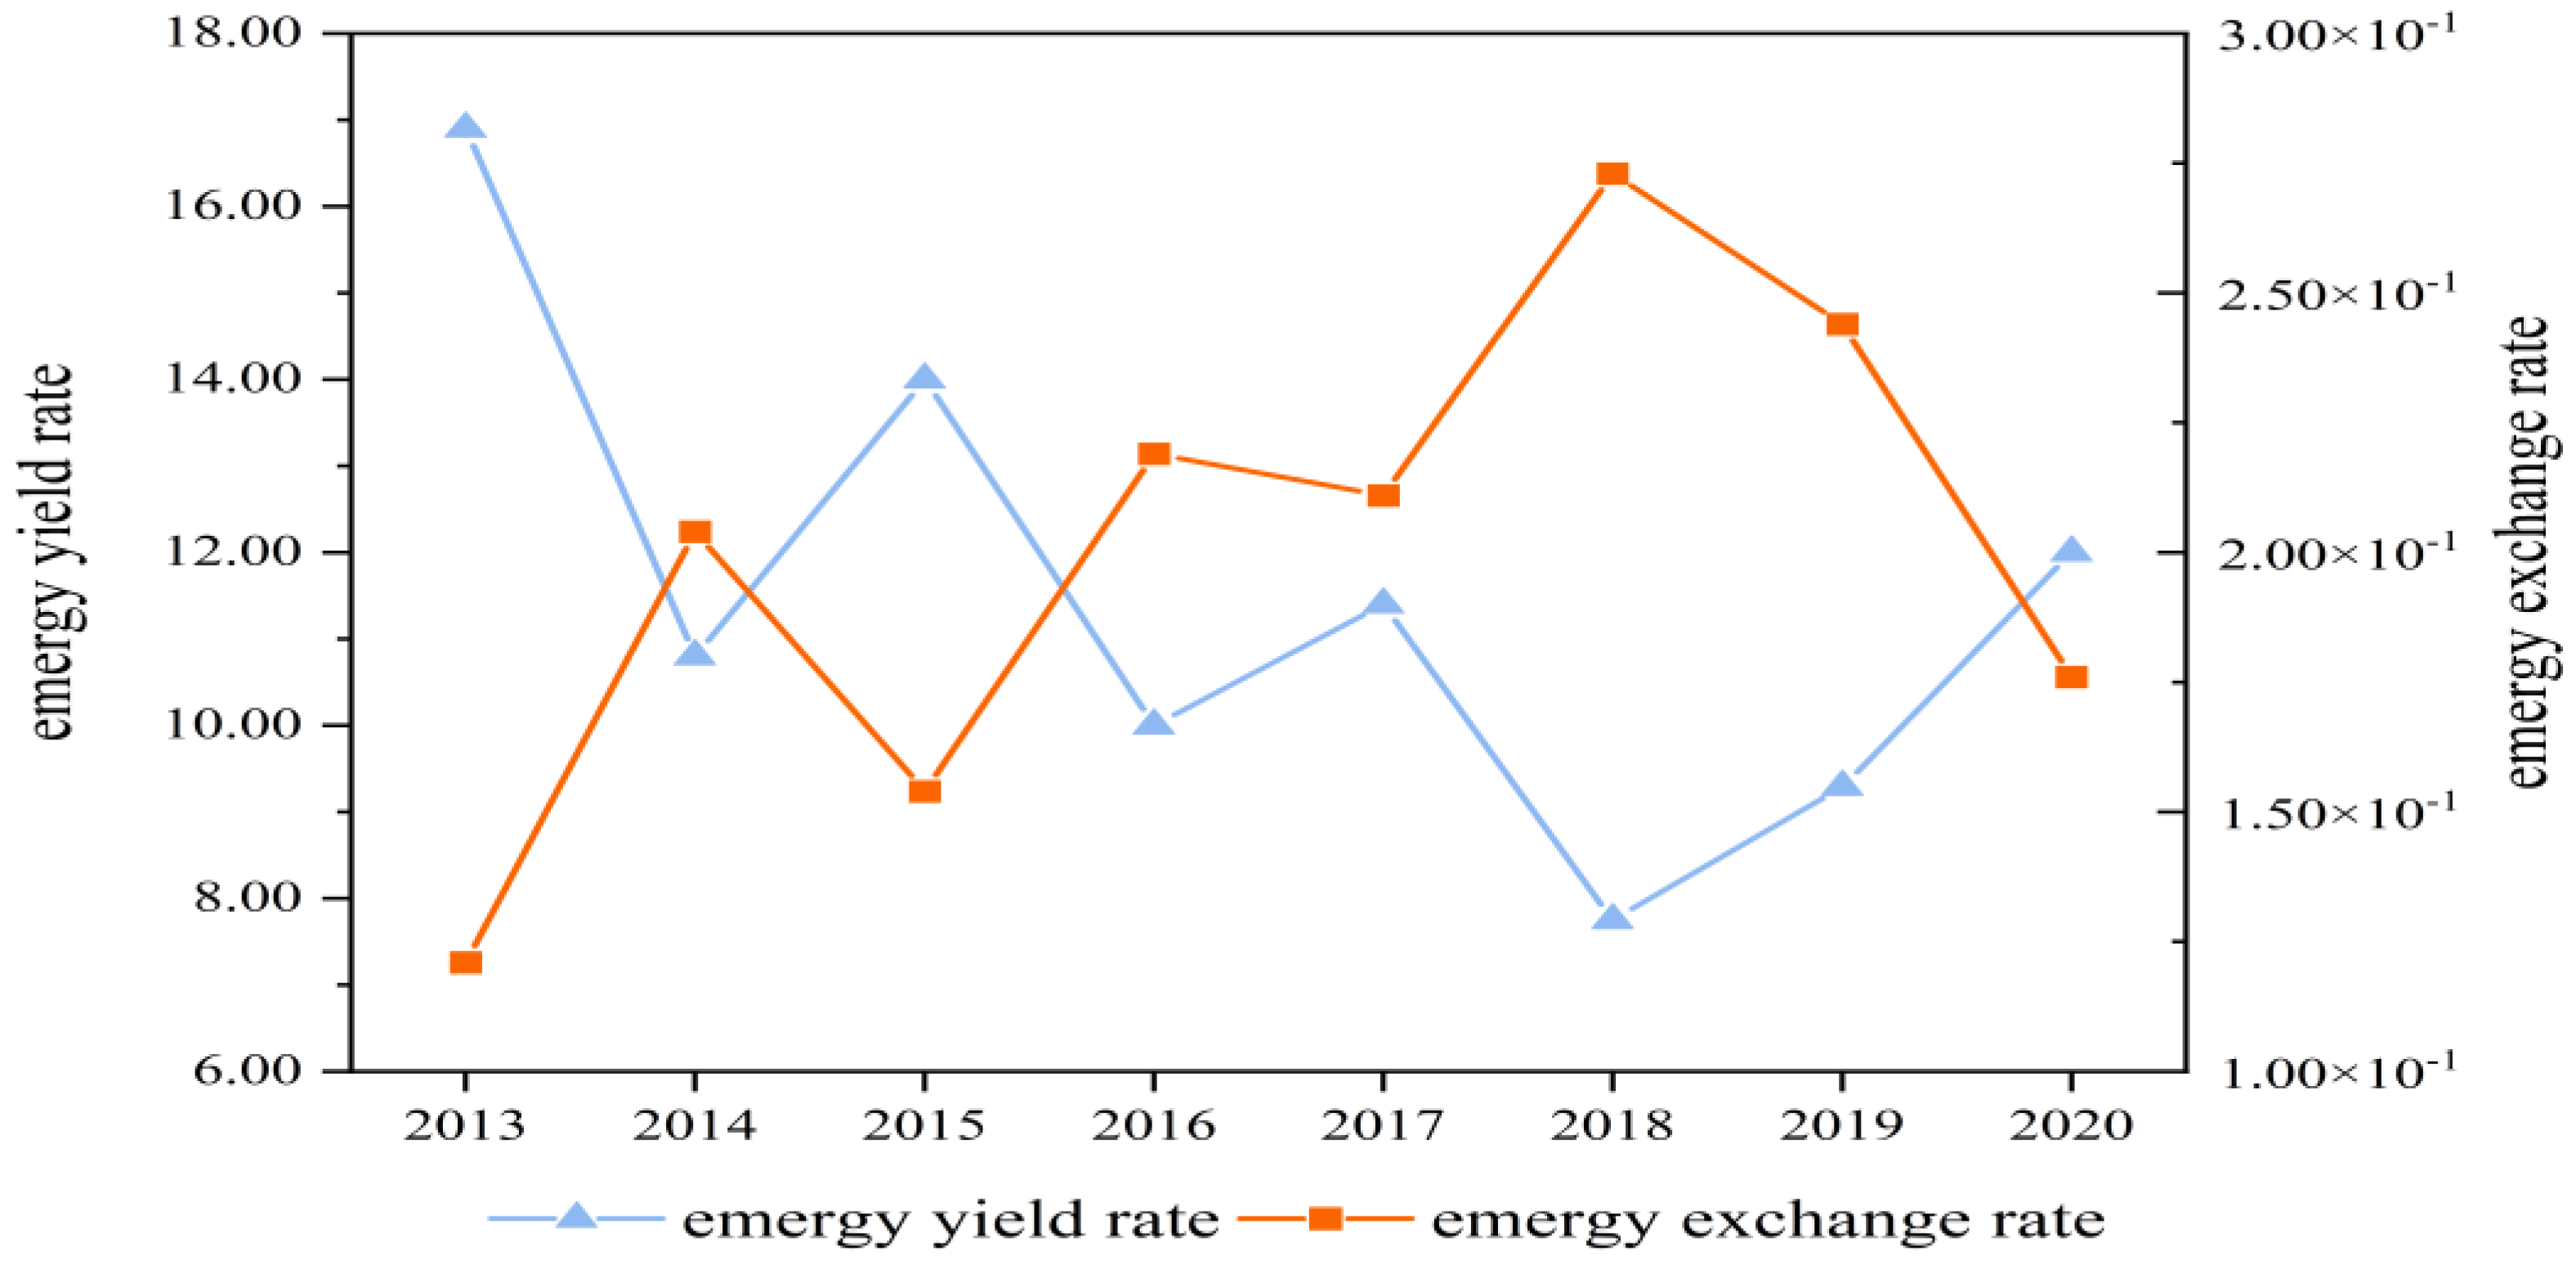
In recent years, the emergy yield ratio (EYR) of Shanxi Province fluctuated from 16.9 in 2013 to 7.75 in 2018 and then rose to 12.0 from 2018 to 2020 (Figure 9). The emergy exchange rate (EER) of Shanxi Province fluctuated from 0.12 in 2013 to 0.18 in 2020 (Figure 9), remaining at a low level for a long time. According to the research of Odum, when the emergy exchange rate is less than 1, the energy value wealth in external-oriented economy exchanges is lost, which is not conducive to the long-term economic development of the region [50].
The emergy yield rate decreased first and then increased, which reflects that Shanxi Province experienced the shock of transformation in the early stage of the study period and achieved initial results in the later stage of transformation. The emergy exchange rate of Shanxi Province from 2013 to 2020 showed an overall fluctuating rise, indicating that it was developing in a good direction in the external-oriented economy. From 2018 to 2020, the emergy exchange rate in Shanxi showed a downward trend, mainly because Shanxi’s raw coal production and raw coal export increased greatly in these 3 years. Moreover, the emergy exchange rate in Shanxi was low for a long time, i.e., 0.12 in 2013 and 0.18 in 2020. This is mainly because Shanxi Province has acted as a national energy supply guarantee for a long time, with a huge number of coal resources exported every year.
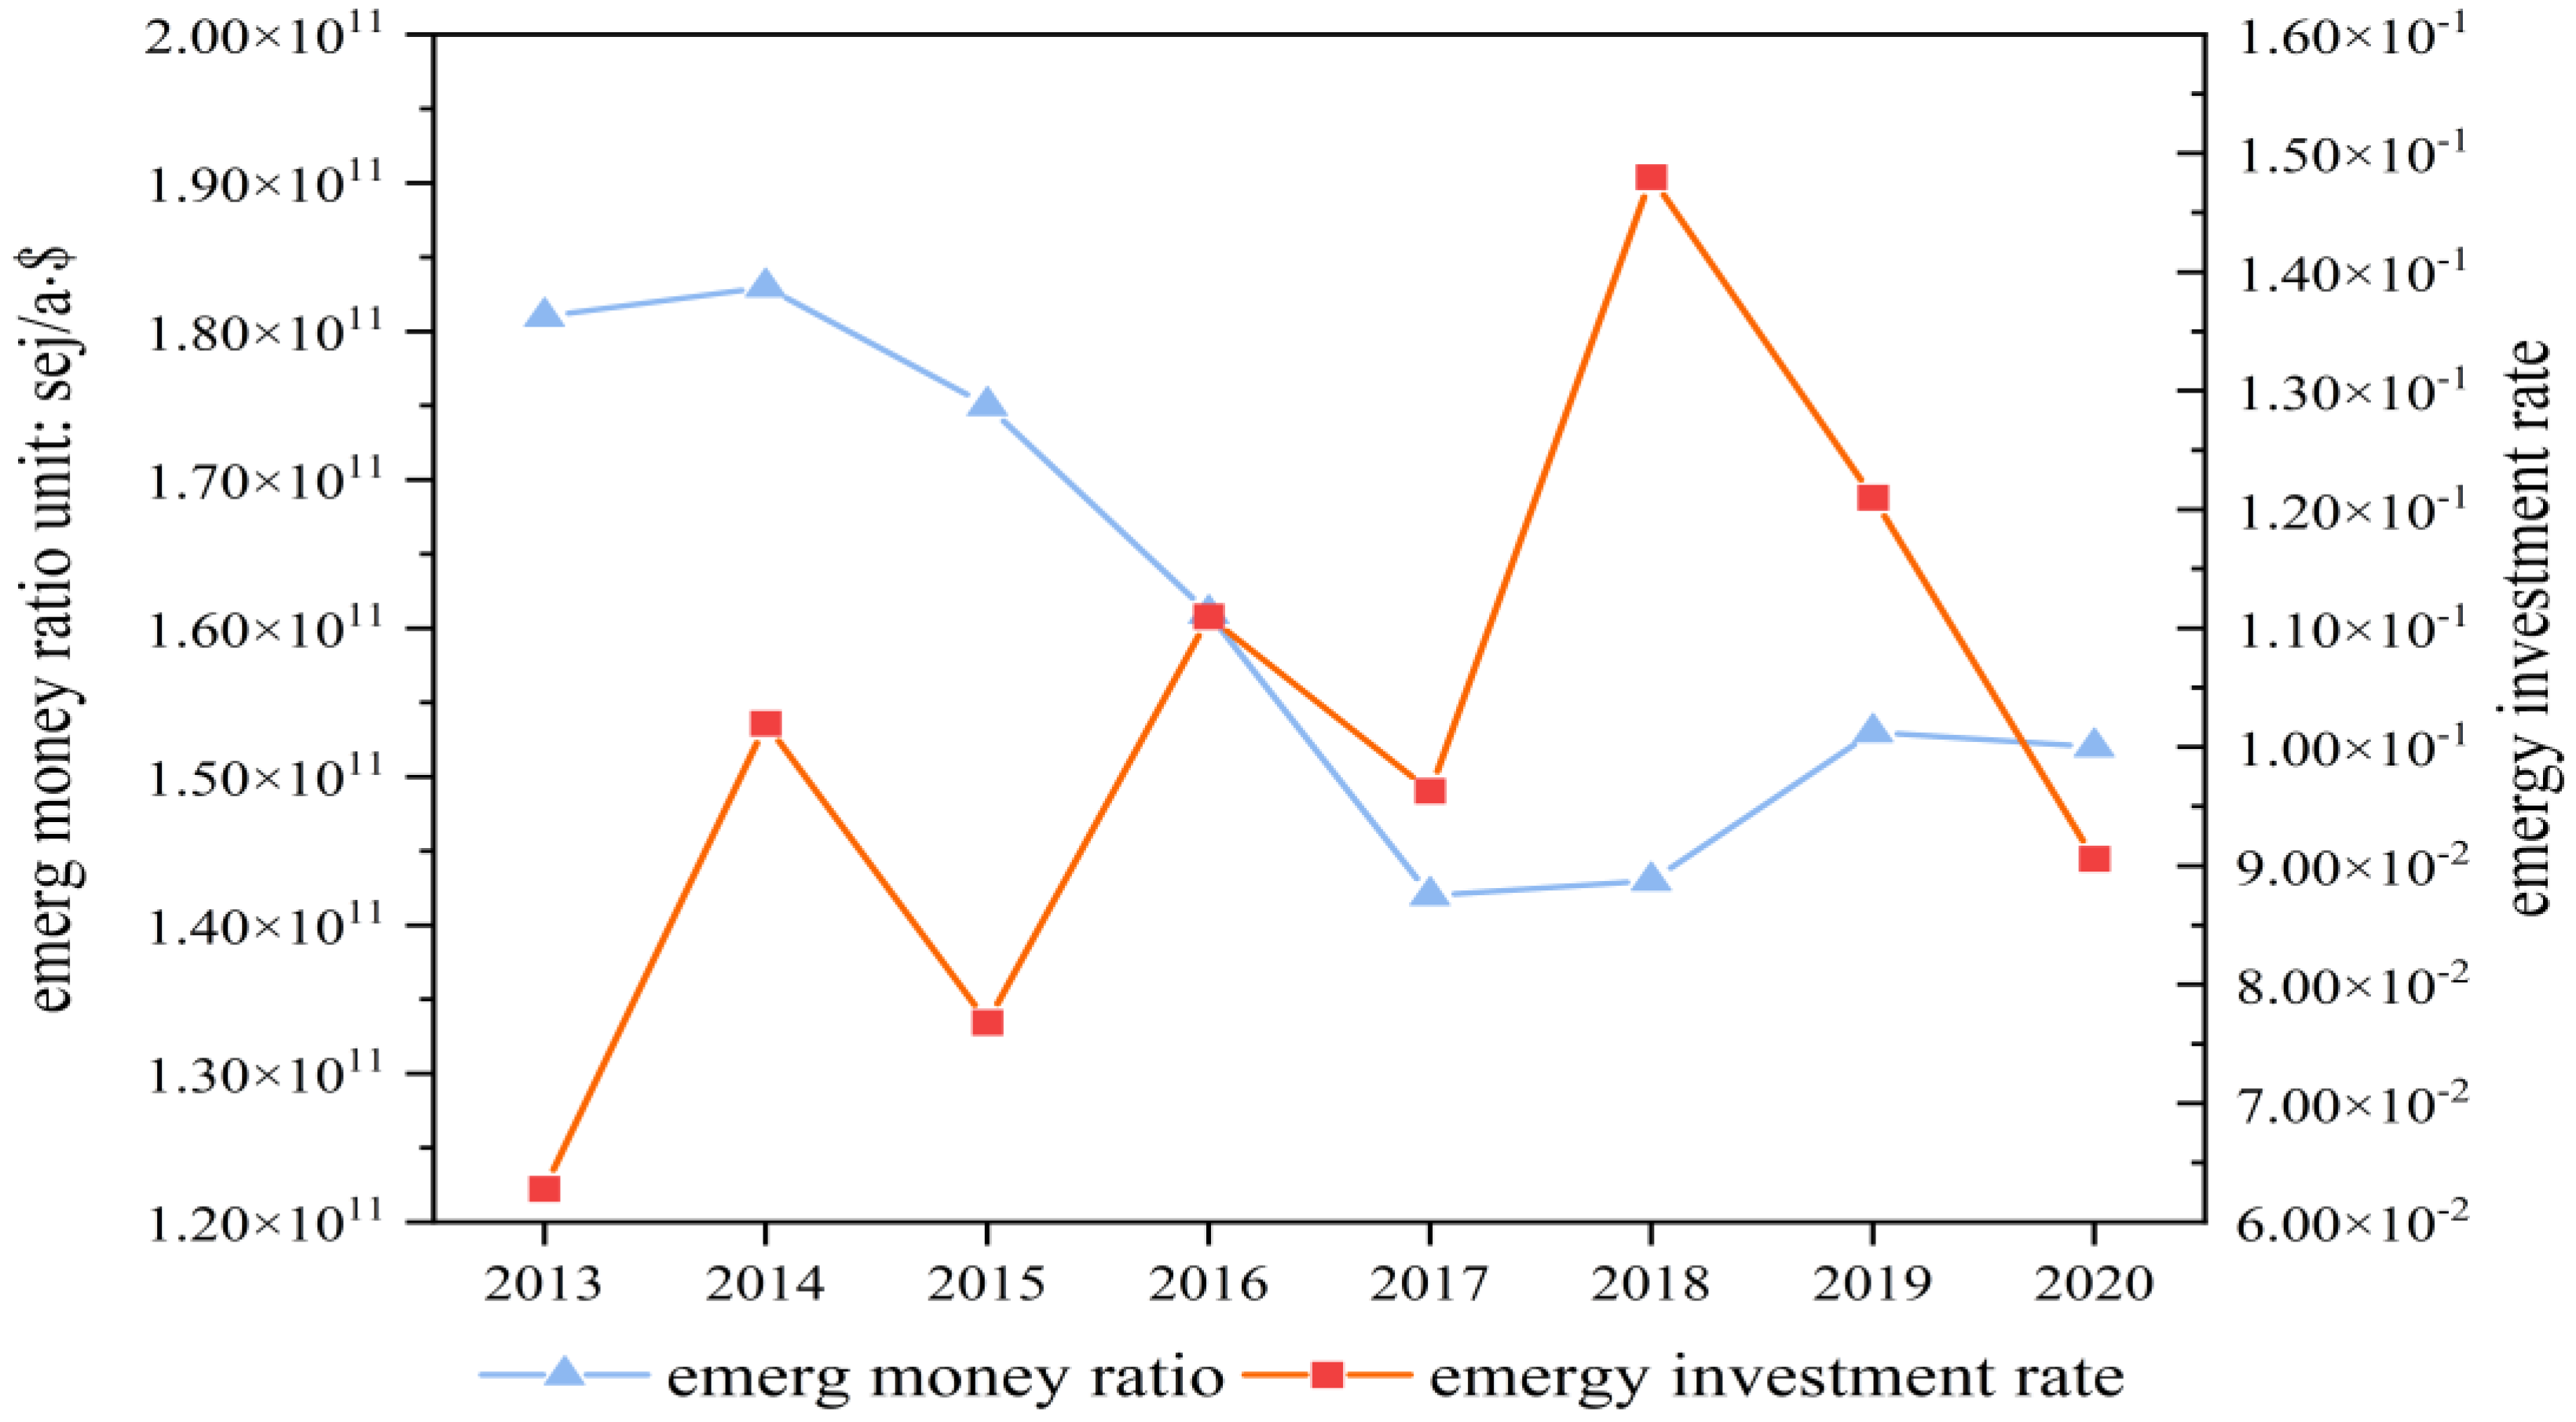
The emergy money ratio of Shanxi Province decreased from 7.29 × 10¹² sej/a·USD in 2013 to 5.74 × 10¹² sej/a·USD in 2017 before increasing slowly from 2018 to 2020, reaching 6.14 × 10¹² sej/a·USD in 2020 (Figure 10). The emergy investment rate (EIR) is used to measure the economic development degree and environmental load degree. A higher emergy investment rate indicates a more export-oriented economy and a lower dependence on the environment. The emergy investment rate of Shanxi Province from 2013 to 2020 showed an overall upward trend of oscillation (Figure 10).
The growth of the emergy money ratio in Shanxi in the early stage was mainly due to the rapid growth of GDP in Shanxi Province, while nonrenewable resources did not increase significantly. The decline in the emergy money ratio at the later stage was mainly due to the rapid growth of output of Shanxi’s raw coal and related processing industries. The emergy investment rate of Shanxi increased significantly from 2013 to 2018, mainly due to the economic transformation of Shanxi Province and the emphasis on the introduction of advanced technology. The increase in the emergy investment rate from 2018 to 2020 again confirmed the influence of the increase in the output of raw coal and related industrial products.
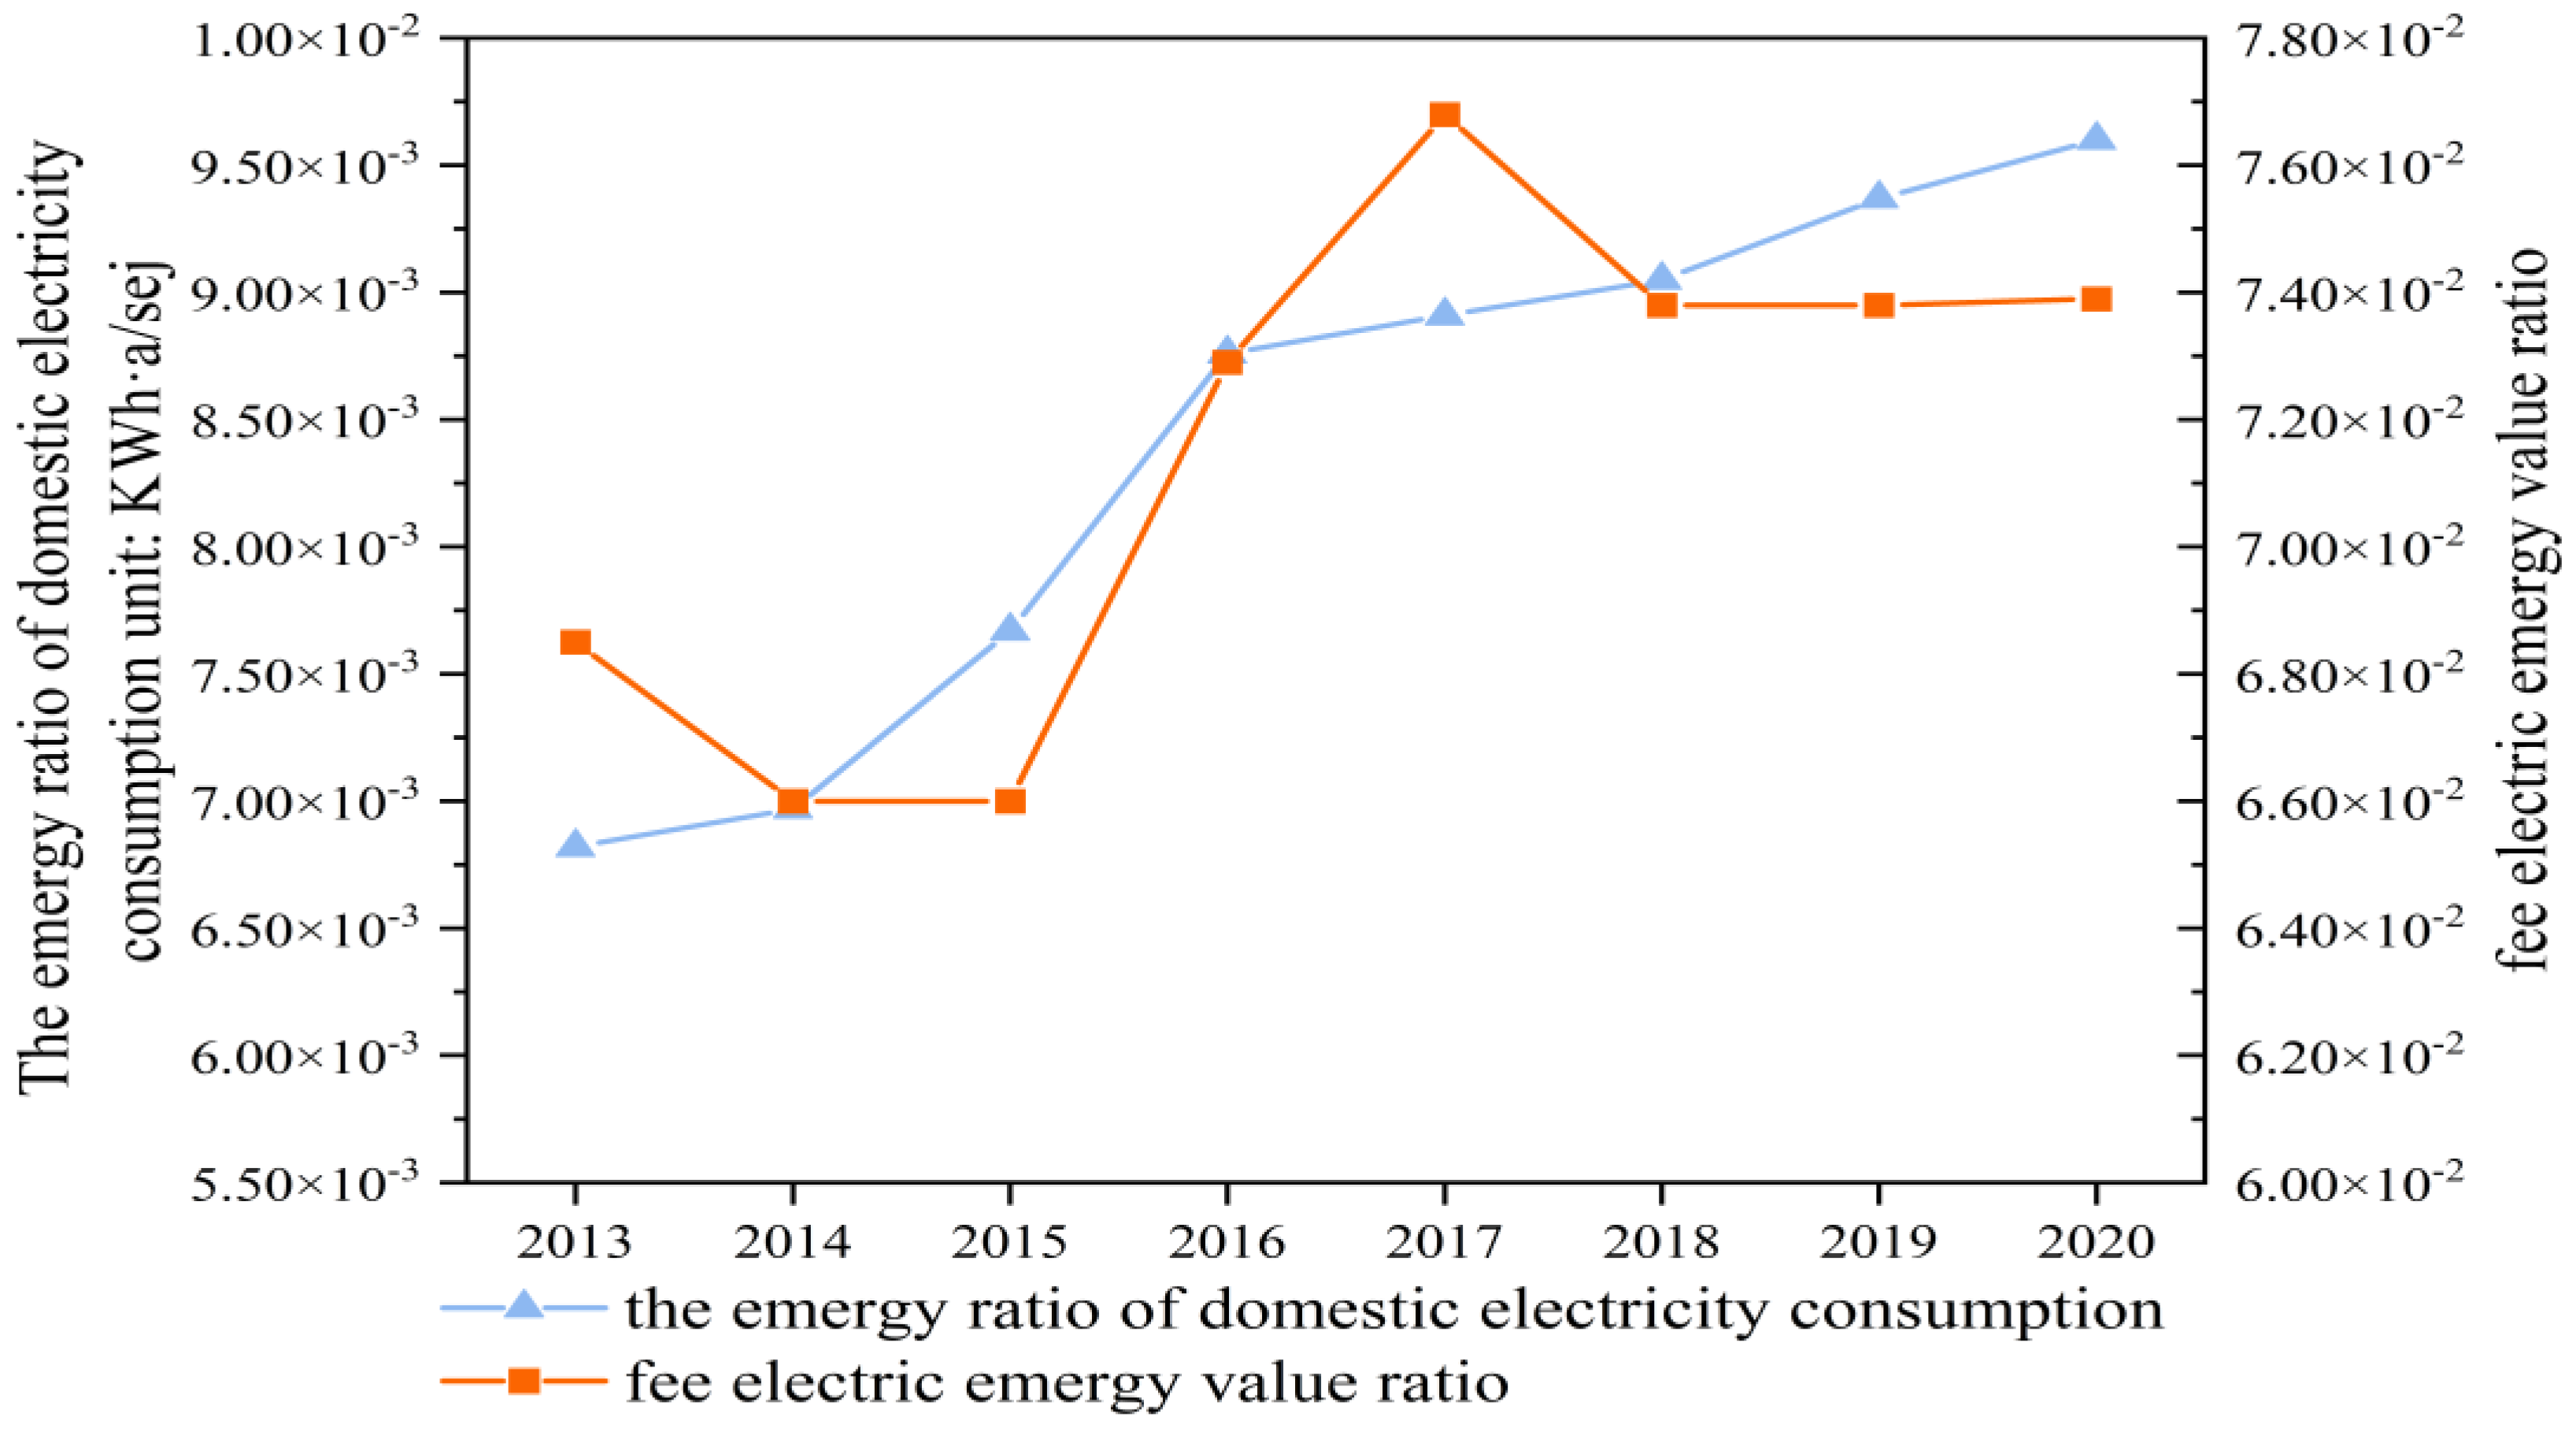
The emergy ratio of domestic electricity consumption is used to measure the modernization level of residents’ living standards in the region. This index can better reflect the degree of modernization of residents’ life than the power emergy ratio. The emergy value ratio of domestic electricity in Shanxi Province was 0.0063 in 2013 and 0.0096 in 2020, with a growth rate of 41% in 2020 compared with 2013 (Figure 11). FEE is used to reflect the degree of economic modernization of the region. The electricity emergy usage ratio of Shanxi Province was 0.069 in 2013 and 0.074 in 2020, and the electricity emergy of Shanxi Province increased by 7.8% in 2020 compared with 2013 (Figure 11).
The growth of the emergy ratio of domestic electricity consumption and the fee electric emergy value ratio in Shanxi Province in recent years reflects that the modernization degree of local residents has been greatly improved and that the industrial modernization has made steady progress.

3.4. Environmental Subsystem Evaluation Index

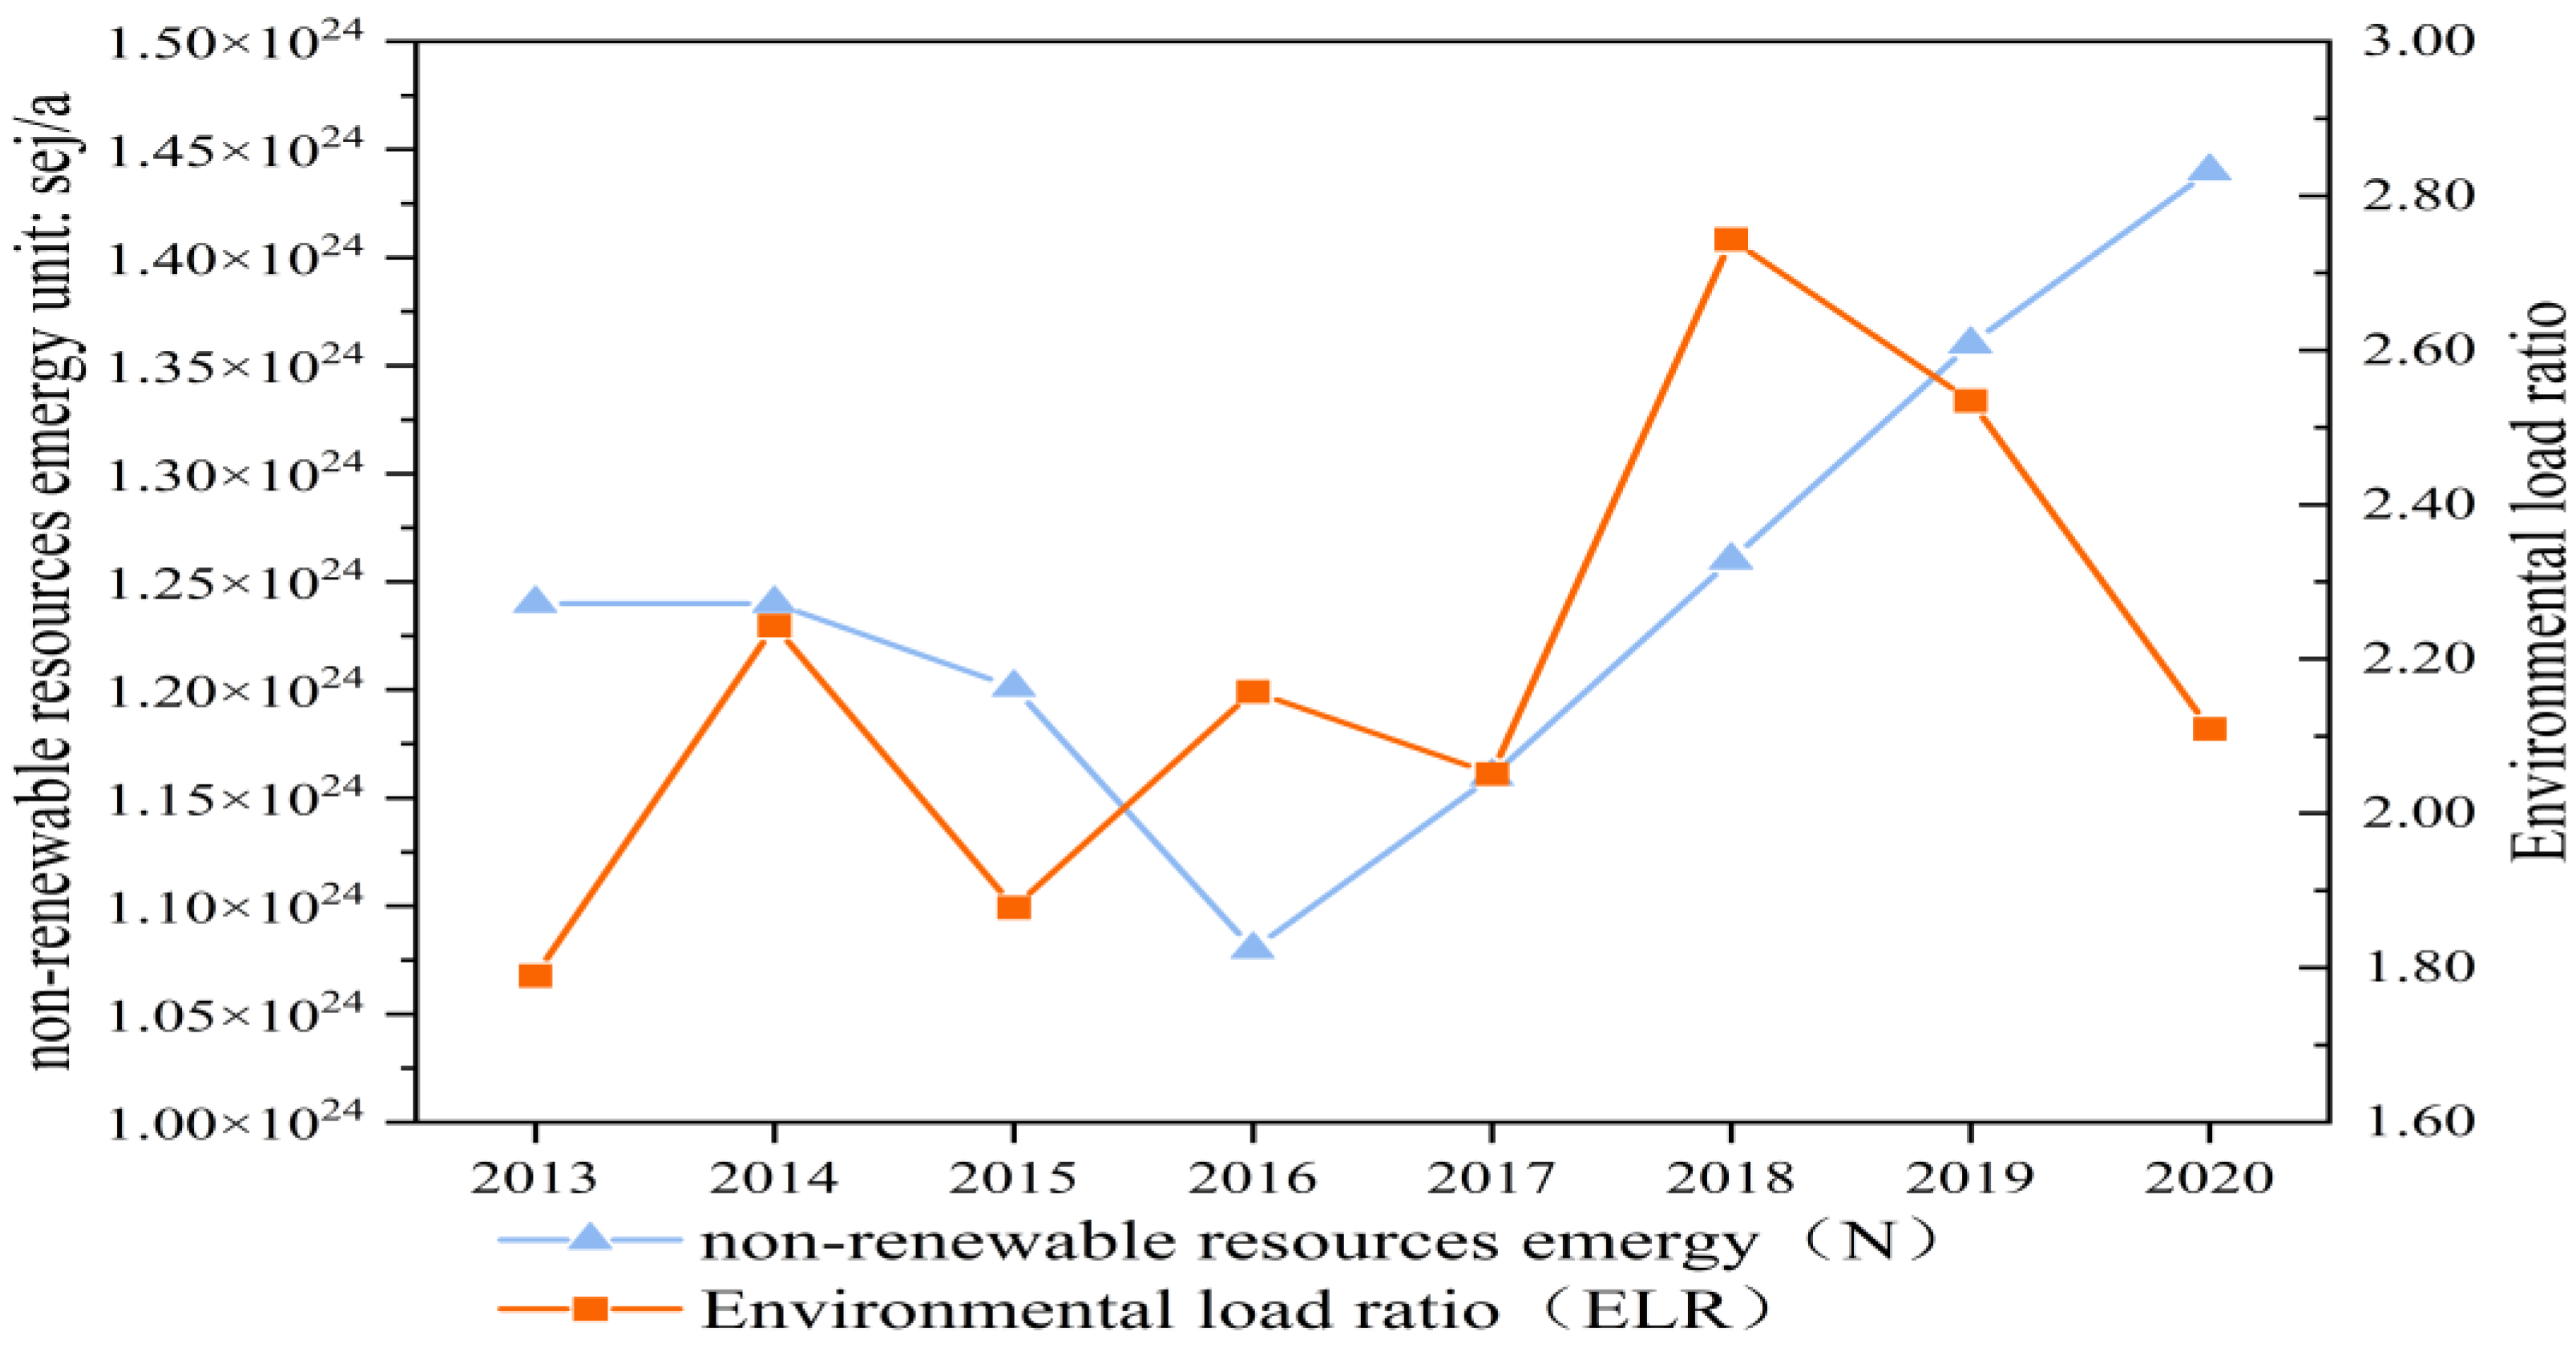
The environmental load ratio (ELR) is used to measure the environmental carrying capacity. A higher environmental load ratio indicates greater pressure on the local environment. The environmental load rate of Shanxi Province was 17.9 in 2013 and 21.1 in 2020, representing a 17.9% increase (Figure 12).
At present, the environmental load rate of Shanxi Province is at a high level compared to the rest of the world, which is caused by the relatively large emergy value of nonrenewable resources and the relatively high output of coal and related industries [51]. The environmental load rate of Shanxi Province showed a fluctuating upward trend from 2013 to 2018, mainly due to the increase in the energy consumption of nonrenewable resources. Coal production and related processing industries are highly emergy-consuming and polluting industries, leading to environmental damage and external uneconomic growth. After 2018, the environmental load rate in Shanxi showed a downward trend thanks to the growth of new energy power generation.
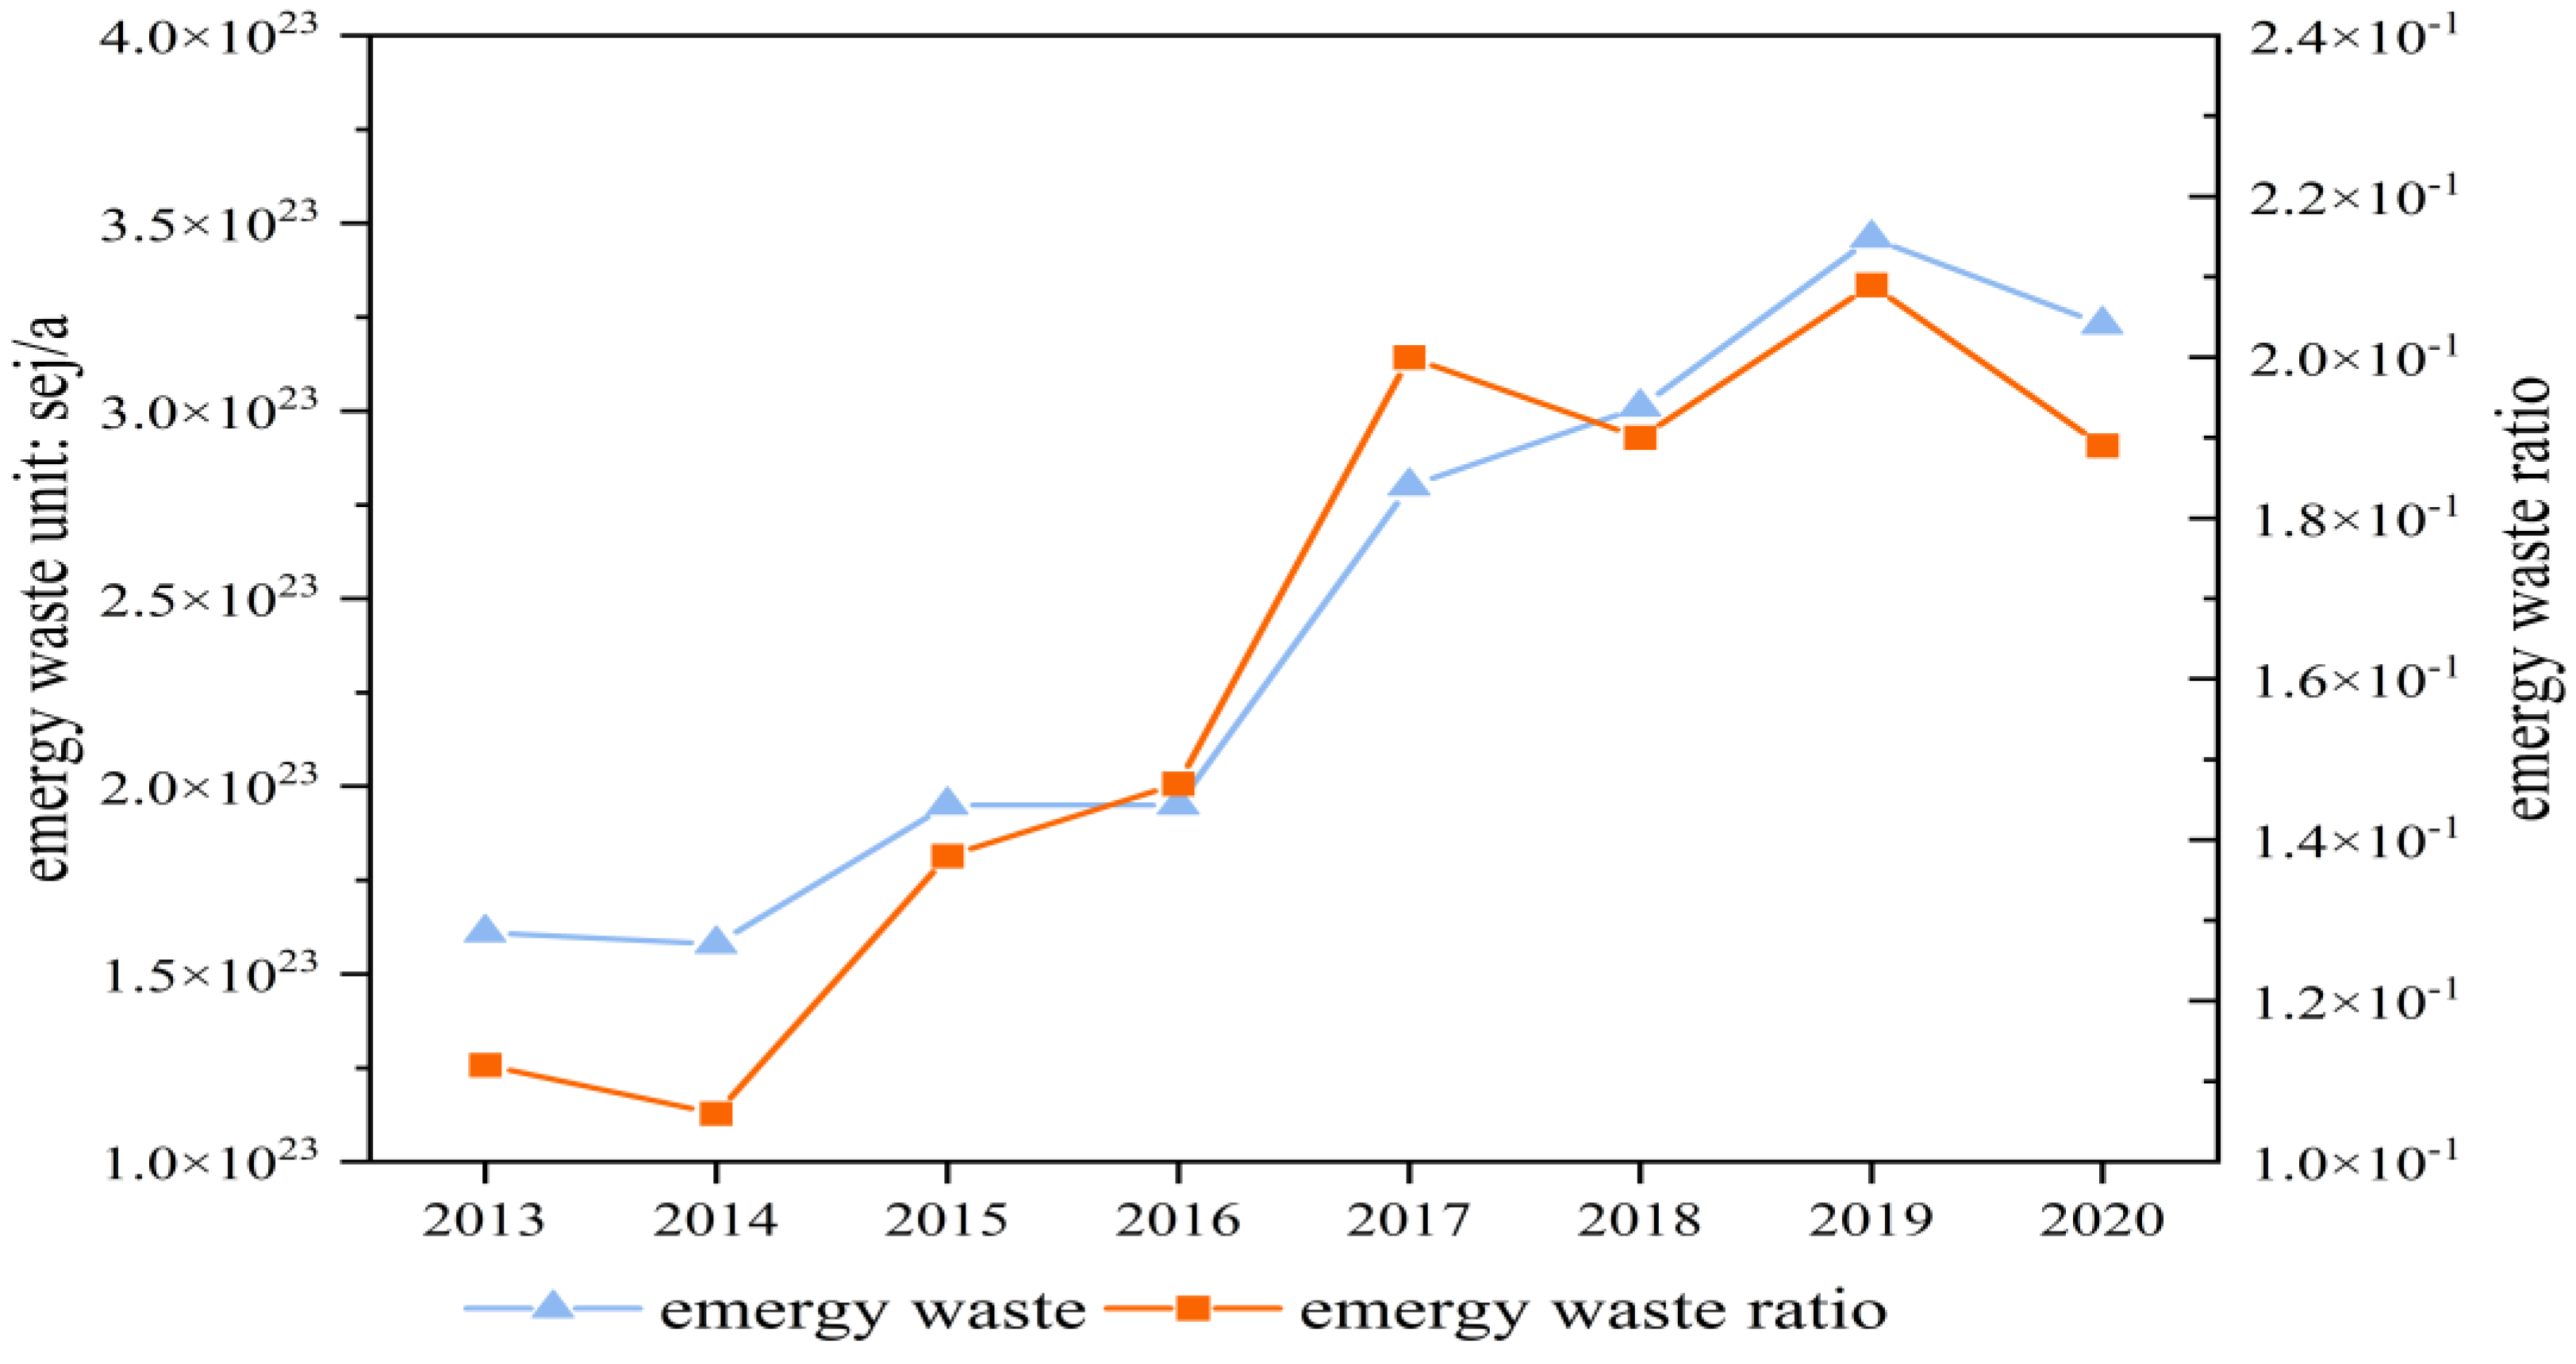
The waste emergy ratio (EWR) is used to measure the pressure of waste on the environment. The emergy ratio of waste in Shanxi Province increased from 0.121 in 2013 to 0.189 in 2020, with a growth rate of 68.5% (Figure 13). In 2013, the emergy value of Shanxi waste was 1.61 × 10²³ sej/a, whereas, in 2020, the emergy value of Shanxi waste was 3.23 × 10²³ sej/a, representing an increase of 101% (Figure 13).
The main reasons for the increase in the waste emergy ratio and waste emergy consumption are described below. Shanxi Province has a high proportion of solid waste emergy, accounting for more than 80% of the total. The main sources of solid waste emergy are tailings, slag, and smelting waste produced by mining, thermal power generation, and metallurgy. In 2020, the output of general industrial solid waste in Shanxi Province reached 426.35 million tons, while the comprehensive utilization of general industrial solid waste was only 171.5 million tons (33.2%) [7]. The emergy value of solid waste in Shanxi has increased rapidly in recent years, but the disposal rate of solid waste has not kept pace with the production rate of solid waste, despite the ratio decreasing [7].

3.5. Sustainable Development Evaluation Index

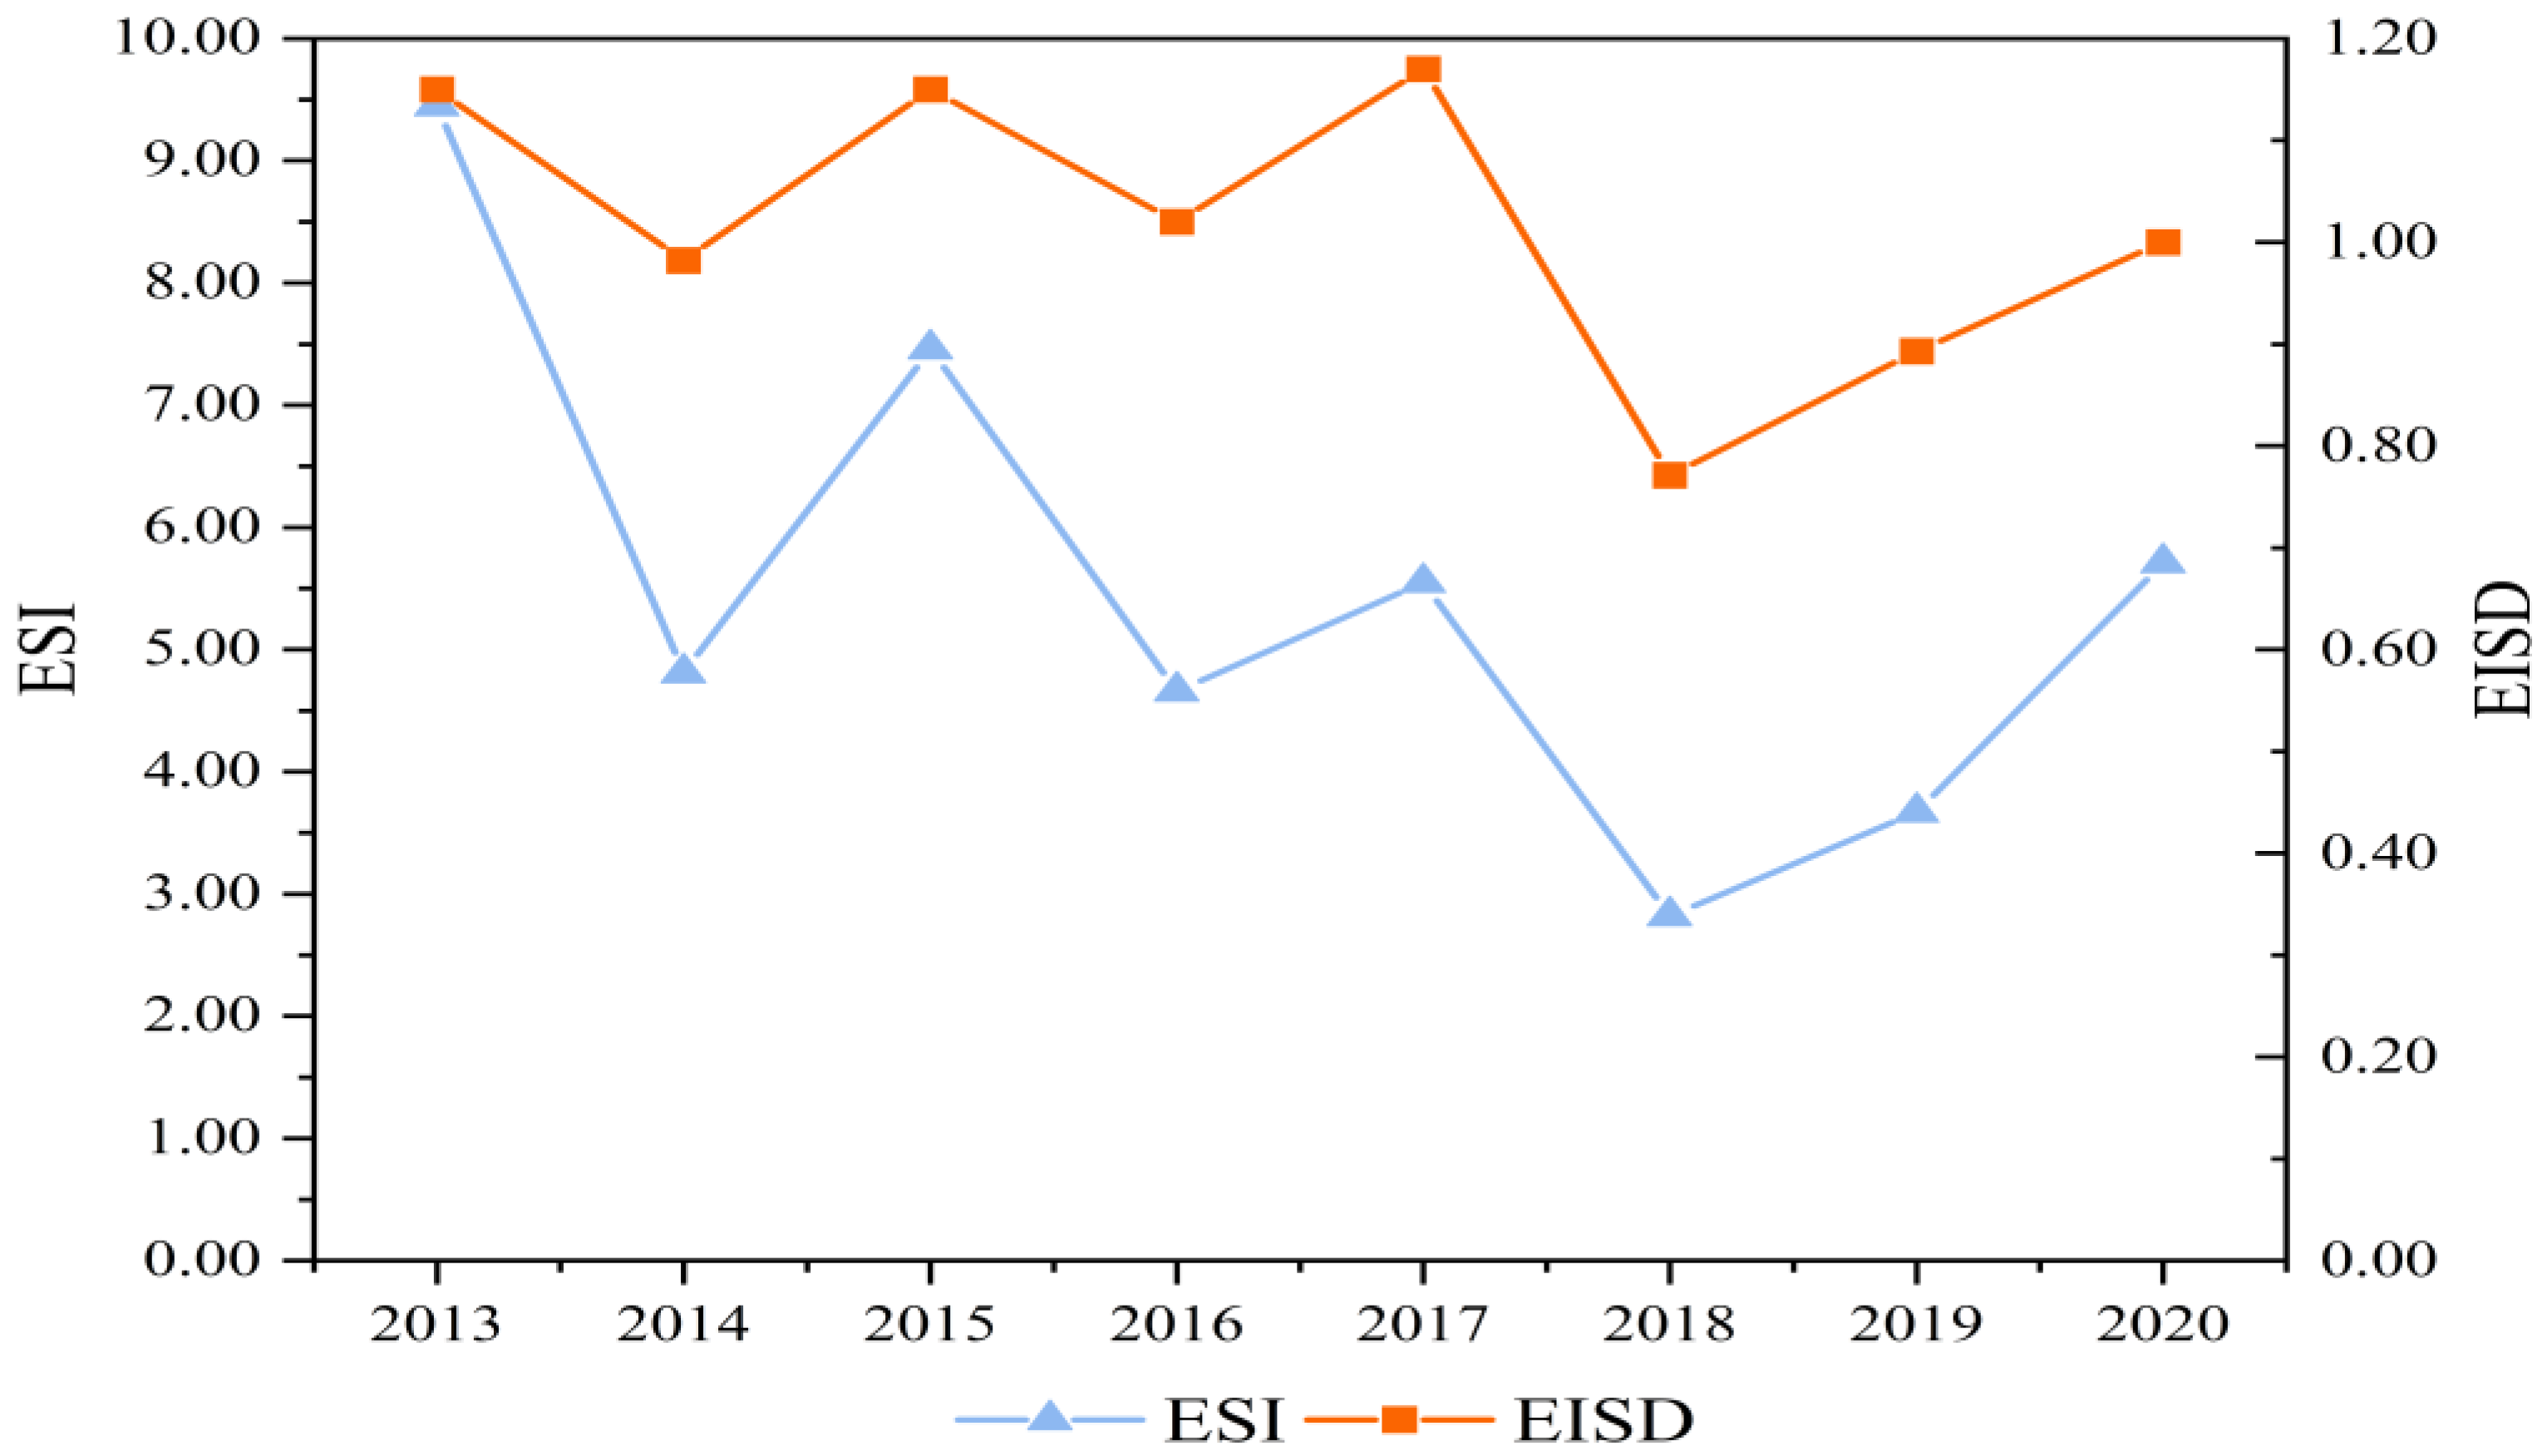
The sustainability index (ESI) is the ratio of the emergy yield rate to the environmental load rate. ESI > 10 indicates that the development and utilization of the regional eco-economic system is not sufficient. ESI < 1 indicates that this region has a large amount of nonrenewable emergy and is a consumption economy. If the ESI is between 1 and 10, it indicates that the study area has economic vitality and potential. The ESI value of Shanxi Province in 2013 was 9.45, indicating that the development and utilization of economic resources in Shanxi Province was not sufficient, whereas the ESI value of Shanxi Province in 2020 was 5.71 (Figure 14). The evaluation system sustainable development index (EISD) refers to the product of the emergy output rate and emergy exchange rate, divided by the environmental load rate. A higher ESID value indicates better social and economic benefits of the region under the same environmental pressure, i.e., a better sustainable development ability of the region. The ESID value of Shanxi Province was always significantly lower than the ESI value, with values of 1.15 in 2013 and 1.00 in 2020. From 2013 to 2020, the ESID value of Shanxi Province first decreased and then increased (Figure 14).
The ESI value of Shanxi Province from 2013 to 2020 showed a downward trend of oscillation, remaining within the range of sustainable development, but the value was high. This indicates that, although Shanxi has a certain economic development potential at present, the development and utilization efficiency of its own resources are not high. The initial decline and subsequent rise in the ESID value in Shanxi Province from 2013 to 2020 indicates that Shanxi Province experienced transition pains in the early stage. The emergy yield rate of Shanxi Province decreased in the early stage; however, in the later stage, the economic transformation of Shanxi Province achieved initial results, with an increase in the emergy yield rate.

4. Discussion

4.1. Suggestions

Shanxi Province, in addition to shouldering a heavy burden of China’s energy supply, faces the challenges of China’s dual carbon target and the energy crisis following the Russia–Ukraine conflict in 2022. Therefore, we must vigorously develop renewable resources, introduce new technology, and optimize the economy of Shanxi province. Specific countermeasures are as follows:
  • Transform the economic development model and focus on developing a circular economy: In view of the low utilization rate of nonrenewable natural resources in Shanxi Province, we can consider changing the economic development mode from relying solely on resource advantages to combining resource advantages with technical advantages.
  • Under the premise of ensuring the Chinese energy supply, find new pillar industries: For example, in the 14th Five-Year Plan (plan for national economic and social development of the People’s Republic of China and the outline of the 2035 Vision Goals), Shanxi set four fields as the key areas for future development: semiconductor materials, carbon-based new materials, biobased new materials, and special metal materials [52].
  • Improve the efficiency of economic external communication and strengthen the input of the external emergy value: In view of the low emergy exchange rate of Shanxi Province, we can consider strengthening advanced technology and material introduction. Only by continuously increasing the effort to absorb talents can Shanxi Province move toward scientific and technological innovation. Accordingly, Shanxi Province can transition from resource output to technology output and improve regional market competitiveness.
  • Considering China’s goal of achieving a carbon peak by 2030, Shanxi Province should improve the resource utilization structure and vigorously develop new energy. The local government should advocate for the development and utilization of sustainable energy in combination with the large potential of wind, photovoltaic, and bio-energy power generation in Shanxi Province [53] while considering that the output and technology of methanol and hydrogen energy are among the best in the world. Shanxi Province should pay more attention to the efficiency and depth of resource utilization, transitioning from traditional coal mining to coal chemistry and new materials, as well as from traditional metallurgy to equipment manufacturing.
  • Cultivate talents related to emerging industries and develop new pillar industries: Shanxi Province, in the 14th Five-Year Plan, listed new energy, high-end equipment manufacturing, general aviation, medical production, photovoltaic industry, and other pillar industries [54]. However, these industries require a large number of talents, so colleges and universities should connect with related industries, set up related majors, undertake related research projects, and promote industrial development with science and technology. The government has taken measures to encourage some high-tech industries by providing tax or financial support.
  • Reduce waste discharge and improve the waste disposal rate: We can cooperate with colleges and universities to study the use of science and technology to turn general industrial wastes into new materials. Government departments should organize and guide all sectors of society to raise awareness of environmental protection, strengthen environmental supervision, and strictly investigate illegal factories and mines that do not comply with regulations by releasing waste into the natural world. At the same time, governments should increase financial support for areas with serious environmental pollution and fragile ecology, as well as carry out treatment and restoration.

4.2. Study Contributions and Limitations

In this study, the emergy analysis method was applied to the assessment of sustainable development in resource-based regions of Shanxi Province, enriching the research methods for the assessment of sustainable development in resource-based regions. In addition, various emergy indicators in Shanxi Province in the context of the National Sustainable Development Plan for Resource-Based Cities (2013–2020) were measured over the 8 years while providing a research method for quantifying the effect of this policy. In addition, on the basis of the 21st Century Development Agenda of Shanxi Province and the academic achievements [36,38] of the emergy analysis of the regional eco-economic system, this study established an emergy evaluation system of the eco-economic system that conforms to Shanxi’s own characteristics. The authors aim to implement Shanxi’s economic transformation and China’s 2030 carbon peak policy to help identify development problems, as well as development directions and goals, while also providing a good experience for assessing the sustainable development of resource-based areas.
This study also had some limitations. Firstly, because the emergy conversion rate of this study was obtained from the research results of existing scholars, there may have been some differences with the actual situation in Shanxi Province. Secondly, this paper did not carry out in-depth research on the exploration of sustainable development power and the dynamic mechanism affecting the capacity of sustainable development in different types of resource-based cities, which can be a direction of further exploration.

5. Conclusions

In this paper, the sustainable development of Shanxi Province, China was evaluated using the emergy analysis method, and it was concluded that Shanxi Province has a certain potential for sustainable development. The sustainable development of Shanxi Province has the problem of a low resource utilization rate. The EISD value of Shanxi Province decreased first and then increased during 2013–2020, reflecting that Shanxi Province achieved a certain effect after experiencing the pains of transformation.
In terms of the basic emergy of Shanxi Province, the proportion of nonrenewable resource emergy is too large, the population carrying capacity is excessive, the emergy intensity is much higher than the world average level, the emergy self-sufficiency rate is high but the input emergy is low, the emergy exchange rate is at a low level, the waste disposal rate is low, and the environmental pollution is serious.
Therefore, improving the utilization rate of resources, cultivating new pillar industries, and vigorously developing renewable resources represent good approaches for the sustainable development of Shanxi Province.

Author Contributions

Conceptualization, D.C. and F.H.; methodology and software, F.H. and Q.W.; validation, F.H. and D.C.; formal analysis, investigation, resources, data curation, and writing—original draft preparation, F.H.; writing—review and editing, D.C.; visualization, F.H.; supervision, D.C.; project administration, D.C. All authors have read and agreed to the published version of the manuscript.

Funding

This research received no external funding.

Institutional Review Board Statement

This study did not require ethical approval.

Informed Consent Statement

Informed consent was obtained from all subjects involved in the study.

Data Availability Statement

All data generated or analyzed during the study are included in this published article.

Conflicts of Interest

The authors declare no conflict of interest.

Appendix A

Table A1. Original data of Shanxi’s eco-economic system from 2013 to 2020, along with the solar emergy conversion rate and the reference of conversion.
Collection ObjectUnitOriginal DataRate (sej/unit)Reference
20132014201520162017201820192020
Renewable resources R1
1. Solar energyJ6.28 × 10206.28 × 10206.28 × 10206.28 × 10206.28 × 10206.28 × 10206.28 × 10206.28 × 10201.00[55]
2. Wind energyJ6.12 × 10166.12 × 10166.12 × 10166.12 × 10166.12 × 10166.12 × 10166.12 × 10166.12 × 10166.23 × 102[55]
3. Rainwater chemical energyJ4.76 × 10174.71 × 10174.24 × 10175.15 × 10174.55 × 10174.26 × 10173.53 × 10174.18 × 10171.82 × 104[55]
4. Rainwater potential energyJ1.30 × 10181.21 × 10181.10 × 10181.33 × 10181.24 × 10181.10 × 10189.10 × 10171.23 × 10181.00 × 104[55]
5. Earth cycle energyJ1.84 × 10171.84 × 10171.84 × 10171.84 × 10171.84 × 10171.84 × 10171.84 × 10171.84 × 10172.90 × 104[55]
Renewable organic resources R2
1. Hydroelectric powerJ1.08 × 10161.21 × 10161.31 × 10161.40 × 10161.52 × 10161.54 × 10161.66 × 10161.59 × 10168.00 × 104[55]
2. Wind powerJ2.18 × 10162.86 × 10163.85 × 10164.91 × 10165.94 × 10166.78 × 10167.06 × 10167.72 × 10167.00 × 104[56]
3. Solar powerJ8.38 × 10158.66 × 10158.98 × 10159.93 × 10152.00 × 10163.37 × 10164.57 × 10164.80 × 10166.25 × 104[38]
Nonrenewable resource N1
1. Loss of topsoilJ3.73 × 10153.73 × 10153.73 × 10153.73 × 10153.73 × 10153.73 × 10153.73 × 10153.73 × 10156.25 × 104[55]
Non-renewable resource products N2
1. Natural gasm33.56 × 1093.80 × 1094.00 × 1094.30 × 1094.70 × 1095.30 × 1096.50 × 1098.60 × 1091.80 × 1012[50]
2. Raw coalT9.20 × 1089.70 × 1089.70 × 1088.30 × 1088.70 × 1089.30 × 1089.90 × 1081.07 × 1088.36 × 1014[50]
3. Thermal powerkW·h2.30 × 10112.40 × 10112.20 × 10112.01 × 10112.52 × 10112.68 × 10112.98 × 10112.97 × 10115.40 × 1011[50]
4. CementT5.30 × 1074.80 × 1073.80 × 1073.90 × 1073.80 × 1074.40 × 1075.00 × 1075.60 × 1072.07 × 1015[50]
5. SteelT9.00 × 1079.00 × 1078.10 × 1078.20 × 1078.80 × 1071.03 × 1081.16 × 1081.27 × 1081.40 × 1015[50]
6. Aluminum oxideT7.84 × 1067.84 × 1061.27 × 1071.41 × 1071.93 × 1072.02 × 1071.99 × 1071.81 × 1071.63 × 1015[38]
7. Aluminum productT1.04 × 1068.26 × 1056.60 × 1058.68 × 1059.85 × 1059.30 × 1057.81 × 1057.61 × 1051.60 × 1016[50]
8. FertilizerT4.47 × 1064.60 × 1064.60 × 1064.40 × 1063.70 × 1063.60 × 1064.00 × 1064.00 × 1062.80 × 1015[50]
9. CokeT9.02 × 1078.80 × 1078.00 × 1078.20 × 1078.40 × 1079.30 × 1079.70 × 1071.04 × 1083.50 × 1014[38]
Self-produced renewable products S
1. FoodT1.36 × 1071.38 × 1071.31 × 1071.38 × 1071.36 × 1071.38 × 1071.36 × 1071.40 × 1071.04 × 1015[55]
2. Cooking oilT1.81 × 1051.64 × 1051.21 × 1051.59 × 1051.50 × 1051.55 × 1051.37 × 1051.40 × 1052.06 × 1016[55]
3. VegetableT9.32 × 1069.72 × 1068.30 × 1067.86 × 1068.06 × 1068.22 × 1068.28 × 1068.60 × 1061.15 × 1014[55]
4. Fruit (fresh)T7.56 × 1057.52 × 1055.20 × 1054.70 × 1054.70 × 1055.30 × 1055.45 × 1055.18 × 1052.30 × 1014[55]
5. MeatT8.32 × 1058.73 × 1059.95 × 1058.44 × 1059.30 × 1059.30 × 1059.10 × 1051.02 × 1063.68 × 1016[38]
6. DairyT8.72 × 1059.62 × 1057.77 × 1059.59 × 1057.80 × 1058.16 × 1059.20 × 1051.09 × 1061.42 × 1016[38]
7. Poultry and eggsT7.99 × 1058.37 × 1051.08 × 1058.90 × 1051.02 × 1061.02 × 1061.12 × 1061.17 × 1061.42 × 1016[38]
8. VinegarT5.50 × 1054.70 × 1056.70 × 1056.27 × 1055.67 × 1055.18 × 1054.88 × 1054.91 × 1057.15 × 1015[57]
Waste flow
1. Waste liquidT4.80 × 1084.90 × 1084.10 × 1082.80 × 1082.40 × 1082.20 × 1081.93 × 1081.59 × 1084.30 × 1012[58]
2. Waste gasT2.00 × 1061.84 × 1061.50 × 1067.70 × 1055.02 × 1054.70 × 1053.82 × 1054.40 × 1051.32 × 1016[58]
3. Waste solid (deduction used)T1.07 × 1081.06 × 1081.42 × 1081.48 × 1082.20 × 1082.37 × 1082.53 × 1082.55 × 1081.24 × 1015[58]
Regional imported flow
1. Domestic energy input (standard coal)T2.30 × 1077.10 × 1074.60 × 1077.01 × 1076.04 × 1071.20 × 1079.30 × 1076.30 × 1071.17 × 1015[50]
2. International goods, funding,
and service input
USD7.80 × 10127.30 × 10126.29 × 10126.71 × 10126.97 × 10128.50 × 10129.28 × 10129.13 × 10127.48 × 1012[59]
Regional exported flow
1. Domestic energy output (standard coal)T5.50 × 1085.21 × 1085.08 × 1084.50 × 1084.32 × 1085.60 × 1085.50 × 1086.10 × 1081.17 × 1015[50]
2. International goods, funding, and service output USD7.99 × 1098.94 × 1098.42 × 1099.93 × 1091.02 × 10101.23 × 10101.17 × 10101.27 × 10107.48 × 1012[59]

Appendix B

Table A2. Emergy data of Shanxi’s eco-economic system from 2013 to 2020.
Collection Object20132014201520162017201820192020
Renewable resources R1
1. Solar energy6.28 × 10206.28 × 10206.28 × 10206.28 × 10206.28 × 10206.28 × 10206.28 × 10206.28 × 1020
2. Wind energy3.81 × 10193.81 × 10193.81 × 10193.81 × 10193.81 × 10193.81 × 10193.81 × 10193.81 × 1019
3. Rainwater chemical energy8.56 × 10218.48 × 10217.64 × 10219.27 × 10218.62 × 10217.68 × 10216.36 × 10217.60 × 1021
4. Rainwater potential energy1.30 × 10221.21 × 10221.10 × 10221.33 × 10221.24 × 10221.10 × 10229.10 × 10211.09 × 1022
5. Earth cycle energy5.34 × 10215.34 × 10215.34 × 10215.34 × 10215.34 × 10215.34 × 10215.34 × 10215.34 × 1021
Renewable organic resources R2
1. Hydroelectric power8.64 × 10209.86 × 10201.13 × 10211.13 × 10211.23 × 10211.23 × 10211.33 × 10211.27 × 1021
2. Wind power1.53 × 10212.02 × 10212.70 × 10213.43 × 10214.14 × 10215.42 × 10214.94 × 10215.04 × 1021
3. Solar power5.25 × 10205.41 × 10205.61 × 10206.19 × 10201.25 × 10212.31 × 10212.86 × 10213.00 × 1021
Nonrenewable resource N1
1. Loss of topsoil2.33 × 10202.33 × 10202.33 × 10202.33 × 10202.33 × 10202.33 × 10202.33 × 10202.33 × 1020
Nonrenewable resource products N2
1. Natural gas6.41 × 10216.84 × 10217.20 × 10217.74 × 10218.46 × 10219.54 × 10211.17 × 10221.55 × 1022
2. Raw coal7.69 × 10238.11 × 10238.11 × 10236.94 × 10237.27 × 10237.77 × 10238.28 × 10238.95 × 1023
3. Thermal power1.24 × 10231.30 × 10231.19 × 10231.09 × 10231.36 × 10231.45 × 10231.61 × 10231.60 × 1023
4. Cement1.10 × 10239.94 × 10227.87 × 10228.07 × 10227.87 × 10229.11 × 10221.04 × 10231.16 × 1023
5. Steel1.26 × 10231.26 × 10231.13 × 10231.15 × 10231.23 × 10231.44 × 10231.62 × 10231.78 × 1023
6. Aluminum oxide1.28 × 10221.63 × 10222.07 × 10222.30 × 10223.15 × 10223.29 × 10223.24 × 10222.95 × 1022
7. Aluminum product1.66 × 10221.32 × 10221.06 × 10221.39 × 10221.58 × 10221.49 × 10221.25 × 10221.22 × 1022
8. Fertilizer1.25 × 10221.29 × 10221.29 × 10221.23 × 10221.04 × 10221.01 × 10221.12 × 10221.12 × 1022
9. Coke3.16 × 10223.08 × 10222.80 × 10222.87 × 10222.94 × 10223.26 × 10223.40 × 10223.64 × 1022
Self-produced renewable products S
1. Food1.41 × 10221.44 × 10221.36 × 10221.44 × 10221.41 × 10221.44 × 10221.41 × 10221.46 × 1022
2. Cooking oil3.73 × 10213.38 × 10212.49 × 10213.28 × 10213.09 × 10213.19 × 10212.82 × 10212.88 × 1021
3. Vegetable1.07 × 10211.12 × 10219.55 × 10209.04 × 10209.27 × 10209.45 × 10209.52 × 10209.89 × 1020
4. Fruit (fresh)1.74 × 10201.73 × 10201.20 × 10201.08 × 10201.08 × 10201.22 × 10201.25 × 10201.19 × 1020
5. Meat3.06 × 10223.21 × 10223.66 × 10223.11 × 10223.42 × 10223.42 × 10223.35 × 10223.75 × 1022
6. Dairy1.24 × 10221.37 × 10221.10 × 10221.36 × 10221.11 × 10221.16 × 10221.31 × 10221.55 × 1022
7. Poultry and eggs1.13 × 10221.19 × 10221.53 × 10221.26 × 10221.45 × 10221.45 × 10221.59 × 10221.66 × 1022
8. Vinegar3.93 × 10213.36 × 10214.79 × 10214.48 × 10214.05 × 10213.70 × 10213.49 × 10213.51 × 1021
Waste flow
1. Waste liquid2.06 × 10212.11 × 10211.76 × 10211.20 × 10211.03 × 10219.46 × 10208.30 × 10206.84 × 1020
2. Waste gas2.64 × 10222.43 × 10221.98 × 10221.02 × 10226.63 × 10216.20 × 10215.04 × 10215.81 × 1021
3. Waste solid
(deduction used)
1.33 × 10231.31 × 10231.76 × 10231.84 × 10232.73 × 10232.94 × 10233.14 × 10233.16 × 1023
Regional imported flow
1. Domestic energy input (standard coal)2.70 × 10228.31 × 10225.38 × 10228.20 × 10227.07 × 10221.40 × 10231.09 × 10237.37 × 1022
2. International goods, funding, and service input5.83 × 10225.46 × 10224.70 × 10225.02 × 10225.21 × 10226.36 × 10226.94 × 10226.83 × 1022
Regional exported flow
1. Domestic energy output (standard coal)6.43 × 10236.10 × 10235.94 × 10235.27 × 10235.05 × 10236.55 × 10236.44 × 10237.14 × 1023
2. International goods, funding, and service output5.98 × 10226.69 × 10226.30 × 10227.43 × 10227.63 × 10229.20 × 10228.75 × 10229.50 × 1022

References

  1. BP Statistical Yearbook of World Energy. Available online: https://www.ourenergypolicy.org/resources/ (accessed on 1 November 2022).
  2. China Mineral Resources Report 2022. Available online: https://www.mnr.gov.cn/sj/sjfw/kc_19263/zgkczybg/202209/t20220921_2759600.html (accessed on 1 November 2022).
  3. Scherer, L.; Behrens, P.; de Koning, A.; Heijungs, R.; Sprecher, B.; Tukker, A. Trade-offs between social and the environmental sustainable development goals. Environ. Sci. Policy 2018, 90, 65–72. [Google Scholar] [CrossRef]
  4. Nan, D. Seize the opportunity and meet the challenge to push China’s sustainable development strategy to a new stage. Chin. J. Popul. Resour. Environ. 2004, 3, 3–6. [Google Scholar] [CrossRef]
  5. Shanxi Province 2021 National Economic and Social Development Statistical Bulletin. Available online: http://tjj.shanxi.gov.cn/tjsj/tjgb/202203/t20220318_5450337.shtml (accessed on 1 July 2022).
  6. Wang, Y.; Guo, D.; Zhang, H.; Shen, B. Spatial distribution and applications of coal resource potential in China. J. Nat. Resour. 2006, 21, 225–230. [Google Scholar]
  7. Shanxi Statistical Yearbook (2013–2020). Available online: http://tjj.shanxi.gov.cn/tjsj/ (accessed on 25 March 2022).
  8. China Statistical Yearbook. Available online: http://www.stats.gov.cn/tjsj/ndsj/ (accessed on 25 March 2022).
  9. The State Council on the Issuance of National Resource-Based Cities Notice of the Sustainable Development Plan (2013–2020). Available online: http://www.gov.cn/jrzg/2013-12/03/content_2540561.htm (accessed on 18 August 2022).
  10. Liang, S.; Zhang, T. Urban metabolism in China achieving dematerialization and decarbonization in Suzhou. J. Ind. Ecol. 2011, 15, 420–434. [Google Scholar] [CrossRef]
  11. Ascione, M.; Campanella, L.; Cherubini, F.; Ulgiati. Environmental driving forces of urban growth and development: An emergy-based assessment of the city of Rome, Italy. Landsc. Urban Plan. 2009, 93, 238–249. [Google Scholar] [CrossRef]
  12. Yanitsky, O.N. Sustainability and risk: The case of Russia. Innov. Eur. J. Soc. Sci. Res. 2000, 13, 265–277. [Google Scholar] [CrossRef]
  13. Hassanzadehkermanshahi, K.; Shirowzhan, S. Measuring urban sustainability over time at national and regional scale for addressing united nations sustainable development goal (SDG) 11: Iran and Tehran as case studies. Sustainability 2022, 14, 7402. [Google Scholar] [CrossRef]
  14. Mohamadzadeh, P.; Pourmoradian, S.; Feizizadeh, B.; Sharifi, A.; Vogdrup-Schmidt, M. A gis-based approach for spatially-explicit sustainable development assessments in east Azerbaijan province, Iran. Sustainability 2020, 12, 10413. [Google Scholar] [CrossRef]
  15. Ding, L.; Shao, Z.; Zhang, H.; Xu, C.; Wu, D. A comprehensive evaluation of urban sustainable development in China based on the TOPSIS-entropy method. Sustainability 2016, 8, 746. [Google Scholar] [CrossRef] [Green Version]
  16. Jing, Z.; Wang, J. Sustainable development evaluation of the society–economy–environment in a resource-based city of China: A complex network approach. J. Clean. Prod. 2020, 263, 121510. [Google Scholar] [CrossRef]
  17. Li, L.; Lei, Y.; Pan, D.; Si, C. Research on sustainable development of resource-based cities based on the DEA approach: A case study of Jiaozuo, China. Math. Probl. Eng. 2016, 2016, 5024837. [Google Scholar] [CrossRef]
  18. Pan, Y.; Zhang, B.; Wu, Y.; Tian, Y. Sustainability assessment of urban ecological-economic systems based on emergy analysis: A case study in Simao, China. Ecol. Indic. 2021, 121, 107157. [Google Scholar] [CrossRef]
  19. Wei, Y.; Li, Y.; Liu, X.; Wu, M. Sustainable development and green gross domestic product assessments in megacities based on the emergy analysis method—A case study of Wuhan. Sustain. Dev. 2020, 28, 294–307. [Google Scholar] [CrossRef]
  20. Amiri, Z.; Asgharipour, M.R.; Campbell, D.E.; Armin, M. A sustainability analysis of two rapeseed farming ecosystems in Khorramabad, Iran, based on emergy and economic analyses. J. Clean. Prod. 2019, 226, 1051–1066. [Google Scholar] [CrossRef] [PubMed]
  21. Zhang, X.; Deng, S.; Wu, J.; Jiang, W. A sustainability analysis of a municipal sewage treatment ecosystem based on emergy. Ecol. Eng. 2010, 36, 685–696. [Google Scholar] [CrossRef]
  22. Brown, M.; Ulgiati. Energy-based indices and ratios to evaluate sustainability: Monitoring economies and technologytoward environmentally sound innovation. Ecol. Eng. 1997, 9, 51–70. [Google Scholar] [CrossRef]
  23. Hongfang, L.; Zheng, Y.; Xinfeng, Z.; Shaolin, P. A new emergy index for urban sustainable development. Acta Ecol. Sin. 2003, 23, 1363–1368. [Google Scholar]
  24. Liu, B.; Wang, J.; Jing, Z.; Tang, Q. Measurement of sustainable transformation capability of resource-based cities based on fuzzy membership function: A case study of Shanxi province, China. Resour. Policy 2020, 68, 101739. [Google Scholar] [CrossRef]
  25. Cao, X. Challenges and potential improvements in the policy and regulatory framework for sustainable tourism planning in China: The case of Shanxi province. J. Sustain. Tour. 2015, 23, 455–476. [Google Scholar] [CrossRef]
  26. Cui, H.; Wu, R.; Zhao, T. Sustainable development study on an energy-economic-environment system based on a vector autoregression model in Shanxi, China. Pol. J. Environ. Stud. 2019, 28, 1623. [Google Scholar] [CrossRef]
  27. Hong, G.; Kai, Z.; Hanwen, Z. Research on sustainable development of resource-based small industrial and mining cities—A case study of Yangquanqu town, Xiaoyi, Shanxi province, China. Procedia Eng. 2011, 21, 633–640. [Google Scholar] [CrossRef] [Green Version]
  28. Wang, R.-P.; Rong, X.-M. Emergy analysis of agro-ecolomic system in Shanxi province. Yingyong Shengtai Xuebao 2008, 19, 2259–2264. [Google Scholar]
  29. Guo, X.; Dong, S.; Wang, G.; Lu, C. Emergy-based urban ecosystem health evaluation for a typical resource-basedcity: A case study of Taiyuan, China. Appl. Ecol. Environ. Res. 2019, 17, 15131–15149. [Google Scholar] [CrossRef]
  30. Liu, X.; Guo, P.; Nie, L. Applying emergy and decoupling analysis to assess the sustainability of Chinas coal miningarea. J. Clean. Prod. 2020, 243, 118577. [Google Scholar] [CrossRef]
  31. Into the Shanxi Province. Available online: http://www.shanxi.gov.cn/zjsx/ (accessed on 19 August 2022).
  32. The Natural Environment. Available online: http://www.Shanxi.gov.cn/zjsx/zlssx/zrdl/202007/t20200724_6045042.shtml (accessed on 20 August 2022).
  33. The General Picture of Province. Available online: http://www.Shanxi.gov.cn/zjsx/zlssx/sqgk/202007/t20200724_6045048.shtml (accessed on 20 August 2022).
  34. Shanxi Provincial Water Resources Bulletin. Available online: http://slt.Shanxi.gov.cn/zncs/szyc/szygb/ (accessed on 19 August 2022).
  35. The GDP of Shanxi Province Increased by 9.1% and Crossed the 2 Trillion Yuan Mark. Available online: http://sx.people.com.cn/n2/2022/0120/c189132-35103957.html (accessed on 20 August 2022).
  36. Odum, H.T. Energy Environment and Economy—Guidance for Systems Analysis; Oriental Publishing House: Beijing, China, 1992; pp. 154–196. [Google Scholar]
  37. Odum, H.T. Self-organization, transformity, and information. Science 1988, 242, 1132–1139. [Google Scholar] [CrossRef] [PubMed] [Green Version]
  38. Lan, S.; Qin, P.; Lu, H. Emergy Analysis of Eco-Economic System; Environmental Science and Engineering Press of Chemical Industry Press: Beijing, China, 2002; pp. 75–76. [Google Scholar]
  39. Sui, C.; Lu, H.; Zheng, F. Integrative study of Guangdong ecological-economic system based on emergy analysis. YingYong Sheng Tai Xue Bao = J. Appl. Ecol. 2006, 17, 2147–2152. [Google Scholar]
  40. Li, S.; Li, X.; Zheng, D. Emergy analysis of evaluating sustainable Chinese economy. J. Nat. Resour. 2001, 4, 297–304. [Google Scholar]
  41. Ulgiati, S.; Brown, M.T. Monitoring patterns of sustainability in natural and man-made ecosystems. Ecol. Model. 1998, 108, 23–36. [Google Scholar] [CrossRef]
  42. Lu, H.; Lan, S.; Peng, S. Extending study on energy indices for sustainable development. Environ. Sci. 2003, 24, 150–154. [Google Scholar]
  43. Surface Meteorological Data/Upper Air Meteorological Data. Available online: http://www.nmic.cn/ (accessed on 21 August 2022).
  44. Shanxi Provincial Government Work Report (2013–2020). Available online: http://www.shanxi.gov.cn/szf/zfgzbg/szfgzbg/ (accessed on 28 August 2022).
  45. The Report of Shanxi Provincial Department of Ecology and Environmental Protection (2013–2020). Available online: http://sthjt.shanxi.gov.cn/zfxxgk/xxgknb/ (accessed on 5 September 2022).
  46. Ulgiati, S.; Odum, H.T.; Bastianoni, S. Emergy use, environmental loading and sustainability an emergy analysis of Italy. Ecol. Model. 1994, 73, 215–268. [Google Scholar] [CrossRef]
  47. Office Shanxi Provincial Agenda 21 Leading Group. Shanxi 21st Century Agenda; Shanxi People’s Publishing House: Taiyuan, China, 1999. [Google Scholar]
  48. Shanxi Industry Sets Foot on a New Journey of High Quality Development: Shanxi Economy in the 70 Years Since the Founding of New China-Third Report in the Series on Achievements in Social Development. Available online: http://tjj.yq.gov.cn/jjck/201911/t20191111_941690.html (accessed on 1 September 2022).
  49. Do Our Best to Ensure Energy Supply! Shanxi Has Supplied 21.87 Million Tons of Thermal Coal to 14 Provinces Autonomous Regions and Municipalities. Available online: http://www.shanxi.gov.cn/yw/sxyw/202111/t20211123_945401.shtml (accessed on 11 September 2022).
  50. Odum, H.T.; Brown, M.; Brandt-Williams, S. Handbook of Emergy Evaluation; Center for Environmental Policy: Gainesville, FL, USA, 2000. [Google Scholar]
  51. Qi, W.; Deng, X.; Chu, X.; Zhao, C.; Zhang, F. Emergy analysis on urban metabolism by counties in Beijing. Phys. Chem. Earth Parts A/B/C 2017, 101, 157–165. [Google Scholar] [CrossRef]
  52. Shanxi’s New Plan: Equipment Manufacturing Industry Revenue to Reach 450 Billion Yuan in 2025. Available online: http://www.gov.cn/xinwen/2021-06/18/content_5618946.htm (accessed on 3 September 2022).
  53. Zhou, J. Shanxi new energy industry development status analysis. Brand 2015, 9, 27–28. [Google Scholar]
  54. Shanxi "14th Five-Year” 14 Strategic Emerging Industries Issued Regulations. Available online: http://www.mof.gov.cn/zhengwuxinxi/xinwenlianbo/shanxicaizhengxinxilianbo/202106/t20210624_3724430.htm (accessed on 22 September 2022).
  55. Odum, H.T. Environmental accounting: Emergy and environmental decision making. Choice Rev. Online 1996, 34. [Google Scholar] [CrossRef]
  56. Yang, Q.; Chen, G.; Liao, S.; Zhao, Y.; Peng, H.; Chen, H. Environmental sustainability of wind power: An emergy analysis of a Chinese wind farm. Renew. Sustain. Energy Rev. 2013, 25, 229–239. [Google Scholar] [CrossRef]
  57. Li, J.; Chen, F.; Wang, Z. Urban environmental economic emergy synthesis and sustainability analysis. Acta Ecol. Sin. 2006, 2, 439–448. [Google Scholar]
  58. Wang, C.; Zhang, Y.; Liu, C.; Hu, F.; Zhou, S.; Zhu, J. Emergy-based assessment and suggestions for sustainable development of regional ecological economy: A case study of Anhui province, China. Sustainability 2021, 13, 2988. [Google Scholar] [CrossRef]
  59. Brown, M.T.; Ulgiati, S. Emergy evaluations and environmental loading of electricity production systems. J. Clean. Prod. 2002, 10, 321–334. [Google Scholar] [CrossRef]
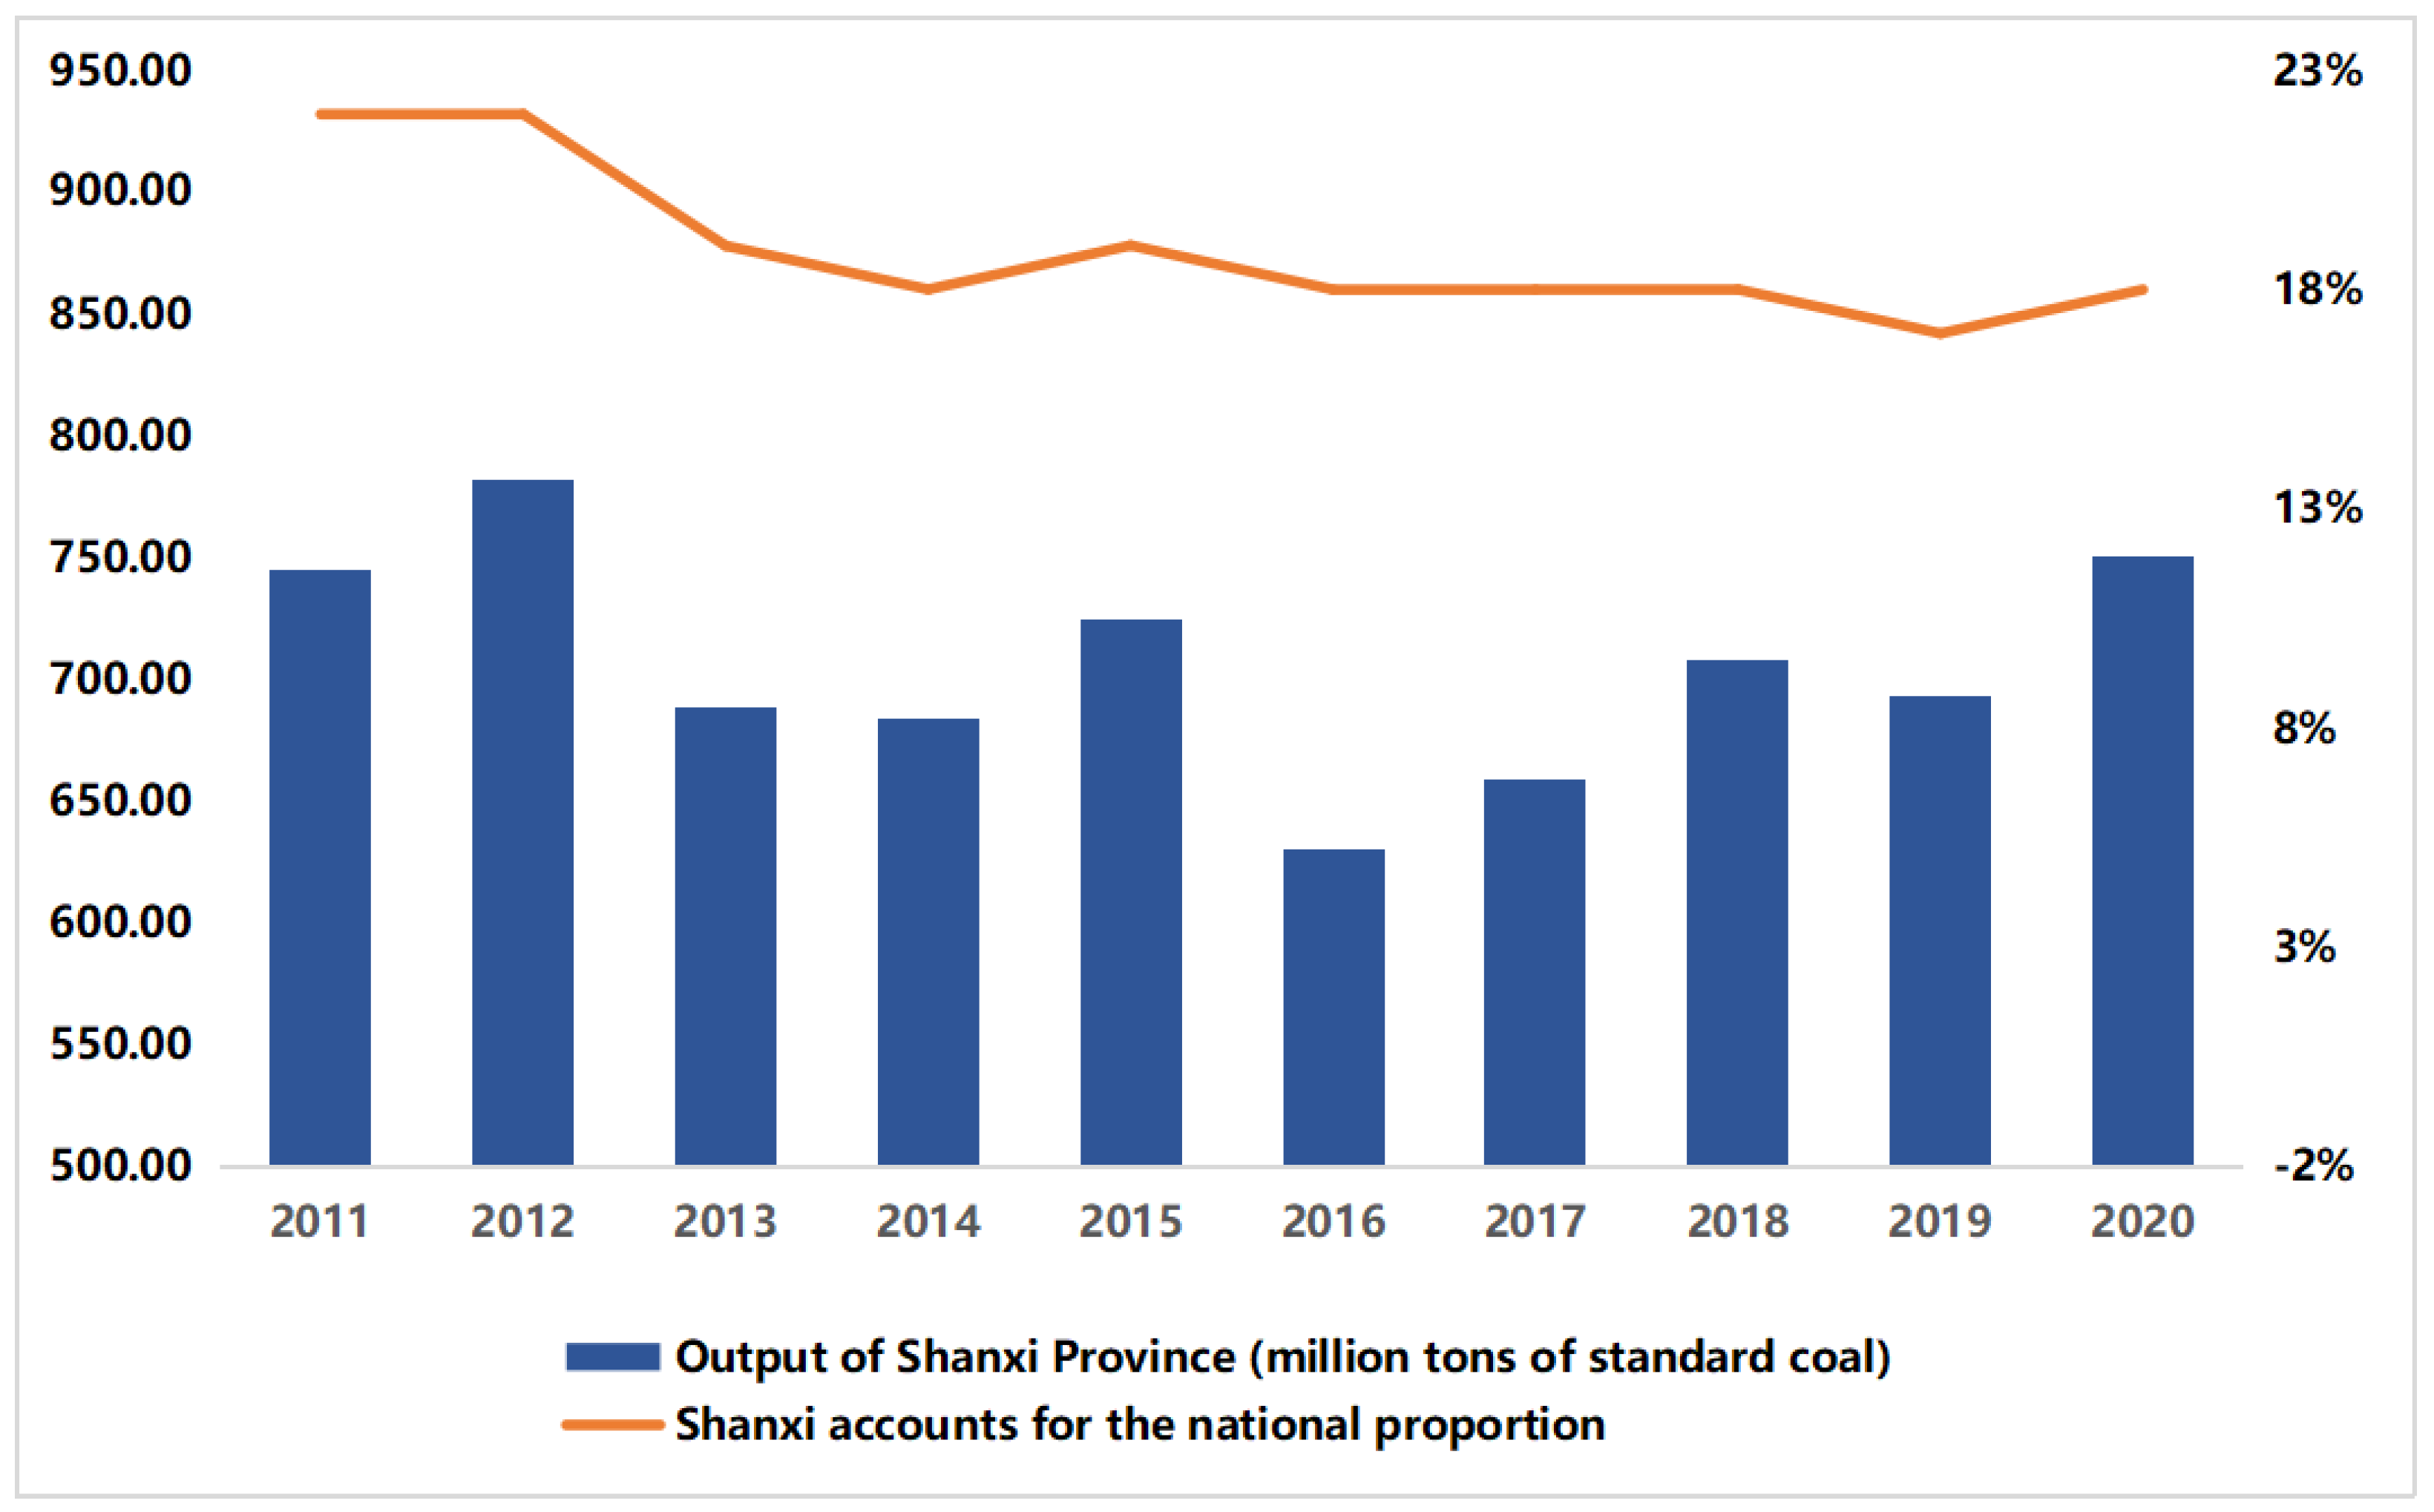
Figure 1. The primary energy production of Shanxi in recent years and its proportion of China’s total.
Sustainability 14 15706 g001
Figure 2. Location of Shanxi Province, China.
Sustainability 14 15706 g002
Figure 3. Energy flowchart of Shanxi’s eco-economic system.
Sustainability 14 15706 g003
Figure 4. Trend chart of basic emergy in Shanxi Province from 2013 to 2020.
Sustainability 14 15706 g004
Figure 5. Trend chart of input and output emergy values in Shanxi Province from 2013 to 2020.
Sustainability 14 15706 g005
Figure 6. Actual population and population carrying capacity in Shanxi from 2013 to 2020.
Sustainability 14 15706 g006
Figure 7. Emergy density and per capita emergy usage in Shanxi Province, 2013–2020.
Sustainability 14 15706 g007
Figure 8. Trend chart of emergy self-sufficiency rate and input emergy quantity in Shanxi Province from 2013 to 2020.
Sustainability 14 15706 g008
Figure 9. Emergy yield rate and emergy exchange rate in Shanxi from 2013 to 2020.
Sustainability 14 15706 g009
Figure 10. Emergy money ratio and emergy investment rate in Shanxi from 2013 to 2020.
Sustainability 14 15706 g010
Figure 11. The emergy ratio of domestic electricity consumption and the fee electric emergy value ratio in Shanxi Province in recent years.
Sustainability 14 15706 g011
Figure 12. Trend chart of non-renewable resource emergy value and environmental load rate in Shanxi Province from 2013 to 2020.
Sustainability 14 15706 g012
Figure 13. Trend chart of waste emergy and waste emergy ratio in Shanxi Province from 2013 to 2020.
Sustainability 14 15706 g013
Figure 14. Trend of ESI and EISD values in Shanxi Province from 2013 to 2020.
Sustainability 14 15706 g014
Table 1. Emergy evaluation system of the eco-economic system in Shanxi Province.
Emergy IndexFormulaExplanation
Basic emergy quantity
1. Renewable resource emergy (R)R = R1 + R2 + SFoundation of wealth of the system
2. Nonrenewable resource emergy (N)N = N1 + N2
3. Input emergy (I)IInput resources, commodity wealth
4. Output emergy (O)OExport resources, commodity wealth
5. Total emergy (U)U = R + N + ITotal wealth of the system
Social subsystem evaluation index
6. Actual population (P)PCurrent local population
7. Population carrying capacity (PCC)PCC = 8 × (R/U) × PThe number of people that can be supported by renewable resources and input resources under current living standards
8. Energy density (ED)Ed = U/areaEmergy intensity
9. Emergy per person (EPP)EPP = U/PA sign of regional living standards and quality
Economic subsystem evaluation index
10. GDP
11. Emergy self-sufficiency ratio (ESR)ESR = (R + N)/UDegree of external communication and economic self-sufficiency of a region
12. Emergy yield rate (EYR)EYR = (U/I)Quality of industrial benefits
13. Emergy exchange rate (EER)EER = I/OGains and losses of external exchanges
14. Emergy investment rate (EIR)EIR = I/(R + N)Degree of economic development and environmental load
15. Emergy monetary ratio (EMR)EMR = U/GDPDevelopment degree of the regional economy
16. Social energy value of electricity (SEE)SEE = SE/UModern level of residents’ life
17. Energy-to-use ratio of electricity (FEE)FEE = E/ULevel of industrialization
Environmental subsystem evaluation index
18. Environmental load ratio (ELR)ELR = (N+I)/REnvironmental carrying capacity of the system
19. Emergy of waste (W)WAmount of waste
20. Emergy waste ratio (EWR)EWR = W/UWaste pressure on the natural environment
Sustainable development evaluation index
21. Sustainable development index (ESI)ESI = EYR/ELRSustainable development evaluation based on emergy
22. Evaluation system sustainable
development indicators (EISD)
ESID = EYR × EER/ELRSustainability and natural environmental pressure as a function of economic benefits and environmental pressure
Table 2. Emergy values of the eco-economic system in Shanxi Province from 2013 to 2020.
Emergy Index20132014201520162017201820192020
Basic emergy quantity
1. Renewable resource emergy (R) (sej/a)1.08 × 10231.11 × 10231.15 × 10231.14 × 10231.17 × 10231.17 × 10231.16 × 10231.28 × 1023
2. Nonrenewable resource emergy (N) (sej/a)1.25 × 10241.24 × 10241.20 × 10241.08 × 10241.16 × 10241.26 × 10241.36 × 10241.44 × 1024
3. Input emergy (I) (sej/a)8.53 × 10221.38 × 10231.01 × 10231.32 × 10231.23 × 10232.04 × 10231.78 × 10231.42 × 1023
4. Output emergy (O) (sej/a)7.03 × 10236.76 × 10236.57 × 10236.03 × 10235.82 × 10237.47 × 10237.31 × 10238.09 × 1023
5. Total emergy (U) (sej/a)1.44 × 10241.49 × 10241.42 × 10241.33 × 10241.40 × 10241.58 × 10241.65 × 10241.71 × 1024
Social subsystem evaluation index
6. Actual population (P) (persons)3.53 × 1073.53 × 1073.52 × 1073.51 × 1073.51 × 1073.50 × 1073.50 × 1073.49 × 107
7. Population carrying capacity (PCC) (persons)2.11 × 1072.11 × 1072.29 × 1072.41 × 1072.35 × 1072.07 × 1071.96 × 1072.09 × 107
8. Energy density (ED) (sej/a∙m2)9.24 × 10129.53 × 10129.07 × 10128.49 × 10128.96 × 10121.01 × 10131.06 × 10131.09 × 1013
9.Emergy per person
(EPP) (sej/a·person)
4.09 × 10164.22 × 10164.02 × 10163.78 × 10163.99 × 10164.52 × 10164.73 × 10164.90 × 1016
Economic subsystem evaluation index
10. GDP (USD)1.99 × 10112.02 × 10112.03 × 10112.05 × 10112.44 × 10112.65 × 10112.68 × 10112.79 × 1011
11. Emergy self-sufficiency ratio (ESR)9.41 × 10−19.07 × 10−19.29 × 10−19.00 × 10−19.12 × 10−18.71 × 10−18.92 × 10−19.17 × 10−1
12. Emergy yield rate (EYR)1.69 × 1011.08 × 1011.40 × 1011.00 × 1011.14 × 1017.759.291.20 × 101
13. Emergy exchange rate (EER)1.21 × 10−12.04 × 10−11.54 × 10−12.19 × 10−12.11 × 10−12.73 × 10−12.44 × 10−11.76 × 10−1
14. Emergy investment rate (EIR)6.28 × 10−21.02 × 10−17.68 × 10−21.11 × 10−19.63 × 10−21.48 × 10−11.21 × 10−19.06 × 10−2
15. Emergy monetary ratio (EMR) (sej/a·USD)1.81 × 10111.83 × 10111.75 × 10111.61 × 10111.42 × 10111.43 × 10111.53 × 10111.52 × 1011
16. Social emergy value of electricity (sej/a)9.88 × 10229.83 × 10229.34 × 10229.67 × 10221.07 × 10231.17 × 10231.22 × 10231.26 × 1023
17. Emergy-to-use ratio of electricity (FEE)6.85 × 10−26.60 × 10−26.60 × 10−27.29 × 10−27.68 × 10−27.38 × 10−27.38 × 10−27.39 × 10−2
Environmental subsystem evaluation index
18. Environmental load ratio (ELR)1.792.241.882.162.052.742.532.11
19. Emergy of waste (W) (sej/a)1.61 × 10231.58 × 10231.95 × 10231.95 × 10232.80 × 10233.01 × 10233.46 × 10233.23 × 1023
20. Emergy waste ratio (EWR)1.12 × 10−11.06 × 10−11.38 × 10−11.47 × 10−12.00 × 10−11.90 × 10−12.09 × 10−11.89 × 10−1
Sustainable development evaluation index
21. Sustainable
development index (ESI)
9.454.817.464.665.552.823.675.71
22. Evaluation system sustainable development indicators (EISD)1.159.82 × 10−11.151.021.177.71 × 10−18.93 × 10−11.00
Publisher’s Note: MDPI stays neutral with regard to jurisdictional claims in published maps and institutional affiliations.