Article

Spatiotemporal Land-Use Dynamics in Continental Portugal 1995–2018

1
Directorate-General for Territory, 1099-052 Lisbon, Portugal
2
Centre of Geographical Studies, Institute of Geography and Spatial Planning, University of Lisbon, 1600-276 Lisbon, Portugal
3
Associate Laboratory TERRA, 1349-017 Lisbon, Portugal
4
NOVA Information Management School (NOVA IMS), University NOVA of Lisbon, 1070-312 Lisbon, Portugal
*
Author to whom correspondence should be addressed.
Sustainability 2022, 14(23), 15540; https://doi.org/10.3390/su142315540
Submission received: 5 September 2022 / Revised: 8 November 2022 / Accepted: 17 November 2022 / Published: 22 November 2022

Abstract

:
Monitoring land-use patterns and its trends provides useful information for impact evaluation and policy design. The latest in-depth studies of land-use dynamics for continental Portugal are outdated, and have not examined how municipalities may be classified into a typology of observed dynamics or considered the trajectory profiles of land-use transitions. This paper presents a comprehensive analysis of the spatiotemporal dynamics of land-use in continental Portugal from 1995 to 2018. Our multi-scalar approach used land-use maps in geographic information systems with the following objectives: (i) quantify variations of land-use classes, (ii) assess the transitions between uses, and (iii) derive a municipal typology of land-use dynamics. The methodology employed involved calculating statistical indicators of land-use classes, transition matrices between uses and combinatorial analysis for the most common trajectory-profiles. For the typology, a principal component analysis was used for dimensionality reduction and the respective components were classified by testing several clustering techniques. Results showed that the land-use transitions were not homogeneous in space or time, leading to the growth of territorial asymmetries. Forest (Δ5%), water bodies (Δ28%) and artificial surfaces (Δ35%) had a greater expansion, as opposed to agricultural areas, which had the biggest decline (Δ-8%). Despite the decline of agricultural activities, olive-grove expansion (Δ7%) was a relevant dynamic, and in the case of forests, the increment of eucalyptus (Δ34%) replaced native species such as the maritime pine (Δ-20%). A land-use-dynamics typology was estimated, dividing continental Portugal into 11 clusters, which is informative for sectoral policies and spatial planning, as zonings in need of interventions tailored to their specificities. The findings are a contribution to the study of land-use dynamics in continental Portugal, presenting various challenges for sustainable land uses with regard to the urban system, forest management, food production, soil preservation, and ecosystem protection.

1. Introduction

Understanding landscape transformations over time is important for public policies. Under this premise, and with the growing awareness of the human-induced systemic effects on the planet, monitoring land-use dynamics (LUD), including their causes and impacts, is a relevant field of study. Conceptually, LUD is associated with several terms. The conventional land-use and land-cover change (LULCC) has been used for decades as the conversion from a land-use class (LUC) to another and/or changes within the class [1]. More recently, the term land-use transition (LUT) has had a greater citation burst in studies of LUD [2], being understood as any change in land-use systems from one state to another and in its dominant and recessive morphology, in the structural sense of LUD and its impacts [3]. In addition, the term change trajectories has also grown in use, associated with determining the sequence of transitions in longer time-series [4]. Regardless of the conceptual approach, the use of a parcel of land is linked to local and global environmental issues, making the knowledge of current and past trends of paramount importance. LUT by human intervention, mainly driven by economic conditions [5,6], have impacts in several domains [7] and is one of the main threats to the planet’s sustainability [8]. Around 75% of Earth’s land use environment has already been subject to human intervention [9] and since 1960 ‘almost a third’ of the world’s surface has changed, annually summing up to 720,000 km2, two times the size of Germany [10]. The transgression of anthropogenic influence beyond natural boundaries puts the world’s sustainable development at risk, jeopardizing the achievement of the Sustainable Development Goals (SDGs). SDGs are the only integrated framework for economic, social and environmental development adopted by all the United Nations (UN) Member States and are intrinsically related to land use through international strategies and guidelines. For example, the New Urban Agenda, the European Green Deal, the Paris Climate Agreement or the Global Biodiversity Strategy. However, compliance with the SDGs in land use management is not a reality in most parts of the world [11,12].
Sustainable land use management is complex [13] and recent LUD at a global scale had a fast and intense pace that increased consumption of land, energy, water, and fertilizers, among other elements with impacts on the planet’s biosphere [14]. Thus, planning schemes need to contribute to sustainable changes and policy guidance should be based on a diagnosis of dynamics monitored over time. As examples of how LUD is informative for planning guidance Liang et al. [15] developed a research framework that reflects that the analysis of both land use patterns and land use function are of significance for landscape multifunctionality. Asadolahi et al. [16] dynamically analysed the trade-offs between ecosystem services under various scenarios of land use planning strategies relevant to assist planners and policymakers. Previously Long et al. [17] stated that the formulation of land management policies cannot ignore the mutual feedback between LUT and land management in terms of socio-economic and environmental paths. For that, a comprehensive in-depth analysis of the spatiotemporal dynamics of land use allows delineating strategies adjusted according to both the past, current and expected land use patterns.
As a spatiotemporal phenomenon, LUTs have different geographies, depending on the region and scale of analysis. For example, on a global scale, agricultural production and growing urbanization are the main drivers of deforestation [8,18], but in Europe, forests are relatively stable and strong urbanization is causing a reduction in agriculture, while at the same time agricultural intensification of some species is a growing reality [19]. Because of recent LUD with complex geographies and disparate impacts, further studies on various scales are justified, to understand variations in frequency, magnitude and irreversibility [4]. The common spatial resolution of LUD studies ranges from world regions/multiple countries [10,20,21], national or similar [22,23,24], to sub-national or regional [25,26,27]. A study on LUD is not usually an end in itself, and in addition to monitoring changes it is common to diagnose associated impacts. These have been studied from multiple perspectives such as ecosystem services [7,28], soil erosion [29,30], climate change [31,32], food security [33,34], wildfire risk [35,36], and others [14,37,38]. More policy guidance-oriented studies tend to summarize key changes in land-use patterns and their geographies in clusters with similar transitions. These types of analyses [21,39,40,41,42,43,44], reflecting the latest trends in the context of land-use (un)sustainability, are informative policy-management instruments, identifying zonings for land management tailored to specificities.
In the latest decades, Portugal has undergone major LUD. Recent intense urbanization has caused landscape reconfigurations with impacts on other land uses. Although several studies analysed LUD, there is a gap in the literature for a comprehensive study synthesizing the main dynamics of the last decades. As examples of previous studies for continental Portugal, we highlight [45], based on land-use samples, [46] and [47] with Carta de Uso e Ocupação do Solo (COS), which is the Portuguese Land Use and Land Cover map, and [48,49] with CORINE Land Cover. Although these studies summarized the main LUD in continental Portugal, they were exclusively based on administrative units and did not explore the changes at higher resolutions. Despite more recent specific analyses of regional/local scope [26,50], the last in-depth study for continental Portugal was with the COS series 1995–2010 [46] and the CORINE series 1990–2012 [49]. Thus, there is a gap for monitoring from more recently produced land-use maps and examining the most common trajectories at cell resolution. In addition, there is a lack of typology based on an extensive analysis of LUD. Some studies developed typologies at the municipal or parish scale for continental Portugal, associated with development dynamics [51], urban expansion and urban form [52], forest-transition paths [53] and types of peri-urbanization in agricultural areas [54]. However, these either considered specific dynamics or were not based on land-use maps or were not country-wide. Thus, the present study will respond to the main gaps by deriving trajectory profiles and a typology based on dynamics for continental Portugal.
LULC maps are the most important data sources for assessing land-use patterns, since they provide an overview of the Earth’s surface and its evolution over time [55]. Our approach uses COS [56], polygon-based cartography with a 1-hectare mapping unit, to perform a multiscale analysis. The methodological execution was centred on spatial-analysis techniques in geographic information systems (GIS), and the study objectives were:
(i)
Analyse multi-scalar variations and trends of the main LUCs in continental Portugal, from 1995 to 2018;
(ii)
Assess and quantify the most relevant spatiotemporal patterns of LUT with cross-tabulation matrices;
(iii)
Classify municipalities by their LUD, with cluster analysis.
As a comprehensive study of LUD, this paper quantifies territorial dynamics and discusses the trends of the 23-year period, in line with dynamics in other countries, considering strategic guidelines and policy goals and presenting potential implications of the most relevant transitions. This work extends the set of studies on LUD at a national level, and the methodological approach tested with innovative specificities can be transposed to other contexts.

2. Study Area

Continental Portugal is located on the southwestern edge of the European continent, with 89,100 km2 and a diverse set of landscapes (Figure 1). As a relatively small country, with both Mediterranean and Atlantic influences, it has high landscape-heterogeneity and a bipolarized urban system. Geomorphological characteristics can be divided into multiple regional relief-units [57]. In general, the orography is more rugged in the north, with deep river valleys and several mountain ranges exceeding 1000 m, while the south and coastal areas are flatter (Figure S1). Regional climatic asymmetries follow the delineation of the geomorphological units [58] and, according to Koppen’s classification [59], the study area can be divided into two main regions (Figure S1): one with a temperate climate with dry and hot summers (Csa), and another with a temperate climate with dry and mild summers (Csb). Therefore, both Mediterranean and Atlantic climatic characteristics dominate the country, with a significant portion having a typical Mediterranean landscape, in which most of the vegetation dries out in the summer. The territorial-settlement model cannot be dissociated from these physical conditions. The population distribution is asymmetric (Figure S1), with more than 40% of the population concentrated in two metropolitan areas: Lisbon, with 2.8 million inhabitants, and Oporto, with 1.7 million [60]. A recent (after 1960) and intense rural exodus caused important internal-migration flows that intensified the strong urbanization contrast between the coast and the inland country [61].
In terms of economic activities that directly affect land use, according to the 2011 census results [62], the manufacturing industry (which includes certain phases of livestock and agricultural-product transformation, as well as the pulp and wood industries) was the second sector, with the most people employed in Portugal. Construction was the seventh, and agriculture, livestock, hunting, forestry and fishing the sixteenth. In terms of wealth creation, construction was one of the most relevant industries for the gross value added in 2018, a figure higher than the sum of agriculture and the wood industry.
The diversity of the physical environment and the human occupation of the territory are responsible for differentiated land-use patterns and dynamics, making continental Portugal an interesting case study. In addition, considering that in Portugal there is a growing need for evidence-informed policy-making [63], our results may present synthesized information for public policies.

3. Data and Methods

3.1. Land-Use Data

The analysis performed in this study was based on COS [56]—the authoritative LULC map for continental Portugal—for the years 1995, 2007, and 2018. We selected the 9 classes at the highest level of aggregation, and 3 at a more detailed level (Table 1) of the hierarchical nomenclature.
The selection of these 3 specific classes was based on the proportion of occupied area and for being in the top 5 classes with the largest changed-area in the years under analysis, with the importance of their dynamics already having been mentioned in previous studies [53,64,65]. Of the other two classes in the top 5, one of them was indirectly included, which is the case of the shrubland, whose class at level 1 is the same as at level 4, and the remaining class corresponds to the improved pastures which were mentioned in the section of agricultural dynamics.

3.2. COS Production and Specifications

In Portugal COS is the LULC cartography with the longest time-series and highest thematic resolution. It is produced and published by the Directorate-General for Territory (DGT). The COS series, with five reference dates (1995, 2007, 2010, 2015 and 2018), is freely available through an open-data policy, following the INSPIRE Directive (European Union Directive Infrastructure for Spatial Information in Europe). As the authoritative LULC map of continental Portugal, it is used by national and international organizations, such as Eurostat, for statistics production.
The current hierarchical nomenclature has four levels and a total of 83 classes (Table S1), with direct correspondence to previous nomenclatures. Mapping procedures are manual, from a visual interpretation of orthorectified digital aerial-images with a spatial resolution of 50 cm, apart from COS2018, which is based on 25 cm orthophotos. The production methodology is based on the detection and interpretation of changes, through a comparison of previous and recent orthophotos. The new map represents detected changes and preserves areas of no change. As a result, COS has a minimum mapping unit (MMU) of 1 ha, a minimum mapping width (MMW) of 20 m, and an overall thematic accuracy higher than 85%.
From 2015 onwards, COS production included automatic methods of remote sensing with Landsat and Sentinel-2 data, to reduce production time and increase detail and accuracy. COS is part of SMOS (Sistema de Monitorização de Ocupação do Solo), the continental Portugal Land Cover Monitoring System, along with its simplified version (COSsim) of land-cover maps from Sentinel-2 image classification [66].

3.3. Methods

The workflow relied on spatial analysis using GIS. Conceptually, we assumed that a LUT occurred with a change between level 1 classes (e.g., agricultural areas to forest land), and when inside the same level 1 class there was a species change (e.g., pine forests to eucalyptus forests). The analysis was structured in three vectors: (i) variations and trends, where LUD was assessed for continental Portugal, the level II of Nomenclature of Territorial Units for Statistics (NUTS II regions) and municipalities; (ii) transitions and trajectories, highlighting LUT in terms of the gains and losses among LUC and trajectory profiles at 1-hectare cell units; (iii) the municipal typology of LUD from 1995 to 2018 resulting from a cluster analysis.
The variation of LUC among years in area proportion was estimated based on the following equation:
V i = l u c a   t 2     l u c a   t 1 i a 100
where V i is the variation in territorial unit i , l u c a is an LUC area, t2 is the last year, t1 is the first year, and i a is the total unit area.
The rate of change ( V r i )   considering the previously existing area is given by:
V r i = l u c a   t 2     l u c a   t 1 l u c a t 1 100
For assessing the annual rate between different periods, the result was divided by the number of years.
The modified contingency coefficient (MCC), a measure of association between two qualitative variables, was also calculated for NUTS II regions as:
C * = x 2 x 2 + N   k k 1  
where x 2 is Pearson’s chi-squared, N is the total number of observations and k is the smallest number between rows and columns in the contingency table.
Transition matrices were computed using cross-tabulation tables for two different years of intersecting LUC areas.
T m t 1 t 2 = [ 1 2 3 4 5 6 7 8 9 1 A 11 A 12 . . . . . . A 19 2 . . . . . . . . . 3 . . . . . . . . . 4 . . . . . . . . . 5 . . . . . . . . . 6 . . . . . . . . . 7 . . . . . . . . . 8 . . . . . . . . . 9 A 91 A 92 . . . . . . A 99 ]
T m is the transition matrix, t1 is the first year, t2 is the second year, number 1–9 is LUC at level 1, and A t 1 t 2 is the area transitioned for each pair. The diagonal of the matrix represents the no-change area and the remaining entries are overall changes described in terms of per-class losses (lines) and gains (columns) from t1 to t2.
Cell-trajectory profiles (1995–2007–2018) were obtained by combinatorial analysis. Land-use matrices at level 1 classes were intersected to obtain the possible combinations of uses over time, with a code for each geographic location. The sum of the area in each sequence made accounted for the area per trajectory.
  C T P = 1995 1 9 2 6     2007 1 9 3 5     2018 1 9 1 5 = 111 999 231 655
where CTP is the cell trajectory profile, and each entry is a 100 × 100 m cell with the dominant land use.
To derive the typology of LUD, different unsupervised-clustering methods were tested. A total of 26 variables were used on a municipal scale: the average number of transitions, the total municipal area with transitions at level 1 (%), the variation (%) of each class and the location quotient (LQ) of each class. A log transformation was used to compress high values and enhance differences between smaller ones. For dimensionality reduction and to avoid redundancy and multicollinearity issues, a principal component analysis (PCA) was performed. Components were extracted based on eigenvalue (>1) with a varimax rotation.
Four types of clustering methods were compared: neighbourhood-based partitioning (K-medoids); hierarchy-based (hierarchical); probabilistic (fuzzy c-means) and bagging (random forest). The optimal number of clusters for all the methods relied on the lowest value of the Bayesian information criterion (BIC), avoiding the bias of human intervention in the clustering process and guaranteeing the maximum number of clusters without compromising cluster quality.
The selection of the best model relied on five cluster-evaluation metrics: (i) R2, which measures the overall proportion of variance explained by the cluster means [67]; (ii) the Dunn index, the ratio of the smallest distance between observations not in the same cluster to the largest intra-cluster distance [68]; (iii) the silhouette coefficient, a metric that evaluates the distance between cluster means [69]; (iv) classical entropy, which describes the harmony in the discrimination of cluster memberships [70]; and (v), the Calinski–Harabasz index, which is the ratio of the sum of between-clusters dispersion and inter-cluster dispersion for all clusters [71].
The workflow used various types of software. For GIS data analysis and the calculation of indicators of land use, ArcGIS Pro was used. For the multivariate statistical analysis, Jamovi (v. 2.2.5) was used for the PCA, and JASP (v. 0.16.2.0) for cluster analysis.

4. Results

4.1. Variations and Trends of Land-Use Dynamics from 1995 to 2018 in Continental Portugal

4.1.1. Dynamics at the National Level

Despite relevant LUD from 1995 to 2018, land-use patterns in continental Portugal remain dominated by vegetation features, with forest land and agricultural areas as the most abundant landscapes (Figure 2 and Figure S2). Natural and seminatural areas were the following most prevalent classes, while artificial surfaces accounted for more than 5% of continental Portugal in 2018. The remaining classes, open areas with little or no vegetation, wetlands and waterbodies, occupied less than 3%. Over the 23 years under analysis, no structural changes were evident in terms of each LUC area, although relevant trends can be highlighted, such as the increase in forested areas, the growth of soil artificialization and the decline of agricultural land-use.
LUTs were not homogeneous over time. The period 1995–2007 is characterized by higher changes than 2007–2018 (Figure 3a). In the former, there were more significant rates of change, namely the decrease in agriculture and the increase in forested and artificial territories. The latter period was marked by higher stability and a slight trend of increasing agriculture.
The quantification of LUT shows that forest and artificial surfaces had the biggest absolute increases, while agricultural areas had the greatest negative variation (Figure 3b). However, forests lost about half of their gains to other LUCs. Agroforestry and shrubland had small contractions and pastures, despite a great increase, also lost area, which remained quantitatively identical to 1995. The remaining classes were relatively stable, except for water bodies, which had the second-highest rate of change. In terms of the rate of change, artificial surfaces had the largest, with approximately 35%, and while agriculture and forest had residual rates, both forests and agriculture had residual variation, despite the higher absolute values.
Regarding the fourth nomenclature level (Figure 4a), eucalyptus increased more than any other tree species, in contrast with the maritime pine, whose proportion on forest land was reduced by 10% (Figure 4b). Olive groves, after a slight downward trend until 2007, recovered the area lost, and grew almost three times more from 2007 to 2018 than in the area lost from 1995 to 2007. Given this variation, in 2018 olive groves already accounted for approximately 20% of agriculture in continental Portugal.

4.1.2. Dynamics in Regions and Municipalities

After the overview at the continental-country level, inequalities in LUD are evident on a regional scale. The land-use map in the Alentejo region in 2018 was the least similar compared with 1995 (Table 2), meaning more areas transitioned between LUCs.
The spatial distribution of the main LUCs (Figure 5) reveals geographic asymmetries in the study area:
  • The distribution of artificial surfaces evidences an unbalanced and bipolar settlement model preferably near the coastline, which coexists between agricultural and forested areas. Urban areas dominate the landscape in the metropolitan areas of Lisbon and Oporto and the Algarve coast, and are also evident in some urban systems of regional importance (e.g., Aveiro, Braga, Coimbra and the majority of regional capitals);
  • Agricultural areas present several clusters across the country in proximity to water bodies, and are most represented in Alentejo and the Lisbon metropolitan area (LMA);
  • Pastures and agroforestry areas have a very concentrated distribution marking the landscape of the Alentejo and a residual part of the inland Centro region;
  • Forest land is the LUC that occupies the largest proportion of area in all NUTS II, dominating the landscape in the Centro region, where it occupies around 50%, and in the Atlantic coastline of Alentejo;
  • Shrublands are mostly distributed in areas of more rugged orography, and are more common in the Norte and Algarve regions.
At the regional level (Figure S3), Algarve and Alentejo recorded the highest rate of change of artificial surfaces, although the highest absolute variation occurred in the Centro region. Agriculture decreased in all regions, and although the largest losses occurred in Alentejo, it was the second region with the lowest rate of change. The expansion of forest land was positive in all NUTS and had the highest rate of change in the Algarve, although the largest absolute growth occurred in Alentejo. Shrubland declined with a greater magnitude in the Norte region, although the largest negative rate of change was in the Algarve. Pastures had the largest negative variation in Alentejo while growing slightly in the Centro, similarly to agroforestry areas, which only grew in the Centro and Algarve, although residually. Still to be noted is the fact that the variation of water bodies in Alentejo had a rate of change higher than in all the other regions combined.
At the municipal level (Figure 6 and Figure S4), the highest growth of certain LUCs generally occurred in municipalities where they were already over-represented in the national context, showing an intensification of their use. The geography of soil artificialization highlights the intensification of an asymmetric urban-model attracted by the proximity to the coastline and metropolitan areas. The abandonment of agricultural activity was only thwarted in a few municipalities in Alentejo and the Norte, with the expansion of olive groves. Forests had the largest contractions in the metropolitan areas of Lisbon and Oporto, where higher urban-growth has occurred. Changes in forest occurred due to pine-forest contraction, namely in the Norte and Centro regions, but forest growth has not always depended on eucalyptus, as was evident in southern Alentejo and the Algarve. Shrublands had some gains in the Centro region, but in most of the country they were converted. The distribution of open spaces with little or no vegetation is associated with the more rugged areas of bare or rocky soil and had no relevant variations identified. The same can be stated for the wetlands, which as a protected use had only minor variations on the Aveiro coast. Water bodies grew in several adjacent municipalities associated with the construction of dam reservoirs, and seemed to favour agricultural activity, as there was an increase in agriculture and olive groves in proximity to greater water availability.

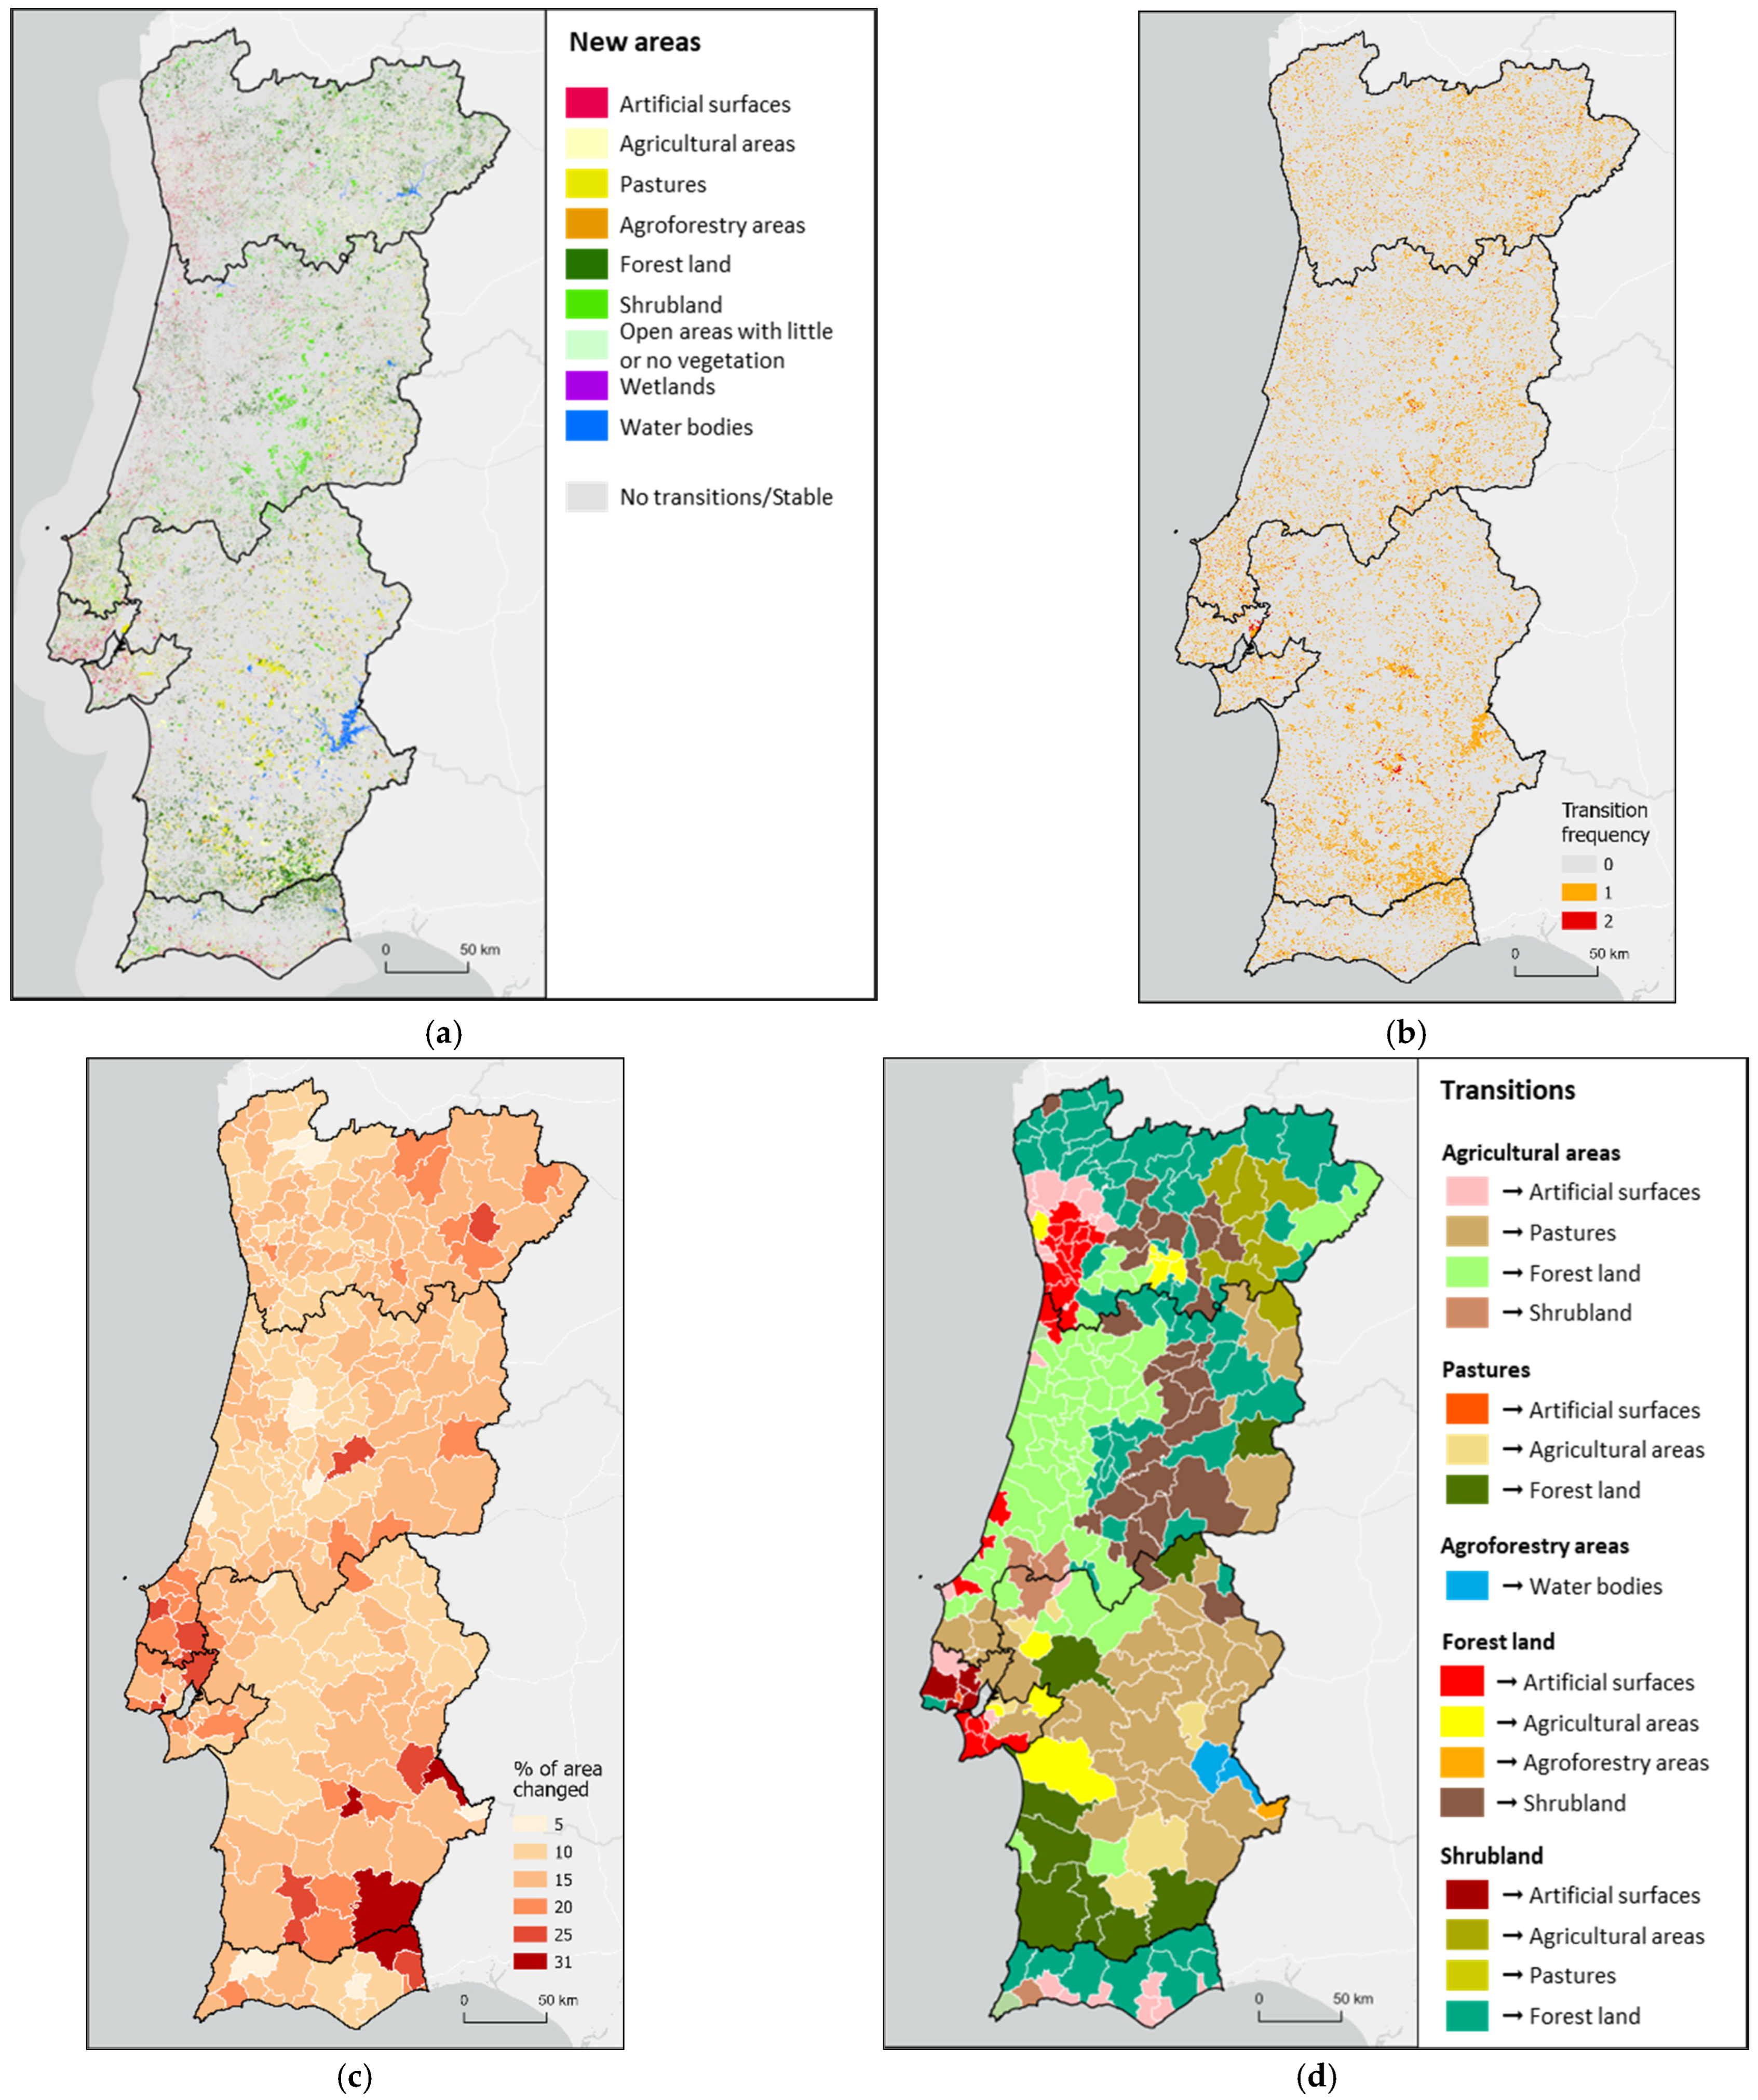
4.2. Transitions and Trajectories

The quantification of the LUTs, in terms of gains and losses from 1995 to 2018, are presented in Figure 7. Open spaces with little or no vegetation, wetlands, and water bodies were not considered, because their dynamics were residual or spatially concentrated, as analysed in the previous section.
These transitions had already been uncovered earlier, based on LUC variation, and can be summarized with the following quantifications:
  • Artificial surfaces increased mostly converting agricultural areas (42%), forest land (33%), and shrubland (14%).
  • New agricultural areas appeared from pastures (40%), shrubland (28%) and forests (26%). In contrast, they were converted mostly to forest land (35%), and pastures (34%).
  • Reductions in agroforestry resulted from conversions to forests (51%) and pastures (29%), but gains were mainly from forests (83%).
  • New areas of forest land resulted mostly from shrubland (38%), agriculture (34%) and pastures (19%). Losses resulted in forest transited to shrubland (43%), artificial surfaces (21%), agriculture (20%) and agroforestry (12%).
Regions were very heterogeneous, and their LUTs (Table S2) reflect multiple types of landscape. From 1995 to 2018 in the Norte, Centro and Alentejo, afforestation was the most common dynamic, in the first case from shrubland, in the second by the conversion of agricultural areas and in the latter from pastures. In the LMA, the agricultural decline was the most relevant transition, either to pastures or to artificial surfaces. In Alentejo, the greatest transitions were in the expansion of pastures from the contraction of agricultural areas and the growth of forests, by the conversion of pastures and forest intensification in former agroforestry areas. Finally, in the Algarve, the dominant dynamic was the afforestation of shrubland.
The spatial heterogeneity of these dynamics sometimes exhibited positive spatial-autocorrelation patterns, with conversions to the same class appearing geographically close (Figure 8a). Approximately 88% of the COS level 1 LUCs remained stable from 1995 to 2018, and only 0.58% recorded more than one transition (Figure 8b). The highest proportion of area changed by municipality (Figure 8c) was related to the dynamics of afforestation in the Algarve, urbanization in the LMA and agriculture transition to pasture in the Oeste (Figure 8d).
The trajectory analysis revealed 339 different profiles, of which 330 had at least one LUT between years. Considering only the profiles with more than 1% of the area changed in the period 1995–2018 (Figure 9), the majority of LUT occurred from 1995 to 2007, and the same LUC persisted from 2007 to 2018. It is noted that three of the first five profiles corresponded to forest growth. The remaining two were agricultural reduction to pasture and forest degradation (deforestation to shrublands). The transformation of former agricultural areas into shrublands was the sixth most-common profile. Although they were not among the six most-common profiles, urbanization dynamics were significant because they represented more than 10% of the area covered in Figure 9. The area recovered by agriculture occurred preferentially through the conversion of pastures, shrubland and forest. Afforestation and agriculture contraction were responsible for more changed areas. Most afforestation occurred up until 2007, although after this date it still represents more than 7% of the areas with LUT.

4.3. Typology of Land-Use Dynamics

In light of the fact that many of the dynamics are inversely related, i.e., forest growth and shrubland decline, a PCA analysis was performed before clustering, to reduce data dimensionality and avoid multicollinearity. A total of nine components were extracted from the 26 entry variables (eigenvalues greater than one) that explained 76% of the variance of the 278 municipalities (Table 3). The spatial distributions of these nine dimensions can be assessed in Figure S5.
The first component had a strong positive correlation with the variation of maritime pine and a strong negative association with the LQ of forest land and eucalyptus variation (which can be named as a transition of the dominant forest-species). The second component had a negative association with the variation of artificial surfaces and its LQ (low-urbanization municipalities). The third component had strong negative correlations with the LQ of pastures and agroforestry (low-density woodland pasture). The fourth component was strongly related to the LQ of agricultural areas, and moderately to the olive groves (agriculture and olive-production hot spots). The fifth component had a negative correlation with agroforestry variation and a positive with water-bodies variation (the expansion of artificial water reservoirs). The sixth component was strongly opposed to forest land and was positively associated with shrubland variation (forest degradation). The seventh component was reported by municipalities with a high LQ of wetlands and water ecosystems (aquatic ecosystems). The eighth component had a negative relationship with changes in agricultural areas (evolution of agricultural activity), and the ninth component correlated positively and strongly with the variation of open spaces with little or no vegetation, and wetlands (changing ecosystems reserves). The average number of transitions and the total municipal area with transitions at level 1 (%) did not present strong relationships with any component, both having correlations of 0.5 with the eighth component. In this way, the components summarise both the main changes and the land-use patterns that have remained stable in the study area.
Considering the research’s objective of generating a typology of LUD, several clustering techniques were tested with the nine components, and the best result was selected, based on evaluation metrics (Table 4). In this sense, the K-medoids method, with partitioning around the medoids algorithm, showed a superior fit, with more metrics with robust values. Both the hierarchical and the probabilistic fuzzy c-means also showed reasonable results, and the random forest presented the lowest performance.
Using K-medoids, the 11 clusters determined were (Figure 10):
Cluster 1 (72 municipalities) concerned high-density forest coexisting with agriculture and urban areas. Although it had the largest number of municipalities, it recorded the smallest average area transitioned at level 1 of COS. The overall forest area remained stable, but with a transition from maritime pine, which showed a great reduction, to eucalyptus forest, which dominated the landscape and had the highest variation in this cluster. New forest areas originated from the conversion of agricultural areas.
Cluster 2 (35 municipalities) were areas occupied by open spaces and natural vegetation, with transitions from shrubland to forest and vice versa, but with an afforestation tendency.
Cluster 3 (28 municipalities) was a context of over-representation of agroforestry and pastures, with a great decline in agricultural and agroforestry activity. The change was mainly to pastures, and there were transitions from pastures to forests. The dynamics of mutual transition between forest and agroforestry also occurred, with the reduction in agroforestry areas.
Cluster 4 (35 municipalities) corresponded approximately to the municipalities of the metropolitan areas of Lisbon and Oporto, and the municipalities of Coimbra (in the Centro region), and Lagoa and Albufeira (in the Algarve region). In other words, highly artificialized urban and suburban territories, with extensive urban expansion through the conversion of agriculture, forest and shrubland.
Cluster 5 (18 municipalities), a very dynamic peri-urbanization context, reported a lot of changed area and a higher number of transitions. The fringe of the LMA had the highest average loss of agricultural areas, although these areas maintained overrepresentation in some municipalities. In order of magnitude, the largest area transitions were from agriculture to pasture, forest, and then artificial surfaces.
Cluster 6 (11 municipalities) reported densely urbanized municipalities, similar to cluster 4, but in this case in coexistence with wetland ecosystems and water bodies. The mean artificial-surface growth was the second highest in continental Portugal, due to the conversion of agriculture, forest and shrubland. This cluster also registered artificial-surface expansion in wetlands (drainage).
Cluster 7 (17 municipalities) had afforestation of natural vegetation, maintaining patterns of forest and shrubland mixture. Its municipalities had the highest forest growth which caused a large reduction in shrubland and pastures. Afforestation occurred mainly through other types of forest, namely stone pine and Quercus, such as cork oak and holm oak.
Cluster 8 (47 municipalities) represented a context of coexistence among forest, natural vegetation and agricultural areas, registering mutual transitions with agricultural areas losing the most.
Cluster 9 (10 municipalities) had agriculture and agroforestry overrepresentation where the expansion of olive groves was registered and justified a positive variation in agriculture. At the same time, it was the only cluster where the maritime pine forest had a slightly positive variation through the conversion of pastures.
Cluster 10 (3 municipalities), an urban context with a large extension of wetland ecosystems, had relative stability in most classes, with light deforestation through urbanization and agricultural abandonment in the wetlands.
Cluster 11 (2 municipalities) had the most area transitioned by the expansion of water bodies. The construction of the Alqueva dam, the largest artificial lake in Western Europe for a major irrigation project in the region, converted forest and agroforestry.

5. Discussion

This study quantified multi-scalar LUD in continental Portugal from 1995 to 2018, and derived a typology using unsupervised classification methods. The spatiotemporal analysis revealed markedly differentiated patterns, both in time and space, and intensifying trends of territorial asymmetries on a regional and municipal scale, presenting Portugal as a country of great contrasts, in which the inland country mirrors a very different reality from the coast. The results confirm previous studies of qualitative and monospecific approaches that have used other methodologies and less systematized information.

5.1. Urban Dynamics

On a global scale, urbanization in Portugal is low, and occurred at a later stage than in other European countries. Recent systematic transitions leading to artificial surfaces, which was the LUC with the highest rate of change, led to the land occupied by artificial surfaces in continental Portugal surpassing the European average of 4% [19]. The distribution of these areas is territorially polarized, occupying more than 60% of the municipalities in the Lisbon and Oporto metropolitan areas, where the greatest urban expansion occurred, namely in Oeiras and Amadora, contrasting with the 5% country average, and with the less than 2% in Alentejo.
The period under analysis was characterized by intense urbanization, as a result of the intensification of an urban society [61,72] catalysed by Portugal’s entry into the European Economic Community in 1986 [73]. More recently, land take decreased (Figure 2), influenced by the economic and financial crisis [74] that particularly affected the Portuguese construction sector [75]. In the suburbs and peripheries, the growth of discontinuous urban fabric [76] promoted sprawl patterns [52,77], with higher impacts on land consumption and infrastructure costs [78,79], partly promoted by illegal construction to overcome the housing deficit [80]. Although patterns of low density and urban sprawl are a phenomenon in other European cities [81], the ratio of land consumption to population increased in Portuguese municipalities, jeopardizing land-use efficiency and SDG 11 [82].
Approximately 42% of new artificial areas were devoted to agriculture in the past, despite regulations that prevent this LUT when soils have a high agricultural suitability. Nonetheless, this value remains low compared with other countries with high urbanization rates [83], but not significantly different from Mediterranean countries [84]. This phenomenon has been identified by some authors as an example of the transgression of agricultural and ecological reserves [85,86], as in the LMA, where 21% of the conversion from agriculture to artificial occurred in areas protected from such conversion [85]. Since our results show that this type of LUT was relevant throughout the country, it may be possible that this collision with spatial-planning instruments is more country-wide than previous studies have accounted for, suggesting that territorial-management instruments may have failed in their purpose and effectiveness.
The results obtained indicate urban dynamics contradicting several international strategies such as the SDGs, the New Urban Agenda and the European Green Deal. The National Spatial Planning Policy Program (PNPOT) intended to contribute to a polycentric territorial-model, contrary to the existing bipolar and coastal patterns, but the diagnosis outlined shows that metropolization and coastalization intensified. The intensification of these patterns is of concern in the domain of natural hazards, since the concentration of the resident population has increased in locations classified by the PNPOT as highly susceptible to coastal erosion, tsunamis and earthquakes. In addition, occupation of the coastline causes anthropogenic pressure on wetlands and water bodies [87], ecosystems that require careful management to prevent environmental degradation [88]. An increase in urbanization will result in spatial shifts in both supplies of ecosystem services and the beneficiaries of those services [89], soil-erosion vulnerability [30], natural disasters [90], water quality and availability [91], urban temperature, and air quality [92]. In addition to sprawl patterns, some Portuguese cities are shrinking, manifested in the vacant and ruined spaces in the urban fabric [93]. As the opposite phenomena, reconversion of existing urban derelict spaces may be a strategy both to counter urban shrinkage and to prevent new artificial surfaces.
In this sense, the stabilization of artificial surfaces imposes itself as a reality in a context of demographic decline, namely in the hinterland [94], which is unable to counteract the artificialization in the coastal areas. To this end, a rethinking of urban public policies is evident, and the Portuguese Spatial Planning Framework Law (Law No. 31/2014 of 30 May) needs to integrate the outlined urban dynamics so that spatial-planning instruments succeed in promoting sustainable urban areas with reduced land consumption.

5.2. Agricultural Dynamics

Agricultural areas had the largest negative variation, both in absolute terms and in the rate of change. The most common transition was to forest land and pastures (more than two-thirds of agricultural losses). Other important conversions were to shrubland and artificial surfaces.
Since the last century, the agricultural decline has been associated with economic development [95], and cropland abandonment is a common phenomenon in Europe [96,97]. The historical evolution of agriculture in Portugal shows oscillating patterns of crop cultivation [98], and its contraction is associated with depopulation, urban development, and the Common Agricultural Policy (CAP) [76,99]. Agricultural areas recessed in almost all municipalities, with higher reductions just north of the LMA (Sobral de Monte Agraço, Arruda dos Vinhos and Alenquer) and in Alentejo (Cuba, Viana do Alentejo and Arraiolos), because rural properties are larger (latifundia). In the case of the 123 thousand hectares converted from agriculture to pasture, 15% were to natural herbaceous vegetation, while the remaining were to permanent pasture, i.e., improved by fertilizing, cultivating, seeding or draining, and used as grazing land. This differentiation is particularly relevant if we consider that most transitions were to permanent pastures, i.e., maintaining productive land use, and only a minority resulted in natural vegetation growth, whose ecological value is important to the European Biodiversity Strategy [100].
Various municipalities maintained hotspots of agricultural activity and some had a positive variation in agricultural areas. This growth is intrinsically associated with the expansion of olive groves, demonstrating the resilience of these territories in counteracting agricultural abandonment, by specializing in one species. These are the cases of Ferreira do Alentejo, Beja and Vidigueira in the Alentejo region and Mirandela, Macedo de Cavaleiros and Vila Flor in the Norte region. However, this expansion resulted from the intensification (Figure S6) of olive-tree plantations [65], with negative environmental impacts on the soil’s productive capacity. A report from the European Environment Agency [19] had previously alerted the growing monofunctional agriculture based on intensive olive groves in arable land, jeopardizing future soil-fertility. This trend has been confirmed in other Mediterranean countries since 1990 [101], although Portugal started after 1999 with plantations in Alentejo which benefited from the construction of the Alqueva dam reservoir [65]. This specialization is worrisome, since, according to Debonne et al. [102], the Alentejo region is not only at risk of drought but also of losing the potential yield of the land.
Agricultural dynamics conflict with several SDGs and pose challenges to future soil productivity because of agriculture intensification and the artificialization of fertile lands. Thus, it is necessary to diversify farming and protect land systems for food security. Future policies need to accommodate the agroecological and biophysical conditions into the production incentives to avoid economically unviable and environmentally unsustainable situations [98], and spatial-planning instruments should consider farmers’ intentions [103].

5.3. Forest Dynamics

Forest land, dominated by monospecific forests with the prevalence of eucalyptus and maritime pine, covered nearly 40% of continental Portugal in 2018. Forest areas in Portugal are already above the world average, with a slight afforestation trend, while on the global scale they are decreasing [104].
A higher density of forest use occurred in the Centro region, on a north–south alignment that expanded inland primarily through the conversion of shrublands and agriculture. Deforestation led to the conversion from forest use to shrubland, due to recurrent forest fires, as well as to artificial surfaces. In the LMA approximately 10% of forest conversion to urban areas was legally protected [85] by their ecological value, representing a transgression of the legal regime of land use. The same may have happened in the case of transitions from agriculture to forest. Afforestation of abandoned agricultural areas is a trend that goes back to 1970, at least according to [53]; however, given the reference years of the COS, there may be hidden transitions not detectable by the temporal scale. For example, the trajectory of an agricultural area that converted to pasture or shrubland before being forested is not always captured.
Remarkable increments in forest area occurred in the municipalities of Mértola and Odemira in the Alentejo region and Alcoutim in the Algarve, boosted by a forest restoration initiative [105]. The area of eucalyptus grew in most of the country, and replaced maritime pine forests. Afforestation is positive for carbon sequestration and mitigation of climate change [106,107]; however, the increasing proportion of eucalyptus forests, which already occupied more area in absolute terms in Portugal than in any other country in Europe [108] is replacing native species. Its expansion, promoted by the pulp, paper and wood industry [109] was subsidized and liberalized in the past decade (Decree-Law No. 96/2013 of 19 July) [110], constituting the ideal conditions for its proliferation. After the massive wildfires of 2017 [111], a new law repelled the previous regime (Law No. 77/2017 of 17 August), prohibiting new plantations [110], but the species was already present throughout the country. Superior earlier profitability compared with other species and its importance for timber production [112,113] justifies its preference (transitions from maritime pine to eucalyptus from 1995 to 2018 amounted to more than 200 thousand hectares, while the reverse was approximately 2400 hectares). In turn, the decline of pine species resulted from wildfires [114] and extreme weather events or pests [115]. Eucalyptus expansion is not exclusive to Portugal [116,117], having negative environmental impacts [118] on biodiversity, groundwater reservoirs and fire flammability [119,120,121]. These dynamics have led to contexts of coexistence and proximity between pines and eucalyptus that enhance vulnerability to fire if natural vegetation is unmanaged [114,122], as these species are flammable and burn recurrently [123,124,125]. Considering that wildfire severity has been increasing in Portugal [126], and in the context of climate change with the growth of the proportion of forest with flammable species, reinforcement of this severity is expected.
In addition, it is important to address the intensification of forest use in agroforestry areas, culminating in a transition to forest land. Montado, an agroforestry ecosystem specific to southern Portugal that normally combines Quercus trees and livestock grazing [127], is in decline [128], threatening its own sustainability and existence.
Moreover, the intersection of urban and forest dynamics, both with an expansive tendency over agricultural areas and natural vegetation, has created conditions of coexistence of patches of urban development mixed with wildlands (Figure S6). The disappearance of the buffer areas between forest and urban use increases the fire risk [129] and therefore, effective land-use management at urban–rural interfaces is required [130].
In summary, the state of the Portuguese forest is complex, and is in the worst situation in Europe when it comes to its condition, biodiversity and ecosystem services [131]. The forest-growth reliance on flammable trees, in a disorderly forest-shrubland mix that replaced native species, conflicts with a diversified forest use, and is not aligned with SDG 15 nor with biodiversity strategies. Considering that there are a minority of forests under state control, and few regulations on planted species and on ecosystems maintenance, diversified and better-managed forests require structural changes through legislative initiatives [132].

5.4. Typology

The cluster typology of LUD from 1995 to 2018, exclusively based on LULC dynamics, divided continental Portugal into 11 clusters that range from 2 to 72 municipalities. The spatial cohesion of the clusters revealed regionalization patterns that suggest spatial dependence on LUTs, although municipalities with similar dynamics do not belong exclusively to the same political-administrative region. The proposed zonings need sectoral and spatial planning policies adjusted to their specificities.
The geography of the clusters is similar to the former agrarian and forestry divisions (Figure 10), suggesting that incentives and objectives of these regional bodies of sectorial scope have influenced LUD. High agricultural losses coincide with the boundaries of former agrarian regions, especially in the north of the LMA (the Oeste region), and in the Alentejo region. In the case of forest, the situation is more complex, but several former forest regions can be identified as boundaries for clusters.
To complete the discussion of the typology, Table 5 provides socio-economic indicators relevant to the interpretation of the clusters. From this information, it is evident that the increase in artificialization is related to population growth and that, simultaneously, depopulation implies a reduction in agricultural employment.in addition, clusters with more population involved in services had less forest land, and employment in the secondary sector is positively associated with forest areas.
Cluster 1 stands for municipalities with large coverage of forest land in a forest-type transition. According to the Oliveira et al. [53] typology of forest-transition theory, these same areas had large forest growth in the first half of the last century. Although the forest area presented stability, the intensification of eucalyptus monoculture already made this species dominant. Cluster 2 experienced some urban growth and had areas of mutual LUT between natural vegetation and forest land, but forests experienced more gains than losses. In both these clusters the size of forest land was positively correlated to employment in the secondary sector, so industry employment may be dependent on forestry production. Cluster 3 represented a large contraction of agricultural and agroforestry activity (latifundia). Historically, these municipalities in Alentejo went through an intensive wheat-production campaign in the 1920s and 1930s, despite the poverty of the soil, and the agricultural decline was intensified by the 1992 CAP measures [133] and depopulation [61]. This cluster had the highest population decrease, and despite the decline in agricultural activity, employment in the primary sector remained close to 10% (Table 5). Cluster 4, on the outer fringe of the city of Lisbon, the capital of Portugal, went through highly dynamic urbanization, according to Moreira et al. [54], where the largest absolute growth of urban fabric was registered at the turn of the century.
Cluster 5 had the highest mean agricultural decline, with transitions to pastures, forests and artificial surfaces corresponding to areas of suburbanization and peri-urbanization, with scattered urban forms [52] and agricultural land-fragmentation [134]. Nonetheless, peri-urban agroecosystems tend to have the capacity to resist, despite urban pressure [135], and this cluster had the highest mean of the LQ of agricultural areas, reflecting the opportunities associated with infrastructure, namely the proximity to the country’s largest consumer market.
Clusters 4, 6 and 10 demarcated the transitions associated with the expansion of artificial surfaces. These areas were classified by Abrantes et al. [52] as urban and suburban territories and areas of urban sprawl. These clusters represent mainly the metropolitan areas or their functional dependencies, as well as the Algarve urban system, and had intense population growth (except for cluster 6). More than 70% of its population was employed in services (Table 5).
Cluster 7 had the highest afforestation through the conversion of natural vegetation, an exceptional context in Portugal through the increase of stone pine and Quercus, namely cork oak and holm oak, relevant for the ecological recovery of native-species forests [136]. Some of these municipalities were part of a forest-landscape-restoration initiative, named the Southern Portugal Green Belt project of the World Wide Fund for Nature Mediterranean Cork Oak Landscapes Programme [105], presenting greater forest resilience through less dependence on eucalyptus and maritime pine.
Cluster 8 had mutual transitions among shrubland, agriculture and forest, and although they are mainly rural areas [52], historically, forest use has been declining [53] and agricultural areas remain relevant. Cluster 9 had a specialization in olive groves, through intensified use [65], but still in a more controlled situation compared with Spanish regions [137]. Almost 50% of the cluster area was occupied by agriculture, and 12.5% of its population worked in the primary sector (Table 5).
In Cluster 10, nature has reclaimed agricultural areas for wetlands. The relevance of wetlands and coastal areas is unquestionable [138,139], and their recovery in Portugal is important because from 1958 to 2018 agricultural land reclamation resulted in an 85% loss of saltmarshes [140]. In addition, LUT from wetlands to artificial surfaces occurred in the municipalities of cluster 6, which makes the recovery of these sensitive ecosystems even more important.
Cluster 11 had the largest changed area, due to the expansion of water bodies. Although this implied a marked reduction in agroforestry and forest, through the major irrigation plan of the Alqueva dam, the greater availability of water in the region was essential to promote agricultural irrigation and enhance regional development [65]. Despite the 3% reduction in agricultural areas, it is the cluster that maintained the greatest level of employment in primary activities (Table 5).
The aggregation of dynamics in clusters makes it easier to assess the state of the territory, highlighting differentiated zoning patterns. The identification of these spatiotemporal dynamics in areal units (municipalities) that have a certain autonomy in spatial planning is a way of providing the local ruling bodies with knowledge on LUD for public policies adjusted to their specificities, considering the national context and its vicinity.

5.5. Discussion Summary: Dynamics, Specificities and Limitations

This study results showed a very heterogeneous country with marked contrasting patterns, unsustainable trends of LUT, and a challenging picture for public policies of land-use planning and sectoral scope. Some of the dynamics in parts of the territory conflict with guidelines and strategies for sustainable development, such as the PNPOT, the Portuguese National Strategy for Sustainable Development 2005–2015, the European Green Deal, or the SDGs itself. Hyper-specialization is removing resilience from the territory that no longer has a diversified economic base. By contrast, large areas of the country showed inertia, and remained with no productive use, although guaranteeing an important reserve of interest for nature conservation and biodiversity, crucial for maintaining ecosystem services and fundamental for sustainability. The spatial patterns of the clusters suggest the need for a properly integrated and articulated land-use-management strategy to reverse undesirable dynamics in a systemic way, which is made more difficult by forcing a compromise between administrative regions. The results provide the decision-makers with the knowledge for reformulating spatial-planning instruments and policy objectives, in line with the diagnosis outlined, both in the sense of what may be the need to reverse certain trends and to promote and intensify some LUTs. In short, it is necessary to accommodate an integrated land-use-management framework with an assessment of ecosystem services [141] that succeeds in promoting balanced urban-development [142], with a stimulus for local multi-actor strategies to reverse the agricultural abandonment of depopulated areas [143] and multifunctional landscapes in forested areas [144].
LUT was analysed as a broad concept, with the spatiotemporal typology of LUD focusing on land-use structure and its changing patterns. However, recessive morphology, common in LUT analysis, as suggested by Long et. al. [2], was not explored. In addition, unlike other authors [26,52], we decided not to evaluate morphological changes with spatial indices, which would have enriched the analysis in respect of the fragmentation of the LUC, but would have required the reduction of the scope of other analyses.
The data used also has some specificities and limitations. Dynamism depends on the nomenclature level, because the quantification and rate of LUT are influenced by thematic resolution, being higher at lower aggregation levels. For example, from 1995 to 2018 the area changed in COS at level 1 was 11.9% of continental Portugal, but at level 4 it was 18.1%. This is a known effect of thematic resolution on landscape-pattern analysis [145], so there may have been important dynamics that were not examined. Besides that, the typology of LUD on the municipal scale may be subject to modifiable areal unit problems [146,147] and ecological fallacy [148]. Concerning the LUCs selected for this study, it is important to note that the COS-series nomenclature does not allow correspondence of the type of built fabric with the year 1995, not permitting the analysis of relevant dynamics in specific classes of artificial surfaces as was performed for agriculture and forest. Regarding spatial resolution, the COS minimum-mapping unit does not allow the identification of LUT smaller than 1 hectare, and the temporal resolution is a source of uncertainty because of potential hidden transitions between reference years. In addition, although the thematic accuracy of COS is around 85%, spatiotemporal interdependence may have propagated errors between years, creating deviations in accounting for LUT over time. However, error propagation tends to be higher with increasing thematic complexity [149], and since the analysis of large classes was privileged, i.e., mostly COS level 1 class, the bias should have been minimal.
This paper presented an analysis of continental Portugal in some detail, but given the COS accessibility and its richness in LULC data, we believe that its potential is far from being explored. That said, future research should focus on understanding the causes and consequences of the monitored dynamics. The examination of driving factors should consider a large spectrum of potential causes, from spatial dependence, fiscal burdens, local economics and socio-political data. Also, it will be important to assess the effect of wildfires on the LUT, for example, how many situations of forest loss that converted to pasture or shrubland were caused by fire without recovery of the former use. In the field of analysing the implications of the dynamics, we suggest that consequences should be based on the development of a quantified framework concerning the impacts of the loss of fertile land, carbon emissions, ecosystem services, land-infrastructure costs and increased natural and environmental risks.

6. Conclusions

Understanding spatiotemporal LUD is of great relevance for regional and urban planning, monitoring ecosystem services, assessing environmental impacts and measuring progress toward SDGs. We have outlined the most significant changes in continental Portugal for a 23-year period, complementing previous studies.
The spatiotemporal analysis revealed the fact that land-use territorial-asymmetries have intensified. From 1995 to 2018, approximately 12% of continental Portugal had at least one LUT with geographical disparities and different rate-changes, depending on the type of transitions. Key trends and patterns were summarized in a typology at the municipal scale that highlights afforestation, urban expansion, agriculture changes and natural-vegetation dynamics. The typology is the only one available for continental Portugal as a result of a comprehensive study of land-use maps, and can be a spatial summary relevant to the land-management framework of spatial planning and sectoral policies. In general, we can state that LUD in continental Portugal is in collision with several strategic orientations. Urban expansion has increased in coastal areas, entailing a risk of degradation of wetlands and water bodies, and converted agriculture and forest areas. In the case of agriculture, the reduction of agricultural areas by irreversible transitions, as is the case of urbanization and the intensification of olive groves, is a threat to sustainability. Likewise, the fact that forests are increasingly reliant on eucalyptus plantations, rather than native species, contradicts biodiversity strategies for resilience and sustainable development.
Although the particular causes of these dynamics have not been identified, these changes are interdependent, and land-management policies should prioritize integrated approaches for sustainable land-use. That said, greater territorial multifunctionality is needed to restore landscape balance through spatial planning and sectorial policies.
In summary, we consider our results to be primarily of policy interest for science and evidence-based decision-making, to design sustainable-pathway policies. The LUD typology approach allowed the definition of zonings that need specific policies and interventions to address the observed dynamics. It may be of interest for replication by other countries with markedly unequal patterns of land use, and those that have experienced significant changes. This analysis can be an inspiration for future LUD studies with higher spatial resolution and higher thematic disaggregation, creating new evidence of LUT in line with key guidelines and directives for sustainability.

Supplementary Materials

The following supporting information can be downloaded at: https://www.mdpi.com/article/10.3390/su142315540/s1, Figure S1. Physical environment and population distribution (2021) in the study area; Table S1. Nomenclature of COS 2018 at the highest and lowest level; Figure S2. Percentage of each class in 1 km2 cell; Figure S3. Absolute and relative variation of LUC at NUTS II level; Figure S4. Top 10 trend 1995–2018 by municipality (variation in municipality area); Table S2. Transition matrices; Figure S5. Principal Component Analysis scores; Figure S6. Bivariate representations of land-use patterns in 1 km2 cells.

Author Contributions

Conceptualization, A.A., F.M., E.G., J.R. and M.C.; methodology, A.A., F.M., and M.C.; formal analysis, A.A. and F.M.; investigation, A.A.; data curation, A.A. and F.M.; writing—original draft preparation, A.A.; writing—review and editing, E.G., J.R. and M.C.; supervision, M.C.; project administration, M.C.; funding acquisition, E.G., J.R. and M.C. All authors have read and agreed to the published version of the manuscript.

Funding

This research was carried out during an internship of A.A. in the Division of Geographic Information of the Directorate-General for Territory. Funding was acquired by national funds through FCT—Portuguese Foundation for Science and Technology, I.P. under the framework of several projects, E.G. under the grant no. 2020.00825.CEECIND, J.R. with the project “TRIAD-health Risk and social vulnerability to Arboviral Diseases in mainland Portugal” (PTDC/GES-OUT/30210/2017) and M.C. through the project SCAPEFIRE (PCIF/MOS/0046/2017).

Institutional Review Board Statement

Not applicable.

Informed Consent Statement

Not applicable.

Acknowledgments

The authors would like to thank the three anonymous reviewers for their useful and helpful comments that contributed to improving the manuscript.

Conflicts of Interest

The authors declare no conflict of interest.

References

  1. Meyer, W.B.; Turner, B. Changes in Land Use and Land Cover: A Global Perspective; Cambridge University Press: Cambridge, UK, 1994. [Google Scholar]
  2. Long, H.; Zhang, Y.; Ma, L.; Tu, S. Land Use Transitions: Progress, Challenges and Prospects. Land 2021, 10, 903. [Google Scholar] [CrossRef]
  3. Lambin, E.F.; Meyfroidt, P. Land Use Transitions: Socio-Ecological Feedback versus Socio-Economic Change. Land Use Policy 2010, 27, 108–118. [Google Scholar] [CrossRef]
  4. Antrop, M.; Van Eetvelde, V. Landscape Dynamics and Evolution. In Landscape Perspectives: The Holistic Nature of Landscape; Antrop, M., Van Eetvelde, V., Eds.; Springer: Dordrecht, The Netherlands, 2017; pp. 141–176. ISBN 978-94-024-1183-6. [Google Scholar]
  5. Golub, A.; Hertel, T.W. Global Economic Integration and Land Use Change. J. Econ. Integr. 2008, 23, 463–488. [Google Scholar]
  6. Lambin, E.F.; Meyfroidt, P. Global Land Use Change, Economic Globalization, and the Looming Land Scarcity. Proc. Natl. Acad. Sci. USA 2011, 108, 3465–3472. [Google Scholar] [CrossRef] [Green Version]
  7. Hasan, S.S.; Zhen, L.; Miah, M.G.; Ahamed, T.; Samie, A. Impact of Land Use Change on Ecosystem Services: A Review. Environ. Dev. 2020, 34, 100527. [Google Scholar] [CrossRef]
  8. Turner, B.L.; Lambin, E.F.; Reenberg, A. The Emergence of Land Change Science for Global Environmental Change and Sustainability. Proc. Natl. Acad. Sci. USA 2007, 104, 20666–20671. [Google Scholar] [CrossRef] [Green Version]
  9. Brondizio, E.S.; Settele, J.; Díaz, S.; Ngo, H.T. (Eds.) IPBES Global Assessment Report on Biodiversity and Ecosystem Services; Intergovernmental Science-Policy Platform on Biodiversity and Ecosystem Services; IPBES Secretariat: Bonn, Germany, 2019; 1148p. [Google Scholar] [CrossRef]
  10. Winkler, K.; Fuchs, R.; Rounsevell, M.; Herold, M. Global Land Use Changes Are Four Times Greater than Previously Estimated. Nat. Commun. 2021, 12, 2501. [Google Scholar] [CrossRef]
  11. UNDRR. United Nations Office for Disaster Risk Reduction Global Assessment Report on Disaster Risk Reduction 2022: Our World at Risk: Transforming Governance for a Resilient Future; UNDRR: Geneva, Switzerland, 2022; ISBN 978-92-1-232028-1. [Google Scholar]
  12. Biermann, F.; Hickmann, T.; Sénit, C.-A.; Beisheim, M.; Bernstein, S.; Chasek, P.; Grob, L.; Kim, R.E.; Kotzé, L.J.; Nilsson, M.; et al. Scientific Evidence on the Political Impact of the Sustainable Development Goals. Nat. Sustain. 2022, 5, 795–800. [Google Scholar] [CrossRef]
  13. Zuazo, V.H.D.; Pleguezuelo, C.R.R.; Flanagan, D.; Tejero, I.G.; Fernández, J.L.M. Sustainable Land Use and Agricultural Soil. In Alternative Farming Systems, Biotechnology, Drought Stress and Ecological Fertilisation; Lichtfouse, E., Ed.; Springer: Dordrecht, The Netherlands, 2011; pp. 107–192. ISBN 978-94-007-0186-1. [Google Scholar]
  14. Foley, J.A.; DeFries, R.; Asner, G.P.; Barford, C.; Bonan, G.; Carpenter, S.R.; Chapin, F.S.; Coe, M.T.; Daily, G.C.; Gibbs, H.K.; et al. Global Consequences of Land Use. Science 2005, 309, 570–574. [Google Scholar] [CrossRef] [Green Version]
  15. Liang, X.; Jin, X.; Ren, J.; Gu, Z.; Zhou, Y. A Research Framework of Land Use Transition in Suzhou City Coupled with Land Use Structure and Landscape Multifunctionality. Sci. Total Environ. 2020, 737, 139932. [Google Scholar] [CrossRef]
  16. Asadolahi, Z.; Salmanmahiny, A.; Sakieh, Y.; Mirkarimi, S.H.; Baral, H.; Azimi, M. Dynamic Trade-off Analysis of Multiple Ecosystem Services under Land Use Change Scenarios: Towards Putting Ecosystem Services into Planning in Iran. Ecol. Complex. 2018, 36, 250–260. [Google Scholar] [CrossRef]
  17. Long, H.; Qu, Y. Land Use Transitions and Land Management: A Mutual Feedback Perspective. Land Use Policy 2018, 74, 111–120. [Google Scholar] [CrossRef]
  18. Rindfuss, R.R.; Walsh, S.J.; Turner, B.L.; Fox, J.; Mishra, V. Developing a Science of Land Change: Challenges and Methodological Issues. Proc. Natl. Acad. Sci. USA 2004, 101, 13976–13981. [Google Scholar] [CrossRef] [Green Version]
  19. Pedroli, G.B.M.; Meiner, A. Landscapes in Transition an Account of 25 Years of Land Cover Change in Europe; EEA Report No 10/2017; EEA-European Environment Agency: Copenhagen, Denmark, 2017. [Google Scholar]
  20. Gómez, J.M.N.; Loures, L.C.; Castanho, R.A.; Fernández, J.C.; Fernández-Pozo, L.; Lousada, S.A.N.; Escórcio, P. Assessing Land-Use Changes in European Territories: A Retrospective Study from 1990 to 2012. In Land Use; IntechOpen: Rijeka, Croatia, 2018; Chapter 8; pp. 131–163. ISBN 978-1-78985-704-7. [Google Scholar]
  21. Verburg, P.H.; van Berkel, D.B.; van Doorn, A.M.; van Eupen, M.; van den Heiligenberg, H.A.R.M. Trajectories of Land Use Change in Europe: A Model-Based Exploration of Rural Futures. Landsc. Ecol. 2010, 25, 217–232. [Google Scholar] [CrossRef]
  22. Auch, R.F.; Wellington, D.F.; Taylor, J.L.; Stehman, S.V.; Tollerud, H.J.; Brown, J.F.; Loveland, T.R.; Pengra, B.W.; Horton, J.A.; Zhu, Z.; et al. Conterminous United States Land-Cover Change (1985–2016): New Insights from Annual Time Series. Land 2022, 11, 298. [Google Scholar] [CrossRef]
  23. Cheng, C.; Yang, X.; Cai, H. Analysis of Spatial and Temporal Changes and Expansion Patterns in Mainland Chinese Urban Land between 1995 and 2015. Remote Sens. 2021, 13, 2090. [Google Scholar] [CrossRef]
  24. Kupková, L.; Bičík, I.; Jeleček, L. At the Crossroads of European Landscape Changes: Major Processes of Landscape Change in Czechia since the Middle of the 19th Century and Their Driving Forces. Land 2021, 10, 34. [Google Scholar] [CrossRef]
  25. Abrantes, P.; da Costa, E.M.; Queirós, M.; Padeiro, M.; Mousselin, G. Lezíria do Tejo: Agriculture and urban sprawl on the Lisbon metropolitan fringes. Cah. Agric. 2013, 22, 526–534. [Google Scholar] [CrossRef] [Green Version]
  26. Faria de Deus, R.; Tenedório, J.A. Coastal Land-Use and Land-Cover Change Trajectories: Are They Sustainable? Sustainability 2021, 13, 8840. [Google Scholar] [CrossRef]
  27. Guo, L.; Xi, X.; Yang, W.; Liang, L. Monitoring Land Use/Cover Change Using Remotely Sensed Data in Guangzhou of China. Sustainability 2021, 13, 2944. [Google Scholar] [CrossRef]
  28. Lawler, J.J.; Lewis, D.J.; Nelson, E.; Plantinga, A.J.; Polasky, S.; Withey, J.C.; Helmers, D.P.; Martinuzzi, S.; Pennington, D.; Radeloff, V.C. Projected Land-Use Change Impacts on Ecosystem Services in the United States. Proc. Natl. Acad. Sci. USA 2014, 111, 7492–7497. [Google Scholar] [CrossRef] [Green Version]
  29. Borrelli, P.; Robinson, D.A.; Panagos, P.; Lugato, E.; Yang, J.E.; Alewell, C.; Wuepper, D.; Montanarella, L.; Ballabio, C. Land Use and Climate Change Impacts on Global Soil Erosion by Water (2015–2070). Proc. Natl. Acad. Sci. USA 2020, 117, 21994–22001. [Google Scholar]
  30. Yang, S.; Zhao, W.; Pereira, P. Determinations of Environmental Factors on Interactive Soil Properties across Different Land-Use Types on the Loess Plateau, China. Sci. Total Environ. 2020, 738, 140270. [Google Scholar] [CrossRef]
  31. Mendelsohn, R.; Dinar, A. Land Use and Climate Change Interactions. Annu. Rev. Resour. Econ. 2009, 1, 309–332. [Google Scholar] [CrossRef]
  32. Shukla, P.R.; Skeg, J.; Calvo Buendia, E.; Masson-Delmotte, V.; Pörtner, H.-O.; Roberts, D.C.; Zhai, P.; Slade, R.; Connors, S.; van Diemen, S.; et al. Climate Change and Land: An IPCC Special Report on Climate Change, Desertification, Land Degradation, Sustainable Land Management, Food Security, and Greenhouse Gas Fluxes in Terrestrial Ecosystems; Intergovernmental Panel on Climate Change: Geneva, Switzerland, 2019. [Google Scholar]
  33. Mora, O.; Le Mouël, C.; de Lattre-Gasquet, M.; Donnars, C.; Dumas, P.; Réchauchère, O.; Brunelle, T.; Manceron, S.; Marajo-Petitzon, E.; Moreau, C.; et al. Exploring the Future of Land Use and Food Security: A New Set of Global Scenarios. PLoS ONE 2020, 15, e0235597. [Google Scholar] [CrossRef]
  34. Szabo, S. Urbanization and Food Insecurity Risks: Assessing the Role of Human Development. Oxf. Dev. Stud. 2016, 44, 28–48. [Google Scholar]
  35. Azevedo, J.C.; Moreira, C.; Castro, J.P.; Loureiro, C. Agriculture Abandonment, Land-Use Change and Fire Hazard in Mountain Landscapes in Northeastern Portugal. In Landscape Ecology in Forest Management and Conservation: Challenges and Solutions for Global Change; Li, C., Lafortezza, R., Chen, J., Eds.; Springer: Berlin/Heidelberg, Germany, 2011; pp. 329–351. ISBN 978-3-642-12754-0. [Google Scholar]
  36. Bowman, D.M.J.S.; Balch, J.; Artaxo, P.; Bond, W.J.; Cochrane, M.A.; D’Antonio, C.M.; DeFries, R.; Johnston, F.H.; Keeley, J.E.; Krawchuk, M.A.; et al. The Human Dimension of Fire Regimes on Earth: The Human Dimension of Fire Regimes on Earth. J. Biogeogr. 2011, 38, 2223–2236. [Google Scholar] [CrossRef] [Green Version]
  37. Houghton, R.A.; Joos, F.; Asner, G.P. The Effects of Land Use and Management on the Global Carbon Cycle. In Land Change Science: Observing, Monitoring and Understanding Trajectories of Change on the Earth’s Surface; Gutman, G., Janetos, A.C., Justice, C.O., Moran, E.F., Mustard, J.F., Rindfuss, R.R., Skole, D., Turner, B.L., Cochrane, M.A., Eds.; Springer: Dordrecht, The Netherlands, 2004; pp. 237–256. ISBN 978-1-4020-2562-4. [Google Scholar]
  38. Morabito, M.; Crisci, A.; Messeri, A.; Orlandini, S.; Raschi, A.; Maracchi, G.; Munafò, M. The Impact of Built-up Surfaces on Land Surface Temperatures in Italian Urban Areas. Sci. Total Environ. 2016, 551–552, 317–326. [Google Scholar] [CrossRef]
  39. Cutsinger, J.; Galster, G. There Is No Sprawl Syndrome: A New Typology of Metropolitan Land Use Patterns. Urban Geogr. 2006, 27, 228–252. [Google Scholar] [CrossRef] [Green Version]
  40. Malek, Ž.; Verburg, P. Mediterranean Land Systems: Representing Diversity and Intensity of Complex Land Systems in a Dynamic Region. Landsc. Urban Plan. 2017, 165, 102–116. [Google Scholar] [CrossRef] [Green Version]
  41. Petrovici, N.; Bejinariu, V. A Typology of Shrinking Cities: The Social and Economic Dynamic of Romanian Urban Network 2010–2020. Stud. Univ. Babes-Bolyai Sociol. 2021, 66, 35–66. [Google Scholar] [CrossRef]
  42. Tian, Y.; Qian, J.; Wang, L. Village Classification in Metropolitan Suburbs from the Perspective of Urban-Rural Integration and Improvement Strategies: A Case Study of Wuhan, Central China. Land Use Policy 2021, 111, 105748. [Google Scholar] [CrossRef]
  43. Van Eetvelde, V.; Antrop, M. A Stepwise Multi-Scaled Landscape Typology and Characterisation for Trans-Regional Integration, Applied on the Federal State of Belgium. Landsc. Urban Plan. 2009, 91, 160–170. [Google Scholar] [CrossRef] [Green Version]
  44. Von der Dunk, A.; Grêt-Regamey, A.; Dalang, T.; Hersperger, A.M. Defining a Typology of Peri-Urban Land-Use Conflicts—A Case Study from Switzerland. Landsc. Urban Plan. 2011, 101, 149–156. [Google Scholar] [CrossRef]
  45. Meneses, B.; Vale, M.J.; Reis, R. Uso e Ocupação Do Solo [Land Use and Land Cover]. In Uso e Ocupação do Solo em Portugal Continental: Avaliação e Cenários Futuros; Projeto LANDYN [Land Use and Land Cover of Portugal: Assessment and Future Scenarios. LANDYN Project]; Directorate-General for Territory: Lisbon, Portugal, 2014; pp. 16–52. ISBN 978-989-98477-7-4. [Google Scholar]
  46. Caetano, M.; Igreja, C.; Marcelino, F.; Costa, H. Estatísticas e Dinâmicas Territoriais Multiescala de Portugal Continental 1995-2007–2010 Com Base Na Carta de Uso e Ocupação Do Solo (COS) [Statistics and Multiscale Territorial Dynamics of Mainland Portugal 1995-2007-2010 Based on the Land Use and Cover Map (COS)]; Technical Report; Directorate-General for Territory (DGT): Lisbon, Portugal, 2017. [Google Scholar]
  47. Meneses, B.; Reis, E.; Pereira, S.; Vale, M.; Reis, R. Understanding Driving Forces and Implications Associated with the Land Use and Land Cover Changes in Portugal. Sustainability 2017, 9, 351. [Google Scholar] [CrossRef] [Green Version]
  48. Caetano, M.; Carrão, H.; Painho, M. Alterações Da Ocupação Do Solo Em Portugal Continental: 1985 e 2000 [Land Use and Cover Change in Portugal: 1985 e 2000]; Technical Report; Universidade Nova de Lisboa e Instituto do Ambiente: Lisbon, Portugal, 2005. [Google Scholar]
  49. Meneses, B.; Reis, E.; Vale, M.J.; Reis, R. Modelling the Land Use and Land Cover Changes in Portugal: A Multi-Scale and Multi-Temporal Approach. Finisterra 2018, 53, 3–26. [Google Scholar] [CrossRef]
  50. Castanho, R.A.; Lousada, S.; Gómez, J.M.; Escórcio, P.; Cabezas, J.; Fernandez, L.; Loures, L. Dynamics of the Land Use Changes and the Associated Barriers and Opportunities for Sustainable Development on Peripheral and Insular Territories: The Madeira Island (Portugal). In Land Use—Assessing the Past, Envisioning the Future (2019); IntechOpen: London, UK, 2019; pp. 1–13. ISBN 978-953-51-6945-1. [Google Scholar]
  51. Ferrão, J. Dinâmicas Territoriais e Trajectórias de Desenvolvimento: Portugal 1991 a 2006 [Spatial Dynamics and Development Trends]. Rev. De Estud. Demográficos 2002, 34, 17–25. [Google Scholar]
  52. Abrantes, P.; Rocha, J.; Marques da Costa, E.; Gomes, E.; Morgado, P.; Costa, N. Modelling Urban Form: A Multidimensional Typology of Urban Occupation for Spatial Analysis. Environ. Plan. B Urban Anal. City Sci. 2019, 46, 47–65. [Google Scholar] [CrossRef]
  53. Oliveira, T.M.; Guiomar, N.; Baptista, F.O.; Pereira, J.M.C.; Claro, J. Is Portugal’s Forest Transition Going up in Smoke? Land Use Policy 2017, 66, 214–226. [Google Scholar] [CrossRef]
  54. Moreira, F.; Fontes, I.; Dias, S.; Silva, J.B.; Loupa-Ramos, I. Contrasting Static versus Dynamic-Based Typologies of Land Cover Patterns in the Lisbon Metropolitan Area: Towards a Better Understanding of Peri-Urban Areas. Appl. Geogr. 2016, 75, 49–59. [Google Scholar] [CrossRef]
  55. García-Álvarez, D.; Camacho Olmedo, M.T.; Mas, J.-F.; Paegelow, M. Land Use Cover Mapping, Modelling and Validation. A Background. In Land Use Cover Datasets and Validation Tools: Validation Practices with QGIS; García-Álvarez, D., Camacho Olmedo, M.T., Paegelow, M., Mas, J.F., Eds.; Springer International Publishing: Cham, Switzerland, 2022; pp. 21–33. ISBN 978-3-030-90998-7. [Google Scholar]
  56. DGT-Direção-Geral do Território Carta de Uso e Ocupação Do Solo 1995, 2007 & 2018. Available online: https://snig.dgterritorio.gov.pt/ (accessed on 6 May 2022).
  57. Ramos, C.; Ramos-Pereira, A. Landscapes of Portugal: Paleogeographic Evolution, Tectonics and Geomorphology. In Landscapes and Landforms of Portugal; Vieira, G., Zêzere, J.L., Mora, C., Eds.; Springer International Publishing: Cham, Switzerland, 2020; pp. 3–31. ISBN 978-3-319-03641-0. [Google Scholar]
  58. Mora, C.; Vieira, G. The Climate of Portugal. In Landscapes and Landforms of Portugal; Vieira, G., Zêzere, J.L., Mora, C., Eds.; Springer International Publishing: Cham, Switzerland, 2020; pp. 33–46. ISBN 978-3-319-03641-0. [Google Scholar]
  59. Beck, H.E.; Zimmermann, N.E.; McVicar, T.R.; Vergopolan, N.; Berg, A.; Wood, E.F. Present and Future Köppen-Geiger Climate Classification Maps at 1-Km Resolution. Sci. Data 2018, 5, 180214. [Google Scholar] [CrossRef] [Green Version]
  60. Statistics Portugal INE—Plataforma de Divulgação Dos Censos 2021–Resultados Provisórios. Available online: https://www.ine.pt/scripts/db_censos_2021.html (accessed on 4 August 2022).
  61. Fernandes, J.A.R.; Seixas, J. Cities and Urbanisation in Democratic Portugal. Mediterranee 2018, 130. [Google Scholar] [CrossRef]
  62. Statistics Portugal Censos—Resultados Definitivos. Portugal-2011. Available online: https://censos.ine.pt/xportal/xmain?xpid=CENSOS&xpgid=ine_censos_publicacao_det&contexto=pu&PUBLICACOESpub_boui=73212469&PUBLICACOESmodo=2&selTab=tab1&pcensos=61969554 (accessed on 4 October 2022).
  63. Simões, V.; Melchor Fernandez, L.; Krieger, K. Science for Policy in Portugal; Publications Office of the European Union: Luxembourg, 2022. [Google Scholar]
  64. Fernandes, P.M.; Guiomar, N.; Rossa, C.G. Analysing Eucalypt Expansion in Portugal as a Fire-Regime Modifier. Sci. Total Environ. 2019, 666, 79–88. [Google Scholar] [CrossRef]
  65. Silveira, A.; Ferrão, J.; Muñoz-Rojas, J.; Pinto-Correia, T.; Guimarães, M.; Schmidt, L. The Sustainability of Agricultural Intensification in the Early 21st Century: Insights from the Olive Oil Production in Alentejo (Southern Portugal). In Changing Societies: Legacies and Challenges; Imprensa de Ciências Sociais: Lisbon, Portugal, 2018; pp. 247–275. ISBN 978-972-671-505-4. [Google Scholar]
  66. Costa, H.; Benevides, P.; Moreira, F.D.; Moraes, D.; Caetano, M. Spatially Stratified and Multi-Stage Approach for National Land Cover Mapping Based on Sentinel-2 Data and Expert Knowledge. Remote Sens. 2022, 14, 1865. [Google Scholar] [CrossRef]
  67. Loperfido, N.; Tarpey, T. Some Remarks on the R2 for Clustering. Stat. Anal. Data Min. ASA Data Sci. J. 2018, 11, 135–148. [Google Scholar] [CrossRef]
  68. Dunn, J.C. Well-Separated Clusters and Optimal Fuzzy Partitions. J. Cybern. 1974, 4, 95–104. [Google Scholar] [CrossRef]
  69. Rousseeuw, P.J. Silhouettes: A Graphical Aid to the Interpretation and Validation of Cluster Analysis. J. Comput. Appl. Math. 1987, 20, 53–65. [Google Scholar] [CrossRef] [Green Version]
  70. Milligan, G.W. A Monte Carlo Study of Thirty Internal Criterion Measures for Cluster Analysis. Psychometrika 1981, 46, 187–199. [Google Scholar] [CrossRef]
  71. Caliński, T.; Harabasz, J. A Dendrite Method for Cluster Analysis. Commun. Stat.-Theory Methods 1974, 3, 1–27. [Google Scholar] [CrossRef]
  72. Freire, S.; Santos, T.; Tenedório, J. Recent Urbanization and Land Use/Land Cover Change in Portugal–the Influence of Coastline and Coastal Urban Centers. J. Coast. Res. 2009, II, 1499–1503. [Google Scholar]
  73. Gaspar, J.; Brito Henriques, E.; Vale, M. Economic Restructuring, Social Re-Composition and Recent Urban Changes in Portugal. GeoJournal 1998, 46, 63. [Google Scholar] [CrossRef]
  74. Cuadrado-Roura, J.R.; Martin, R.; Rodríguez-Pose, A. The Economic Crisis in Europe: Urban and Regional Consequences. Camb. J. Reg. Econ. Soc. 2016, 9, 3–11. [Google Scholar] [CrossRef]
  75. Correia, L.; Ribeiro, M.J. Macroeconomics and the Construction Sector: Evidence from Portugal. Athens J. Bus. Econ. 2021, 8, 17. [Google Scholar]
  76. Tavares, A.O.; Monteiro, M.; Barros, J.L.; Santos, P.P. Long-Term Land-Use Changes in Small/Medium-Sized Cities. Enhancing the General Trends and Local Characteristics. Eur. Plan. Stud. 2019, 27, 1432–1459. [Google Scholar] [CrossRef] [Green Version]
  77. Aguilera-Benavente, F.; Botequilha-Leitão, A.; Díaz-Varela, E. Detecting Multi-Scale Urban Growth Patterns and Processes in the Algarve Region (Southern Portugal). Appl. Geogr. 2014, 53, 234–245. [Google Scholar] [CrossRef]
  78. Asarpota, K.; Nadin, V. Energy Strategies, the Urban Dimension, and Spatial Planning. Energies 2020, 13, 3642. [Google Scholar] [CrossRef]
  79. Camagni, R.; Gibelli, M.C.; Rigamonti, P. Urban Mobility and Urban Form: The Social and Environmental Costs of Different Patterns of Urban Expansion. Ecol. Econ. 2002, 40, 199–216. [Google Scholar] [CrossRef]
  80. Pinto, T.C.; Guerra, I. Housing Policies, Market and Home Ownership in Portugal. CIDADES Comunidades E Territ. 2019, 39, 17. [Google Scholar]
  81. Kasanko, M.; Barredo, J.I.; Lavalle, C.; McCormick, N.; Demicheli, L.; Sagris, V.; Brezger, A. Are European Cities Becoming Dispersed? A Comparative Analysis of 15 European Urban Areas. Landsc. Urban Plan. 2006, 77, 111–130. [Google Scholar] [CrossRef]
  82. Nicolau, R.; David, J.; Caetano, M.; Pereira, J. Ratio of Land Consumption Rate to Population Growth Rate—Analysis of Different Formulations Applied to Mainland Portugal. ISPRS Int. J. Geo-Inf. 2018, 8, 10. [Google Scholar] [CrossRef] [Green Version]
  83. Lu, L.; Qureshi, S.; Li, Q.; Chen, F.; Shu, L. Monitoring and Projecting Sustainable Transitions in Urban Land Use Using Remote Sensing and Scenario-Based Modelling in a Coastal Megacity. Ocean. Coast. Manag. 2022, 224, 106201. [Google Scholar] [CrossRef]
  84. Marraccini, E.; Debolini, M.; Moulery, M.; Abrantes, P.; Bouchier, A.; Chéry, J.-P.; Sanz Sanz, E.; Sabbatini, T.; Napoleone, C. Common Features and Different Trajectories of Land Cover Changes in Six Western Mediterranean Urban Regions. Appl. Geogr. 2015, 62, 347–356. [Google Scholar] [CrossRef]
  85. Abrantes, P.; Fontes, I.; Gomes, E.; Rocha, J. Compliance of Land Cover Changes with Municipal Land Use Planning: Evidence from the Lisbon Metropolitan Region (1990–2007). Land Use Policy 2016, 51, 120–134. [Google Scholar] [CrossRef]
  86. Padeiro, M. Conformance in Land-Use Planning: The Determinants of Decision, Conversion and Transgression. Land Use Policy 2016, 55, 285–299. [Google Scholar] [CrossRef]
  87. Mantas, V.M.; Marques, J.C.; Pereira, A.J.S.C. A Geospatial Approach to Monitoring Impervious Surfaces in Watersheds Using Landsat Data (the Mondego Basin, Portugal as a Case Study). Ecol. Indic. 2016, 71, 449–466. [Google Scholar] [CrossRef]
  88. Adger, W.; Hughes, T.; Folke, C.; Carpenter, S.; Rockström, J. Social-Ecological Resilience to Coastal Disasters. Science 2005, 309, 1036–1039. [Google Scholar] [CrossRef]
  89. Eigenbrod, F.; Bell, V.A.; Davies, H.N.; Heinemeyer, A.; Armsworth, P.R.; Gaston, K.J. The Impact of Projected Increases in Urbanization on Ecosystem Services. Proc. R. Soc. B. 2011, 278, 3201–3208. [Google Scholar] [CrossRef] [Green Version]
  90. Guillard-Gonçalves, C.; Cutter, S.L.; Emrich, C.T.; Zêzere, J.L. Application of Social Vulnerability Index (SoVI) and Delineation of Natural Risk Zones in Greater Lisbon, Portugal. J. Risk Res. 2015, 18, 651–674. [Google Scholar] [CrossRef]
  91. McGrane, S.J. Impacts of Urbanisation on Hydrological and Water Quality Dynamics, and Urban Water Management: A Review. Hydrol. Sci. J. 2016, 61, 2295–2311. [Google Scholar] [CrossRef] [Green Version]
  92. Yang, X.; Yue, W.; Xu, H.; Wu, J.; He, Y. Environmental Consequences of Rapid Urbanization in Zhejiang Province, East China. Int. J. Environ. Res. Public Health 2014, 11, 7045–7059. [Google Scholar] [CrossRef]
  93. Brito-Henriques, E.; Morgado, P.; Cruz, D. Morphology of the perforated city: Spatial patterns of ruins and vacant land in portuguese cities. Finisterra 2018, 53, 111–133. [Google Scholar] [CrossRef]
  94. Melchiorri, M.; Florczyk, A.; Freire, S.; Schiavina, M.; Pesaresi, M.; Kemper, T. Unveiling 25 Years of Planetary Urbanization with Remote Sensing: Perspectives from the Global Human Settlement Layer. Remote Sens. 2018, 10, 768. [Google Scholar] [CrossRef] [Green Version]
  95. Anderson, K. On Why Agriculture Declines with Economic Growth. Agric. Econ. 1987, 1, 195–207. [Google Scholar] [CrossRef]
  96. MacDonald, D.; Crabtree, J.R.; Wiesinger, G.; Dax, T.; Stamou, N.; Fleury, P.; Gutierrez Lazpita, J.; Gibon, A. Agricultural Abandonment in Mountain Areas of Europe: Environmental Consequences and Policy Response. J. Environ. Manag. 2000, 59, 47–69. [Google Scholar] [CrossRef]
  97. Strijker, D. Marginal Lands in Europe—Causes of Decline. Basic Appl. Ecol. 2005, 6, 99–106. [Google Scholar] [CrossRef]
  98. Viana, C.M.; Freire, D.; Abrantes, P.; Rocha, J. Evolution of Agricultural Production in Portugal during 1850–2018: A Geographical and Historical Perspective. Land 2021, 10, 776. [Google Scholar] [CrossRef]
  99. DGT-Direção-Geral do Território. Uso e Ocupação Do Solo Em Portugal Continental: Avaliação e Cenários Futuros. Projecto LANDYN; Direção Geral do Território: Lisbon, Portugal, 2014. [Google Scholar]
  100. Nitsch, H.; Osterburg, B.; Roggendorf, W.; Laggner, B. Cross Compliance and the Protection of Grassland—Illustrative Analyses of Land Use Transitions between Permanent Grassland and Arable Land in German Regions. Land Use Policy 2012, 29, 440–448. [Google Scholar] [CrossRef]
  101. Fernández-Escobar, R.; Gil-Ribes, J.A.; Quesada-Moraga, E.; Trapero, A.; Msallem, M. Evolution and Sustainability of the Olive Production Systems. Options Mediterr. 2013, 106, 11–42. [Google Scholar]
  102. Debonne, N.; Bürgi, M.; Diogo, V.; Helfenstein, J.; Herzog, F.; Levers, C.; Mohr, F.; Swart, R.; Verburg, P. The Geography of Megatrends Affecting European Agriculture. Glob. Environ. Chang. 2022, 75, 102551. [Google Scholar] [CrossRef]
  103. Gomes, E.; Abrantes, P.; Banos, A.; Rocha, J.; Buxton, M. Farming under Urban Pressure: Farmers’ Land Use and Land Cover Change Intentions. Appl. Geogr. 2019, 102, 58–70. [Google Scholar] [CrossRef]
  104. FAO; UNEP. The State of the World’s Forests 2020; Forests, Biodiversity and People: Rome, Italy, 2020. [Google Scholar]
  105. Oliveira, R.; Palma, L. The Southern Portugal Greenbelt-Forest Landscape Restoration; WWF: New York, NY, USA, 2004; ISBN 972-97208. [Google Scholar]
  106. Doelman, J.C.; Stehfest, E.; van Vuuren, D.P.; Tabeau, A.; Hof, A.F.; Braakhekke, M.C.; Gernaat, D.E.H.J.; van den Berg, M.; van Zeist, W.-J.; Daioglou, V.; et al. Afforestation for Climate Change Mitigation: Potentials, Risks and Trade-Offs. Glob. Chang. Biol. 2020, 26, 1576–1591. [Google Scholar] [CrossRef]
  107. Domke, G.M.; Oswalt, S.N.; Walters, B.F.; Morin, R.S. Tree Planting Has the Potential to Increase Carbon Sequestration Capacity of Forests in the United States. Proc. Natl. Acad. Sci. USA 2020, 117, 24649–24651. [Google Scholar] [CrossRef]
  108. Rejmánek, M.; Richardson, D. Eucalypts. In Encyclopedia of Biological Invasions; University of California Press: Berkeley, CA, USA, 2011; pp. 203–209. ISBN 978-0-520-26421-2. [Google Scholar]
  109. Nunes, L.J.R.; Meireles, C.I.R.; Pinto Gomes, C.J.; Almeida Ribeiro, N.M.C. Historical Development of the Portuguese Forest: The Introduction of Invasive Species. Forests 2019, 10, 974. [Google Scholar] [CrossRef] [Green Version]
  110. Nichiforel, L.; Deuffic, P.; Thorsen, B.J.; Weiss, G.; Hujala, T.; Keary, K.; Lawrence, A.; Avdibegović, M.; Dobšinská, Z.; Feliciano, D.; et al. Two Decades of Forest-Related Legislation Changes in European Countries Analysed from a Property Rights Perspective. For. Policy Econ. 2020, 115, 102146. [Google Scholar] [CrossRef]
  111. San-Miguel-Ayanz, J.; Oom, D.; Artes, T.; Viegas, D.; Fernandes, P.; Faivre, N.; Freire, S.; Moore, P.; Rego, F.; Castellnou, M. Forest Fires in Portugal in 2017. In Science for Disaster Risk Management 2020: Acting Today, Protecting Tomorrow; Publications Office of the European Unio: Luxembourg, 2020; ISBN 978-92-76-18182-8. [Google Scholar]
  112. Turnbull, J.W. Eucalypt Plantations. New For. 1999, 17, 37–52. [Google Scholar] [CrossRef]
  113. Zhang, Y.; Wang, X. Geographical Spatial Distribution and Productivity Dynamic Change of Eucalyptus Plantations in China. Sci. Rep. 2021, 11, 19764. [Google Scholar] [CrossRef]
  114. Moreira, F.; Vaz, P.; Catry, F.; Silva, J.S. Regional Variations in Wildfire Susceptibility of Land-Cover Types in Portugal: Implications for Landscape Management to Minimize Fire Hazard. Int. J. Wildland Fire 2009, 18, 563–574. [Google Scholar]
  115. Mantas, V.; Fonseca, L.; Baltazar, E.; Canhoto, J.; Abrantes, I. Detection of Tree Decline (Pinus Pinaster Aiton) in European Forests Using Sentinel-2 Data. Remote Sens. 2022, 14, 2028. [Google Scholar] [CrossRef]
  116. Costa, A.; Madeira, M.; Lima Santos, J.; Oliveira, Â. Change and Dynamics in Mediterranean Evergreen Oak Woodlands Landscapes of Southwestern Iberian Peninsula. Landsc. Urban Plan. 2011, 102, 164–176. [Google Scholar] [CrossRef]
  117. Teixido, A.L.; Quintanilla, L.G.; Carreño, F.; Gutiérrez, D. Impacts of Changes in Land Use and Fragmentation Patterns on Atlantic Coastal Forests in Northern Spain. J. Environ. Manag. 2010, 91, 879–886. [Google Scholar] [CrossRef]
  118. Cannell, M.G.R. Environmental Impacts of Forest Monocultures: Water Use, Acidification, Wildlife Conservation, and Carbon Storage. In Planted Forests: Contributions to the Quest for Sustainable Societies; Boyle, J.R., Winjum, J.K., Kavanagh, K., Jensen, E.C., Eds.; Springer: Dordrecht, The Netherlands, 1999; pp. 239–262. ISBN 978-94-017-2689-4. [Google Scholar]
  119. Ganteaume, A.; Lampin-Maillet, C.; Guijarro, M.; Hernando, C.; Jappiot, M.; Fonturbel, T.; Pérez-Gorostiaga, P.; Vega, J.A. Spot Fires: Fuel Bed Flammability and Capability of Firebrands to Ignite Fuel Beds. Int. J. Wildland Fire 2009, 18, 951–969. [Google Scholar]
  120. Goded, S.; Ekroos, J.; Domínguez, J.; Azcárate, J.G.; Guitián, J.A.; Smith, H.G. Effects of Eucalyptus Plantations on Avian and Herb Species Richness and Composition in North-West Spain. Glob. Ecol. Conserv. 2019, 19, e00690. [Google Scholar] [CrossRef]
  121. Mattos, T.S.; de Oliveira, P.T.S.; Lucas, M.C.; Wendland, E. Groundwater Recharge Decrease Replacing Pasture by Eucalyptus Plantation. Water 2019, 11, 1213. [Google Scholar] [CrossRef] [Green Version]
  122. Benali, A.; Sá, A.C.L.; Pinho, J.; Fernandes, P.M.; Pereira, J.M.C. Understanding the Impact of Different Landscape-Level Fuel Management Strategies on Wildfire Hazard in Central Portugal. Forests 2021, 12, 522. [Google Scholar] [CrossRef]
  123. Ferreira-Leite, F.; Bento-Gonçalves, A.; Vieira, A.; Nunes, A.; Lourenço, L. Incidence and Recurrence of Large Forest Fires in Mainland Portugal. Nat. Hazards 2016, 84, 1035–1053. [Google Scholar] [CrossRef]
  124. Mateus, P.; Fernandes, P.M. Forest Fires in Portugal: Dynamics, Causes and Policies. In Forest Context and Policies in Portugal: Present and Future Challenges; Reboredo, F., Ed.; Springer International Publishing: Cham, Switzerland, 2014; pp. 97–115. ISBN 978-3-319-08455-8. [Google Scholar]
  125. Oliveira, S.; Gonçalves, A.; Zêzere, J.L. Reassessing Wildfire Susceptibility and Hazard for Mainland Portugal. Sci. Total Environ. 2021, 762, 143121. [Google Scholar] [CrossRef]
  126. Marques, S.; Borges, J.G.; Garcia-Gonzalo, J.; Moreira, F.; Carreiras, J.M.B.; Oliveira, M.M.; Cantarinha, A.; Botequim, B.; Pereira, J.M.C. Characterization of Wildfires in Portugal. Eur. J. For. Res. 2011, 130, 775–784. [Google Scholar] [CrossRef]
  127. Meeus, J.H.A. Pan-European Landscapes. Landsc. Urban Plan. 1995, 31, 57–79. [Google Scholar] [CrossRef]
  128. Godinho, S.; Guiomar, N.; Machado, R.; Santos, P.; Sá-Sousa, P.; Fernandes, J.P.; Neves, N.; Pinto-Correia, T. Assessment of Environment, Land Management, and Spatial Variables on Recent Changes in Montado Land Cover in Southern Portugal. Agroforest Syst. 2016, 90, 177–192. [Google Scholar] [CrossRef]
  129. Spyratos, V.; Bourgeron, P.S.; Ghil, M. Development at the Wildland–Urban Interface and the Mitigation of Forest-Fire Risk. Proc. Natl. Acad. Sci. USA 2007, 104, 14272–14276. [Google Scholar] [CrossRef] [Green Version]
  130. Tonini, M.; Parente, J.; Pereira, M.G. Global Assessment of Rural–Urban Interface in Portugal Related to Land Cover Changes. Nat. Hazards Earth Syst. Sci. 2018, 18, 1647–1664. [Google Scholar] [CrossRef] [Green Version]
  131. Marín, A.I.; Abdul Malak, D.; Bastrup-Birk, A.; Chirici, G.; Barbati, A.; Kleeschulte, S. Mapping Forest Condition in Europe: Methodological Developments in Support to Forest Biodiversity Assessments. Ecol. Indic. 2021, 128, 107839. [Google Scholar] [CrossRef]
  132. Lazdinis, M.; Angelstam, P.; Pülzl, H. Towards Sustainable Forest Management in the European Union through Polycentric Forest Governance and an Integrated Landscape Approach. Landscape Ecol. 2019, 34, 1737–1749. [Google Scholar] [CrossRef] [Green Version]
  133. Jones, N.; de Graaff, J.; Rodrigo, I.; Duarte, F. Historical Review of Land Use Changes in Portugal (before and after EU Integration in 1986) and Their Implications for Land Degradation and Conservation, with a Focus on Centro and Alentejo Regions. Appl. Geogr. 2011, 31, 1036–1048. [Google Scholar] [CrossRef]
  134. Gomes, E.; Banos, A.; Abrantes, P.; Rocha, J.; Kristensen, S.B.P.; Busck, A. Agricultural Land Fragmentation Analysis in a Peri-Urban Context: From the Past into the Future. Ecol. Indic. 2019, 97, 380–388. [Google Scholar] [CrossRef]
  135. Soulard, C.-T.; Valette, E.; Perrin, C.; Abrantes, P.C.; Anthopoulou, T.; Benjaballah, O.; Bouchemal, S.; Dugué, P.; Amrani, M.E.; Lardon, S.; et al. Peri-Urban Agro-Ecosystems in the Mediterranean: Diversity, Dynamics, and Drivers. Reg. Environ. Chang. 2018, 18, 651–662. [Google Scholar] [CrossRef]
  136. Monteiro-Henriques, T.; Fernandes, P. Regeneration of Native Forest Species in Mainland Portugal: Identifying Main Drivers. Forests 2018, 9, 694. [Google Scholar] [CrossRef] [Green Version]
  137. Guzmán, G.; Boumahdi, A.; Gómez, J.A. Expansion of Olive Orchards and Their Impact on the Cultivation and Landscape through a Case Study in the Countryside of Cordoba (Spain). Land Use Policy 2022, 116, 106065. [Google Scholar] [CrossRef]
  138. Schernewski, G.; Inácio, M.; Nazemtseva, Y. Expert Based Ecosystem Service Assessment in Coastal and Marine Planning and Management: A Baltic Lagoon Case Study. Front. Environ. Sci. 2018, 6, 19. [Google Scholar] [CrossRef]
  139. Aparício, B.A.; Nunes, J.P.; Bernard-Jannin, L.; Dias, L.F.; Fonseca, A.; Ferreira, T. Modelling the Role of Ground-True Riparian Vegetation for Providing Regulating Services in a Mediterranean Watershed. Int. Soil Water Conserv. Res. 2022, in press. [Google Scholar] [CrossRef]
  140. Almeida, D.; Neto, C.; Esteves, L.S.; Costa, J.C. The Impacts of Land-Use Changes on the Recovery of Saltmarshes in Portugal. Ocean. Coast. Manag. 2014, 92, 40–49. [Google Scholar] [CrossRef] [Green Version]
  141. Lak, A.; Sharifi, A.; Khazaei, M.; Aghamolaei, R. Towards a Framework for Driving Sustainable Urban Regeneration with Ecosystem Services. Land Use Policy 2021, 111, 105736. [Google Scholar] [CrossRef]
  142. Haynes, K.E.; Kulkarni, R.; Sahay, H.; Stough, R.R. Limits on City Size and Related Topics. Land Use Policy 2021, 111, 104963. [Google Scholar] [CrossRef]
  143. Garcia-Alvarez-Coque, J.-M.; Martinez-Gomez, V.; Tudela-Marco, L. Multi-Actor Arrangements for Farmland Management in Eastern Spain. Land Use Policy 2021, 111, 105738. [Google Scholar] [CrossRef]
  144. García-Llorente, M.; Martín-López, B.; Iniesta-Arandia, I.; López-Santiago, C.A.; Aguilera, P.A.; Montes, C. The Role of Multi-Functionality in Social Preferences toward Semi-Arid Rural Landscapes: An Ecosystem Service Approach. Environ. Sci. Policy 2012, 19–20, 136–146. [Google Scholar] [CrossRef]
  145. Buyantuyev, A.; Wu, J. Effects of Thematic Resolution on Landscape Pattern Analysis. Landscape Ecol. 2007, 22, 7–13. [Google Scholar] [CrossRef]
  146. Jelinski, D.E.; Wu, J. The Modifiable Areal Unit Problem and Implications for Landscape Ecology. Landscape Ecol. 1996, 11, 129–140. [Google Scholar] [CrossRef]
  147. Openshaw, S. The Modifiable Areal Unit Problem; Geo Books: Norwich, UK, 1984. [Google Scholar]
  148. Wu, J. Effects of Changing Scale on Landscape Pattern Analysis: Scaling Relations. Landsc. Ecol. 2004, 19, 125–138. [Google Scholar] [CrossRef]
  149. Burnicki, A.C.; Brown, D.G.; Goovaerts, P. Propagating Error in Land-Cover-Change Analyses: Impact of Temporal Dependence under Increased Thematic Complexity. Int. J. Geogr. Inf. Sci. 2010, 24, 1043–1060. [Google Scholar] [CrossRef]
Figure 1. Study area context in Europe.
Sustainability 14 15540 g001
Figure 2. Evolution of the area occupied (%) by COS level 1 LUC.
Sustainability 14 15540 g002
Figure 3. Land-use transitions: (a) annual rate of change (Δ %) by period; (b) absolute and relative variations.
Sustainability 14 15540 g003
Figure 4. Variation in specific classes: (a) net variation and rate of change; (b) proportion in respective level 1 class.
Sustainability 14 15540 g004
Figure 5. Land-use maps for 1995, 2007, and 2018 in continental Portugal, and regional repartition (source: COS [56]).
Sustainability 14 15540 g005
Figure 6. Variation of each class from 1995 to 2018, and location quotient in 2018.
Sustainability 14 15540 g006
Figure 7. Land-use transitions in hectares from 1995 to 2018: (a) gains (the inner circle represents the gains and the outer the losses); (b) losses (the inner circle is the area lost and the outer represents the classes to which it was converted).
Sustainability 14 15540 g007
Figure 8. Land use transitions at level 1 from 1995 to 2018: (a) new land uses; (b) transition frequency; (c) percentage of the area changed by municipality; (d) dominant transition by municipality. (ac) have a 1-hectare cell.
Sustainability 14 15540 g008
Figure 9. Most common profiles of land-use trajectories 1995–2007–2018.
Sustainability 14 15540 g009
Figure 10. Typology of land-use dynamics in continental Portugal.
Sustainability 14 15540 g010
Table 1. COS classes considered in the study.
Level 1Level 4
1. Artificial surfaces
2. Agricultural areas2.2.3.1. Olive groves
3. Pastures
4. Agroforestry areas
5. Forest land5.1.1.5. Eucalyptus forests
5.1.2.1. Maritime pine-forests
6. Shrubland
7. Open areas with little or no vegetation
8. Wetlands
9. Water bodies
Table 2. Modified contingency coefficient (COS 1995 versus 2018) for NUTS II regions (lower MCC equals lower correlation).
RegionMCC
Norte98.3
Centro98.4
Lisbon metropolitan area98.1
Alentejo97.9
Algarve98.3
Table 3. PCA components summary.
ComponentSS Loadings% of VarianceCumulative %
13.4413.2313.23
22.6710.2523.49
32.599.9533.44
42.057.8941.33
52.027.7749.09
61.957.4856.58
71.897.2863.85
81.877.2071.05
91.345.1576.20
Table 4. Cluster analysis evaluation metrics.
Clustering MethodsK-MedoidsHierarchicalFuzzy C-MeansRandom Forest
Number of clusters *1191312
R20.611 ^0.4570.5060.384
Silhouette coefficient0.1900.330 ^0.0900.050
Classical entropy2.083 ^2.0862.1952.383
Dunn index0.071 ^0.0500.0370.045
Calinski–Harabasz index35.698 ^28.27622.83715.052
* Identified as the optimal number from the Bayesian information criterion. ^ Best value for each evaluation metric.
Table 5. Cluster socioeconomic and land-use indicators.
ClusterPopulation
(Δ %)
Population Employed by Sector 2011 (%)Gross Income per Capita% Area Occupied (Mean Variation 1995–2018)
#1995–20181st2nd3rd2018 (Mean)Artificial
Surfaces
Agricultural
Areas
Forest Land
1−2.43.437.459.273636.6 (1.9)19.2 (−2.8)60.1 (0.5)
2−5.44.826.468.868654.1 (1.5)17.4 (−2.2)41.8 (1.3)
3−15.19.120.770.278481.3 (0.5)20.0 (−2.8)29.5 (1.8)
411.20.926.173.0897924.8 (7.5)27.9 (−3.6)33.9 (−1.4)
520.54.225.070.884569.9 (2.8)41.7 (−8.5)28.6 (2.6)
6−7.21.215.783.110,06219.5 (4.8)30.2 (−2.8)11.5 (−0.2)
7−11.79.425.065.668921.7 (0.8)20.4 (−1.9)45.7 (8.4)
8−10.58.523.967.766033.2 (1.0)37.4 (−0.7)29.5 (0.2)
9−14.712.518.069.574761.6 (0.5)48.7 (−1.8)18.3 (2.7)
108.52.133.264.7894917.2 (3.0)22.4 (−3.1)32.5 (−0.5)
11−14.213.719.367.071731.5 (0.6)32.0 (−4.5)11.0 (−2.4)
Publisher’s Note: MDPI stays neutral with regard to jurisdictional claims in published maps and institutional affiliations.

