Abstract
An important polymer processing technique is additive manufacturing (AM), which enables shape-free design of complex final parts with limited waste during the development change, at least if the impact of molecular degradation reactions is minimized. In the present work, polystyrene (PS) and acrylonitrile butadiene styrene (ABS) polymer have been processed via: (i) fused filament fabrication (FFF), separately accounting for the prior single screw extrusion (SSE) filament production; and (ii) pellet-based additive manufacturing (PBAM), which are two important AM techniques. The influence of printing temperature, layer thickness, printing velocity, and printing technique on the degradation of both polymeric materials is studied by means of thermogravimetric analysis (TGA), size exclusion chromatography (SEC), small amplitude oscillatory shearing tests (SAOS), Fourier-transform infrared spectroscopy (FTIR), and yellowness index (YI) measurements. For ABS, SSE-FF leads to more fission (higher mechanical loading) whereas PBAM results in more cross-linking (more thermal loading). For PS, fission is always dominant and this more evident under FFF conditions. ABS also exhibits yellowing upon processing, indicating thermo-oxidative degradation although below the FTIR sensitivity limit. The selected PBAM conditions with PS are already delivering printed specimens with good mechanical properties and lower degradation. For ABS, a further PBAM optimization is still desired compared to the FFF countercase, taking into account layer-by-layer adhesion.
1. Introduction
Extrusion-based additive manufacturing (EAM) is one of the most employed techniques for 3D printing of thermoplastics due to its low cost and versatility (e.g., shape-freedom), with as advantageless waste material and thus higher sustainability during the research and design phase [1,2]. EAM includes the broadly used fused filament fabrication (FFF) technique and the more recently developed pellet-based additive manufacturing (PBAM) technique [3,4,5,6,7,8,9]. FFF is a manufacturing technique in which a filament must be produced in advance to be used as feedstock for the actual additive manufacturing (AM) process. The filament is typically produced via conventional (single-screw) extrusion and gives the possibility of tailoring the composition of the feedstock by introducing additives such as fillers and antioxidants. In contrast, PBAM allows direct usage of pellets, reducing the processing steps required to obtain the final 3D printed part. Furthermore, it allows a wider range of materials to be additively manufactured at a lower cost than FFF, with faster processing speeds and less processing-induced degradation of the material [10].
An important group of polymers to consider for AM are polystyrenics, which are used in several applications such as packaging, automotive components, and electronic equipment [11,12]. Specifically, acrylonitrile butadiene styrene (ABS) polymer is already broadly applied for FFF [13]. ABS is a multi-phase rubber-modified polymer, based on styrene-acrylonitrile (SAN) random copolymer and polybutadiene (PB) rubber, including graft connections similar to its simplified form high impact polystyrene (HIPS) [12,14]. It has a great toughness, and a good impact, abrasion and chemical resistance [15], making it superior compared to polystyrene (PS), being a brittle, rigid and transparent thermoplastic. So far, PS filaments or pellets have not been thoroughly investigated for EAM purposes. Notably, Akintola et al. [16] produced 3D printed PS-based boron nitride nanotube nanocomposites for thermal management and electronic packaging applications. Sevastaki et al. [17], in turn, produced 3D printed parts for photocatalytic applications based on recycled PS/TiO2 composites. However, the authors indicated that further investigation is still needed to obtain 3D printed parts with a higher quality.
A significant AM research angle is the understanding of the degree of degradation the polymer experiences during processing. The extent of thermoplastic degradation is usually analyzed by a combined group of characterization techniques that assess changes in the chemical structure of the material. These changes in the chemical structure of the polymer may be reflected in the material properties, influencing the application potential, shelf life and recyclability. Notably, polymer degradation during conventional processing has already been broadly studied [18,19,20,21,22,23], and also several investigations exist for polymer recycling toward EAM applications [24,25,26,27,28]. These studies have revealed that a polymer (composite) can undergo thermal, thermo-mechanical, thermo-oxidative, photo-oxidative and hydrolytic degradation, leading to irreversible structural changes [29]. Hence, the most important factors for degradation during processing are the temperature, humidity, oxygen content, mechanical stress loadings, and residence time [30]. Thermal degradation essentially leads to (average) molar mass changes [19] caused by chemical reactions promoting chain scission, branching or cross-linking. Although the impact of oxygen may be less evident, as most processing tools limit the entrance path to the molten polymer, it may be still present in small amounts, due to its given solubility in polymers [31].
The degradation is more pronounced in case the materials undergo multiple processing cycles, such as in mechanical recycling of thermoplastics or 3D printing via FFF. Limiting the number of processing steps provides, therefore, a solution for less degradation. As PBAM involves only one processing step after the pellet production stage, it may inherently cause less structural changes to the material during processing as it will be exposed to less thermal and mechanical stresses. In this framework, a comparison of FFF and PBAM for a wide material pallet is interesting. Recently La Gala et al. [32] put forward a comparison for ABS and poly(lactic acid) (PLA), highlighting the need to optimize PBAM conditions. This can explain the differences between the results of Gradwohl et al. [33], reporting for poly(lactic-co-glycolic) (PLGA) a stronger degradation with PBAM attributed to a longer residence time, and the results of La Gala et al. [32] reporting a more pronounced degradation of ABS manufactured via FFF in comparison with PBAM.
It should be stressed that the few EAM degradation studies mostly deal with FFF only. For example, Fernandez et al. [34] assessed the influence of printing parameters on the performance of different copolyesters. The authors explained how the combination of a high printing temperature and a low printing velocity can lead to degradation if the chemical structure is prone to chemical modifications. However, the extent of degradation did not result in a reduction in the macroscopic properties, as the coalescence between deposited layers was slightly improved at higher temperatures. Similarly, the study of Jagenteufel et al. [35] put forward that the printing process of ABS, PLA and polypropylene (PP) via FFF led to negligible degradation. However, no reports on the very systematic variation in FFF and PBAM parameters and the degradation degree of the material exist. A non-trivial optimization is also expected as increasing the printing speed could lead to less degradation, but detrimental effects on the quality of the 3D printed part are likely caused above a threshold printing speed. In addition, the best operating window is likely material dependent, and different for FFF and PBAM. A more detailed focus on degradation mechanisms and degrees is thus relevant, bearing in the mind the rather new nature of FFF and PBAM and their potential use for recycling purposes [36,37,38]. Defining and developing processing pathways which induce less degradation in the material is important to propitiate a more sustainable approach to polymer production [39,40].
In the present work, we investigate the effect of the most relevant EAM parameters on the degradation of both PS and ABS. The influence of the FFF printing temperature, layer thickness and printing velocity on the degradation of PS and ABS is assessed via rheological analysis, size exclusion chromatography (SEC) analysis and Fourier Transform infrared spectroscopy (FTIR), to indicate the changes of the molecular properties. Under defined conditions, the same analysis is then carried out for PBAM samples, and the results are compared. The degradation during manufacturing is correlated with macroscopic properties as well. It is highlighted that the molecular degradation mechanism is different under PBAM and FFF conditions for PS and ABS.
2. Materials and Methods
2.1. Materials
Two amorphous styrene-based commercially available polymers were used: (i) general purpose ABS (Terluran GP-22, INEOS, London, UK) with a density of 1040 kg m−3, as obtained by emulsion polymerization, with a glass transition temperature (Tg) of 100 °C; and (ii) a conventional polystyrene (PS) (441147, Sigma Aldrich, St. Louis, MO, USA) with a density of 1040 kg m−3 and Tg of 100 °C. Furthermore, tetrahydrofuran (THF; CL00.2027, Chem-Lab, Zedelgem, Belgium) was used in the SEC analysis.
2.2. Sample Preparation
Filament Fabrication
ABS and PS filaments for FFF were produced using a single screw extruder (SSE) (Brabender 19, 19 mm screw diameter, length over diameter ratio (L/D) of 25, Brabender, Duisburg, Germany). A rolling system and spooling device developed in-house were used to pool the extrudate into a filament with a controlled (average) diameter of 1.75 mm, and to wind it for further FFF application. The processing parameters used are described in Table 1.

Table 1.
Extrusion parameters used for producing ABS and PS filaments.
Prusa printers (Prusa i3 MK3S+, Prusa, Prague, Czech Republic) were employed to manufacture a set of tensile specimens for examination of the influence of the nozzle temperature, layer thickness and printing velocity and their combination on the degradation and tensile properties of PS and ABS specimens. The samples were named as follows: “Material_Nozzle Temperature_Layer Thickness_Printing Velocity_Processing Route” and are described for the FFF case in Table 2. The nozzle temperatures were 220 and 270 °C for ABS; and 240 and 270 °C for PS; the layer thicknesses were 0.15 and 0.25 mm; and the print velocities were 40 and 120 mm s−1. Fixed printing parameters used to produce the specimens were 100% infill, with a rectilinear pattern and 45° infill angle, a nozzle with 0.4 mm diameter, a bed temperature of 110 °C, and an XYZ build pattern (parallel to the bed). To prevent warpage of PS parts, a 2 mm brim was initially printed and removed later.

Table 2.
Samples produced via FFF.
Tensile specimens of both ABS and PS were also produced via pellet-based additive manufacturing (PBAM). Pellets of ABS and PS were directly fed into a PBAM system developed in-house [10], with the printing parameters shown in Table 3. Furthermore, the bed temperature was set to 110 °C, the layer thickness to 0.25 mm, the nozzle diameter to 0.4 mm, and the printing velocity to 40 mm s−1. An overview of the samples produced via PBAM is provided in Table 3.

Table 3.
Samples and printing parameters used in PBAM system.
Pellets, filaments and a part of the tested tensile specimens of ABS and PS were chopped and compression molded for further characterization via rheological testing, size-exclusion chromatography (SEC), and Fourier-transform infrared (FTIR) spectroscopy. The samples were prepared in a disk-like shape with 1 mm thickness and 25 mm diameter at 220 °C, using a hot press. The materials were pre-heated for 5 min and then compression molded for 5 min. They were cooled under environmental conditions.
2.3. Characterization
2.3.1. Thermal Stability of Raw Materials
The thermal stability was assessed by thermogravimetric analysis (TGA) in a Netzsch (Selb, Germany) Simultaneous thermal analysis (STA 449 F3 Jupiter) equipment in the TGA mode, under nitrogen atmosphere. Dynamic runs were carried out from 30 to 600 °C with a heating rate of 10 °C min−1. Isothermal runs were performed for 2000 s at 220 and 270 °C for ABS, and at 240 and 270 °C for PS, which reflects the processing temperatures used to 3D print the materials (see Table 2 and Table 3).
To further assess the thermal stability, rheological time sweep tests were carried out in a rheometer (MCR 702, Anton Paar, Graz, Austria) for 2000 s at 220 and 270 °C for ABS, and at 240 and 270 °C for PS. The parallel plate configuration was used (25 mm in diameter and 1 mm in gap), with a frequency of 1 rad s−1 and a strain amplitude of 1%, under nitrogen atmosphere.
2.3.2. Degradation Analysis
The influence of processing steps on the degradation of the materials employed in the present work was done by means of linear viscoelastic characterization of the pellets, filaments and specimens produced via additive manufacturing (FFF and PBAM), SEC and FTIR.
Linear Viscoelastic Properties
The linear viscoelastic characterization of the materials was performed in a rheometer (MCR 702, Anton Paar, Graz, Austria) by means of small amplitude oscillatory shearing tests (SAOS), using the parallel plate configuration (25 mm in diameter and 1 mm in gap). Frequency sweep tests of pellets, filaments and tested tensile specimens (sample preparation as described in Section 2.2—Compression molding) were carried out at 220 °C, with a strain amplitude of 1%, from 600 to 0.1 rad s−1, under nitrogen atmosphere.
Size-Exclusion Chromatography
A PL-GPC 50 Plus instrument with an autosampler and a refractive index (RI) detector was used to perform SEC analysis. The set-up is equipped with a 50 × 7.5 mm Resipore guard column followed by two Resipore 300 × 7.5 mm columns in series (Agilent Technologies, Santa Clara, CA, USA). Tetrahydrofuran (THF; flow rate of 1 mol min−1) was used as eluent. The temperature of the column compartment was maintained at 30 °C. Calibration was performed using narrow polystyrene standards (Medium EasiVials kit, Agilent Technologies, Santa Clara, CA, USA) in the 1.62 × 10² to 4.83 × 10⁵ g mol−1 range.
Fourier-Transform Infrared Spectroscopy
FTIR analysis was carried out in a spectrometer (Tensor 27, Bruker, Billerica, MA, USA) in the attenuated total reflection mode (ATR). The investigated spectral range was from 4000 to 600 cm−1, with a resolution of 4 cm−1. Values of absorbance were determined using the baseline method. For ABS, attention is paid to the absorbance peaks of C=C bonds with different configurations, specifically, the 1,2-butadiene monomer unit at 911 cm−1 and the 1,4 butadiene monomer unit at 966 cm−1, as they may decrease gradually because of the PB phase degradation. These peaks were compared with the absorbance peaks of (unmodified) nitrile entities, which are not expected to change, at 2237 cm−1 using the absorption ratios R1 to R2, as defined by Equations (1) and (2) [41,42,43].
For PS, all the spectra were normalized to the peak at 1606 cm−1, which corresponds to the in-plane stretch of the C=C bonds in the aromatic ring or other conjugated double bonds [44].
2.3.3. Color Variations, Mechanical Properties and Morphology
Yellowness Index
The color measurements were performed with a spectrophotometer (UltraScan VIS, HunterLab, Reston, VA, USA) using a D65 light source and 10° viewing angle. All color measurements were obtained from compression molded specimens. The yellowness index (YI) was obtained by the International Commission on illumination (CIE) tristimulus values X, Y and Z according to the CIELAB color system, and determined according to Equation (3) [45].
Tensile Tests
Tensile tests were carried out using a universal testing machine (5565, Instron, Norwood, MA, USA) with a 10 kN load cell, following ISO 527 with 1BA specimens. The tests were conducted in a controlled environment under an atmosphere of 23 °C and 50% relative humidity.
Morphological Analysis
The fracture morphology of a mechanically tested specimen was assessed via scanning electron microscopy (SEM) via a Phenom Pro Desktop (ThermoFischer Scientific, Waltham, MA, USA). The specimens were sputtered with a 7 nm thin layer of gold prior to imaging.
2.3.4. Statistical Analysis
A factorial design 23 (three factors, two levels of each factor) was conducted to evaluate the influence of each factor and their interactions on the complex viscosity (│η*│) of ABS and PS, and on the melt yield stress of ABS (σ0) produced via FFF, employing analysis of variance (ANOVA). Factor A represents the printing temperature (levels: 220 or 270 °C for ABS and 240 or 270 °C for PS), Factor B represents the layer thickness (levels: 0.15 or 0.25 mm), and Factor C represents the print velocity (levels: 40 or 120 mm s−1). The values of the factors were codified according to the level of each factor, i.e., −1 for the lower level and +1 for the higher level. Two replications of each experiment were done, reflecting the sources of variability both between runs and within runs [46]. The order of the mixtures within each replication was randomized. The results obtained were compared using the Tukey’s test, which indicates if there is a significant difference between the average results of two populations [46]. A conventional significance level (α) of 0.05 was considered.
3. Results
First emphasis is the thermal stability of ABS and FFF feedstock (raw) materials in view of their 3D printing, considering TGA and basic rheological analysis. This more conventional analysis up to longer times is further supported by dedicated rheological, SEC and FTIR analysis to obtain more molecular scale driven insights under actual processing conditions, e.g., shorter analysis times. In a final stage, attention is paid to color, mechanical and morphological changes, always comparing FFF and PBAM. Specific emphasis is on the assessment of the impact of mechanical and thermal contributions to the degradation pattern.
3.1. Conventional Thermal Stability of Feedstock Materials
The thermal stability of the feedstock materials for EAM must be assessed to assure that the printing temperature is sufficiently below their degradation temperature. The dynamic and isothermal TGA variations for raw PS and ABS material are shown in Figure 1. According to the curves obtained in the dynamic mode (Figure 1a), the degradation of the tested materials has an onset temperature of 404 and 397 °C for ABS and PS, respectively. The temperature of 1% mass loss (T1%) further indicates the thermal stability of the materials and is as high as 310 and 336 °C for ABS and PS, respectively. This means that no major degradation should be seen under the chosen processing temperatures used in the present work (Table 1).
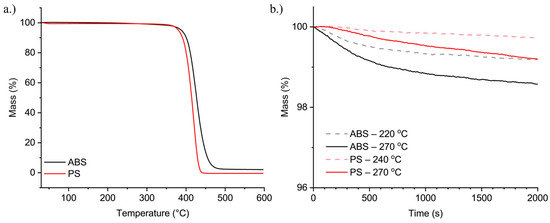
Figure 1.
Thermogravimetric analysis of PS and ABS in: (a) dynamic; and (b) isothermal mode.
The isothermal TGA results in Figure 1b indicate that at the final time of 2000 s ABS experienced a mass decrease of 0.82 and 1.43% at 220 and 270 °C, respectively. For PS, at the same testing time, both test conditions promoted a mass decrease under 1% so that care should be taken for translation of non-isothermal findings in isothermal results, with the former showing more degradation. Notably, at the lowest time in Figure 1b (300 s) the changes in the mass are always minor and the chosen processing parameters (Table 1; below 300 s) should be suitable for both materials. The mass variation with time under the test conditions is also shown in table format in the Supporting Information (Table S1).
Supplementary to the thermal tests, low frequency rheological time sweep tests allow us to assess the stability of the feedstock materials. Specifically, monitoring the complex viscosity (|η*|) over time can give insights on irreversible structural changes in the polymers [47], e.g., caused by chemical reactions that promote cross-linking, branching, or chain fission. The complex viscosity was obtained as a function of time and normalized by the first measured value after 15 s of testing (|η*|15). The normalized complex viscosity (|η*|t/|η*|15)) is shown in Figure 2.
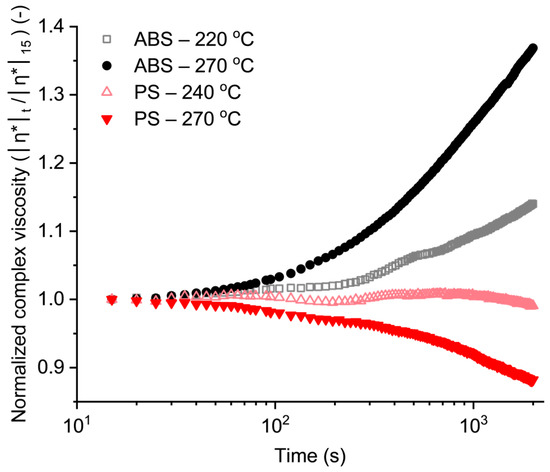
Figure 2.
Time sweep plots complementary to Figure 1; normalized with the first recorded value.
Figure 2 shows that ABS exhibits at both 240 and 270 °C an increase in the normalized complex viscosity at both test temperatures, but more pronouncedly at 270 °C. This is attributed to the degradation of the PB phase, leading to cross-linking. In the initial stages of ABS degradation it has been indicated that the PB phase is attacked and unsaturated groups are consumed forming hydroperoxides, which in turn decompose and promote the formation of cross-linked structures [48]. Some level of oxygen is thus assumed to be present in the samples under this premise, giving rise to thermo-oxidation of the PB phase. In contrast, PS is stable at 240 °C with a constant normalized viscosity throughout the test, indicating that no structural changes are happening at this temperature, which agrees with the TGA data of Figure 1b. At 270 °C, PS exhibits even a decrease in the normalized complex viscosity, as a result of degradation via chain fission [49]. As the isothermal TGA (Figure 1b) results indicate negligible mass loss, we can assume a limited contribution of random chain fission [50] and only a small fraction of low molar mass compound formation.
Overall, Figure 2 indicates that PS and ABS are likely very stable at the processing temperatures selected, especially for at least 40 s upon considering the higher processing temperatures. Due to the short residence times in AM, the actual printing processing step should not induce dedicated material degradation so that the materials should be suitable for printing. Still, it must be kept in mind that these tests only account for the thermal stability of the materials, e.g., not mechanical stresses. Furthermore, in the case of FFF the filament already underwent a processing step, which may have already caused changes in its chemical structure. Therefore, further degradation analysis is needed to fully assess the effects of each step along the manufacturing chain.
3.2. Detailed Rheological, Size Exclusion Chromatography and Fourier Transfer Infrared Spectroscopy Analysis for Stability under Processing Conditions
The effect of the filament manufacturing via single screw extrusion (SSE), the 3D printing via FFF, and the FFF processing parameters (printing temperature, layer thickness and printing velocity) on the complex viscosity of ABS and PS are shown as a function of the angular frequency in Figure 3. The results for the raw materials are added in all graphs for comparison. In the case of ABS printed at 220 °C (Figure 3a) and at 270 °C (Figure 3b), no major differences can be seen. This indicates a limited amount of structural changes as a result of processing, including the filament fabrication, consistent with the work of Jagenteufel et al. [35]. Even though the time sweep tests (Figure 2) show an increase in the complex viscosity of ABS with time, the materials have now been subjected to thermal and mechanical stresses. The latter stresses may have caused a certain level of chain fission, which decreases the viscosity and average molar mass of the material, compensating cross-linking increases. In contrast, in the case of PS (Figure 3c,d), it is clear that the processing leads to structural changes (with lower chain lengths) because of degradation. The filament fabrication reduces the complex viscosity of PS, which is further decreased after the FFF process, especially if the material is processed at 270 °C.
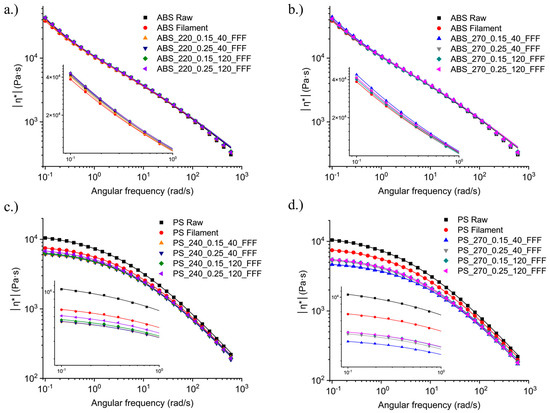
Figure 3.
Effect of processing steps and processing parameters on the complex viscosity of ABS printed at (a) 220 °C and (b) 270 °C and of PS printed at (c) 240 °C and (d) 270 °C. Symbols: experimental data points, lines: modified Carreau–Yasuda fitting.
As discussed elsewhere [51,52,53,54], ABS may exhibit a plateau for its storage modulus (G’) in the low-frequency regime, indicating a non-terminal behavior and an apparent yield stress, which is consistent with the increase in the complex viscosity in this regime (see also different curvature in Figure 3 top row (ABS) compared to bottom row (PS)). This non-terminal behavior is related to the contribution of the interfacial interactions involving the (grafted) rubber phase (PB-g-SAN) to the overall elastic response of the material. Due to this non-terminal behavior, the traditional models for fitting the polymer viscosity curve are unsuitable and instead the complex viscosity data in the present work (Figure 3 top row; ABS) have been described by a modified Carreau–Yasuda model (lines in Figure 3) [55]:
where σ0 is the melt yield stress, η0 the zero-shear viscosity, λ the relaxation time, n the power law index, and a the Yasuda parameter. As PS (lines in bottom Figure 3) does not exhibit an apparent yield stress, Equation (4) then becomes the regular Carreau–Yasuda model. The fitting parameters for ABS and PS are presented in Table 4.

Table 4.
Parameters of complex viscosity fitting to the modified Carreau–Yasuda model for ABS Equation (4) and PS samples (Equation (4) with no σ0); Results for both fused filament fabrication (FFF-) and pellet-based additive manufacturing (PBAM); before FFF a conventional single screw extrusion (SSE) is performed.
An inspection of the fitting parameters in Table 4 allows a better understanding of the structural changes that occurred in both materials due to processing. In the case of ABS, the experimental complex viscosity data in Figure 3a,b seem at first sight not to change much after the different processing steps. However, the fitting results depict a decrease in the zero-shear viscosity in the steps of both filament production and 3D printing. The zero-shear viscosity decreases around 7% after the filament fabrication and from 15 to 25% after FFF, compared to the raw material. The melt yield stress in turn first decreases in the filament fabrication step, but after FFF the materials exhibit an increase as high as 12% with respect to the raw material. The reduction in the viscosity of ABS can be related to chain fission of the main chains [56] so that the contribution of the PB-g-SAN phase becomes more pronounced, increasing the melt yield stress. Moreover, the oxidation of the grafted PB can lead to a de-grafting of SAN, which can be one of the reasons for the decrease in the zero-shear viscosity [56].
For PS, the filament fabrication rather strongly reduces the zero-shear viscosity of the raw material by 31% (see entries 13 and 14 in Table 4). If the printing processing has been carried out at 240 °C, the decrease in the viscosity ranges from −39 to −45% compared to the raw material and from −10 to −20% compared to the filament (see entries 15, 17, 19 and 21 in Table 4). Even more pronounced degradation occurs if PS is printed at 270 °C, with viscosity values −50 to −59% lower than the raw material and −28 to −40% lower than the filament (see entries 16, 18, 20 and 22 in Table 4). This indicates that at 240 °C, the most critical step in the degradation of PS is the filament fabrication, whereas at 270 °C both the SSE and FFF step lead to major changes in the structure.
For all FFF data in Table 4, λ decreases with processing steps, and a and n slightly increase with the processing steps. The same has been reported by Berzin et al. [57] upon studying the controlled degradation of PP during extrusion. The relaxation time λ is directly related to the average molar mass of the polymer [58] so it is logical that it follows the same trend of the complex viscosity, for (ABS and) PS processed via FFF. An increase in n indicates that the material linear viscoelastic behavior is closer to the conventional Newtonian behavior, with the shear-thinning effect being less pronounced. This has been attributed to the decrease in the average molar mass and narrowing of dispersity of the polymer [57,59].
The ANOVA results for the zero-shear viscosity of FFF specimens allow us to conclude that the only significant factors are the printing velocity for ABS (p-value < 0.05) and the printing temperature for PS (p-value < 0.002); the other p-values can be seen in Table S2 of the Supporting Information. Lower printing velocities result in a lower zero-shear viscosity in the case of ABS, and high printing temperatures result in a lower zero-shear viscosity for PS. The (ABS) melt yield stress was, although not significantly affected by any of the ANOVA factors, showing that the changes for this property are quite limited and consistent with the very similar data points at low frequencies.
The measured complex viscosity variations for ABS and PS printed via the second AM technique PBAM are shown in Figure 4 (open symbols). The plots of the raw materials, filaments and specimens printed via FFF under similar conditions are included for comparison. The fitting parameters of the complex viscosity (lines in Figure 4) are again shown in Table 4. For the PBAM printed ABS, the complex viscosity variations in Figure 4a show that these samples exhibit somewhat higher values than the raw material and filaments. An analysis of the fitting parameters in Table 4 indicates a completely different trend than the one observed for the FFF printed specimens. Compared to the raw material, the melt yield stress decreases by 23 and 15%, and the viscosity increases by 35 and 81in case the material has been printed at 220 and 270 °C, respectively. This suggests that the printing conditions such as shear rate, residence time and presence of residual oxygen, have resulted under PBAM conditions in a completely different structural changes for ABS. The increase in viscosity may be related to the cross-linking formation in the PB-g-SAN phase of ABS. As the screw speed used to produce specimens via PBAM is 0.8 rpm, which is significantly lower than the one used to process the feedstock (raw material) for FFF (27 rpm), the mechanical stresses related to PBAM are lower than the ones used to manufacture the feedstock. Hence, cross-linking in the PB-g-SAN phase is predominant over chain fission under PBAM conditions.
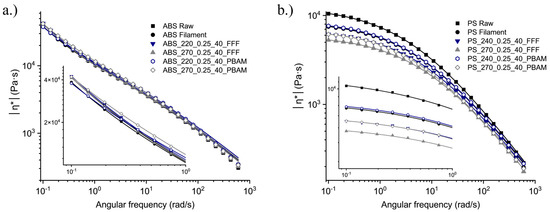
Figure 4.
Effect of type of printing technique on the complex viscosity of: (a) ABS; and (b) PS. The lines represent the (modified) Carreau–Yasuda fitting.
In the case of PS, as shown in Figure 4b, the PBAM process leads to less structural variations than the FFF process. If processed at 240 °C via PBAM, the complex viscosity plot overlaps the curve for the filament manufactured via SSE. If processed at 270 °C via PBAM, the complex viscosity plot still overlaps the one for the FFF printed specimen at 240 °C. The reduction in the zero-shear viscosity in Table 4 is 30% and 45% for the materials printed via PBAM, compared to the raw material. Even though structural changes still happened, their effect is thus less pronounced in PBAM compared to FFF.
To further establish correlations between the processing conditions and the polymer structure, SEC traces have been obtained for all the materials (raw, filament, and after FFF and PBAM). The corresponding values of the mass average molar mass (Mm) and dispersity (Đ) are shown in Table 5. ABS specimens show a decrease in Mm, from the raw material to the filament, with a further decrease after FFF processing. The dispersity is increased from the raw material after the first processing step (from 1.36 to 2.16), and after FFF it ranges from 2.04 to 2.12. The ABS samples produced via PBAM presented fractions that could not be dissolved, indicating cross-linking. The Mm results for these ABS samples in Table 5 therefore only account for the soluble fraction and cannot be directly correlated with the rheological tests. However, the already discussed increase in the zero-shear viscosity for PBAM samples is compatible with the cross-linking formation assumption, again indicating that this processing route leads to a different degradation mechanism of the material compared to FFF.

Table 5.
Mass average molar mass (Mm) and dispersity (Đ) for ABS and PS raw material, their filaments and after printing via FFF and PBAM; only soluble fraction for ABS.
Regarding PS, the trends for Mm in Table 5 confirm the rheological testing results. Mm decreases 8% from the raw material to the filament and a further decrease is observed after the FFF process, especially at 270 °C, with decreases ranging from 9 to 15%. For the PBAM processed specimens, the decrease in Mm is only 5% and 11% for the specimens processed at 240 and 270 °C, respectively. This again puts forward the reduced structural changes in PS if processed via this route. For completeness it is mentioned here that no major trends are noticed for the dispersity in Table 5, so it is likely the variations in n are related to Mm variations only.
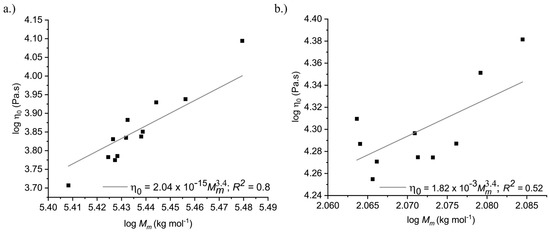
The scaling of with Mm for ABS and PS is shown in Figure 5, and is based on the well-known equation for linear polymers: [60], in which K is a proportionality factor and α = 3.4. For ABS (Figure 5a), the values for the PBAM samples are not included to increase the correlation potential; however, a rather weak correlation between both properties is still observed as evident from a low coefficient of determination R2. It should although be admitted that the Mm variation range is rather small compared to a standard range to identify a 3.4 type of power. The data for the ABS FFF samples are also rather scattered, revealing that the FFF process does not lead to very clear systematic variations, even though both properties are decreased after this processing step. In contrast, as shown in Figure 5b, PS samples exhibit a stronger correlation between both properties, indicating that the processing parameters strongly influenced the degradation. This is also obvious from the larger Mm range in Figure 5b compared to Figure 5a.
Further analysis is possible via the consideration of FTIR results. Consistent with literature data [61], important peaks can be assigned for raw PS and ABS, as shown in Figure 6. For the other samples, the spectra are included in the Supporting Information (Figure S1). Because styrene is present in both PS and ABS, several peaks are shared between these materials including two aliphatic CH stretching signals at around 2920 and 2850 cm−1, 3 to 5 aromatic CH stretching signals between 3000 and 3100 cm−1 and two aromatic CH wagging signals at approximately 700 and 750 cm−1, with the second one at one third of the height of the first one. ABS presents extra peaks, which are attributed to triple CN bond of the acrylonitrile group at 2237 cm−1 and two peaks that refer to the PB phase. They are centered at 965 and 910 cm−1, and represent stretches regarding CH in trans butadiene and CH2 in vinyl butadiene [62].
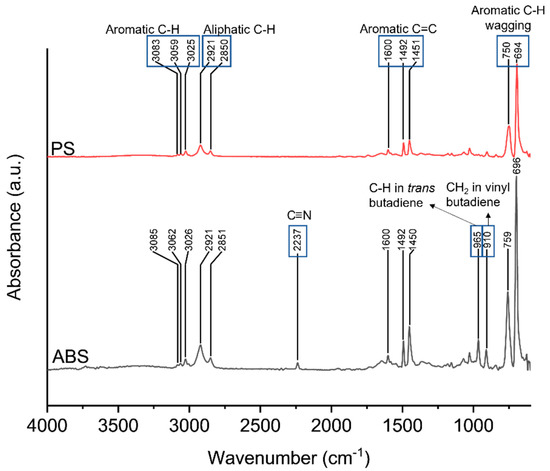
Figure 6.
Most important peak assignments for raw PS and ABS material in the Fourier Transform infrared spectra.
To assess the degradation of the PB phase in ABS it has been recommended to mainly inspect the variation in the ratios R1 and R2 (Equations (1) and (2)) [41], with the results in the present work shown in Figure 7. Upon comparing the results for the filament and samples prepared via FFF and PBAM with the raw material, no (clearly) statistically significant differences are seen for both R1 and R2, highlighting that FTIR can be less sensitive than rheological analysis.
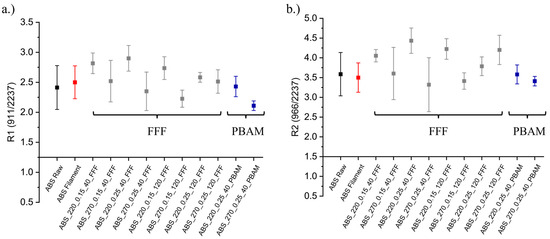
Figure 7.
Measured Fourier Transform Infrared (FTIR) ratios for the ABS raw material, filament, samples manufactured via FFF and via PBAM. (a) Equation (1) and (b) Equation (2); colors as guide of the eye to identify raw materials from processed materials.
It is interesting to evaluate oxygen-related FTIR peaks [63] as well, noting that such moieties may also be due to the presence of additives [64,65]. Originally, ABS and PS have no hydroxyl (~3296 cm−1) or carbonyl groups (~1723 cm−1), nor peaks in the region of C-O stretching vibrations (~1000–1300 cm−1). Nevertheless, it has been indicated that thermo-mechanical degradation may induce several reactions that can be responsible for the appearance of a wide range of oxidative moieties [63,66]. Due to the limited amount of oxygen in the polymer melt, it is at first sight unlikely that radicals are easily converted in peroxy radicals [67], so that the FTIR spectra may present no (significant) changes regarding the peaks of hydroxyl, carbonyl or other C-O stretches. Indeed, in the present work, no major changes are found for ABS, as shown in Figure 8a for the carbonyl region and in the Supporting Information for the hydroxyl and C-O stretches regions (Figure S2). However, in previous work [32], FTIR spectra of mass polymerized ABS samples manufactured via FFF and PBAM have been compared and samples prepared via FFF displayed larger peaks around 1250 and 1750 cm−1, which regards C=O and C-O stretches in ester moieties, indicating the more pronounced degradation of ABS via FFF. This can be related to the different processing conditions in that work or to the different type of ABS (mass polymerized vs. emulsion polymerized).
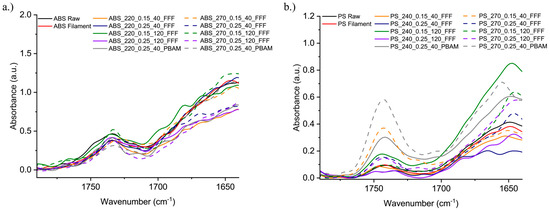
Figure 8.
Carbonyl stretches region on FTIR spectra of: (a) ABS; and (b) PS samples.
For PS, no major differences in the hydroxyl groups band have been detected (see Figure S3 of the Supporting Information). The carbonyl group region, however, exhibited differences between the specimens, as is clear from the zoomed wavenumber range in Figure 8b. A clear increase is observed for the carbonyl absorption band at 1743 cm−1. Upon studying thermal and mechanical degradation of PS via FTIR in air, D’Esposito et al. [68] also found a prominent peak around 1730 cm−1 attributed to an aldehydic compound. Between 1656 and 1644 cm−1 an increase in the absorption peak can also emerge because of a disproportionation reaction leading to double bond formation [68]. Furthermore, the sample PS_270_0.15_40, showing the biggest drop in the mass average molar mass and viscosity, exhibits the highest peak among FFF samples. This indicates a higher level of degradation for the highest temperature and longer residence time.
3.3. Analysis of Variations in Color, Mechanical Properties and Morphology
One of the possible outcomes of degradation due to processing is yellowing [56,63,69]. Such discoloration is attributed for the formation of carbonyl substituents during thermo-oxidative degradation, although as in the present work a yellowing is not automatically captured FTIR sensitivity wise specifically for low oxygen contents (cf. Figure 7 and Figure 8). It should be realized that a color change is likely undesirable and may limit the range of applications of the materials, especially in case aesthetics are important. A visual inspection of the ABS specimens produced via FFF and PBAM, as incorporated in Figure 9, confirms the yellowing due to processing. This feature is more pronounced for the specimens produced via FFF at 270 °C, whereas PS samples did not show any visual color changes, as can be seen in Supporting Information (Figure S4).
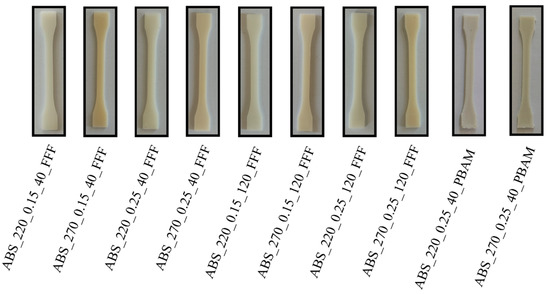
Figure 9.
Variation in the color of ABS specimens produced via FFF and PBAM.
The ABS yellowing has been quantified by means of the yellowness index (YI), as shown in Figure 10. Every processing step (SSE, SSE + FFF or PBAM) leads to an increase in the YI of the ABS specimens. After filament production (SSE), the YI value increased by 33%. For FFF an increase in YI ranging from 60 to 90% and from 132 to 260% is measured for samples processed at 220 and 270 °C, respectively, putting forward that a two-step processing enables more opportunity for thermo-oxidation. This is somewhat supported only by specimens produced via PBAM at 220 °C exhibiting an increase in the YI like the FFF samples, whereas at 270 °C the YI of a specimen printed via PBAM is 20% lower than its counterpart produced via FFF, being in the range of samples processed at 220 °C. Under PBAM conditions, more thermal degradation likely takes place and thus less thermo-oxidative degradation. One of the factors causing yellowing in ABS samples during processing is the oxidation of the PB phase [56]. As an example, mass polymerized ABS usually shows a lower YI than emulsion polymerized ABS due to its lower PB content [41]. The FFF sample ABS_270_0.15_40 shows the highest increase in the YI, which might be due to a combination of a high temperature and longer residence time (lower printing velocity and layer thickness), indicating a higher level of degradation for this specimen. Even though no major changes are seen in the FTIR spectra of ABS, the yellowing indicates that some level of degradation occurred.
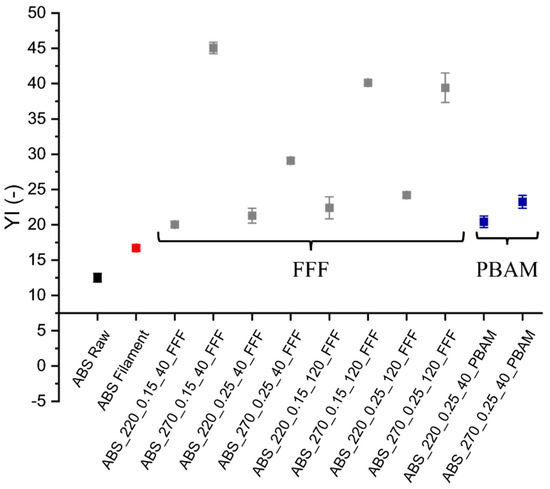
Figure 10.
Yellowing index (YI) for ABS raw material, filament, specimens manufactured via FFF and via PBAM: colors as guide of the eye to identify raw materials from processed materials.
The tensile strength results for additively manufactured ABS and PS are shown in Figure 11 (raw data in Table S3 of Supporting Information). The tensile strength of ABS produced via FFF is mostly affected by the layer thickness. Printing with a small layer thickness yields the highest values of tensile strength. This is probably due to the increase in the exit contact pressure [70], which forces the layers into a more intimate contact, improving the bond strength between the deposited filaments. Printing at higher temperatures lead to similar or slightly lower results for tensile strength, while the printing velocity did not show specific trends.
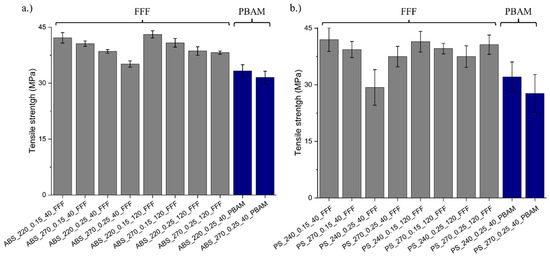
Figure 11.
Comparison of tensile strength of: (a) ABS; and (b) PS specimens printed via FFF and PBAM.
The latter trend is not captured for PS samples. If both techniques (FFF and PBAM) are compared, at 240 °C, the results for tensile properties are similar, while a decrease in the tensile strength is seen for the PS printed via PBAM at 270 °C. This suggests that the best (FFF) printing parameters for PS are printing with a low layer thickness, lower temperature, and a high printing velocity. Furthermore, printing PS with PBAM under such conditions may be an alternative to further reduce degradation.
The results for the tensile modulus and strain at break are, for completeness, included in the Supporting Information (Table S2), together with the stress–strain curves for ABS and PS samples (Figures S5 and S6, respectively). The tensile modulus of ABS and PS are not influenced by the printing parameters and printing technique, as no statistically significant differences are seen between the samples. The same is observed for the strain at break of samples produced via FFF. Nevertheless, samples produced via PBAM usually exhibit lower strain at break than FFF samples. For instance, ABS samples manufactured via PBAM exhibit a decrease in this property of 50 and 52%, if printed at 220 and 270 °C, respectively. A similar trend in strain at break for ABS has been reported by La Gala et al. [32]. A reduction in the strain at break in ABS specimens has been attributed to the degradation of the PB phase [63]. However, since no major changes in FTIR and YI data are perceived between FFF and PBAM ABS in the present work, it is likely that this is due to a lower bond strength between the deposited filaments, leading to premature failure of the specimens. Furthermore, for PS, a decrease of 46% of strain at break is seen for the sample printed at 270 °C via PBAM compared to FFF. Hence, it is worthwhile improving the actual PBAM process from a deposition point of view.
Fracture surfaces of tensile tested ABS and PS produced via FFF and PBAM are included in Figure 12, to better interpret the variations in mechanical results obtained via both techniques. For ABS printed at 220 °C, the interface between layers is more noticeable and the coalescence level is lower, supporting the hypothesis of a lower bond strength for these specimens, specifically for the PBAM technique. For PS printed at 240 °C, both morphologies are similar and both techniques yield similar mechanical results. For the materials printed at 270 °C, the specimens produced via PBAM present a rougher structure, highlighting the relevance of a PBAM temperature optimization in future work. For PS, it can be stated that PBAM, as conducted in the present work, is already a suitable alternative to produce parts with less undesired structural changes and similar properties than FFF in case the printing temperature is 240 °C.
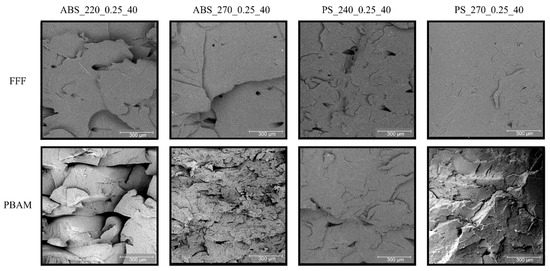
Figure 12.
Scanning electron microscopy (SEM) micrographs of tensile fractured ABS and PS specimens produced via FFF and PBAM.
4. Conclusions
The influence of printing temperature, layer thickness, printing velocity and printing technique on the degradation of ABS and PS has been assessed and compared for FFF and PBAM. For ABS, manufacturing samples via FFF with prior filament production (SSE) are characterized by a different degradation mechanism (more fission) than manufactured samples via PBAM (more cross-linking). This has been deduced by different variations in the zero-shear viscosity, melt yield stress and molar mass, due to the lower mechanical stresses employed in PBAM and thus a more thermally driven degradation. Even though no clear differences in the FTIR spectra have been noticed, the YI measurements show that samples produced via FFF at higher temperatures present a higher level of degradation. Hence, care should be taken upon using (ABS) FTIR data ignoring potential sensitivity issues.
For PS, FFF with prior SSE promotes a higher level of degradation according to the same mechanism compared to PBAM, as is clear from more significant zero-shear viscosity and average molar mass decreases. PBAM can even be preferred over FFF, as the mechanical layer-by-layer properties are also acceptable under the selected printing conditions. For ABS, further optimization of such PBAM conditions is still needed aslikely too much cross-linking is still active under the currently selected conditions.
In addition to the optimization of the PBAM process, other materials of interest for extrusion-based additive manufacturing could be tested to obtain more insights on the degradation during 3D printing via both techniques.
Supplementary Materials
The following supporting information can be downloaded at: https://www.mdpi.com/article/10.3390/su142315488/s1.
Author Contributions
Conceptualization, D.V.A.C., M.E. and D.R.D.; methodology, D.V.A.C., Y.W.M., M.E., L.C. and D.R.D.; formal analysis, D.V.A.C. and A.L.G.; investigation, D.V.A.C., Y.W.M., M.E., L.C. and D.R.D.; resources, L.C.; writing—original draft preparation, D.V.A.C.; writing—review and editing, D.V.A.C., Y.W.M., M.E., A.L.G., L.C. and D.R.D.; supervision, L.C. and D.R.D. All authors have read and agreed to the published version of the manuscript.
Funding
This research was funded by the Special Research Fund (Bijzonder Onderzoeksfonds—BOF) of Ghent University, under a Concerted Research Actions Project (Geconcerteerde onderzoeksacties—GOA) under the number BOF.GOA.2018.0002.03.
Data Availability Statement
Data are available upon reasonable request to the corresponding author.
Conflicts of Interest
The authors declare no conflict of interest.
References
- Turner, B.N.; Strong, R.; Gold, S.A. A review of melt extrusion additive manufacturing processes: I. Process design and modeling. Rapid Prototyp. J. 2014, 20, 192–204. [Google Scholar] [CrossRef]
- Penumakala, P.K.; Santo, J.; Thomas, A. A critical review on the fused deposition modeling of thermoplastic polymer composites. Compos. Part B Eng. 2020, 201, 108336. [Google Scholar] [CrossRef]
- Volpato, N.; Kretschek, D.; Foggiatto, J.A.; Gomez da Silva Cruz, C.M. Experimental analysis of an extrusion system for additive manufacturing based on polymer pellets. Int. J. Adv. Manuf. Technol. 2015, 81, 1519–1531. [Google Scholar] [CrossRef]
- La Gala, A.; Fiorio, R.; Erkoç, M.; Cardon, L.; D’hooge, D.R. Theoretical evaluation of the melting efficiency for the single-screw micro-extrusion process: The case of 3D printing of abs. Processes 2020, 8, 1522. [Google Scholar] [CrossRef]
- Moreno Nieto, D.; Casal López, V.; Molina, S.I. Large-format polymeric pellet-based additive manufacturing for the naval industry. Addit. Manuf. 2018, 23, 79–85. [Google Scholar] [CrossRef]
- Wang, S.; Daelemans, L.; D’hooge, D.R.; Couck, L.; Van Den Broeck, W.; Cornillie, P.; Gou, M.; De Clerck, K.; Cardon, L. Lifting the quality of fused filament fabrication of polylactic acid based composites. Compos. Part B Eng. 2021, 210, 108613. [Google Scholar] [CrossRef]
- Mohamed, O.A.; Masood, S.H.; Bhowmik, J.L. Optimization of fused deposition modeling process parameters: A review of current research and future prospects. Adv. Manuf. 2015, 3, 42–53. [Google Scholar] [CrossRef]
- Ngo, T.D.; Kashani, A.; Imbalzano, G.; Nguyen, K.T.Q.; Hui, D. Additive manufacturing (3D printing): A review of materials, methods, applications and challenges. Compos. Part B Eng. 2018, 143, 172–196. [Google Scholar] [CrossRef]
- Van Waeleghem, T.; Marchesini, F.H.; Cardon, L.; D’hooge, D.R. Melt exit flow modelling and experimental validation for fused filament fabrication: From Newtonian to non-Newtonian effects. J. Manuf. Process. 2022, 77, 138–150. [Google Scholar] [CrossRef]
- La Gala, A.; Fiorio, R.; Ceretti, D.V.A.; Erkoç, M.; Cardon, L.; D’hooge, D.R. A Combined Experimental and Modeling Study for Pellet-Fed Extrusion-Based Additive Manufacturing to Evaluate the Impact of the Melting Efficiency. Materials 2021, 14, 5566. [Google Scholar] [CrossRef]
- Vilaplana, F.; Karlsson, S.; Ribes-Greus, A. Changes in the microstructure and morphology of high-impact polystyrene subjected to multiple processing and thermo-oxidative degradation. Eur. Polym. J. 2007, 43, 4371–4381. [Google Scholar] [CrossRef]
- De Keer, L.; Van Steenberge, P.H.M.; Reyniers, M.; Marin, G.B.; Hungenberg, K.; Seda, L.; D’hooge, D.R. A complete understanding of the reaction kinetics for the industrial production process of expandable polystyrene. AIChE J. 2017, 63, 2043–2059. [Google Scholar] [CrossRef]
- Peterson, A.M. Review of acrylonitrile butadiene styrene in fused filament fabrication: A plastics engineering-focused perspective. Addit. Manuf. 2019, 27, 363–371. [Google Scholar] [CrossRef]
- Moore, J.D. Acrylonitrile-butadiene-styrene (ABS)—A review. Composites 1973, 4, 118–130. [Google Scholar] [CrossRef]
- Dey, A.; Eagle, I.N.R.; Yodo, N. A review on filament materials for fused filament fabrication. J. Manuf. Mater. Process. 2021, 5, 69. [Google Scholar] [CrossRef]
- Akintola, T.M.; Tran, P.; Sweat, R.D.; Dickens, T. Thermomechanical multifunctionality in 3d-printed polystyrene-boron nitride nanotubes (Bnnt) composites. J. Compos. Sci. 2021, 5, 61. [Google Scholar] [CrossRef]
- Sevastaki, M.; Suchea, M.P.; Kenanakis, G. 3D Printed Fully Recycled Tio2-Polystyrene Nanocomposite Photocatalysts for Use Against Drug Residues. Nanomaterials 2020, 10, 2144. [Google Scholar] [CrossRef]
- Hinsken, H.; Moss, S.; Pauquet, J.; Zweifela, H. Degradation of Polyolefins during Melt Processing. Polym. Degrad. Stab. 1991, 34, 279–293. [Google Scholar] [CrossRef]
- Colin, X.; Verdu, J. Polymer degradation during processing. Comptes Rendus Chim. 2006, 9, 1380–1395. [Google Scholar] [CrossRef]
- Capone, C.; Di Landro, L.; Inzoli, F.; Penco, M.; Sartore, L. Thermal and mechanical degradation during polymer extrusion processing. Polym. Eng. Sci. 2007, 47, 1813–1819. [Google Scholar] [CrossRef]
- Gol’dberg, V.M.; Zaikov, G.E. Kinetics of mechanical degradation in melts under model conditions and during processing of polymers-A review. Polym. Degrad. Stab. 1987, 19, 221–250. [Google Scholar] [CrossRef]
- Whitlock, L.R.; Porter, R.S. The source of degradation during extrusion of polystyrene. J. Appl. Polym. Sci. 1973, 17, 2761–2770. [Google Scholar] [CrossRef]
- Abbas-Abadi, M.S. The effect of process and structural parameters on the stability, thermo-mechanical and thermal degradation of polymers with hydrocarbon skeleton containing PE, PP, PS, PVC, NR, PBR and SBR. J. Therm. Anal. Calorim. 2021, 143, 2867–2882. [Google Scholar] [CrossRef]
- Schyns, Z.O.G.; Shaver, M.P. Mechanical Recycling of Packaging Plastics: A Review. Macromol. Rapid Commun. 2021, 42, 1–27. [Google Scholar] [CrossRef] [PubMed]
- Schweighuber, A.; Felgel-Farnholz, A.; Bögl, T.; Fischer, J.; Buchberger, W. Investigations on the influence of multiple extrusion on the degradation of polyolefins. Polym. Degrad. Stab. 2021, 192, 109689. [Google Scholar] [CrossRef]
- Zander, N.E.; Gillan, M.; Lambeth, R.H. Recycled polyethylene terephthalate as a new FFF feedstock material. Addit. Manuf. 2018, 21, 174–182. [Google Scholar] [CrossRef]
- Lee, D.; Lee, Y.; Lee, K.; Ko, Y.; Kim, N. Development and Evaluation of a Distributed Recycling System for Making Filaments Reused in Three-Dimensional Printers. J. Manuf. Sci. Eng. Trans. ASME 2019, 141, 021007. [Google Scholar] [CrossRef]
- Anderson, I. Mechanical Properties of Specimens 3D Printed with Virgin and Recycled Polylactic Acid. 3D Print. Addit. Manuf. 2017, 4, 110–115. [Google Scholar] [CrossRef]
- Hawkins, W.L. Polymer Degradation and Stabilization; Polymers Properties and Applications; Springer: Berlin/Heidelberg, Germany, 1984; ISBN 978-3-642-69378-6. [Google Scholar]
- Badia, J.D.; Gil-Castell, Ó.; Teruel-Juanes, R.; Ribes-Greus, A. Recycling of Polylactide. Encycl. Renew. Sustain. Mater. 2020, 2, 282–295. [Google Scholar] [CrossRef]
- Gijsman, P. Review on the thermo-oxidative degradation of polymers during processing and in service. E-Polymers 2008, 8, 1–34. [Google Scholar] [CrossRef]
- La Gala, A.; Ceretti, D.V.A.; Fiorio, R.; Cardon, L.; D’hooge, D.R. Comparing pellet- and filament-based additive manufacturing with conventional processing for ABS and PLA parts. J. Appl. Polym. Sci. 2022, 139, e53089. [Google Scholar] [CrossRef]
- Gradwohl, M.; Chai, F.; Payen, J.; Guerreschi, P.; Marchetti, P.; Blanchemain, N. Effects of two melt extrusion based additive manufacturing technologies and common sterilization methods on the properties of a medical grade PLGA copolymer. Polymers 2021, 13, 572. [Google Scholar] [CrossRef] [PubMed]
- Fernandez, E.; Ceretti, D.A.; Wang, S.; Jiang, Y.; Zhang, J.; D’hooge, D.R.; Cardon, L. Fused filament fabrication of copolyesters by understanding the balance of inter- and intra-layer welding. Plast. Rubber Compos. 2022, 51, 126–132. [Google Scholar] [CrossRef]
- Jagenteufel, R.; Hofstaetter, T.; Kamleitner, F.; Pedersen, D.B.; Tosello, G.; Hansen, H.N. Rheology of high melt strength polypropylene for additive manufacturing. Adv. Mater. Lett. 2017, 8, 712–716. [Google Scholar] [CrossRef]
- Chu, J.S.; Koay, S.C.; Chan, M.Y.; Choo, H.L.; Ong, T.K. Recycled plastic filament made from post-consumer expanded polystyrene and polypropylene for fused filamant fabrication. Polym. Eng. Sci. 2022, 62, 3786–3795. [Google Scholar] [CrossRef]
- Nguyen, H.T.; Crittenden, K.; Weiss, L.; Bardaweel, H. Recycle of waste tire rubber in a 3D printed composite with enhanced damping properties. J. Clean. Prod. 2022, 368, 133085. [Google Scholar] [CrossRef]
- Fico, D.; Rizzo, D.; De Carolis, V.; Montagna, F.; Esposito Corcione, C. Sustainable Polymer Composites Manufacturing through 3D Printing Technologies by Using Recycled Polymer and Filler. Polymers 2022, 14, 3756. [Google Scholar] [CrossRef]
- Madhu, N.R.; Erfani, H.; Jadoun, S.; Amir, M.; Thiagarajan, Y.; Chauhan, N.P.S. Fused deposition modelling approach using 3D printing and recycled industrial materials for a sustainable environment: A review. Int. J. Adv. Manuf. Technol. 2022, 122, 2125–2138. [Google Scholar] [CrossRef]
- Gomes, T.E.; Cadete, M.S.; Dias-de-Oliveira, J.; Neto, V. Controlling the properties of parts 3D printed from recycled thermoplastics: A review of current practices. Polym. Degrad. Stab. 2022, 196, 109850. [Google Scholar] [CrossRef]
- Fiorio, R.; D’hooge, D.R.; Ragaert, K.; Cardon, L. A statistical analysis on the effect of antioxidants on the thermal-oxidative stability of commercial massand emulsion-polymerized ABS. Polymers 2018, 11, 25. [Google Scholar] [CrossRef]
- Adeniyi, J.B.; Kolawole, E.G. Thermal and photo-degradation of unstabilized ABS. Eur. Polym. J. 1984, 20, 43–47. [Google Scholar] [CrossRef]
- Santos, R.M.; Botelho, G.L.; Machado, A.V. Artificial and natural weathering of ABS. J. Appl. Polym. Sci. 2010, 116, 2005–2014. [Google Scholar] [CrossRef]
- Zhu, X. Effects of acids on thermal and thermooxidative degradation of polystyrene. Polym. Degrad. Stab. 1997, 57, 163–173. [Google Scholar] [CrossRef]
- ASTM Standard Practice for Calculating Yellowness and Whiteness Indices from Instrumentally Measured Color Coordinates. Annu. B ASTM Stand. 2015, 6, 1–6. [CrossRef]
- Montgomery, D.C. Design and Analysis of Experiments, 5th ed.John Wiley & Sons: New York, NY, USA, 2001. [Google Scholar]
- Spoerk, M.; Arbeiter, F.; Raguž, I.; Holzer, C.; Gonzalez-Gutierrez, J. Mechanical recyclability of polypropylene composites produced by material extrusion-based additive manufacturing. Polymers 2019, 11, 1318. [Google Scholar] [CrossRef] [PubMed]
- Adeniyi, J.B. Clarification a N D Discussion of Chemical Photo-Oxidative Degradation of Abs. Eur. Polym. J. 1984, 20, 291–299. [Google Scholar] [CrossRef]
- Cameron, G.G.; Kerr, G.P. Thermal degradation of polystyrene-I. Chain scission at low temperatures. Eur. Polym. J. 1968, 4, 709–717. [Google Scholar] [CrossRef]
- Guyot, A. Recent developments in the thermal degradation of polystyrene—A review. Polym. Degrad. Stab. 1986, 15, 219–235. [Google Scholar] [CrossRef]
- Münstedt, H. Rheology of rubber-modified polymer melts. Polym. Eng. Sci. 1981, 21, 259–270. [Google Scholar] [CrossRef]
- Aoki, Y. Rheological properties of abs polymer melts having a good dispersion of rubber particles. J. Nonnewton. Fluid Mech. 1986, 22, 91–99. [Google Scholar] [CrossRef]
- Bertin, M.-P.; Marin, G.; Montfort, J.-P. Viscoelastic properties of acrylonitrile-butadiene-styrene (ABS) polymers in the molten state. Polym. Eng. Sci. 1995, 35, 1394–1406. [Google Scholar] [CrossRef]
- Ceretti, D.V.A.; Fiorio, R.; Van Waeleghem, T.; Desmet, A.; Florizoone, B.; Cardon, L.; D’hooge, D.R. Exploiting mono- and hybrid nanocomposite materials for fused filament fabrication with acrylonitrile butadiene styrene as polymer matrix. J. Appl. Polym. Sci. 2022, 139, e52922. [Google Scholar] [CrossRef]
- Lertwimolnun, W.; Vergnes, B. Influence of compatibilizer and processing conditions on the dispersion of nanoclay in a polypropylene matrix. Polymer 2005, 46, 3462–3471. [Google Scholar] [CrossRef]
- Karahaliou, E.-K.; Tarantili, P.A. Stability of ABS compounds subjected to repeated cycles of extrusion processing. Polym. Eng. Sci. 2009, 49, 2269–2275. [Google Scholar] [CrossRef]
- Berzin, F.; Vergnes, B.; Delamare, L. Rheological behavior of controlled-rheology polypropylenes obtained by peroxide-promoted degradation during extrusion: Comparison between homopolymer and copolymer. J. Appl. Polym. Sci. 2001, 80, 1243–1252. [Google Scholar] [CrossRef]
- Filippone, G.; Carroccio, S.C.; Mendichi, R.; Gioiella, L.; Dintcheva, N.T.; Gambarotti, C. Time-resolved rheology as a tool to monitor the progress of polymer degradation in the melt state—Part I: Thermal and thermo-oxidative degradation of polyamide 11. Polymer 2015, 72, 134–141. [Google Scholar] [CrossRef]
- Tzoganakis, C.; Hamielec, A.E.; Tang, Y.; Vlachopoulos, J. Controlled degradation of polypropylene: A comprehensive experimental and theoretical investigation. Polym. Plast. Technol. Eng. 1989, 28, 319–350. [Google Scholar] [CrossRef]
- Dealy, J.M.; Larson, R.G. Structure and Rheology of Molten Polymers; Carl Hanser Verlag GmbH & Co. KG: München, Germany, 2006; ISBN 978-3-446-21771-3. [Google Scholar]
- Signoret, C.; Caro-Bretelle, A.S.; Lopez-Cuesta, J.M.; Ienny, P.; Perrin, D. MIR spectral characterization of plastic to enable discrimination in an industrial recycling context: I. Specific case of styrenic polymers. Waste Manag. 2019, 95, 513–525. [Google Scholar] [CrossRef]
- Saviello, D.; Pouyet, E.; Toniolo, L.; Cotte, M.; Nevin, A. Synchrotron-based FTIR microspectroscopy for the mapping of photo-oxidation and additives in acrylonitrile-butadiene-styrene model samples and historical objects. Anal. Chim. Acta 2014, 843, 59–72. [Google Scholar] [CrossRef]
- Salari, D.; Ranjbar, H. Study on the Recycling of ABS Resins: Simulation of Reprocessing and Thermo-oxidation. Iran. Polym. J. 2008, 17, 599–610. [Google Scholar]
- Desrousseaux, C.; Cueff, R.; Aumeran, C.; Garrait, G.; Mailhot-Jensen, B.; Traoré, O.; Sautou, V. Fabrication of acrylonitrile-butadiene-styrene nanostructures with anodic alumina oxide templates, characterization and biofilm development test for Staphylococcus epidermidis. PLoS ONE 2015, 10, e0135632. [Google Scholar] [CrossRef] [PubMed]
- Moss, S.; Zweifel, H. Degradation and stabilization of high density polyethylene during multiple extrusions. Polym. Degrad. Stab. 1989, 25, 217–245. [Google Scholar] [CrossRef]
- Samper, M.D.; Garcia-Sanoguera, D.; Parres, F.; López, J. Recycling of expanded polystyrene from packaging. Prog. Rubber Plast. Recycl. Technol. 2010, 26, 83–92. [Google Scholar] [CrossRef]
- McNeill, I.C.; Razumovskii, L.P.; Gol’dberg, V.M.; Zaikov, G.E. The thermo-oxidative degradation of polystyrene. Polym. Degrad. Stab. 1994, 45, 47–55. [Google Scholar] [CrossRef]
- D’Esposito, L.; Koenig, J.L. A comparison of the thermal and mechanical degradation of glassy polystyrene by Fourier transform infrared spectroscopy. Polym. Eng. Sci. 1979, 19, 162–165. [Google Scholar] [CrossRef]
- Achtioui, T.; Lacoste, C.; Le Baillif, M.; Erre, D. Prediction of the yellowing of styrene-stat-Acrylonitrile and acrylonitrile-butadiene-styrene during processing in an internal mixer. J. Polym. Eng. 2018, 38, 983–993. [Google Scholar] [CrossRef]
- Coogan, T.J.; Kazmer, D.O. Modeling of interlayer contact and contact pressure during fused filament fabrication. J. Rheol. 2019, 63, 655–672. [Google Scholar] [CrossRef]
Publisher’s Note: MDPI stays neutral with regard to jurisdictional claims in published maps and institutional affiliations. |
© 2022 by the authors. Licensee MDPI, Basel, Switzerland. This article is an open access article distributed under the terms and conditions of the Creative Commons Attribution (CC BY) license (https://creativecommons.org/licenses/by/4.0/).