Article

Vortex-Pressure Fluctuation Interaction in the Outlet Duct of Centrifugal Pump as Turbines (PATs)

1
College of Mechanical and Electronic Engineering, Jiangxi College of Applied Technology, Ganzhou 341000, China
2
National-Provincial Joint Engineering Laboratory for Fluid Transmission System Technology, Zhejiang Sci-Tech University, Hangzhou 310018, China
3
Key Laboratory of Ionic Rare Earth Resources and Environment, Ministry of Natural Resources, Ganzhou 341000, China
*
Author to whom correspondence should be addressed.
Sustainability 2022, 14(22), 15250; https://doi.org/10.3390/su142215250
Submission received: 30 September 2022 / Revised: 30 October 2022 / Accepted: 8 November 2022 / Published: 17 November 2022

Abstract

:
The outlet duct is the only outlet flow component of the pump as turbines (PATs). The flow state within it not only affects its operation stability but also influences the safe operation of downstream process equipment. The undesirable flow phenomenon of the vortex is the main reason for pressure pulsations and vibrations; therefore, it is important to adopt simulation and experimental methods to reveal the vortex-pressure fluctuation interaction characteristics in the outlet duct of PATs. Firstly, the spatial and temporal evolution of the vortex in the outlet duct under different operation conditions were compared based on the Q-vortex identification criterion. Subsequently, the frequency components corresponding to local high amplitude vorticity and pressure pulsations were clarified. Finally, the relationship between vortex evolution and the pressure pulsations in the outlet duct was established. The results showed that the flow rates of the turbine significantly affected the spatial and temporal evolution of the vortex rope in the outlet duct. The front chamber leakage flow and vortex shedding from the blade trailing edge also influenced the vortex distribution characteristics in the outlet duct. The dominant frequency of the pressure pulsation in the outlet duct was 6 fn under different operating conditions, and the amplitude of the pressure pulsation increased with the flow rates. The effect of vortex evolution on the local pressure pulsation characteristics decreased with increasing flow rates. The results can be used to improve and stabilize the operation and further optimization of PATs.

1. Introduction

Pumps as turbines (PAT) is an energy recovery equipment widely used in petrochemicals, desalination, mining, and other energy-consuming industries as a substitute for pressure-reducing valves to realize the pressure relief process [1,2,3]. As the only outflow component of PATs, the flow characteristic in the outlet duct affects not only the stability of the turbine itself, but also the safety of the downstream equipment [4,5]. Therefore, it is necessary to deeply analyze the vortex structure and pressure pulsation characteristics in the outlet duct of PATs under its typical operating conditions and provide a reference for the performance improvement and operation regulation of PATs.
In recent years, scholars have concentrated on the research of flow characteristics and dynamic performance in the outlet duct through numerical simulation, dynamic experiments, and visualization tests [6,7,8,9]. As the downstream component of the impeller, the inner hydraulic characteristics of the outlet duct are significantly affected by the outlet flow condition of the impeller. Lin et al. predicted the inlet condition of an outlet duct under different operating conditions by using the impeller outlet velocity triangle theoretical analysis [10]. The results showed that the outlet velocity has the same circumferential velocity component as the impeller rotation direction under the part-load condition and the opposite circumferential velocity component at the overload condition. Ghorani et al. and David et al. also displayed similar results from the views of energy loss and velocity vector, respectively [11,12,13]. Wang et al. designed a special impeller used in the turbine mode of PATs and compared the static pressure distribution characteristics downstream of the special impeller and the original impeller under best efficiency point (BEP) conditions by the numerical method [14]. The results concluded that the special impeller improved the outlet flow condition and decreased the flow losses of the outlet duct compared with the original impeller. Wang et al. investigated the twisted trailing vortex in the outlet duct of PATs using the theoretical and simulation numerical method [15]. They found that the swirling strength rate of the vortex was strong under part-load conditions and weak at overload conditions, and that the existence of the trailing vortex worsened the energy recovery characteristic and operation stability of PATs. Delgado et al. adopted the visualization method to investigate the cavitation vortex rope behavior in the outlet duct of PATs under different flow rate conditions [16]. The testing results illustrated that swirling flow was perceptible under the part-load operation but does not appear at the BEP.
The outlet ducts of PATs, which have a gradual contractile structure, are less capable of energy recovery compared to traditional turbine draft tubes with a gradual expansion structure [8,17,18]. However, as the only outflow component of PATs, the inner flow and external dynamic characteristics of the outlet duct could reflect the operation stability of PATs to a certain extent. Dai et al. investigated the pressure fluctuation characteristics and internal flow mechanism of the outlet duct by experiment and unsteady Reynolds-Averaged Navier-Stokes methods [19]. The results indicated that the rotor-stator interaction is the main reason for pressure fluctuations in the PATs, and the amplitude of it increases as the flow rate increases. Wu et al. pointed out that the vorticity generated by the enstrophy and Lamb vector determine the dominant frequency and secondary frequency of low-frequency fluctuations in the outlet duct, and the pressure fluctuation amplitude is significantly affected by the pressure propulsion work [20]. To reveal the relationship between the vibration and cavitation of PATs, Sanjay et al. carried out experimental investigations on the cavitation characteristics of PATs that visualized the vortex behavior under different cavitation factor conditions [21]. The results showed that swirling vortex rope appeared in the outlet duct as the cavitation factor neared the critical cavitation factor and that a large amount of traveling bubbles appeared in the entire duct when the cavitation factor further decreased. Dong et al. compared the pressure fluctuation characteristic of PATs under the pump and turbine conditions by numerical simulation method [22]. The results indicated that the pressure fluctuation amplitude in the impeller was less than that in the outlet duct at the BEP of pump condition and that the pressure fluctuation amplitude in the impeller was more than that in the outlet duct at the BEP of turbine condition.
The above references have made major progress in the research of the flow characteristic, pressure fluctuation, and vortex behaviors in the outlet duct of PATs. However, the vortex-generated mechanism and its revolution relation to local pressure fluctuation characteristics in the outlet duct of PATs are still not clear. Few researchers have revealed the frequency components that correspond to local high amplitude vorticity and pressure pulsations in the outlet duct. Therefore, simulation and experimental methods are adopted in this paper to thoroughly reveal the vorticity-pressure fluctuation interaction characteristics in the outlet duct. The results can be used to improve and stabilize the operation and further optimization of PATs. The main content of this paper is organized as follows: Section 2 describes the physical model and numerical methodology; Section 3 examines how the vortex behavior varied with flow rates and builds the relationship between vortex evolution and pressure fluctuations. Finally, Section 4 excerpts several valuable conclusions of this study.

2. Numerical Method

2.1. Physical Model

The model applied in the present study was a single stage cantilever pump as turbine (PAT), which is commonly used in the chemical industry with the ns is 24.73. The designed flow, head, and rotating speed under the BEP of the pump was 45 m3/h, 30.9 m, and 2900 rpm, respectively. The calculated model presented in Figure 1 comprises the inlet duct, volute, impeller, impeller clearance, front chamber, back chamber, and outlet duct. To accurately capture the true flow in the PATs, the wear-ring clearance of the front and back chambers were structured. Table 1 presents the main geometric parameters of the PAT.

2.2. Governing Equations and Turbulence Model

The mass and momentum conservation equations were used to determine the velocity and pressure distribution in the PATs, regardless of the temperature and density variations of the flow medium in the simulations. The Reynolds averaged method was applied to the governing equations in the present study; mass conservation and conservation of momentum were written as follows [23,24].
Mass conservation:
u ¯ i x i = 0
Conservation of momentum:
u ¯ i t + x j ( u ¯ i u ¯ j ) = 1 ρ p ¯ x i + 1 ρ x j ( μ u ¯ i x j ρ u i u j ¯ ) + f i
where x i and x j are coordinate components, f i is the body force component, u ¯ i and u ¯ j are time-averaged velocity components in cartesian coordinate, ρ , p ¯ , and ρ u i u j ¯ are density of flow medium, time-averaged pressure, and Reynolds stress tensor, respectively.
The flow characteristics were extremely complicated due to the high rotating speed of the impeller domain and distortion in the flow channels. To precision predict the hydraulic performance of PATs variation with the flow rates, the Shear Stress Transport (SST) k-ω turbulence model was selected to close the Reynolds- averaged governing equations under the steady calculation [25,26,27]. The SST k-ω turbulence model equations are shown in the following:
Turbulent kinetic energy equation:
( ρ k ) t + ( ρ k u j ) x j = P k + x j [ ( μ + μ t σ k 3 ) k x j ] ρ k 3 / 2 l k ω
Turbulent frequency equation:
( ρ ω ) t + x j [ ρ ω u j ( μ + μ t σ ω 3 ) ω x j ] = α 3 ω k P k β 3 ρ ω 2 + 2 ρ ( 1 F 1 ) 1 ω σ ω 2 k x j ω x j
where Pk is production term of equations, F1 is blending functions used to switch the turbulence model between k-ω and k-ε based on the distance of a node to the nearest wall, µ is the dynamic viscosity, µt is the turbulence viscosity, and σ k 3 , σ ω 3 , α 3 , β 3 , σ ω 2 are the model constants. l k ω in the second term on the right side of Equation (3) is the turbulence scale, which is defined as
l k ω k 1 / 2 ω β k
The DES turbulence model based on the SST k-ω turbulence model (SST-DES) was applied to solve the Reynolds-averaged governing equations under the unsteady calculation, and to better capture the vortex distribution and evolution characteristics in the PAT. In the SST-DES turbulence model, the term of min (lk-ω, CDESΔ) was used to replace lk-ω. CDES was the empirical constant with values of 0.61 and Δ was defined as Δ = max (Δx, Δy, Δz), which represents the largest mesh element dimension. When lk-ωCDESΔ, the LES model was applied; otherwise, the SST k-ω model was used.
Due to the blade’s distortion structure, to truly reflect the details of the flow inside the impeller the correction coefficient fr proposed by Spalart and Shur [28] considering the effects of curvature was used to modify production term the SST k-ω model and SST-DES models.
P t = f r · P t
where f r = 2 r 1 + r ( 1 + c r 1 ) [ 1 c r 3 tan 1 ( c r 2 r ˜ ) ] c r 1 . c r 1 , c r 2 , c r 3 are constant which equal to 1, 2, 1, respectively, and r ˜ and r are functions of the strain rate and system rotation.

2.3. Numerical Schemes and Boundary Conditions

The 3D steady-state incompressible simulation of PATs under the flow rates from 34.3 m3/h to 101.8 m3/h conditions, which correspond to 0.43 Qb to 1.3 Qb, was performed in the ANSYS CFX 2022 R2. The grid frame change models of the static domain connecting to the static domain and rotating domain were set to none and frozen rotor with the General Grid Interface (GGI) mesh connection method, respectively. All the flow domains were set to stationary domains except the impeller. The rotating speed of the impeller was 2900 rpm, and multiple frames of reference were adopted in the simulation. The fluid energy transport medium was pure water with a density and temperature of 998.2 kg/m3 and 25 °C, respectively. The high-resolution advection scheme and implicit second-order backward Euler scheme were applied to the discretization of convective terms and time discretization of the momentum equations, respectively. Mass flow rate condition were in the position of the outlet, and the total pressure boundary was set as the inlet condition with a medium turbulence intensity of 5%. By changing the mass flow rate of the outlet, the flow characteristics and hydraulic performance of PATs under different operation conditions can be obtained. The convergence criterion of continuity and momentum equations is a root mean square (RMS) below 10−5.
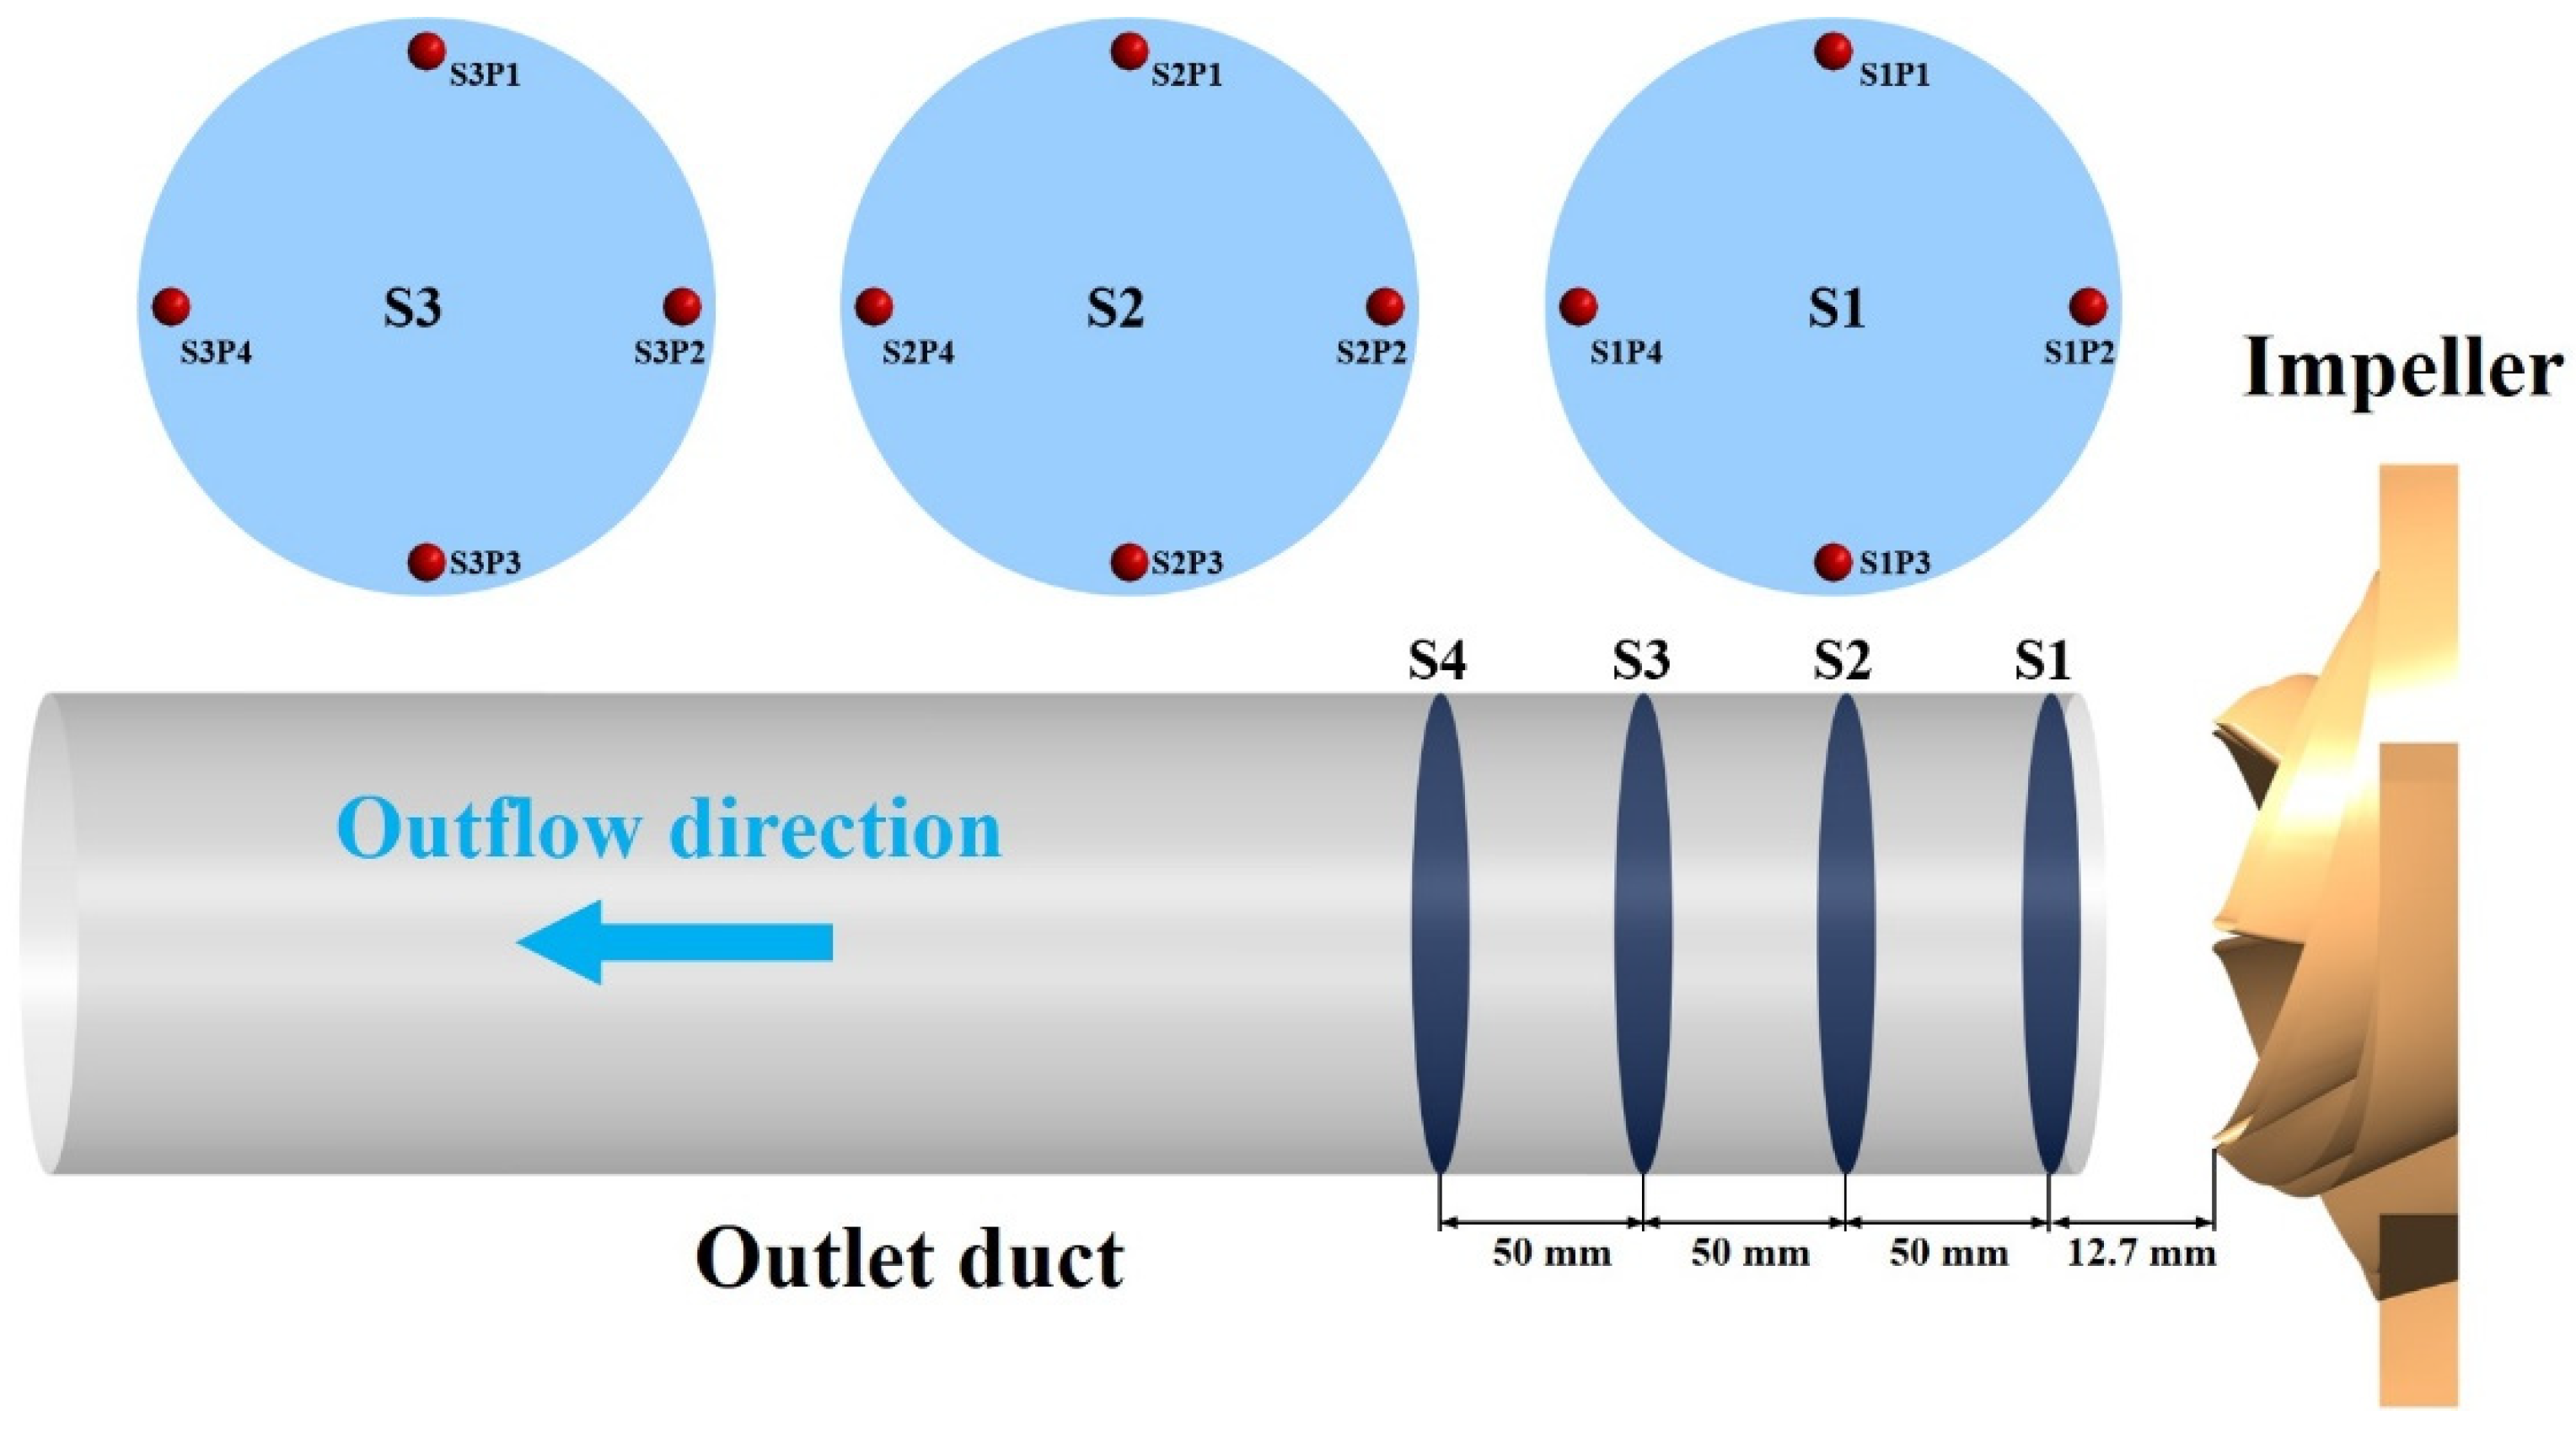
The steady simulation results of PATs solved by the SST k-ω turbulence model were used as the initial data for transient simulation to promote the convergence rate. Under the transient simulation, the time step was set to 5.7471 × 10⁻⁵ s, corresponding to one degree of impeller rotation, and the total time was set to 0.62068965 s, corresponding to the time needed for 30 revolutions of the impeller. The high-resolution discretization type was selected in the advection scheme, and the transient term was selected in the second-order backward Euler scheme. The interface between the impeller and the static domains adopted the frozen rotor interface in the steady simulation, and the transient rotor-stator model was selected for transient simulation. The convergence condition of all residuals was an RMS less than 1 × 10⁻⁶ under the transient simulation. The transient simulation results of the last five revolutions of the impeller were adopted to investigate the variations of pressure, vorticity, and velocity in the outlet duct over time. The monitoring points and planes in the outlet duct are shown in Figure 2.

2.4. Mesh Generation and Sensitivity Analysis

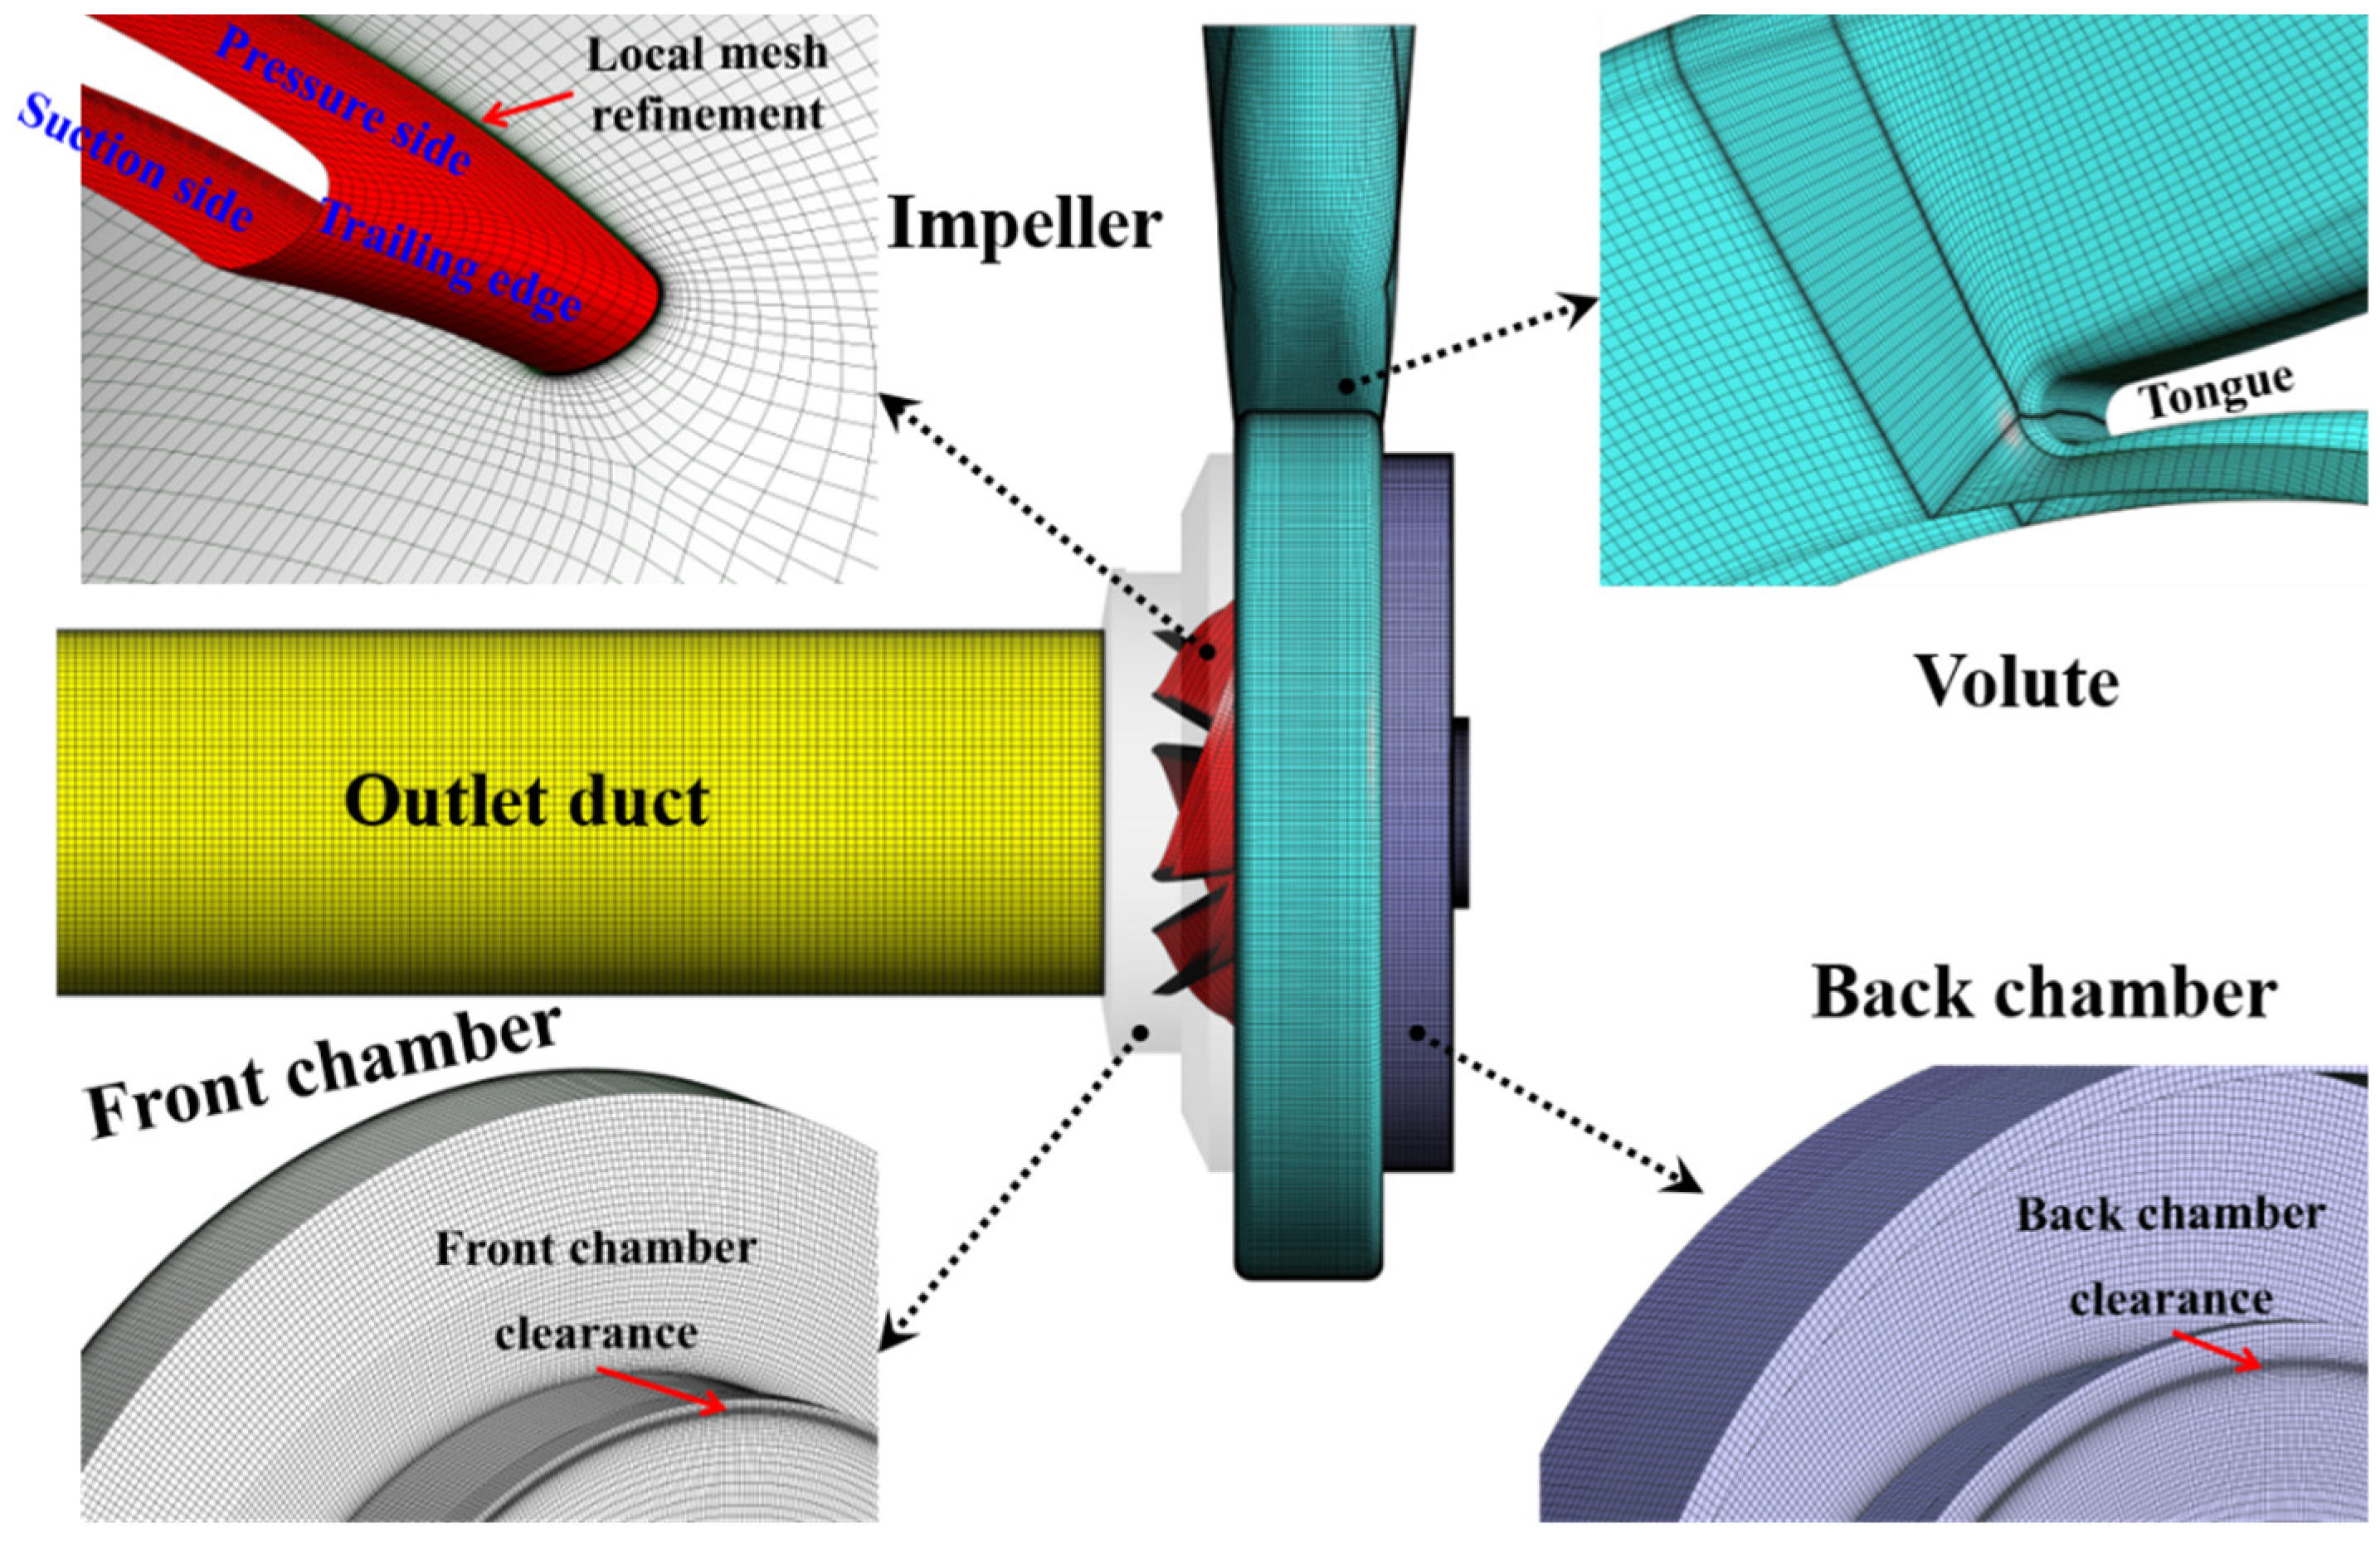
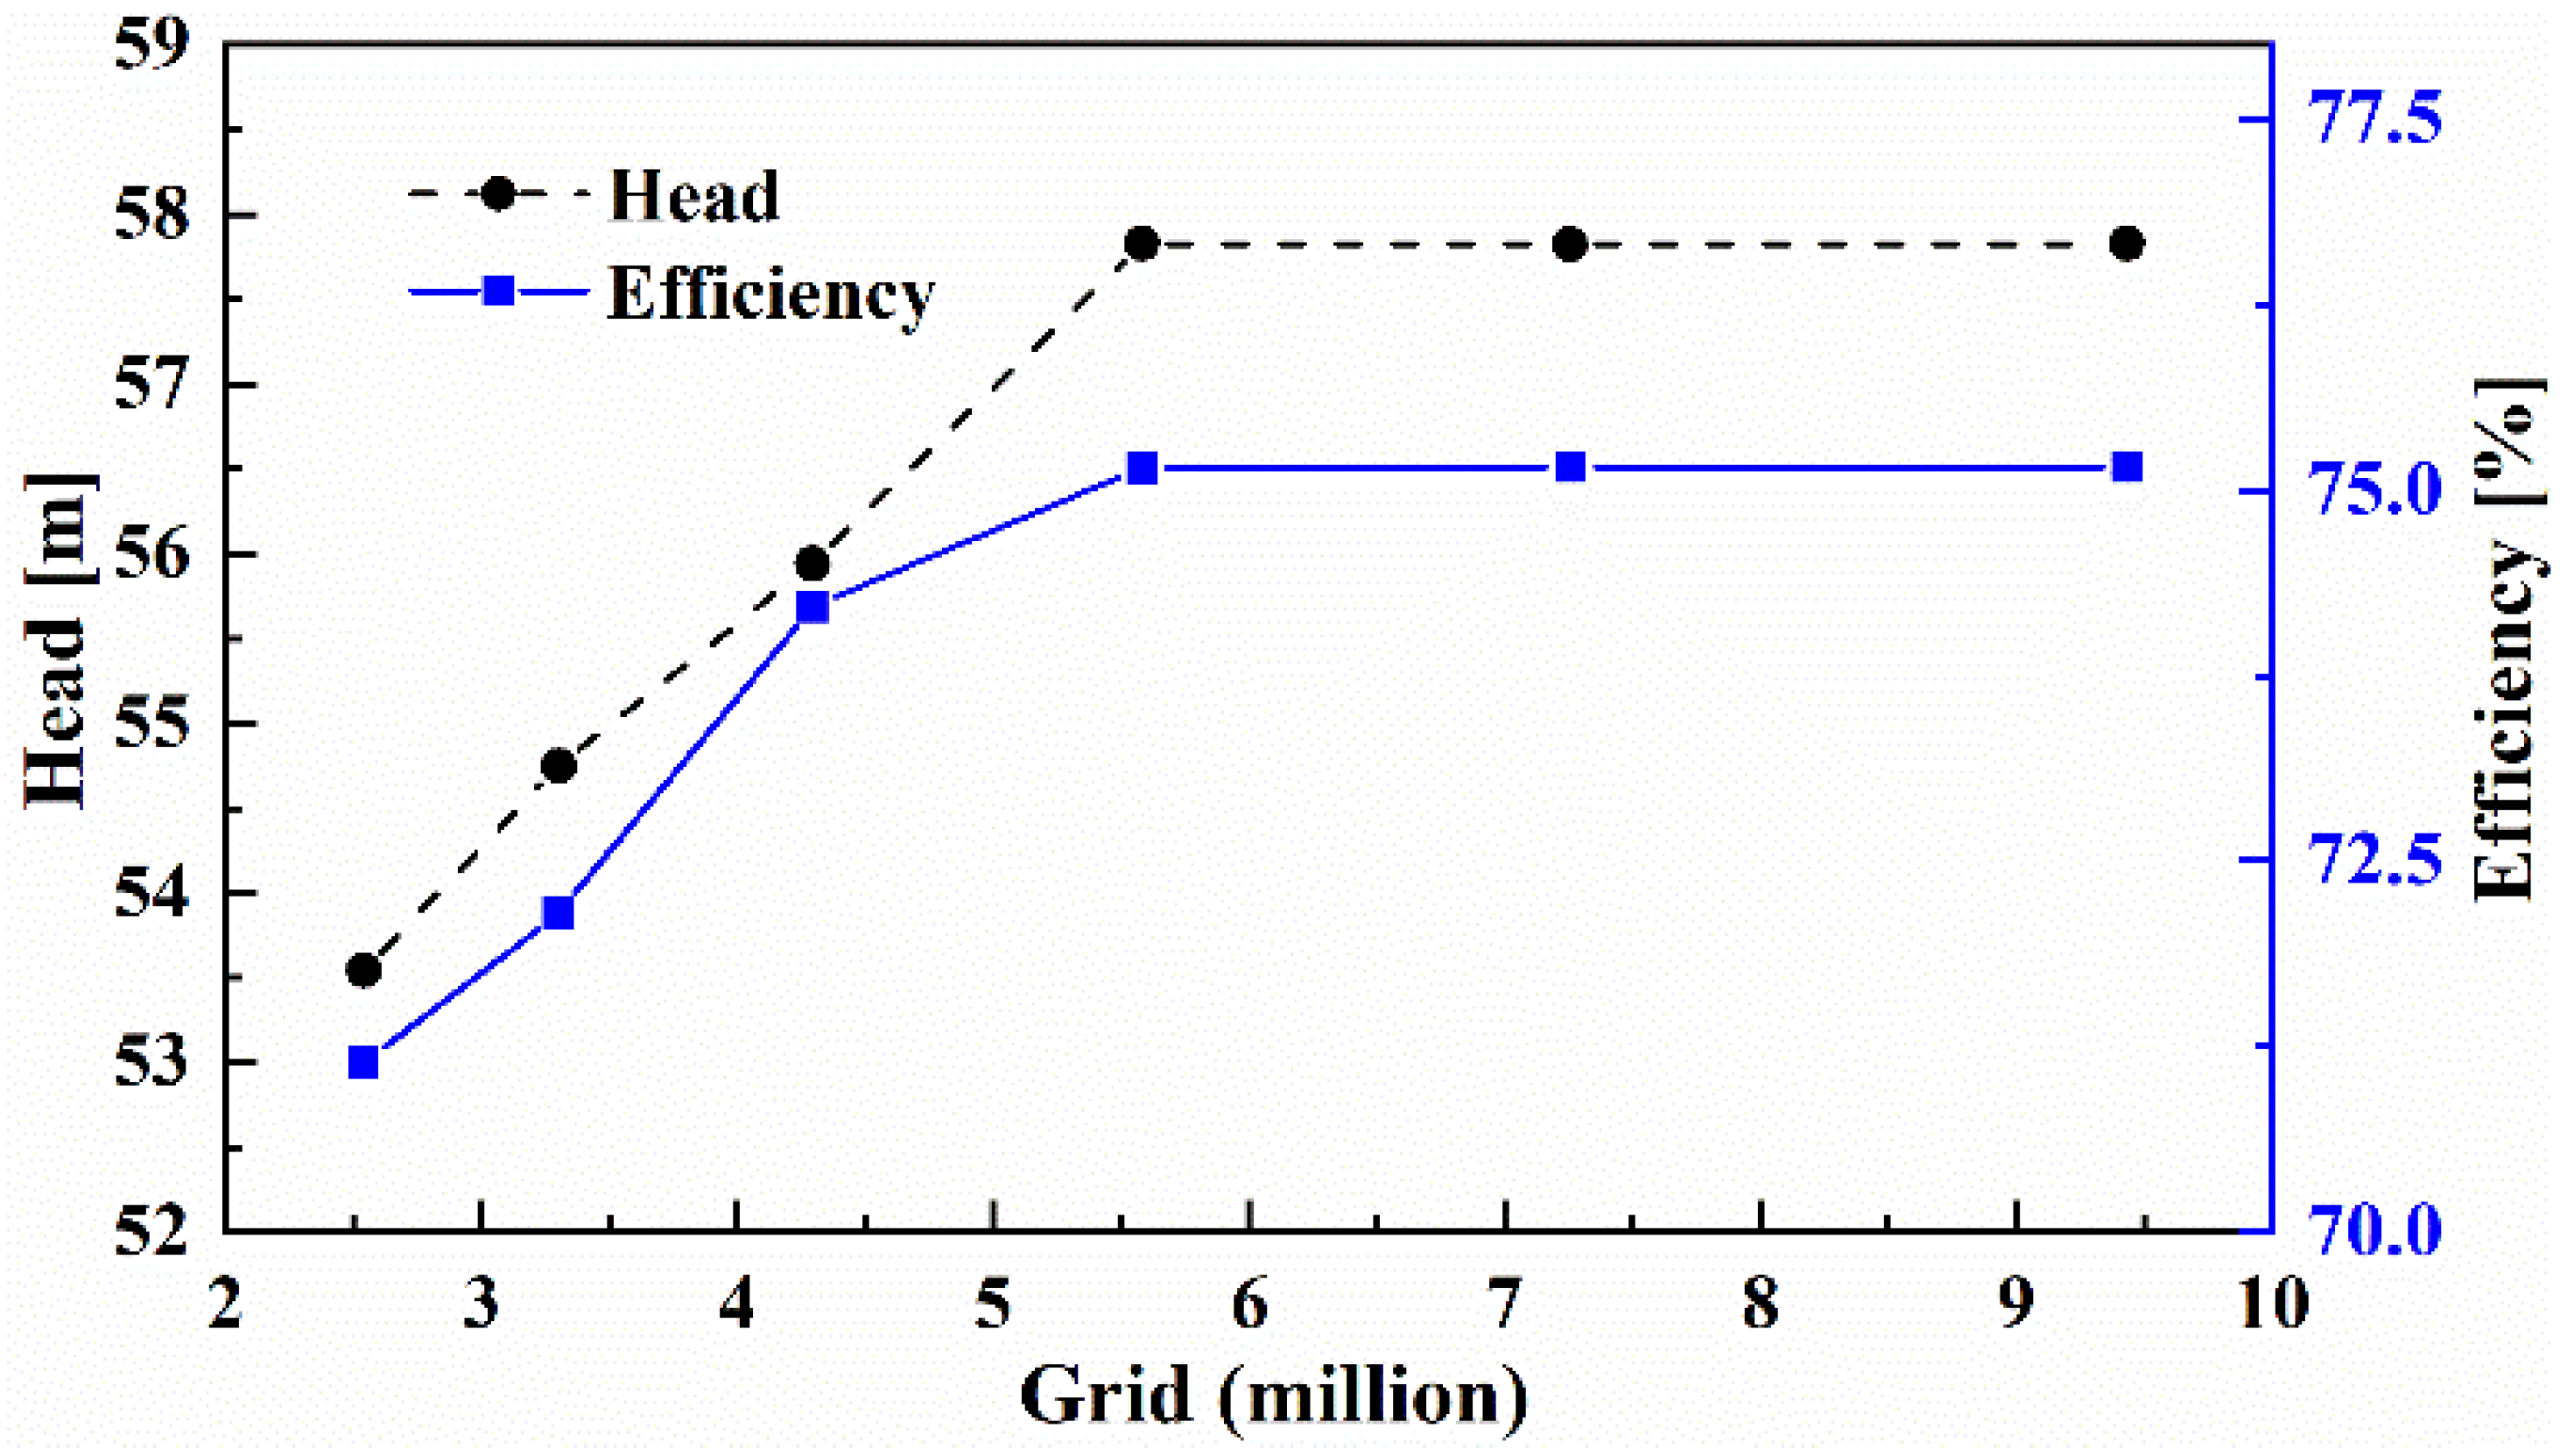
Figure 3 shows the calculation mesh information of PATs’ main flow domains. For precious capture of the detailed flow characteristics near the wall and to meet the values of the y+ requirement of the turbulence model, the methodology of local mesh refinement was adopted to build the boundary layer. Six different numbers of grids were created through an identical meshing method, and the node number increased from 2.54 × 10⁶ to 9.43 × 10⁶. The head of PATs under the BEP condition was selected as the criterion of grid independence. Figure 4 plots the variation curves of the head with the number of grid nodes increased. It indicates that when the grid number is larger than 6 × 10⁶, the head and efficiency fluctuation of the PATs is not more than 0.5%. Considering the numerical accuracy and the ability of computational resources, the grid number of 7.25 × 10⁶ was preliminarily selected.
To further verify the grid independence, the Grid Convergence Index (GCI) method was used, which is based on the Richardson extrapolation method, which was proposed by Roache and recommended by the Fluids Engineering Division of the American Society of Mechanical Engineers [29,30]. Three groups of mesh (N1, N2, N3) were used to check the grid independence, and the number of nodes were 9.43 × 10⁶, 7.25 × 10⁶, and 5.58 × 10⁶, respectively. The head and torque of PATs under the BEP condition were chosen to evaluate the grid error parameters. Table 2 presents the discretization errors of mesh cases. The discretization error of the mesh shows that the approximate relative error ( e a 21 , e a 32 ), extrapolated relative error ( e ext 21 , e ext 32 ), and fine-grid convergence index ( GCI fine 21 , GCI fine 32 ) of head and efficiency were below 1.5%, which indicated that the mesh group of N2 could ensure the accuracy of the calculation. Finally, the mesh group with 7.25 × 10⁶ nodes was selected for the simulation research in the present study. The mesh information for each domain is shown in Table 3.

2.5. Validation of Numerical Results

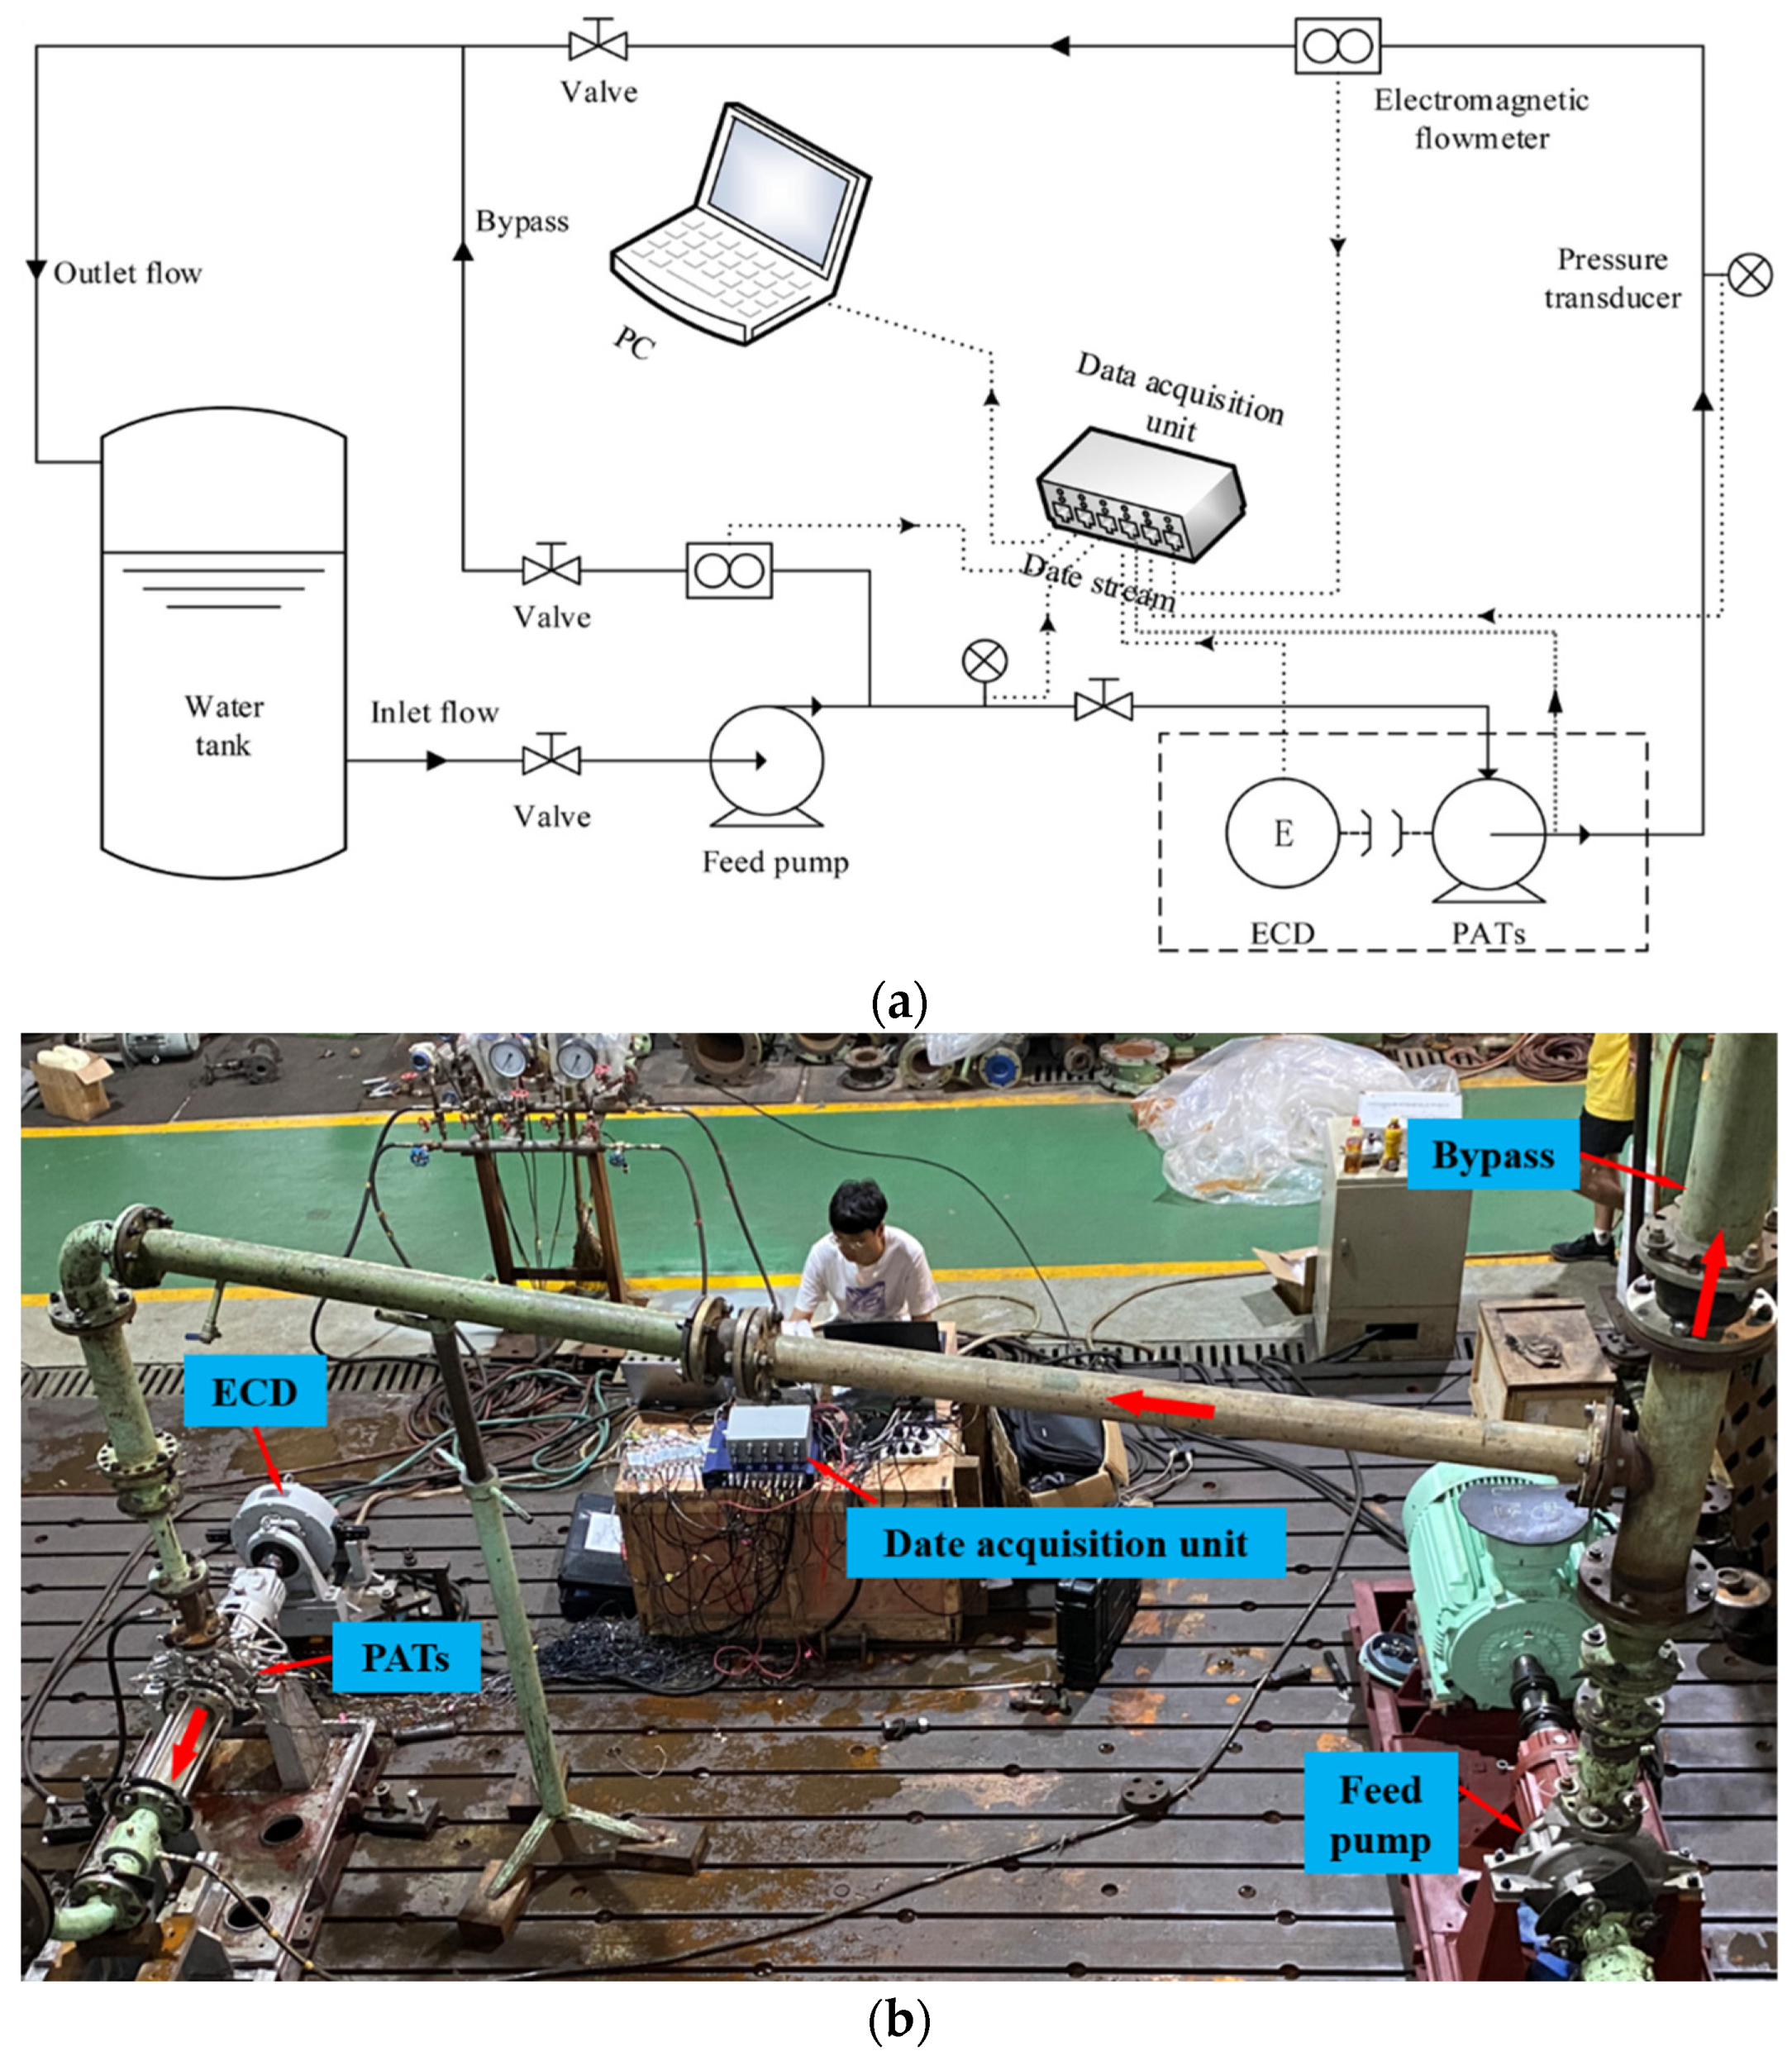
To verify the accuracy of the head and efficiency predicted by numerical methods, the hydraulic performance test of PATs was conducted at Hangzhou Dalu Industry Co., Ltd., Hangzhou, China. Figure 5a shows the hydraulic performance test system of PATs, which comprises the water tank, control valve, feed pump, data acquisition, processing system, pressure transducer, electromagnetic flowmeter, electric eddy current dynamometer (ECD), PATs, and connecting pipe. The feed pump provides the hydraulic energy to drive the working PATs, and the ECD consumes the mechanical energy produced by the PATs. The ECD directly connects to the PATs by the flexible coupling with the coaxiality error below 0.1 mm, and the real-time data of rotating speed and torque are stored in its supporting software. Through coordinated regulation of the ECD, the control valve at the mainstream, and the bypass pipe, the hydraulic performance of PATs under the different operating conditions is obtained. The uncertainty of the pressure transducer, electromagnetic flowmeter, torque, and rotating speed sensor are ±0.2%, ±0.1%, and ±0.05%, respectively. The head and efficiency of PATs are calculated as follows.
H = ( z 1 + P 1 ρ g + v 1 2 2 g ) ( z 2 + P 2 ρ g + v 2 2 2 g )
η = π n T 30 ρ g Q H × 100 %
where T is the torque of PATs; and z, P, and v are the vertical height, manometer pressure, and average velocity of cross section, respectively. The subscripts 1 and 2 represent inlet and outlet, respectively.
To verify the accuracy of the unsteady characteristics of PAT obtained by the simulation, four high frequencies dynamic pressure sensors were arranged in the S1 plane of the outlet duct in the test, and its position was consistent with the numerical setting. The physical model of PATs is presented in Figure 5b.
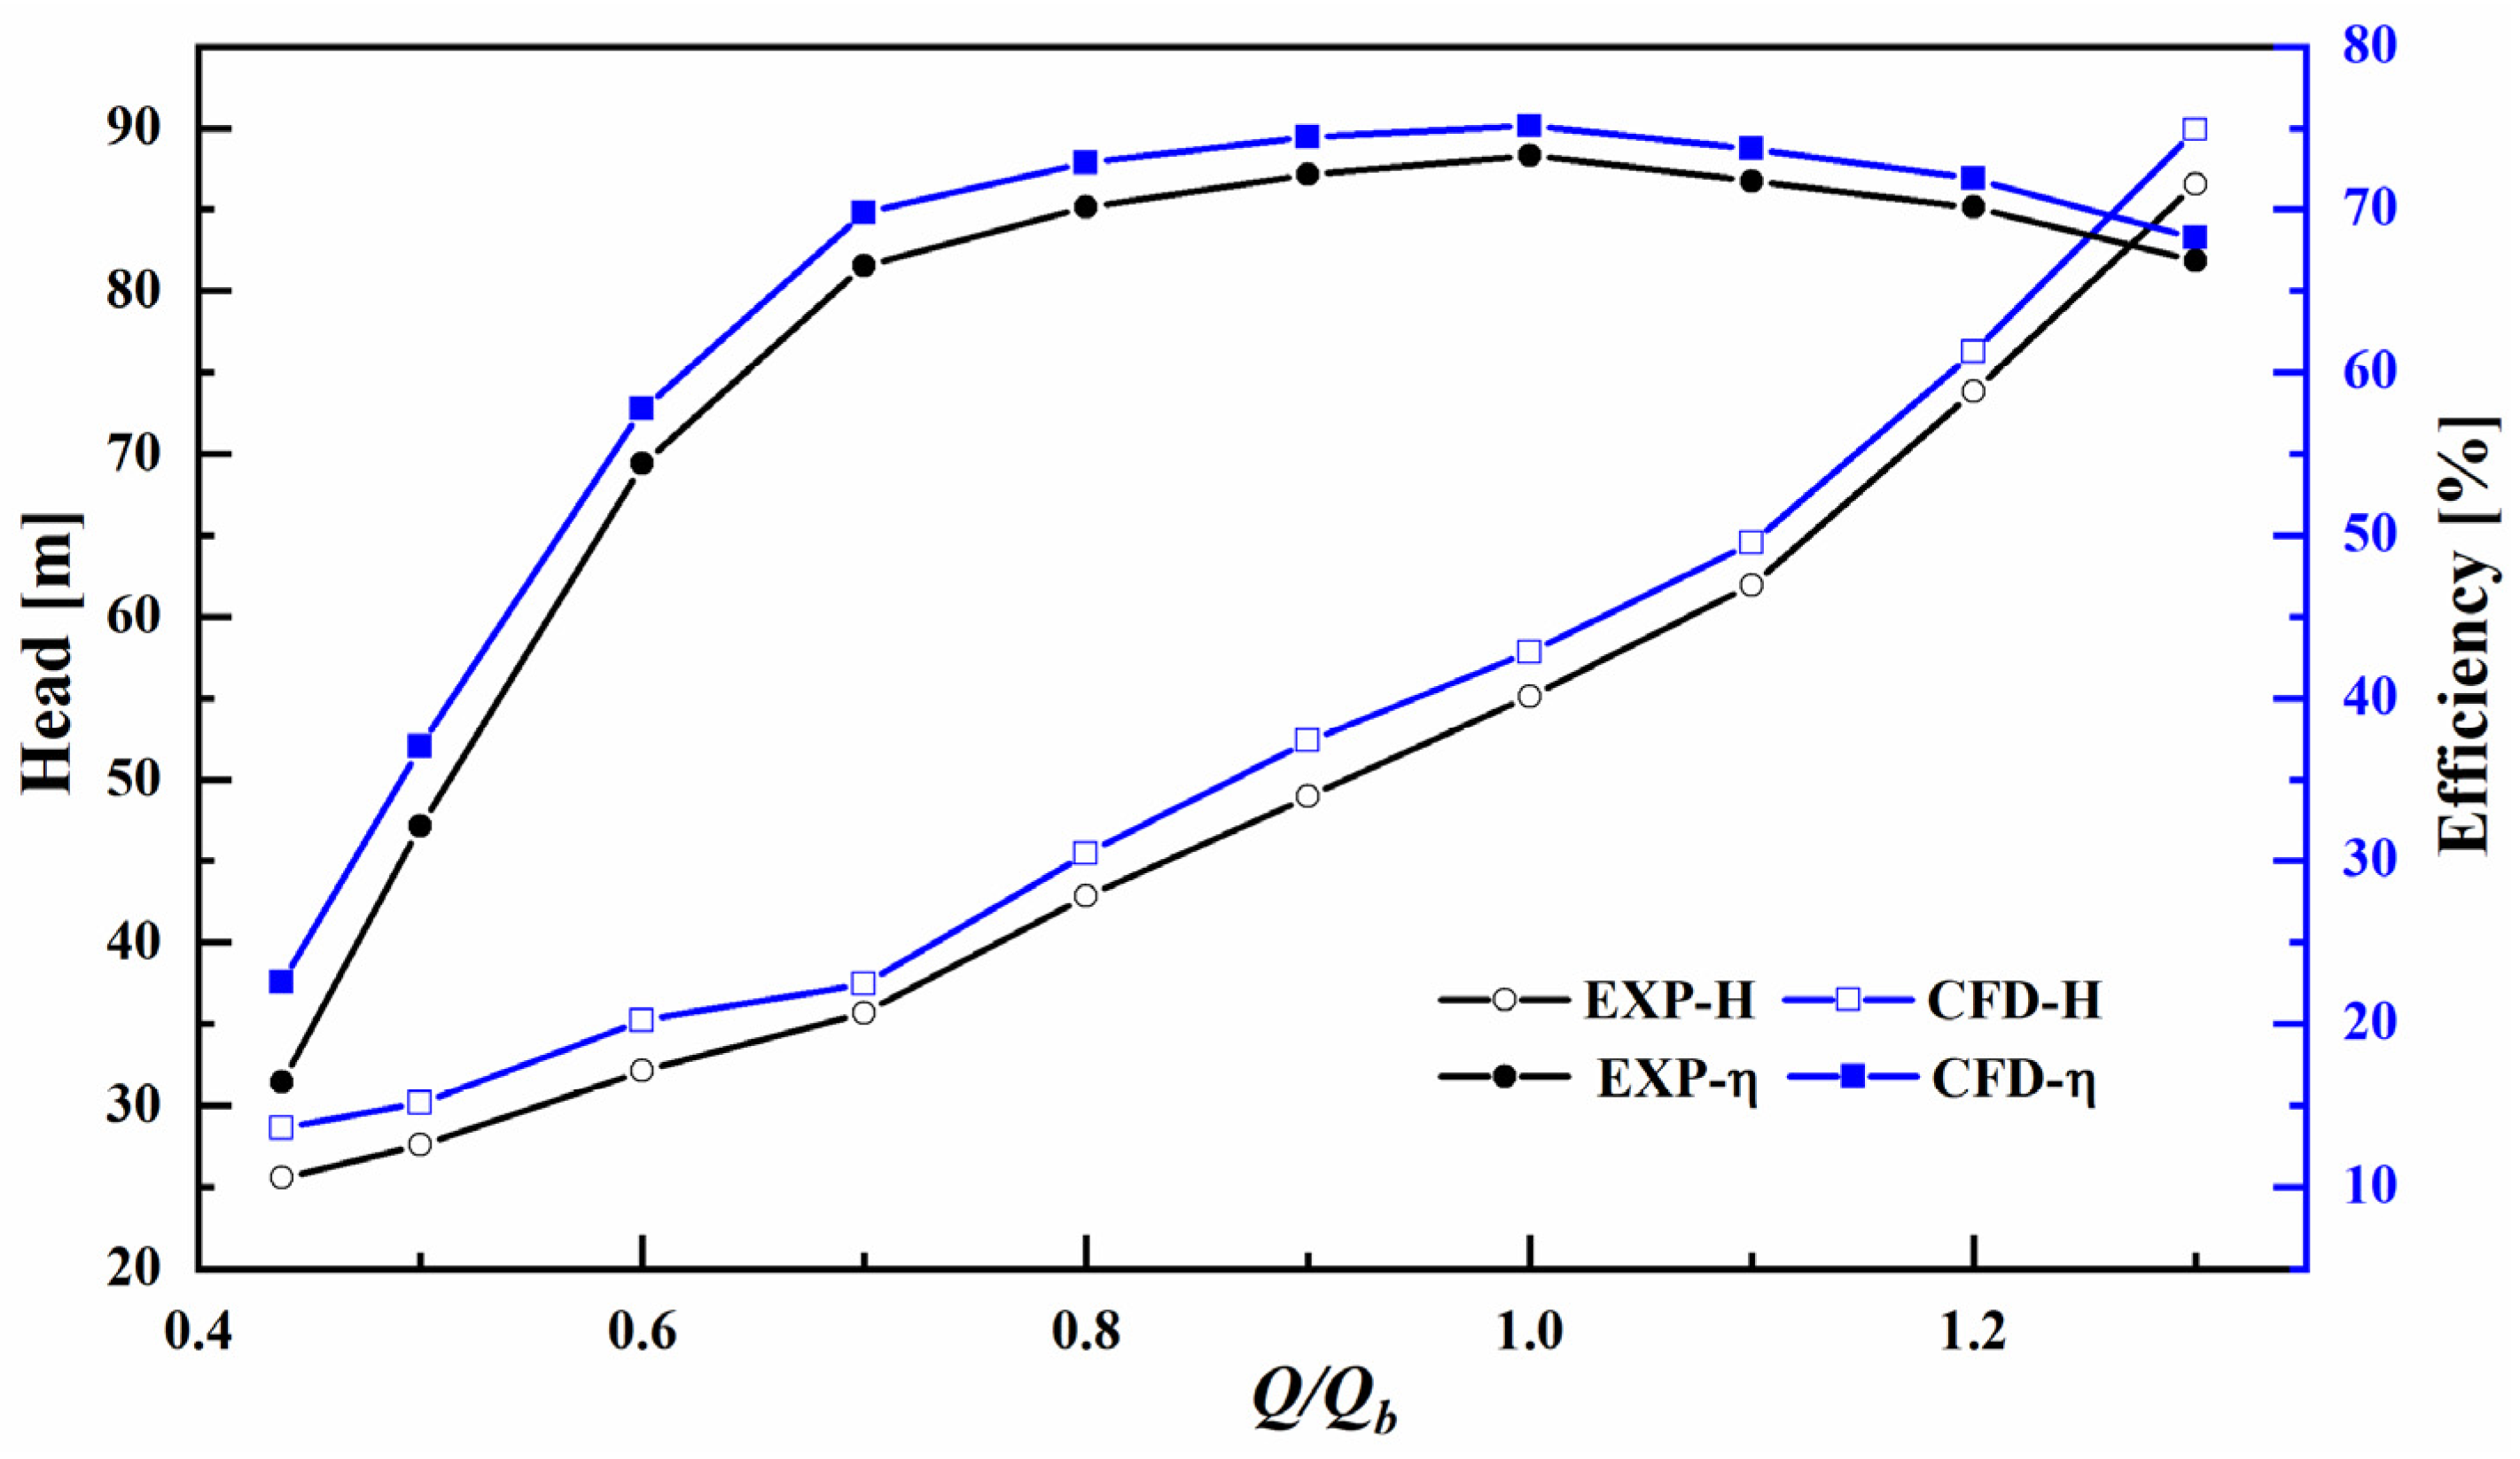
Figure 6 depicts the head and efficiency versus flow rate curve of PATs comparison between that obtained by CFD and the experiment method. The variation of head and efficiency with the flow rate were basically consistent in these two methods. As the flow rate increased, the head continually increased, while the efficiency increased at first and then decreased. The highest efficiency of PATs was reached at the flow rate of 78.3 m3/h. Under this operating condition, the head and efficiency predicted by the CFD method were 57.82 m and 75.15%, respectively. The prediction errors of efficiency and head were 2.47% and 4.91%, respectively.
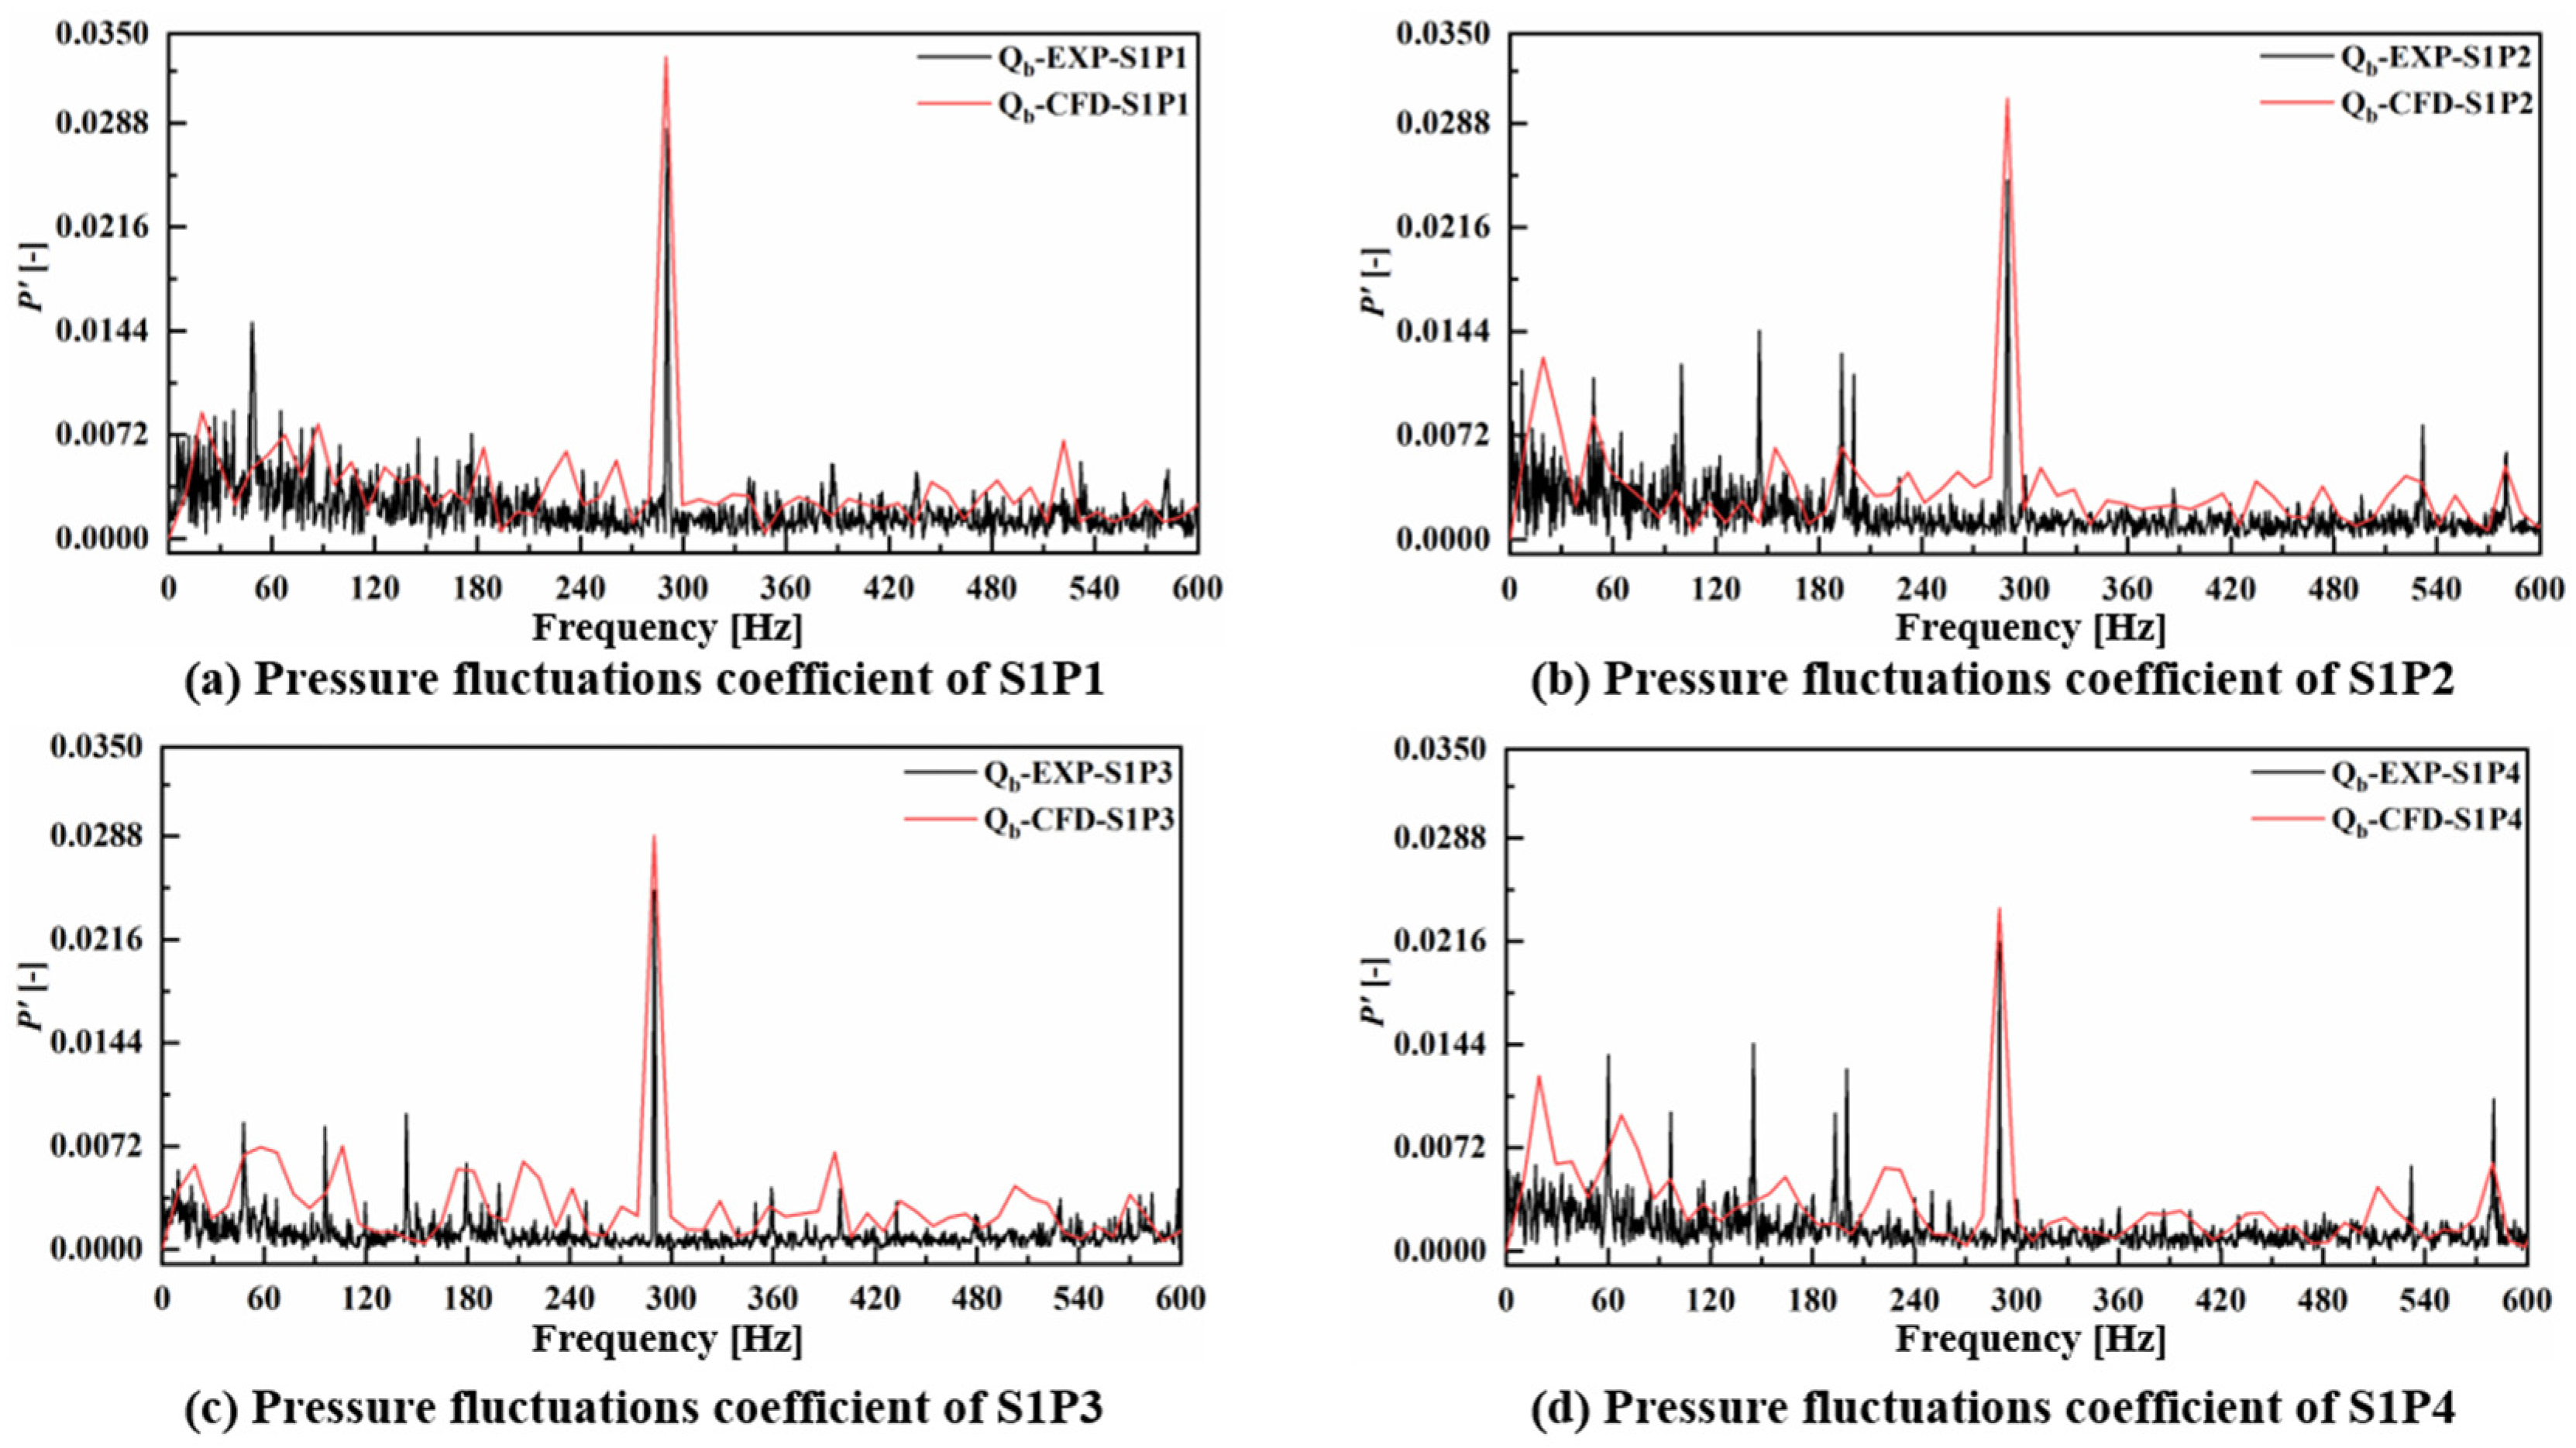
The pressure fluctuations frequency domain signal of the outlet duct’s S1 plane obtained by CFD and test are compared in Figure 7. The pressure fluctuations coefficient P is defined in Equation (9) to evaluate the intensity of pressure fluctuations [10]. At different positions in the circumferential direction of the S1 plane, the dominant frequency of pressure fluctuation predicted by CFD was 289.84 Hz and the calculation error was −0.056% compared with the theoretical blade passing frequency (BPF). The amplitude of the dominant frequency of pressure fluctuation obtained by CFD and testing were well-matched and the values of P were relatively large at the harmonic frequency of BPF, which indicated that the pressure fluctuations characteristic of outlet duct main were affected by the rotor-stator interaction. As the pressure sensors showed a higher sampling frequency than the CFD, and the test results were affected by the pressure fluctuation of the feed pump, the voltage variation of ECD, etc, the frequency components obtained by experiments are more diverse. Overall, the CFD prediction errors for both the hydraulic performance and pressure fluctuations characteristic of PATs are acceptable. Therefore, it can be concluded that the numerical simulation strategies adopted in the present study are dependable.
P = 2 ( p     p ¯ ) / ρ u 1 2
where p p ¯ , and u 1 represents the stable pressure, average pressure, and circumferential velocity of the impeller inlet.

3. Results and Discussion

3.1. Spatial and Temporal Evolution of the Vortex

The vortex behavior in the outlet duct on one impeller rotating period was obtained by the Q-vortex identification criterion, which was widely applied to identify the vortex in the fluid machinery [31,32,33]. The method is based on the eigenequation of the velocity gradient tensor:
λ 3 + P λ 2 + Q λ + R = 0
Hunt et al. defined a region over which the second matrix invariant Q > 0 as a vortex tube [34], where Q is expressed as follows:
Q = 1 2 ( A F 2 S F 2 )
where A and S represent the anti-symmetric and symmetric parts of the velocity gradient tensor, respectively, and correspond to the rotation and deformation in the flow field, respectively.
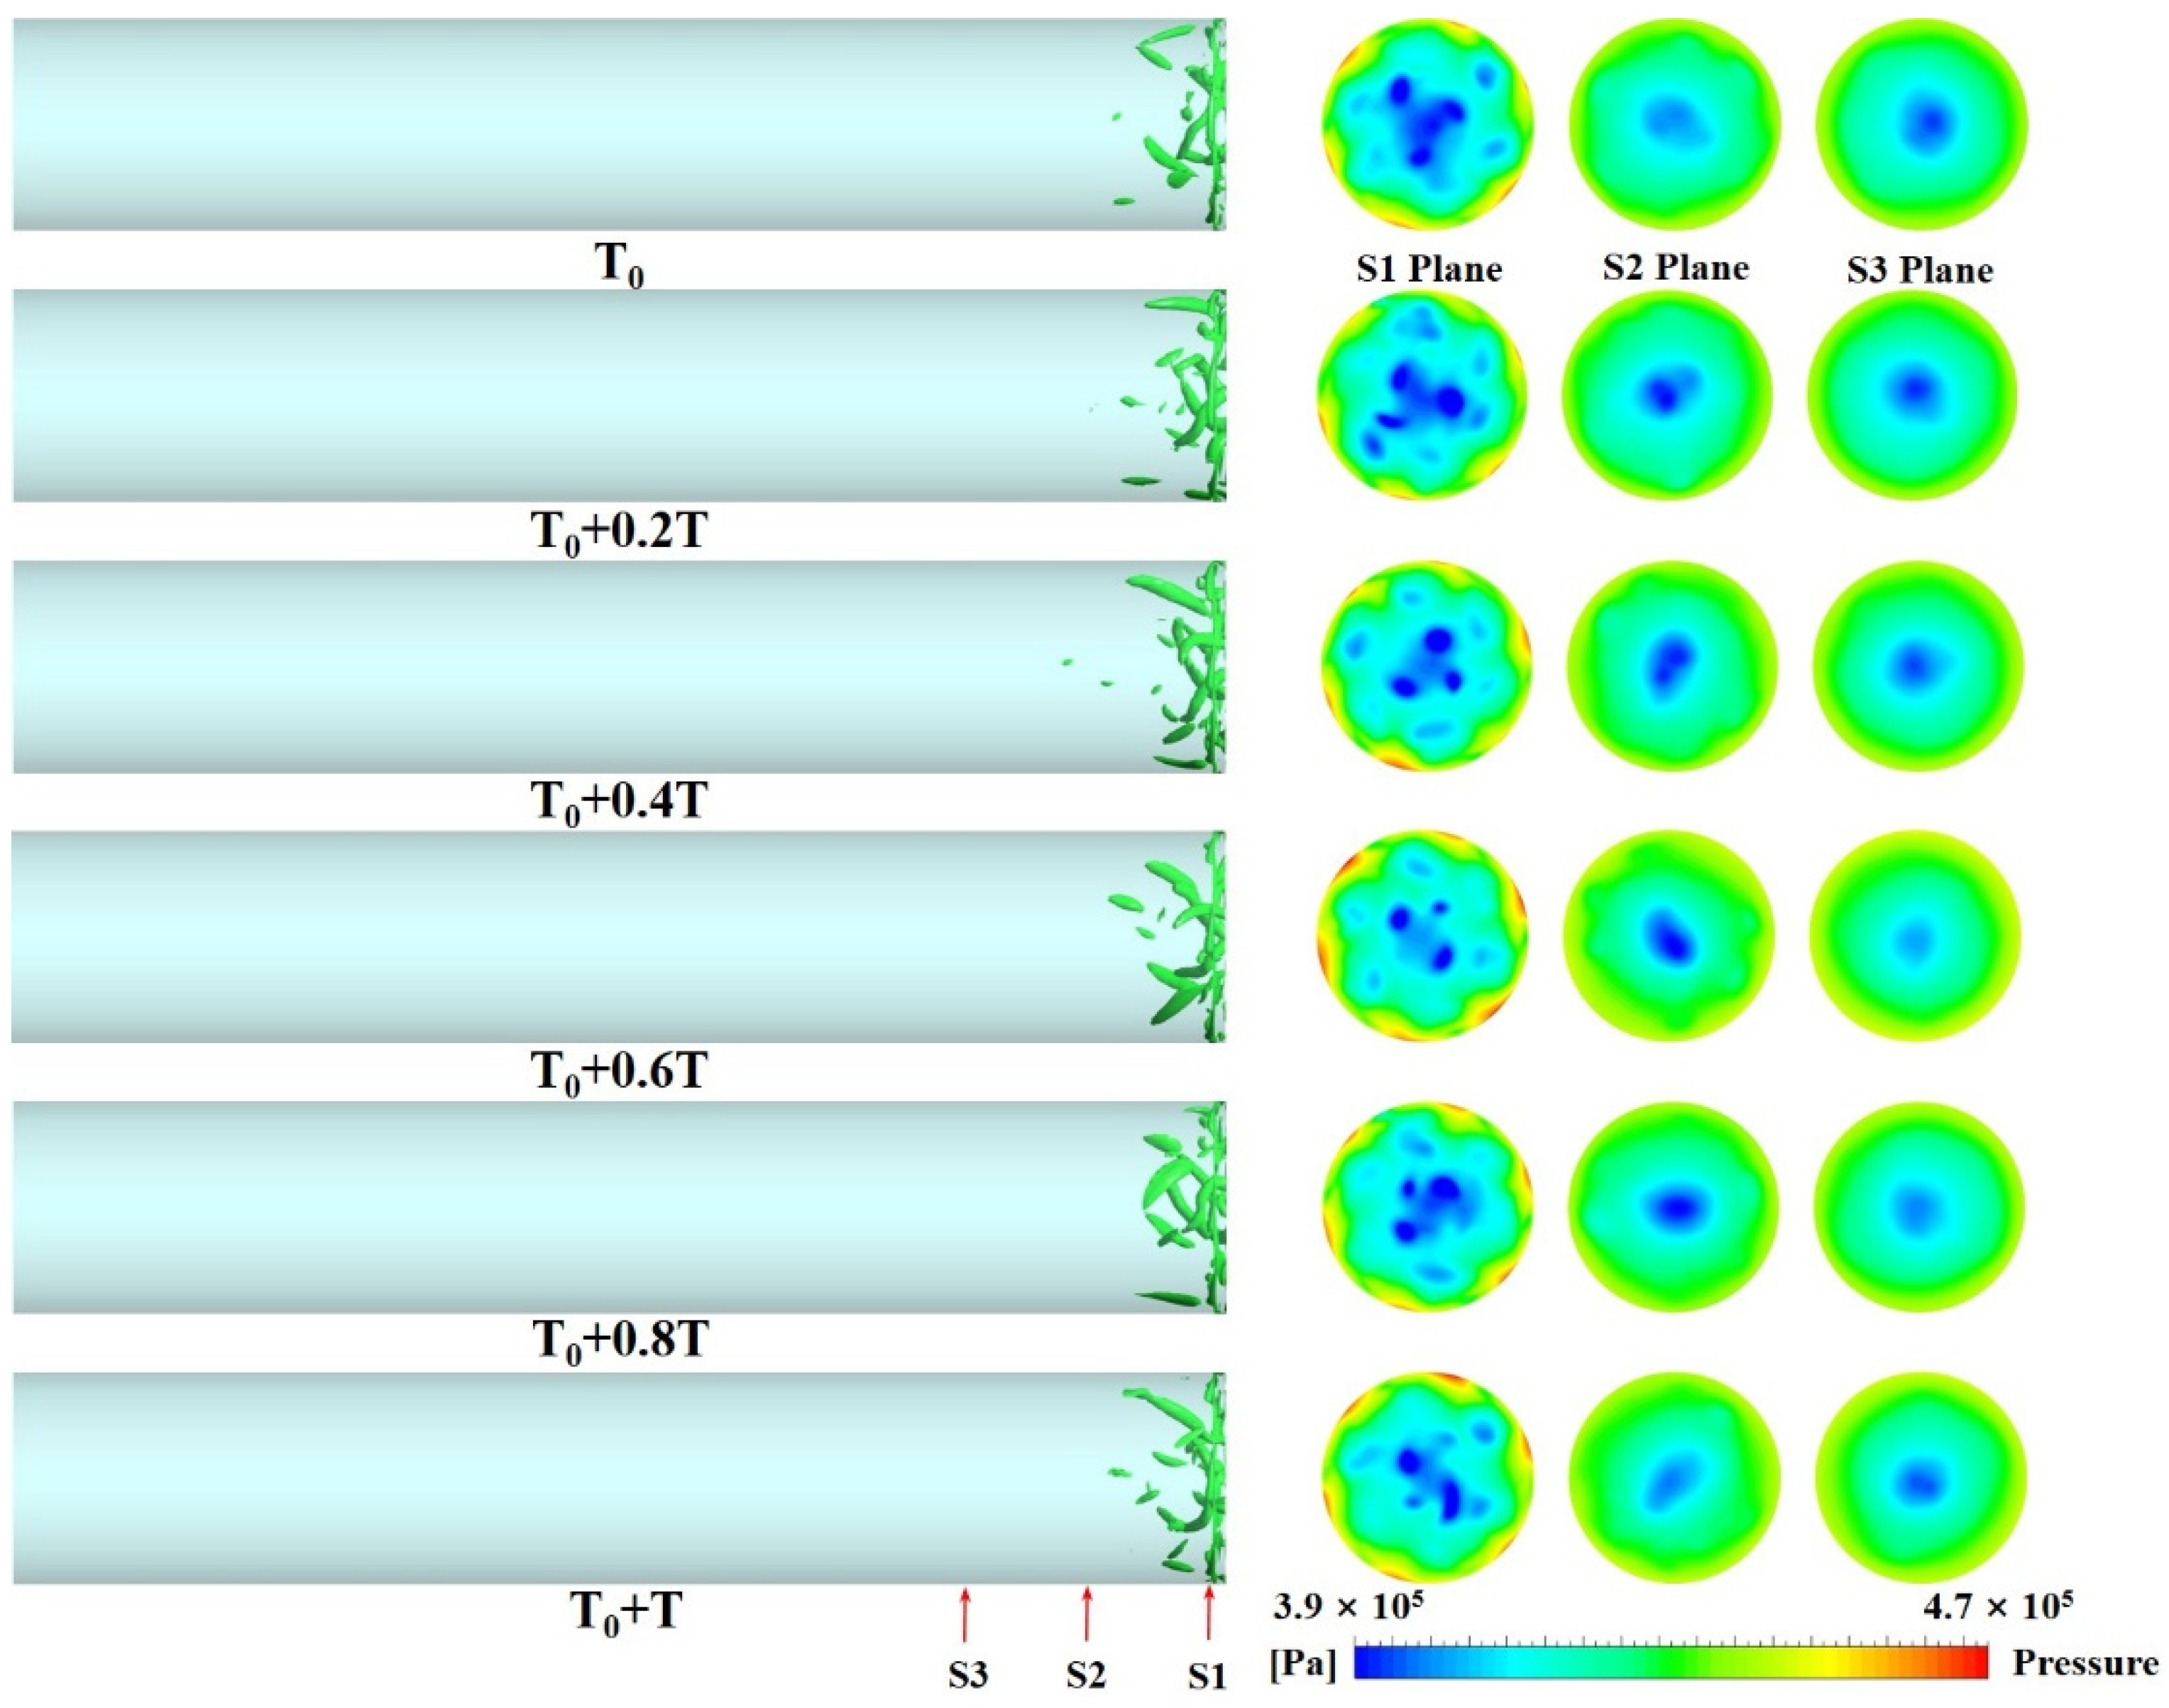
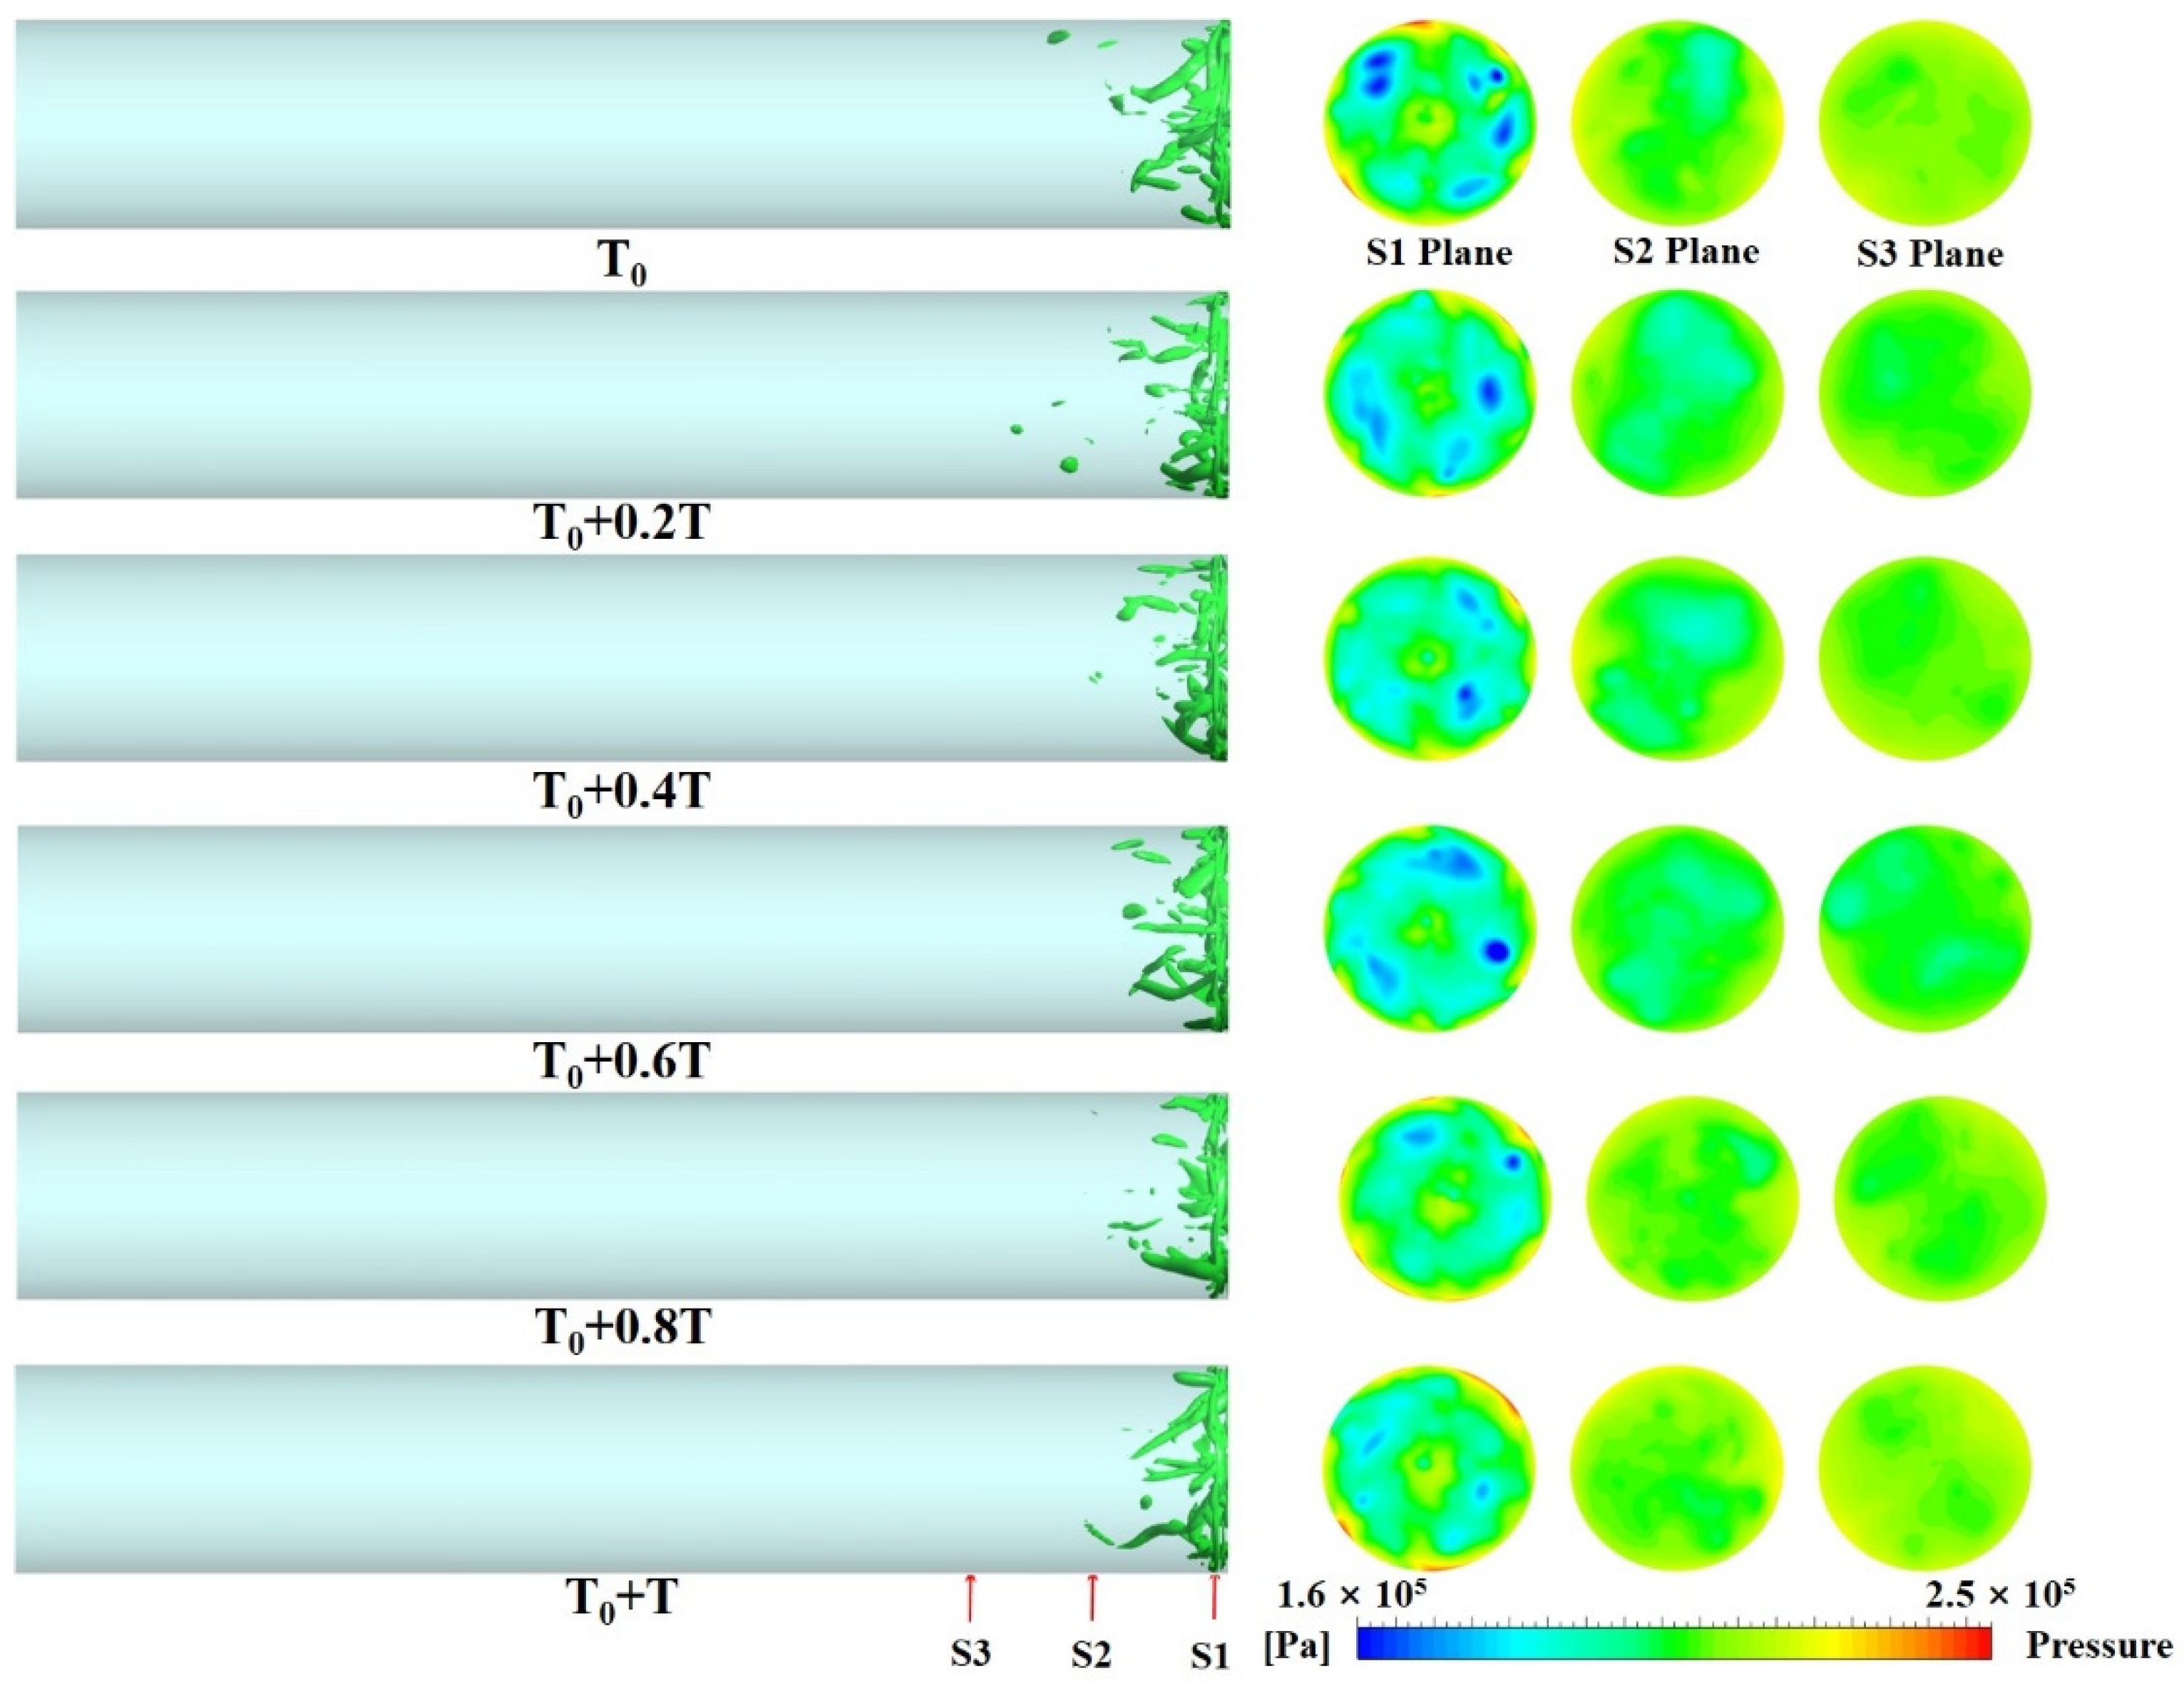
Figure 8 shows the vortex rope and static pressure evolution in the outlet duct at the part load condition, and the T0 and T represent the initial time and the total time of one revolution of the impeller, respectively. It can be seen that the vortex with relatively small scales and concentrate at the inlet of outlet duct. At the centre of the outlet duct, the multiple vortex rope is slender but quietly dissipates inside the main flow. The vortex near the wall of the outlet duct is generated by the high-velocity gradients near the wall and viscosity; the leakage flow from the front chamber wear ring promotes this phenomenon. With the rotating of the impeller, the vortex behaviors are not significantly changed, and the rotating direction of the vortex rope is consistent with the impeller. The static pressure in the position of the vortex core is lowest at different section planes of the outlet duct. In the S1 plane, the high-pressure regions appear near the wall, which is caused by the leakage flow from the front chamber wear ring; the number equals the number of blades. With the plane positioned away from the inlet of the outlet duct, the lowest static pressure region is concentrated at the core of the vortex rope as the fluid inner the duct with a high circumferential velocity.
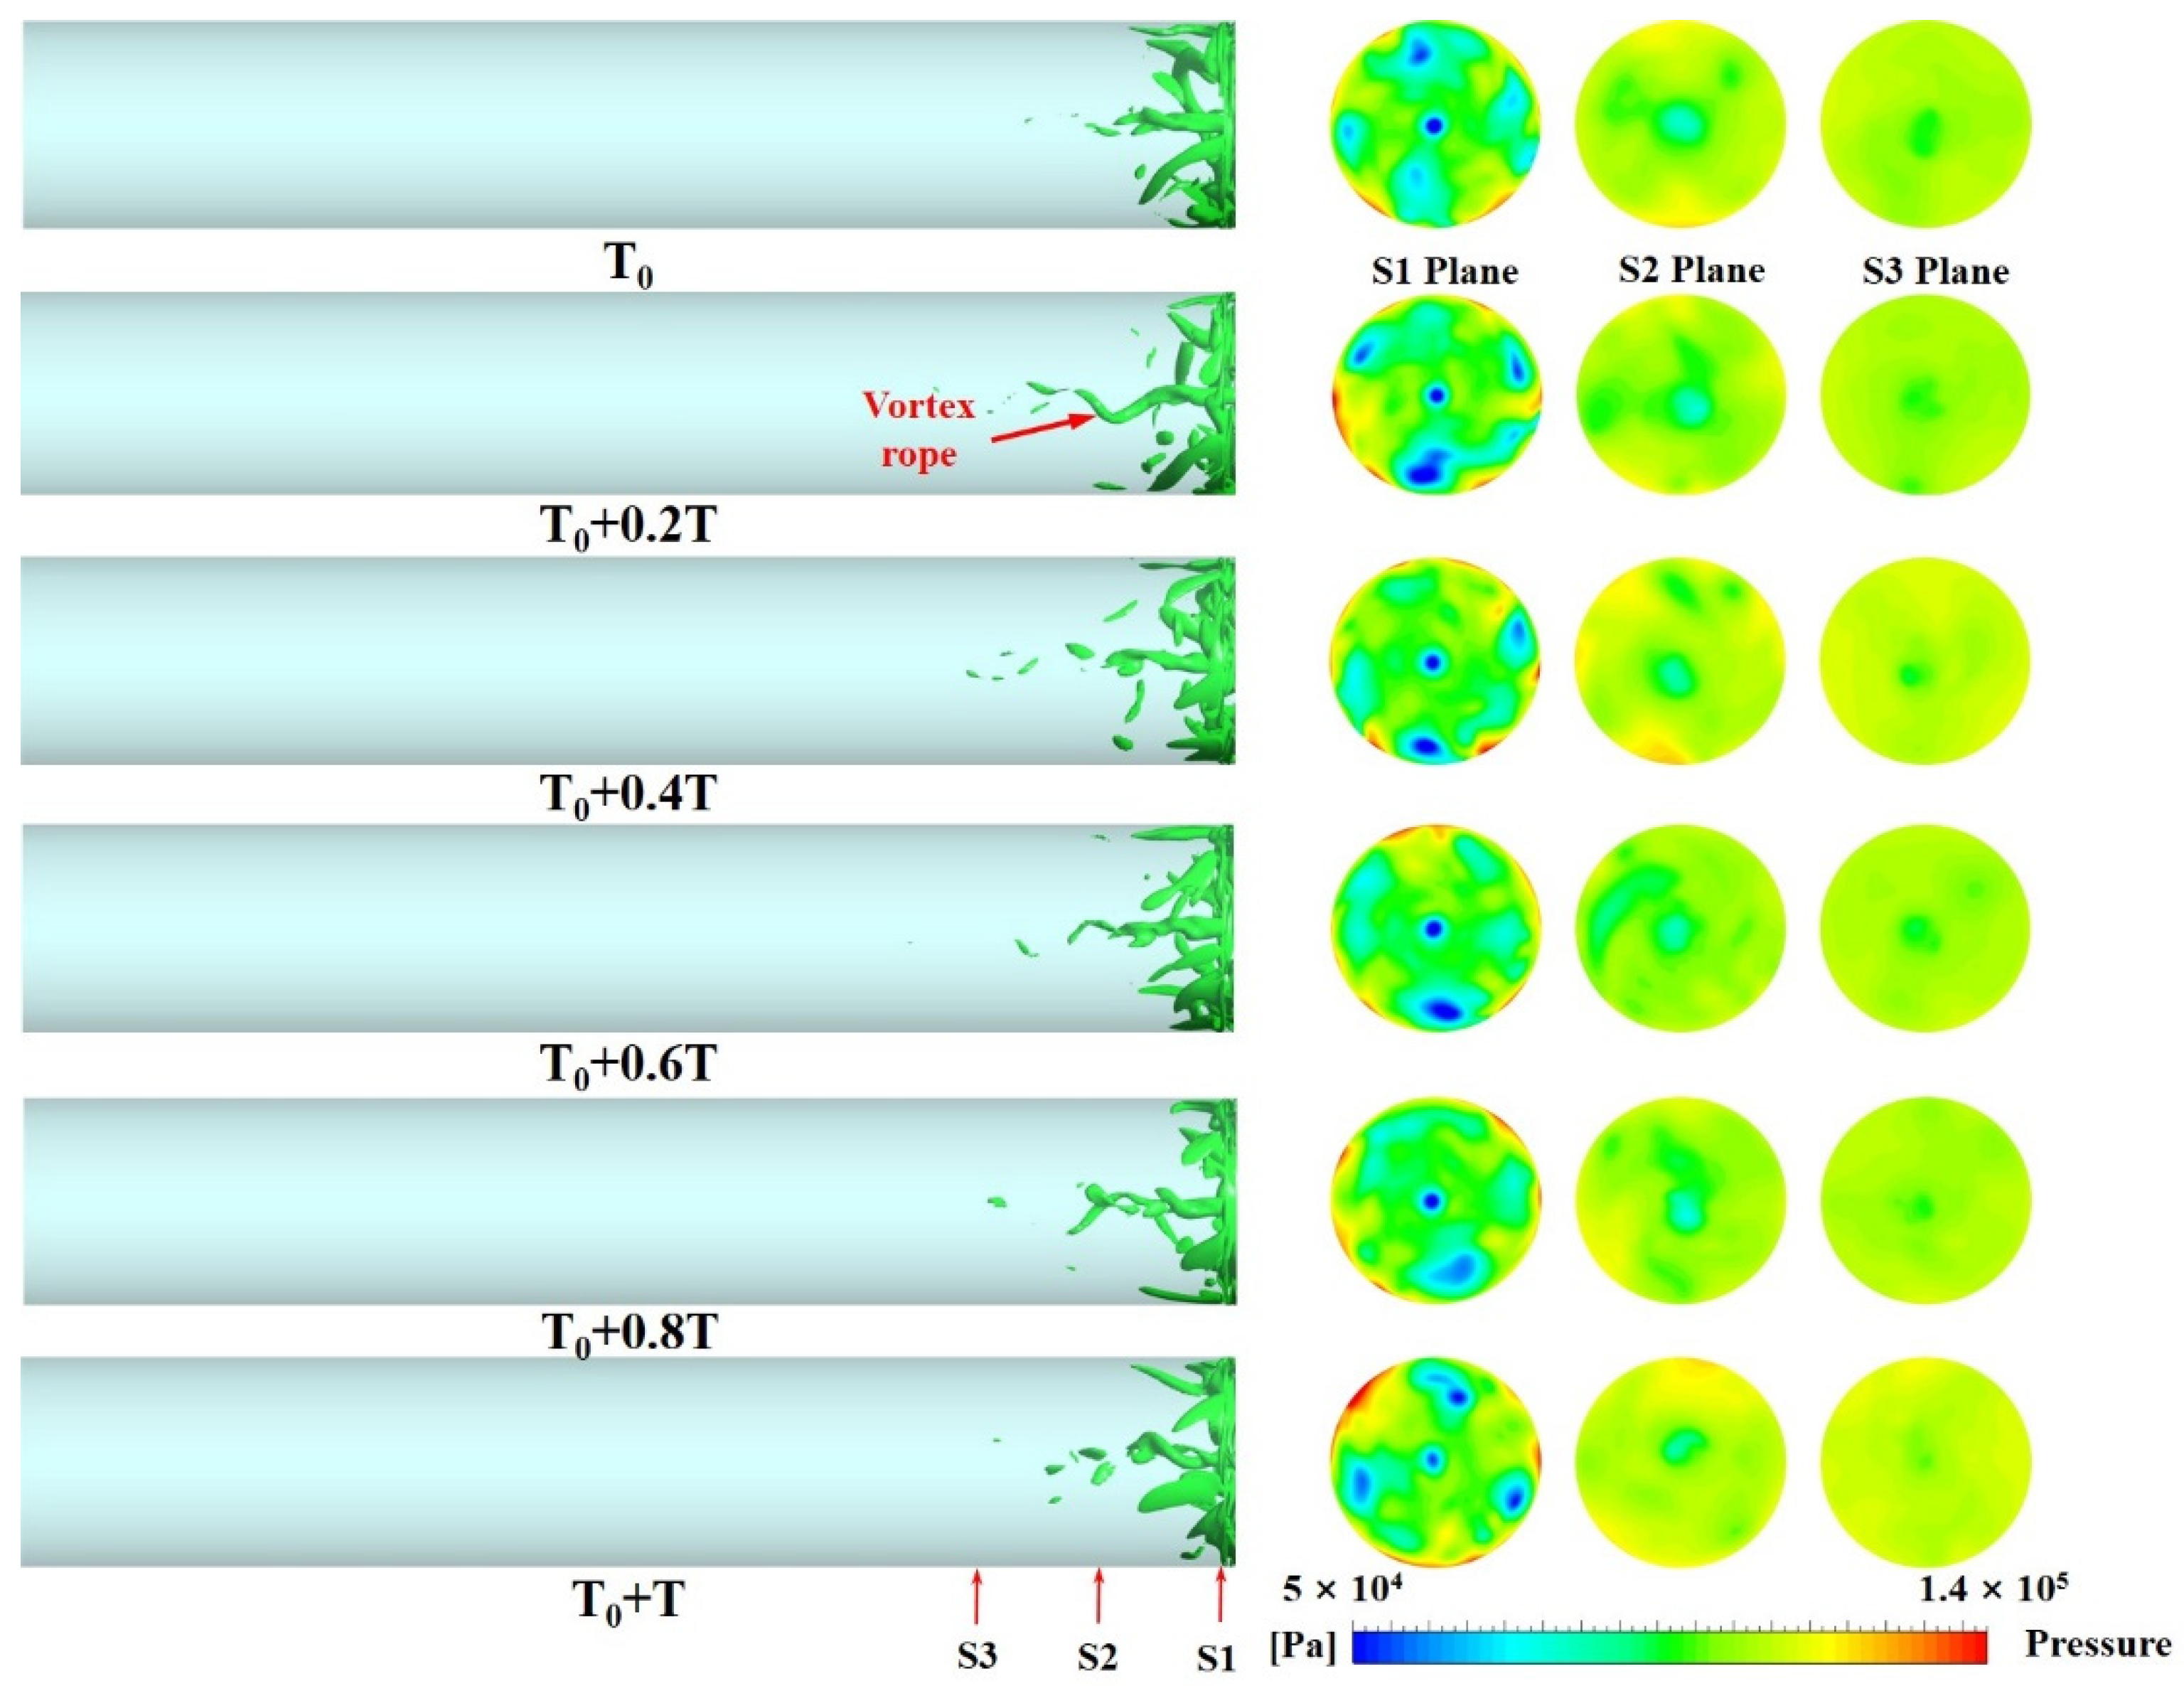
The vortex and static pressure evolution in the outlet duct under the overload condition is shown in Figure 9. The distribution position of the vortex was basically consistent with the part load condition, but it contained more energy and presents that the vortex has a large scale. The vortex was consistent with two parts for its location: the one concentrated at the downstream front chamber interface was caused by high-velocity leakage flow; and the other was vortex rope and located at the center of the outlet duct, which was generated by the counter-rotating swirl of the fluid outflow from the impeller under this operating condition. The vortex rope was spiral and its length varied with the impeller rotating. From the view of energy, the vortex rope contained more energy than the first part vortex, which was completely dissipated before the S2 plane. There was more than one low static pressure region in the S1 section near the vortex core. As the section moved away from the inlet of the outlet duct, the effects of the vortex and leakage flow to the local static pressure declined, and the distribution of pressure in the duct became more even.
Figure 10 presents the vortex and static pressure evolution in the outlet duct under the BEP condition. Under the same values of the Q-vortex identification criterion, the location of the vortex was basically consistent with other operating conditions but the vortex rope did not appear at the center of the outlet duct. The vortex behaviors were not significantly changed in one rotating period of the impeller. The low static pressure regions concentrated near the wall and did not exist at the center of the outlet duct. With the impeller rotating, the number of the lowest static pressure region in the S1 plane declined reflecting the process of vortex dissipation. In addition, the distribution of pressure in the S1 and S2 planes were relatively even and without the lowest static pressure region, which indicated that under the BEP operating conditions the vortex in the duct had less energy and was not able to develop into these planes.
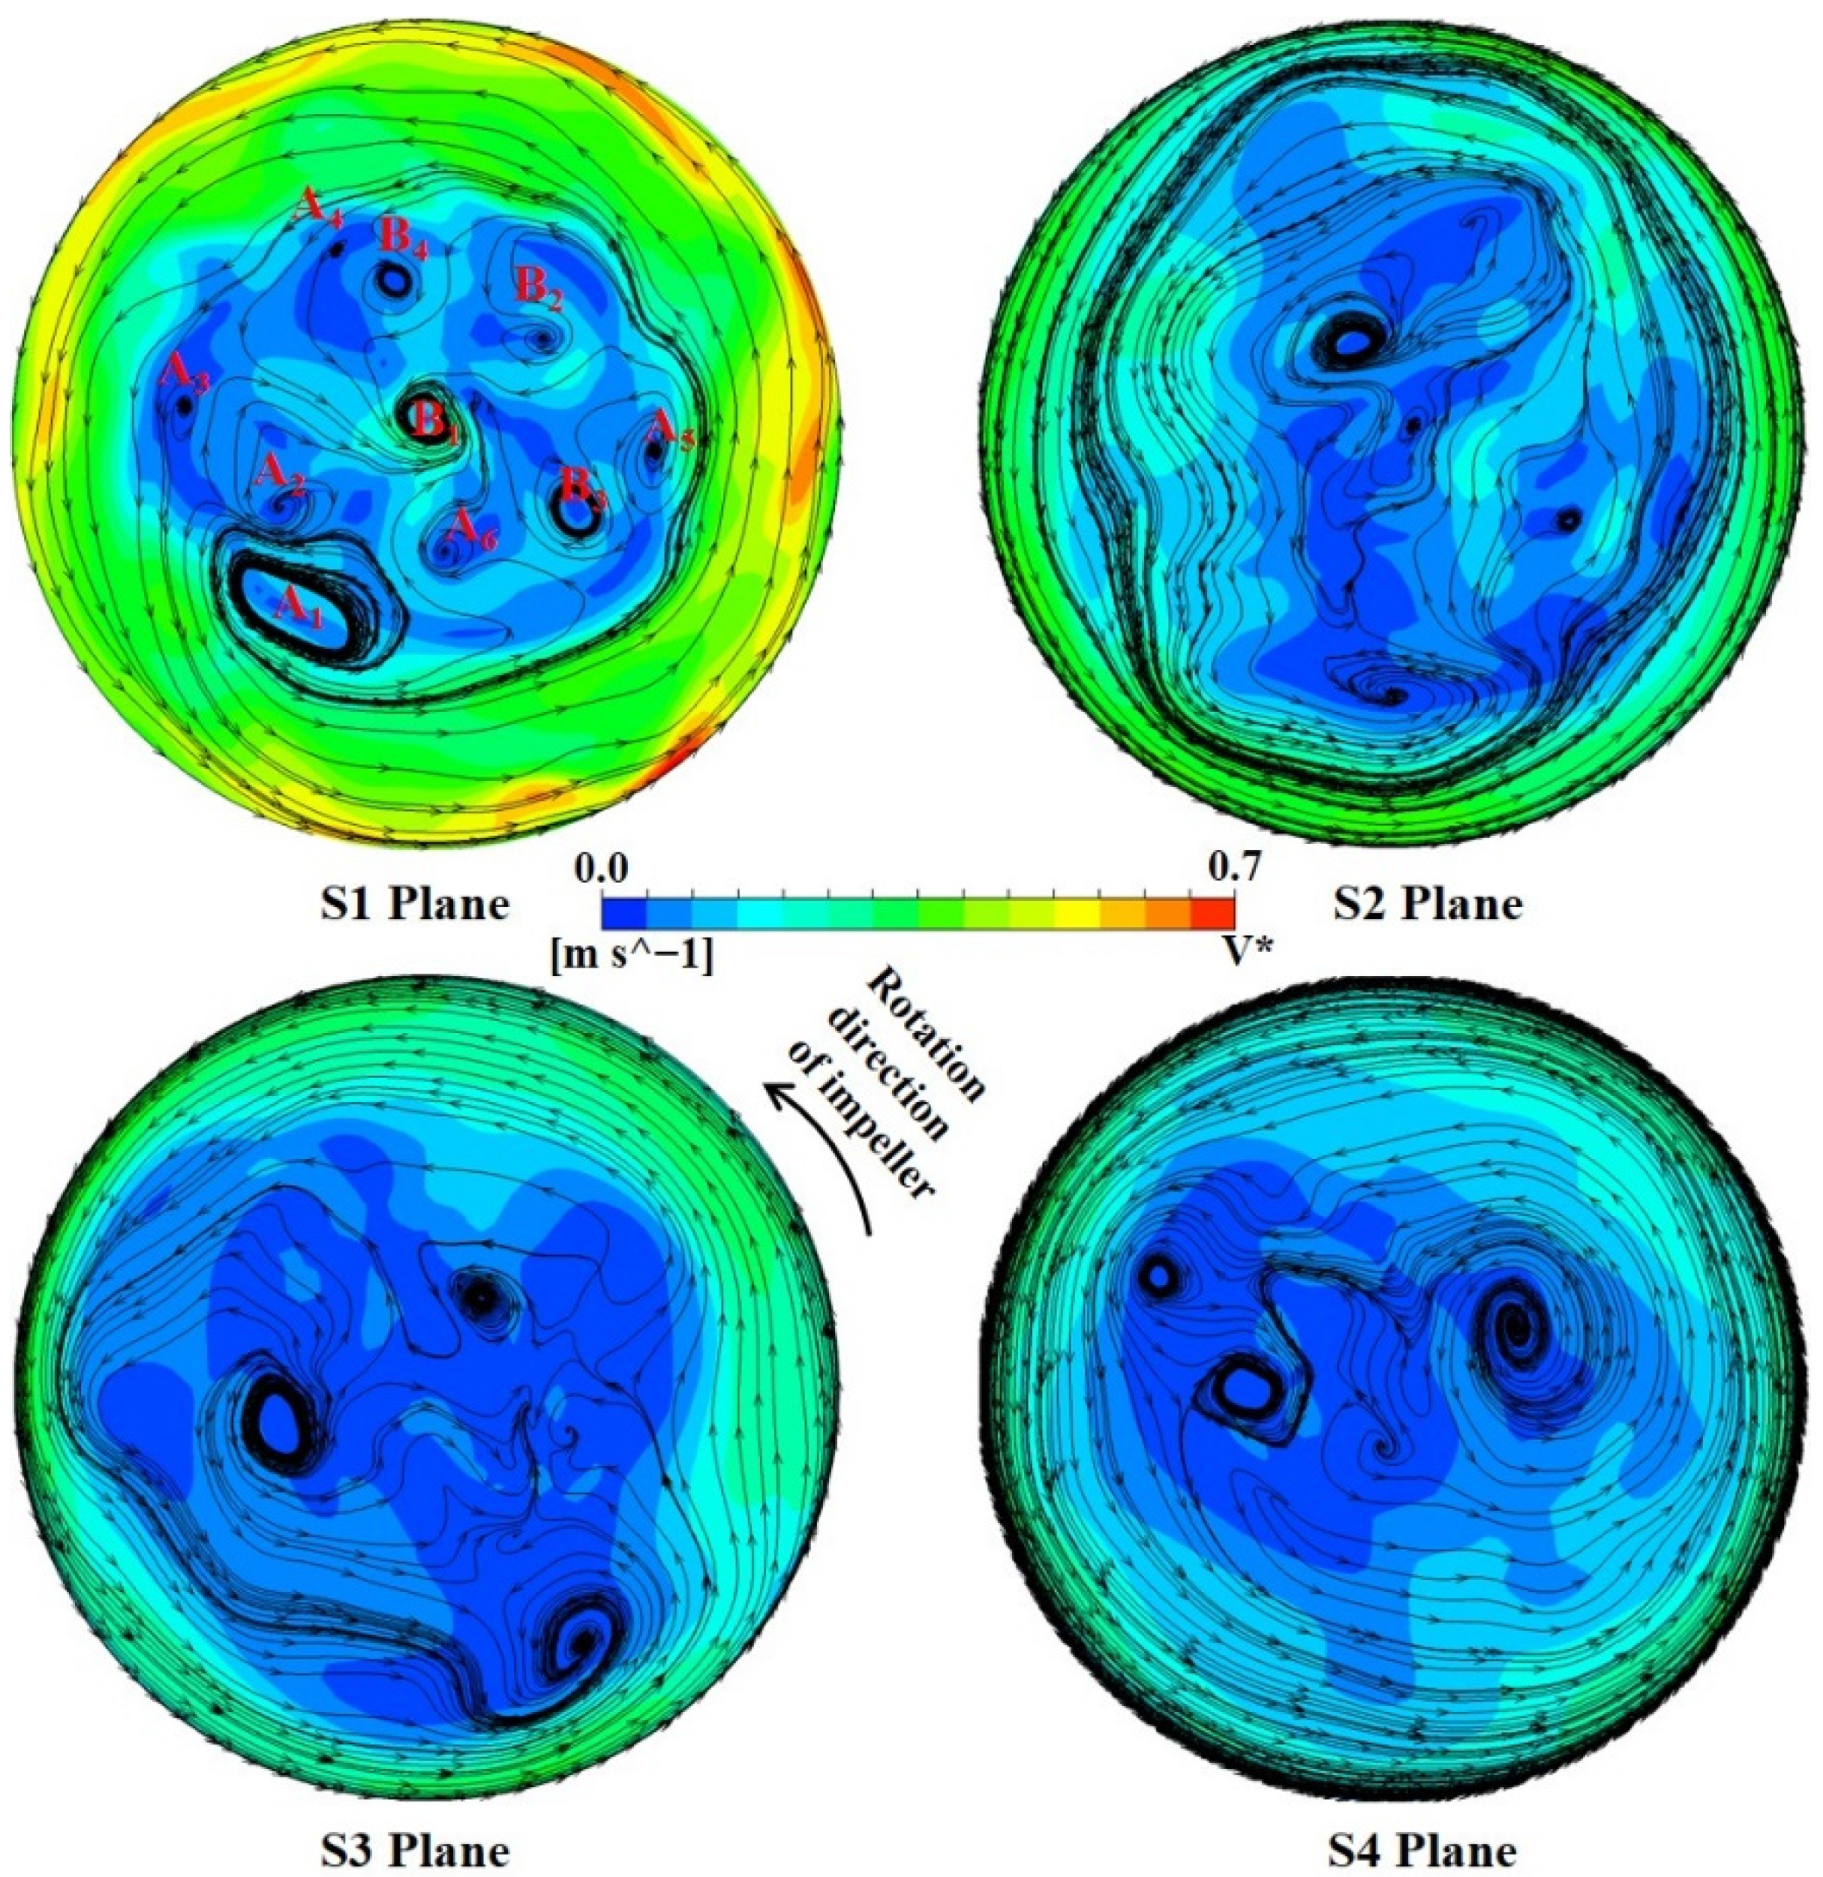
The flow characteristic and vortex behaviors were mainly affected by the outflow condition of the impeller and leakage flow from the front chamber wear ring. To further reveal the types and the location of the vortex in the outlet duct, the streamlines in the different section planes are illustrated in Figure 11. The local velocity is evaluated using the non-dimensional parameter V* as defined as Equation (12). The streamlines distributed in the different sections indicated that the leakage flow significantly affects the state of flow inside the duct. With the section plane away from the inlet of the outlet duct, the number of the vortices in the plane declines, and the streamlines are relatively evenly distributed. The multi-scale vortices are distributed in the S1 plane and classified into two types of vortexes according to the direction of velocity streamlines. The first one is called source vortexes, and has the characteristic of streamlining developed from the center of the vortexes to the far field. The biggest source vortexes A1 is caused by the adverse inlet condition of the outlet duct, and its streamlines are the same as the rotating direction of the impeller. In addition, six source vortexes appear in the S1 plane, and the number equals the blades. It can be inferred that the source vortexes may propagate from the blade-vortex or trailing edge vortex where one blade-vortex or trailing edge vortex merges into the A1 and others distribute in the circumferential direction. The streamlines originate from the center of the source vortexes and converge to form other types of vortexes, which are named sink vortexes. The streamlining characteristic of sink vortexes developed from the far field to the center of the vortexes, and the core of sink vortexes such as B1, B2, B3, and B4 lie at the streamlined end nodes of source vortexes. Furthermore, combining analysis of the counter of velocity and the position of vortexes, it can be concluded that the vortexes’ core mainly lies in the local low-velocity regions of the plane. With the section plane away from the inlet of the outlet duct, the number of vortexes inside it declines, and the small-scale vortexes are integrated into a large-scale vortex or dissipated.
V * = v / u 1

3.2. Vorticity and Pressure Fluctuation Characteristics

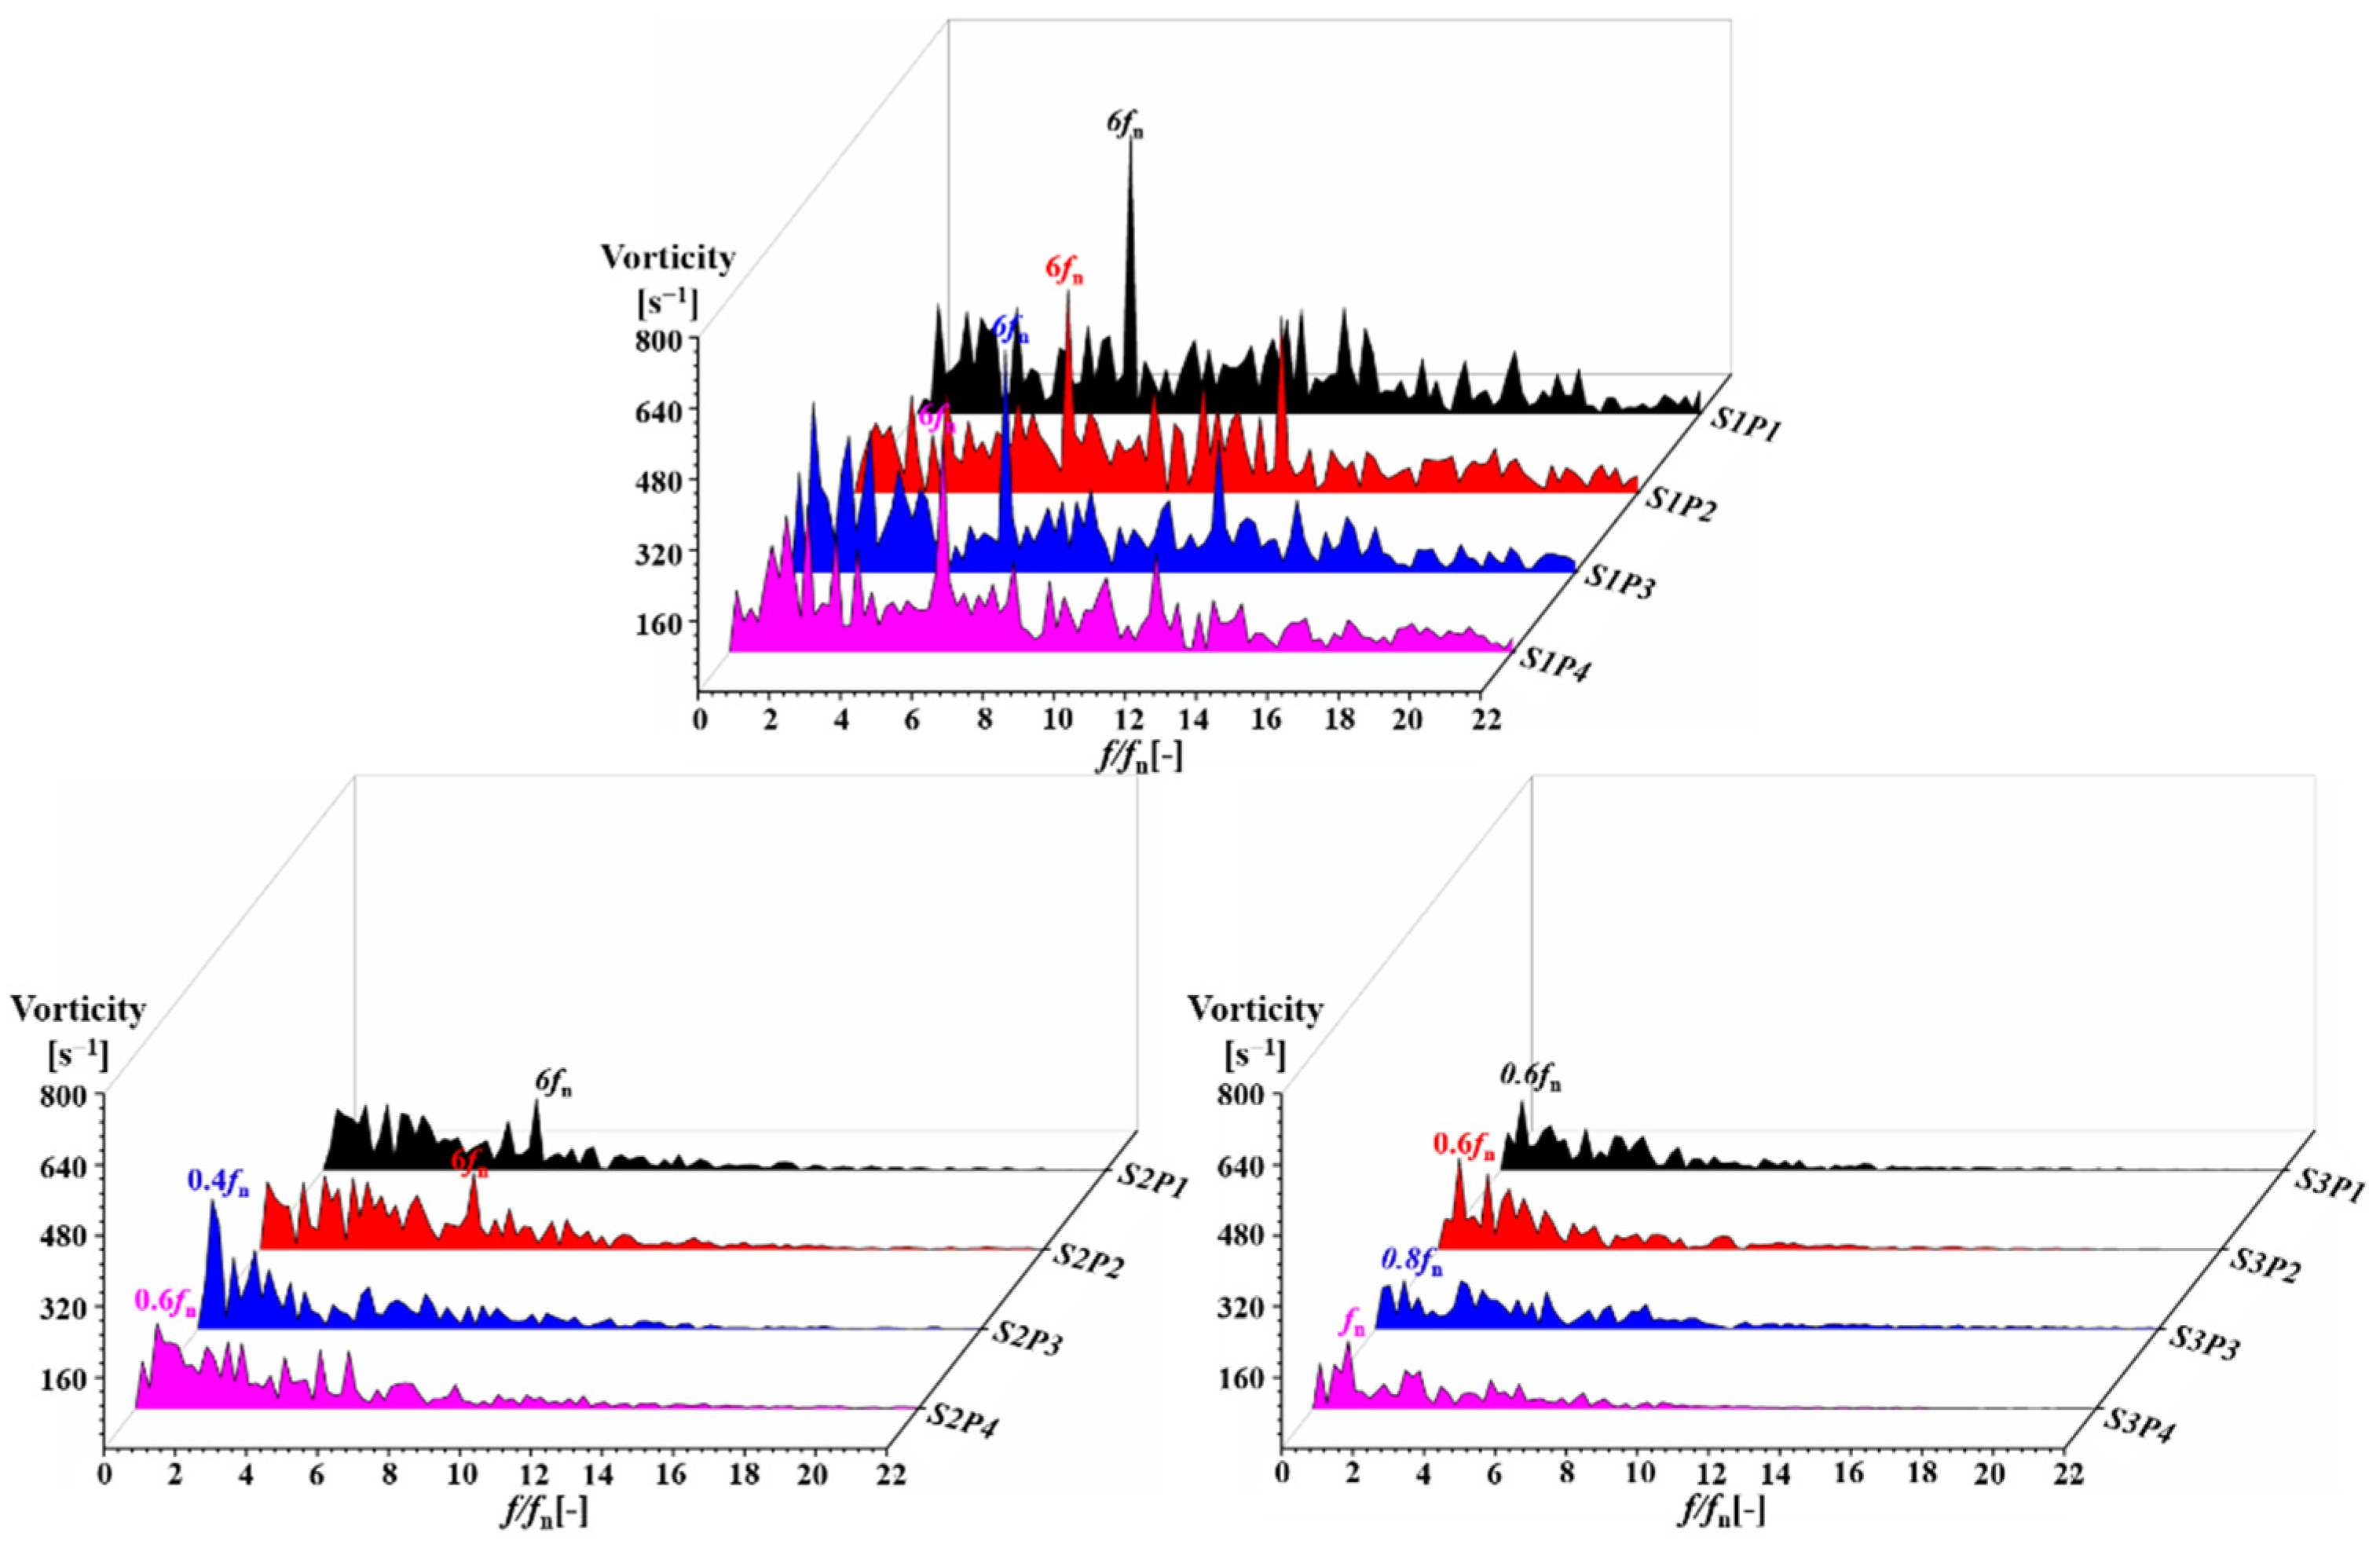
To further analyze the vortex evolution effect on local pressure and to reveal the sources of the frequency component of pressure fluctuation, the vorticity and pressure signal of the outlet duct in the impeller’s last five revolutions were analyzed using the Fast Fourier Transform algorithm. The frequency domain of vorticity and pressure fluctuation in the outlet duct at the BEP condition is presented in Figure 12 and Figure 13, respectively. As shown in Figure 12, the dominant frequency of vorticity fluctuation in the S1 plane was blade frequency of 6 fn and broader bandwidth. Due to the monitoring point distribution near the walls of the duct, it can be inferred by combining the analysis results of Figure 10 and Figure 11 that those vorticity fluctuations were mainly caused by the leakage flow from the front chamber. With the position of monitoring points away from the inlet of the outlet duct, the dominant frequency of vorticity fluctuation varies with the locations of the monitoring point, the fluctuation amplitudes, and bandwidth decline. Overall, the vorticity fluctuation domain frequency in the duct consists of 6 fn, fn, 0.8 fn, 0.6 fn, and 0.4 fn, where 6 fn is caused by the rotor-stator interaction, fn is closely related to the shedding frequency of the blade trailing edge vortex, and 0.8 fn, 0.6 fn, and 0.4 fn may be caused by the vortex evolution frequency generated in the outlet duct. With the section plane away from the inlet of outlet duct, the rotor-stator interaction effect on the evolution of the vortex declines.
Compared with the vorticity fluctuation, the domain frequency of pressure fluctuation in the different section planes of the outlet duct is consistent, and the value is 6 fn, which indicates that the rotor-stator interaction is the dominant contributor to the pressure fluctuation in the outlet duct. The pressure fluctuation amplitudes of different monitoring points are almost equal and with a broader bandwidth in the low-frequency regions. The amplitudes under the frequency of 0.4 fn and 0.6 fn is relatively large, revealing that the vorticity shedding deteriorates the local pressure fluctuation characteristics.
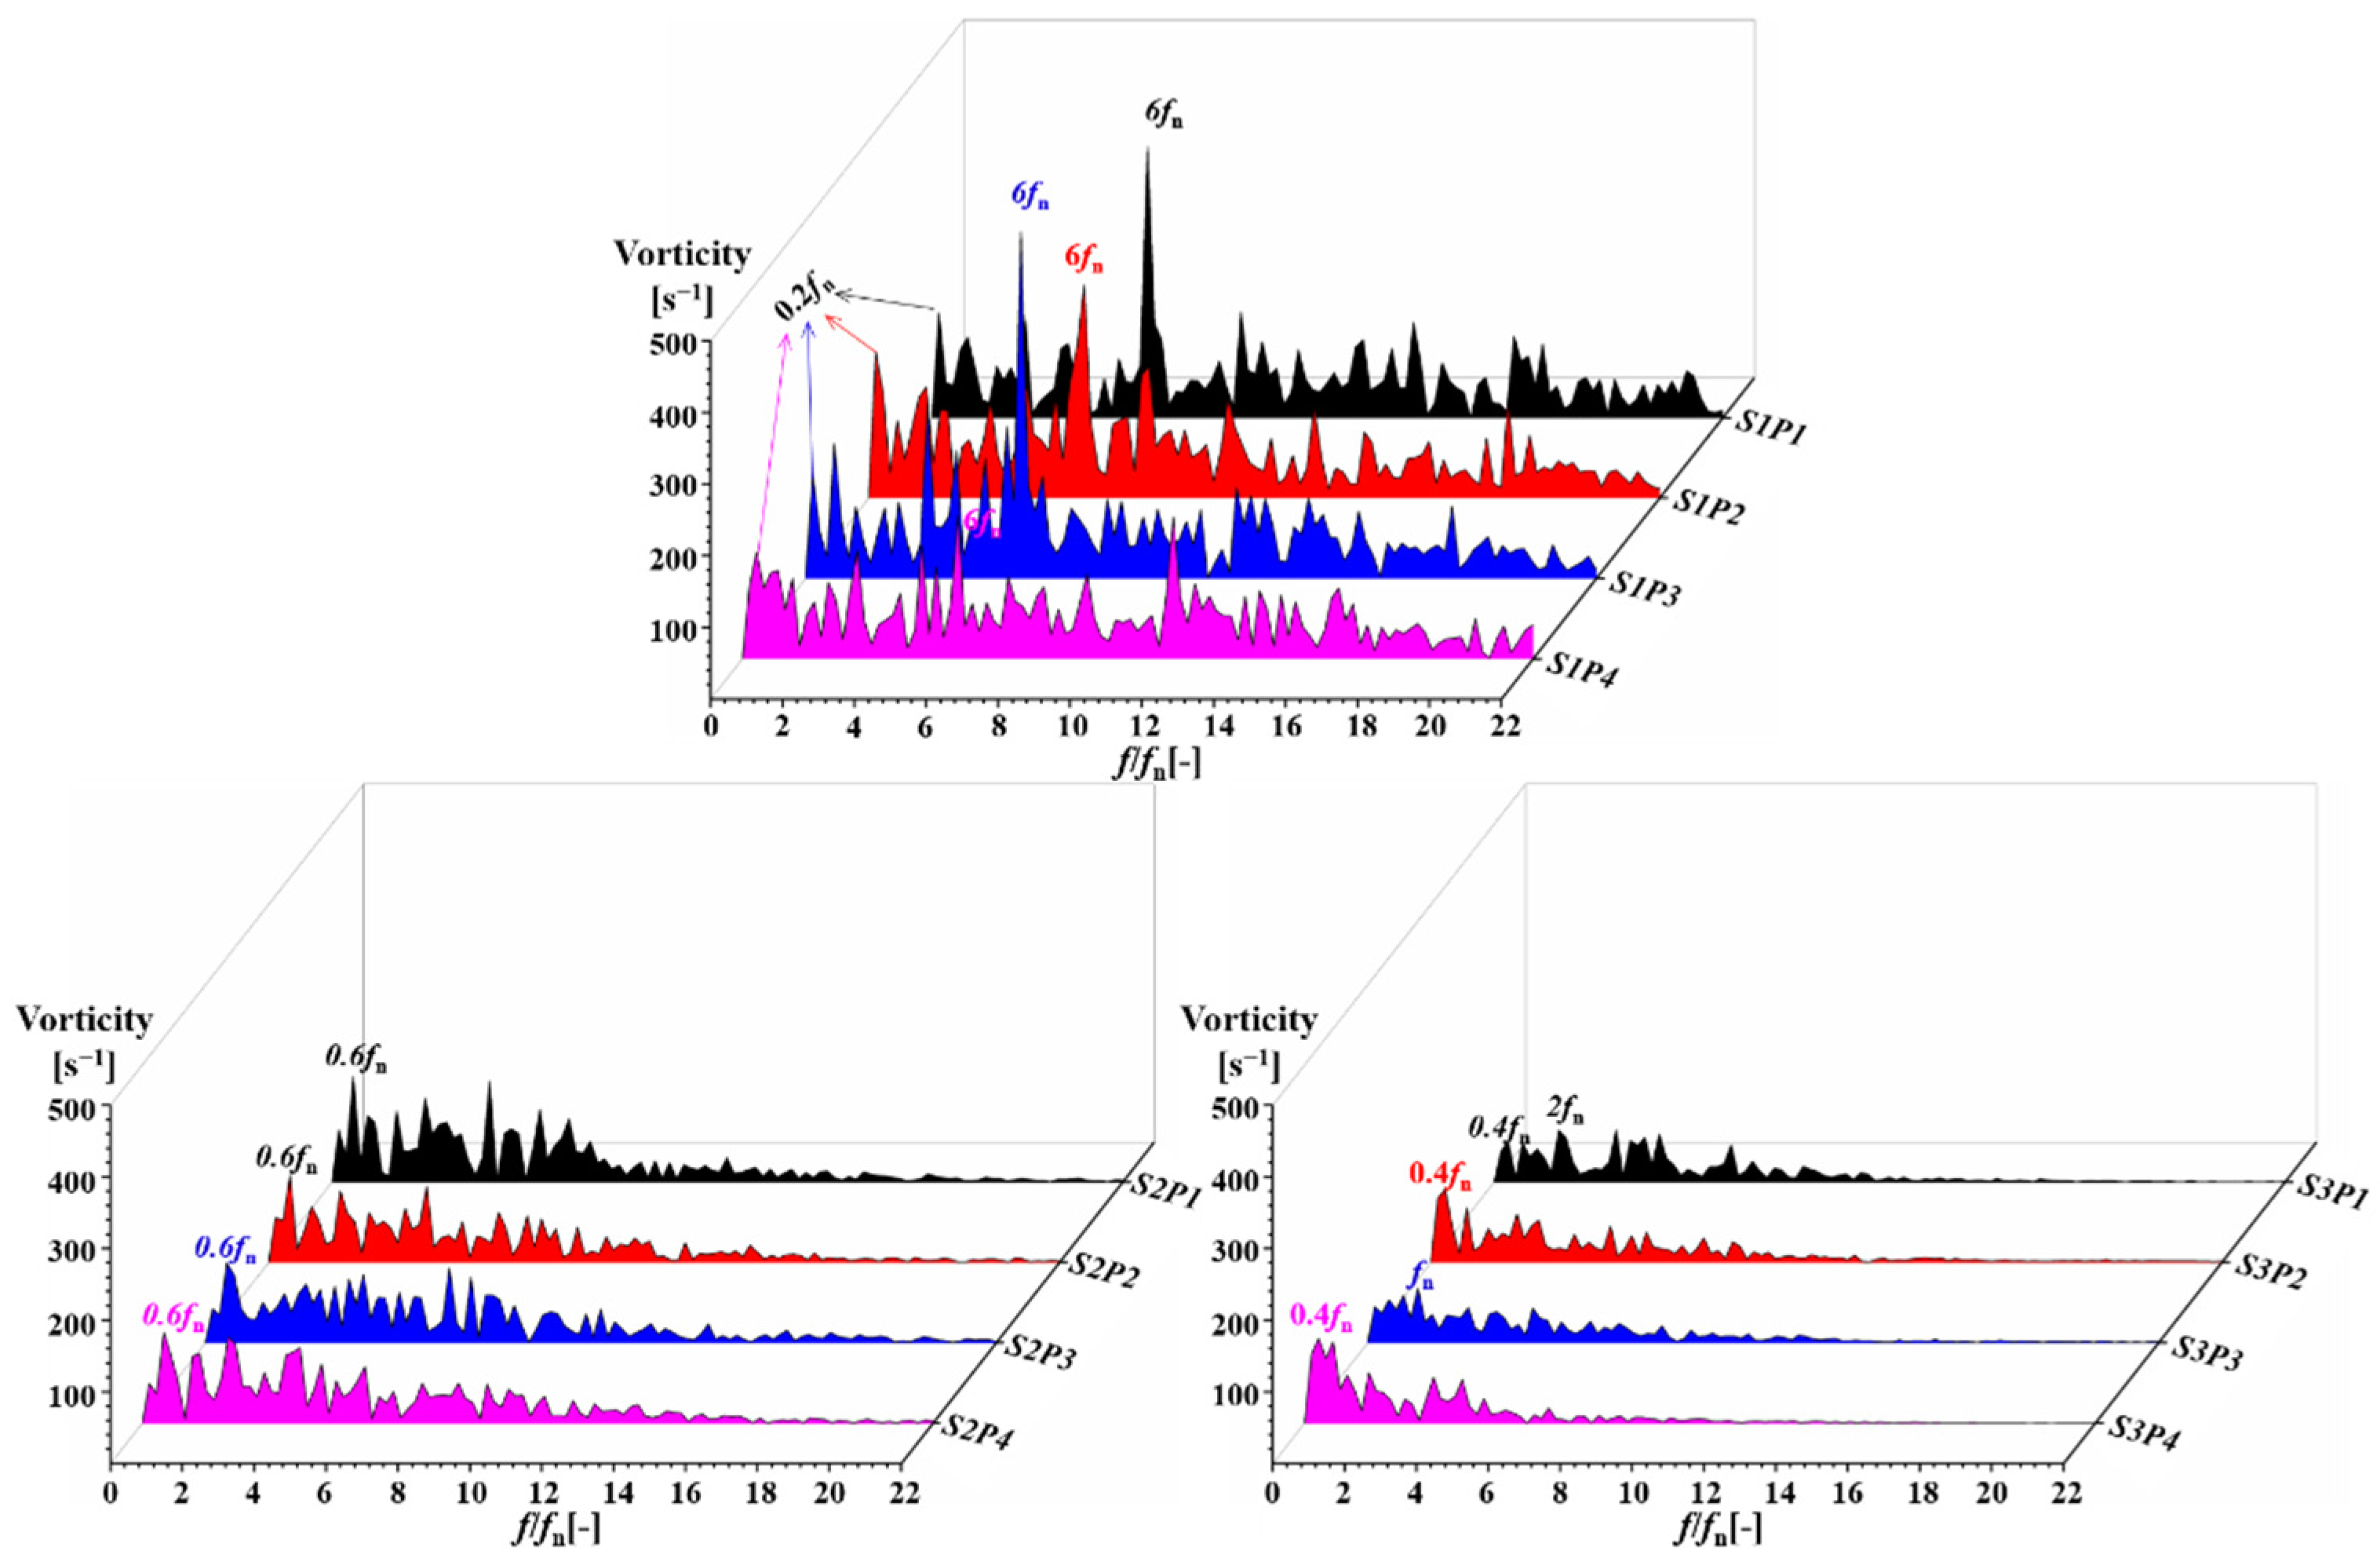
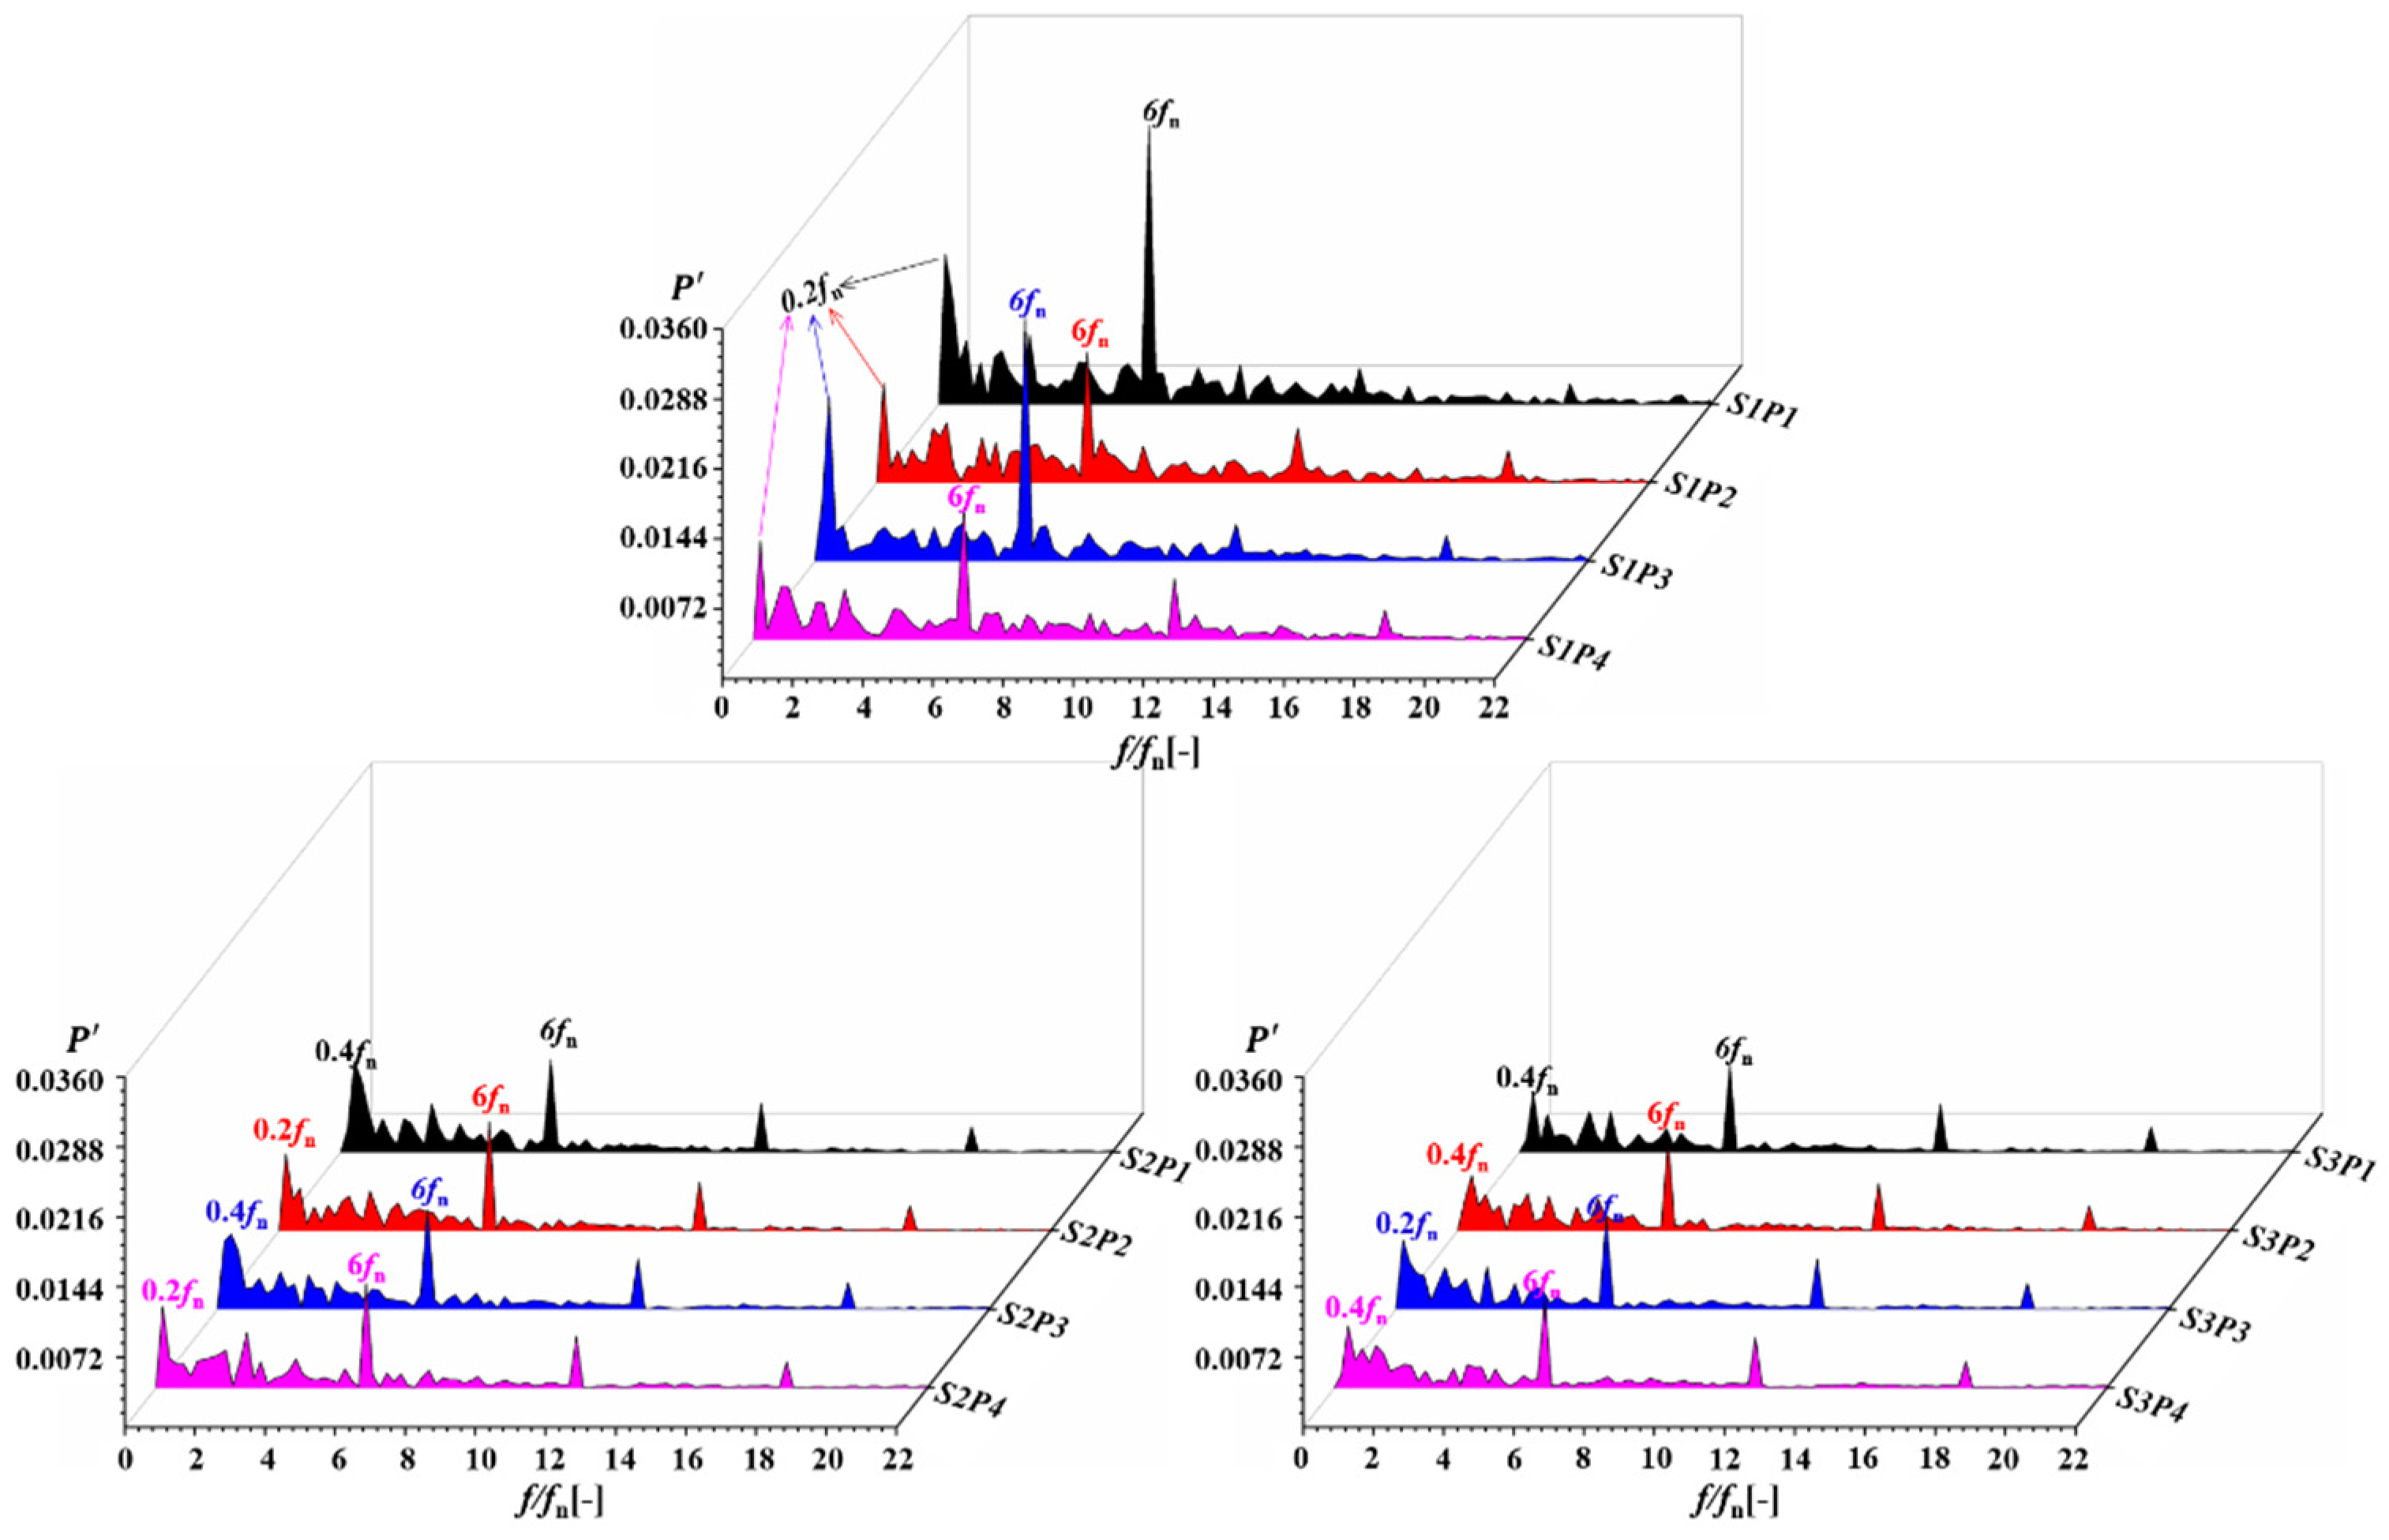
Figure 14 compares the vorticity fluctuation frequency domain of different monitoring points under the part load condition. Under the part load condition, the effect of rotor-stator interaction was the dominant contributor to the vorticity fluctuation in the S1 section plane. Meanwhile, a relatively large amplitude occurred at the frequency of 0.2 fn in the S1 section plane, which may have been caused by the blade-vortex from upstream. The amplitude of vorticity fluctuation in the S2 plane sharply decreased as the vortex generated by the leakage flow dissipated. However, the dominant frequency of vorticity in the S2 plane was consistent, and the value was 0.6 fn. By contrast, the vorticity fluctuation dominant frequency of different monitoring points in the S3 section plane differed; the dominant frequency of S3P1, S3P2, S3P3, and S3P4 is 2 fn, 0.4 fn, fn, and 0.4 fn, respectively. It can be concluded that when the position of the plane was away from the inlet of the outlet duct, the amplitude of vorticity fluctuation clearly declined, and the high amplitude frequency was mainly concentrated in the low-frequency band.
Figure 15 shows the frequency domain of pressure fluctuation under the part load condition. Under the part load condition, the amplitude of pressure fluctuation declined as the flow decreased, but the dominant frequency does not change. In the S1 section plane, amplitude under the frequency of 0.2 fn caused by the blade-vortex was relatively high. The amplitude of pressure fluctuation declined with the section plane away from the S1 plane, and the rotor-stator interaction was the main contributor to the pressure fluctuation of the outlet duct. In addition, the evolution frequency of vortex rope and blade-vortex, with the values of 0.4 fn and 0.2 fn, respectively, seriously affected local pressure in the duct under the part load condition.
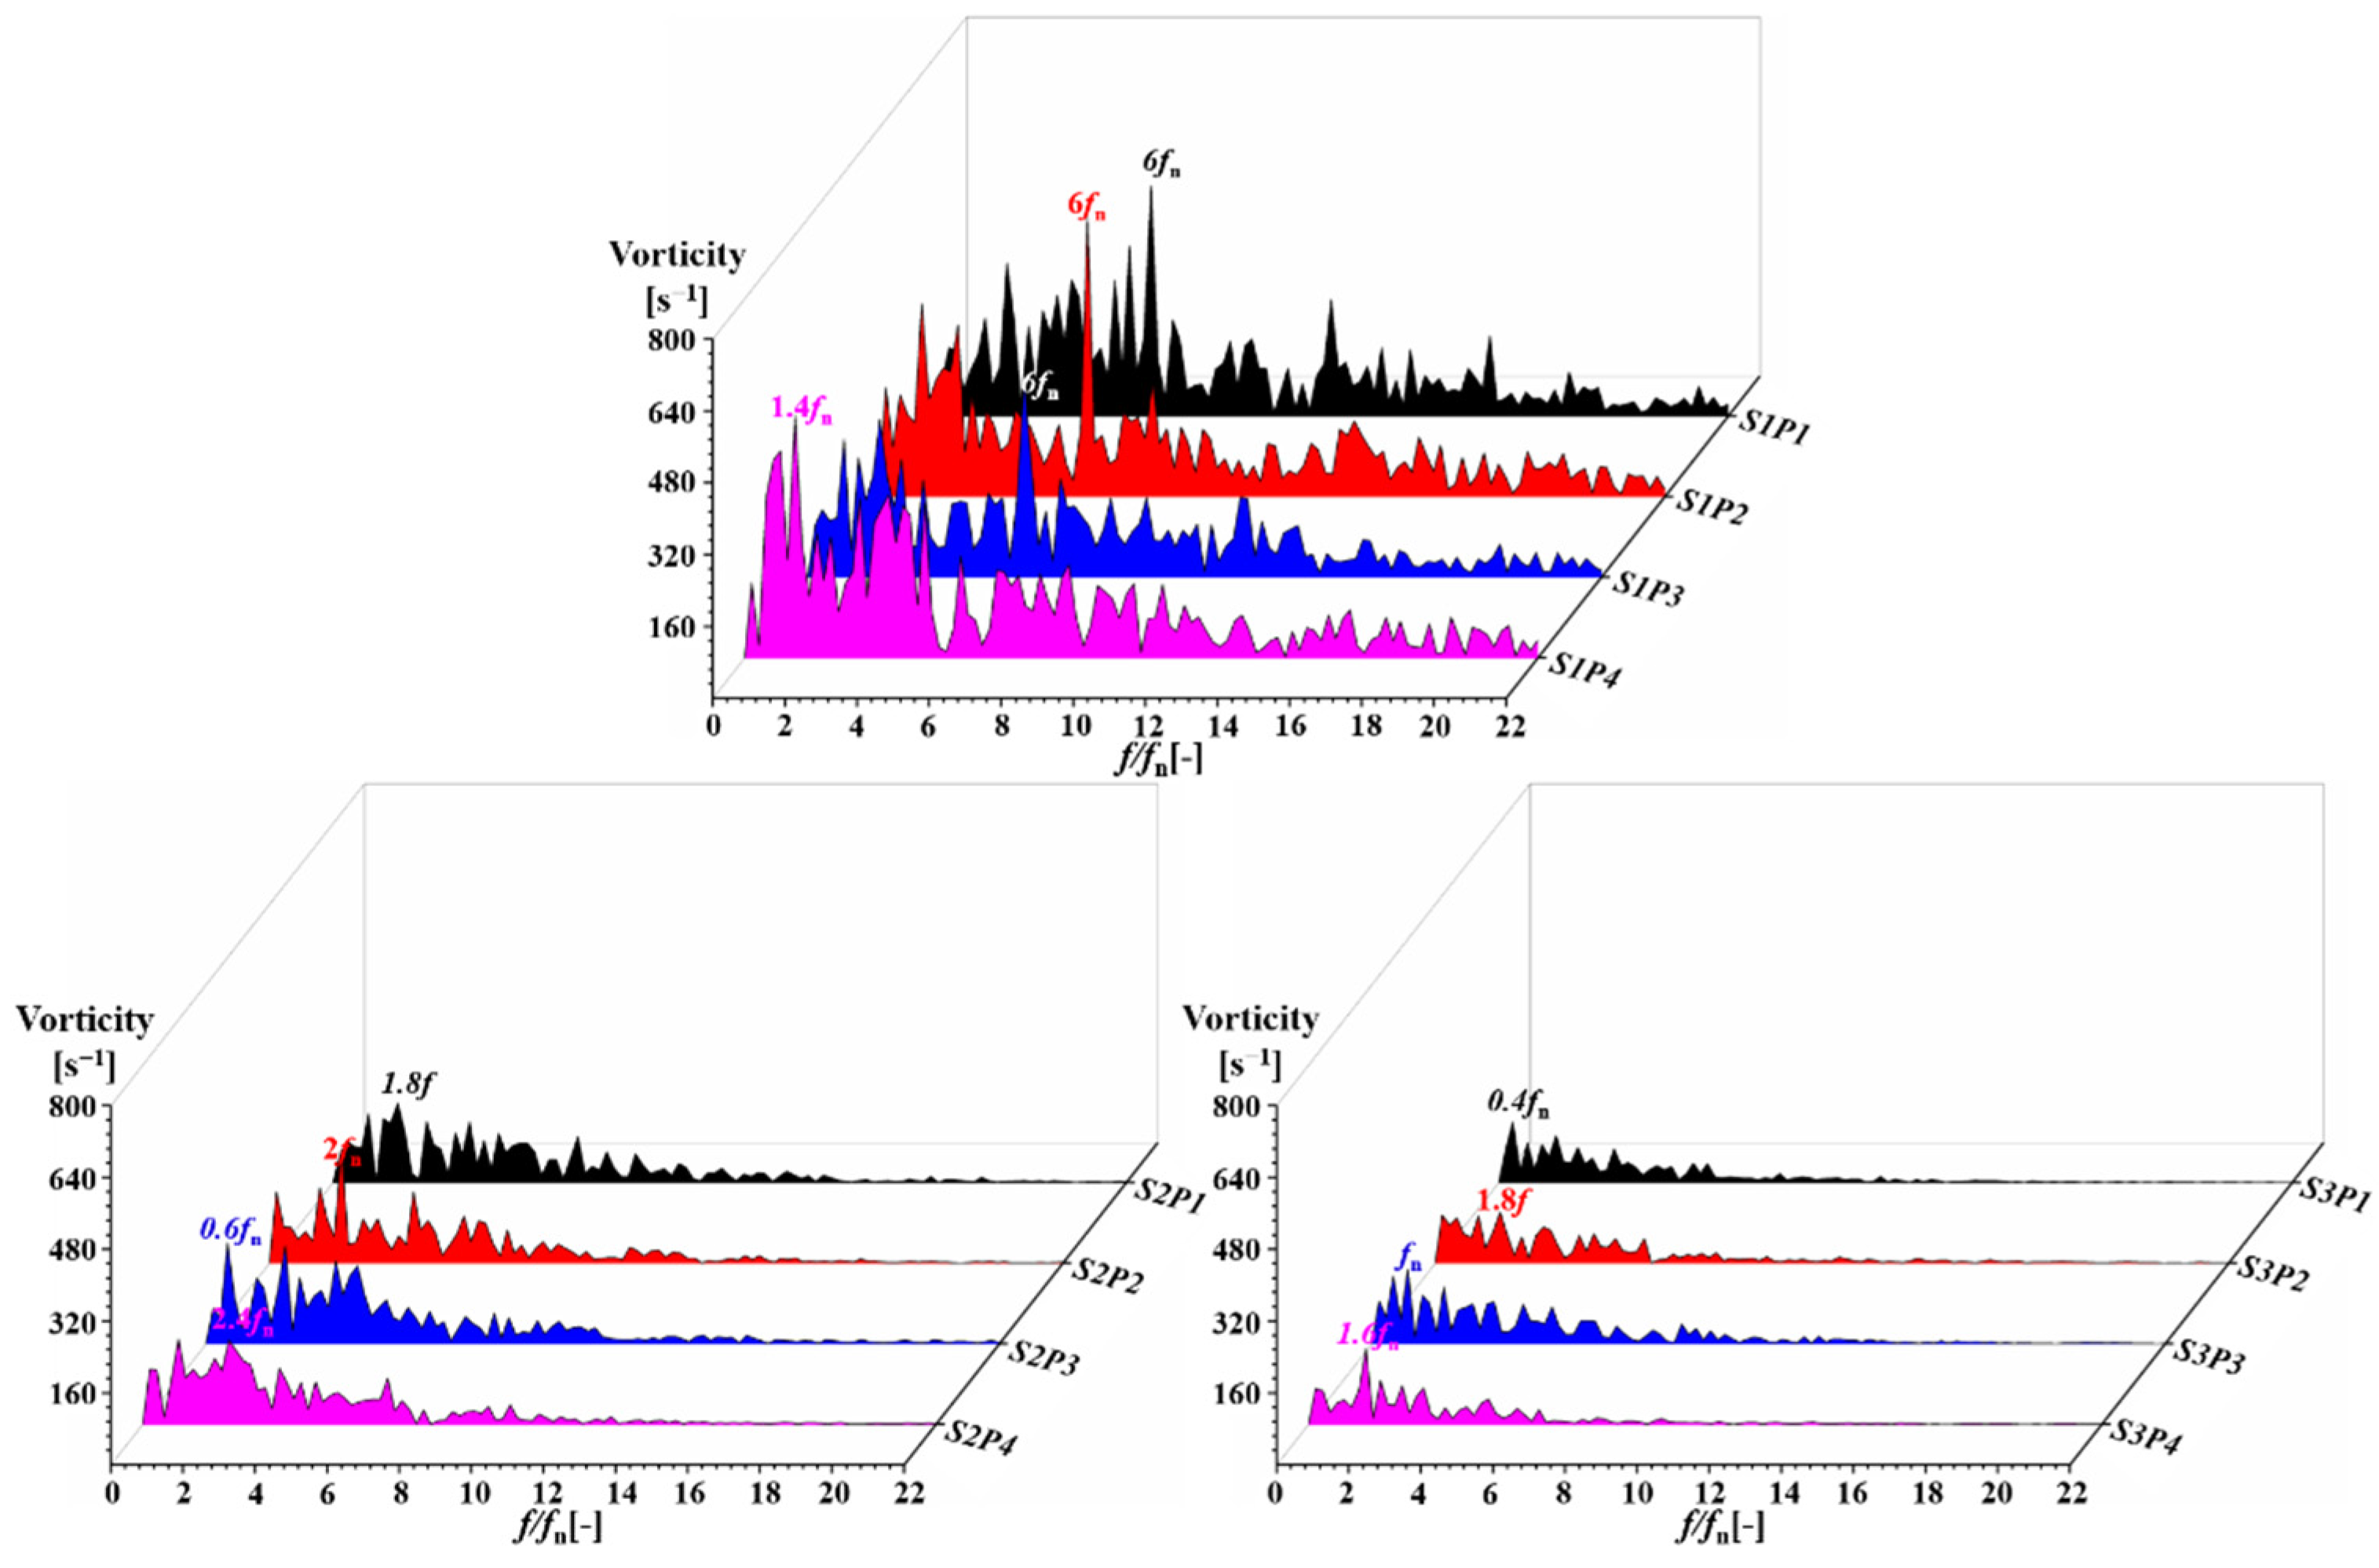
With the flow rate increased, the frequency domain of vorticity fluctuation in the over load condition, as shown in Figure 16. The clear difference is that the vorticity fluctuation dominant frequency of the S1P1 was 1.4 fn compared with the part load and BEP conditions. Combined with the analysis results of Figure 9, this indicates that the local complex vortex behavior causes the irregular distribution of vorticity fluctuation frequency. The dominant frequency and maximum amplitude declines when the position of monitoring points away from the inlet of outlet duct. Furthermore, the dominant frequency in the S2 and S3 planes is less than the blade frequency and showed no regularity.
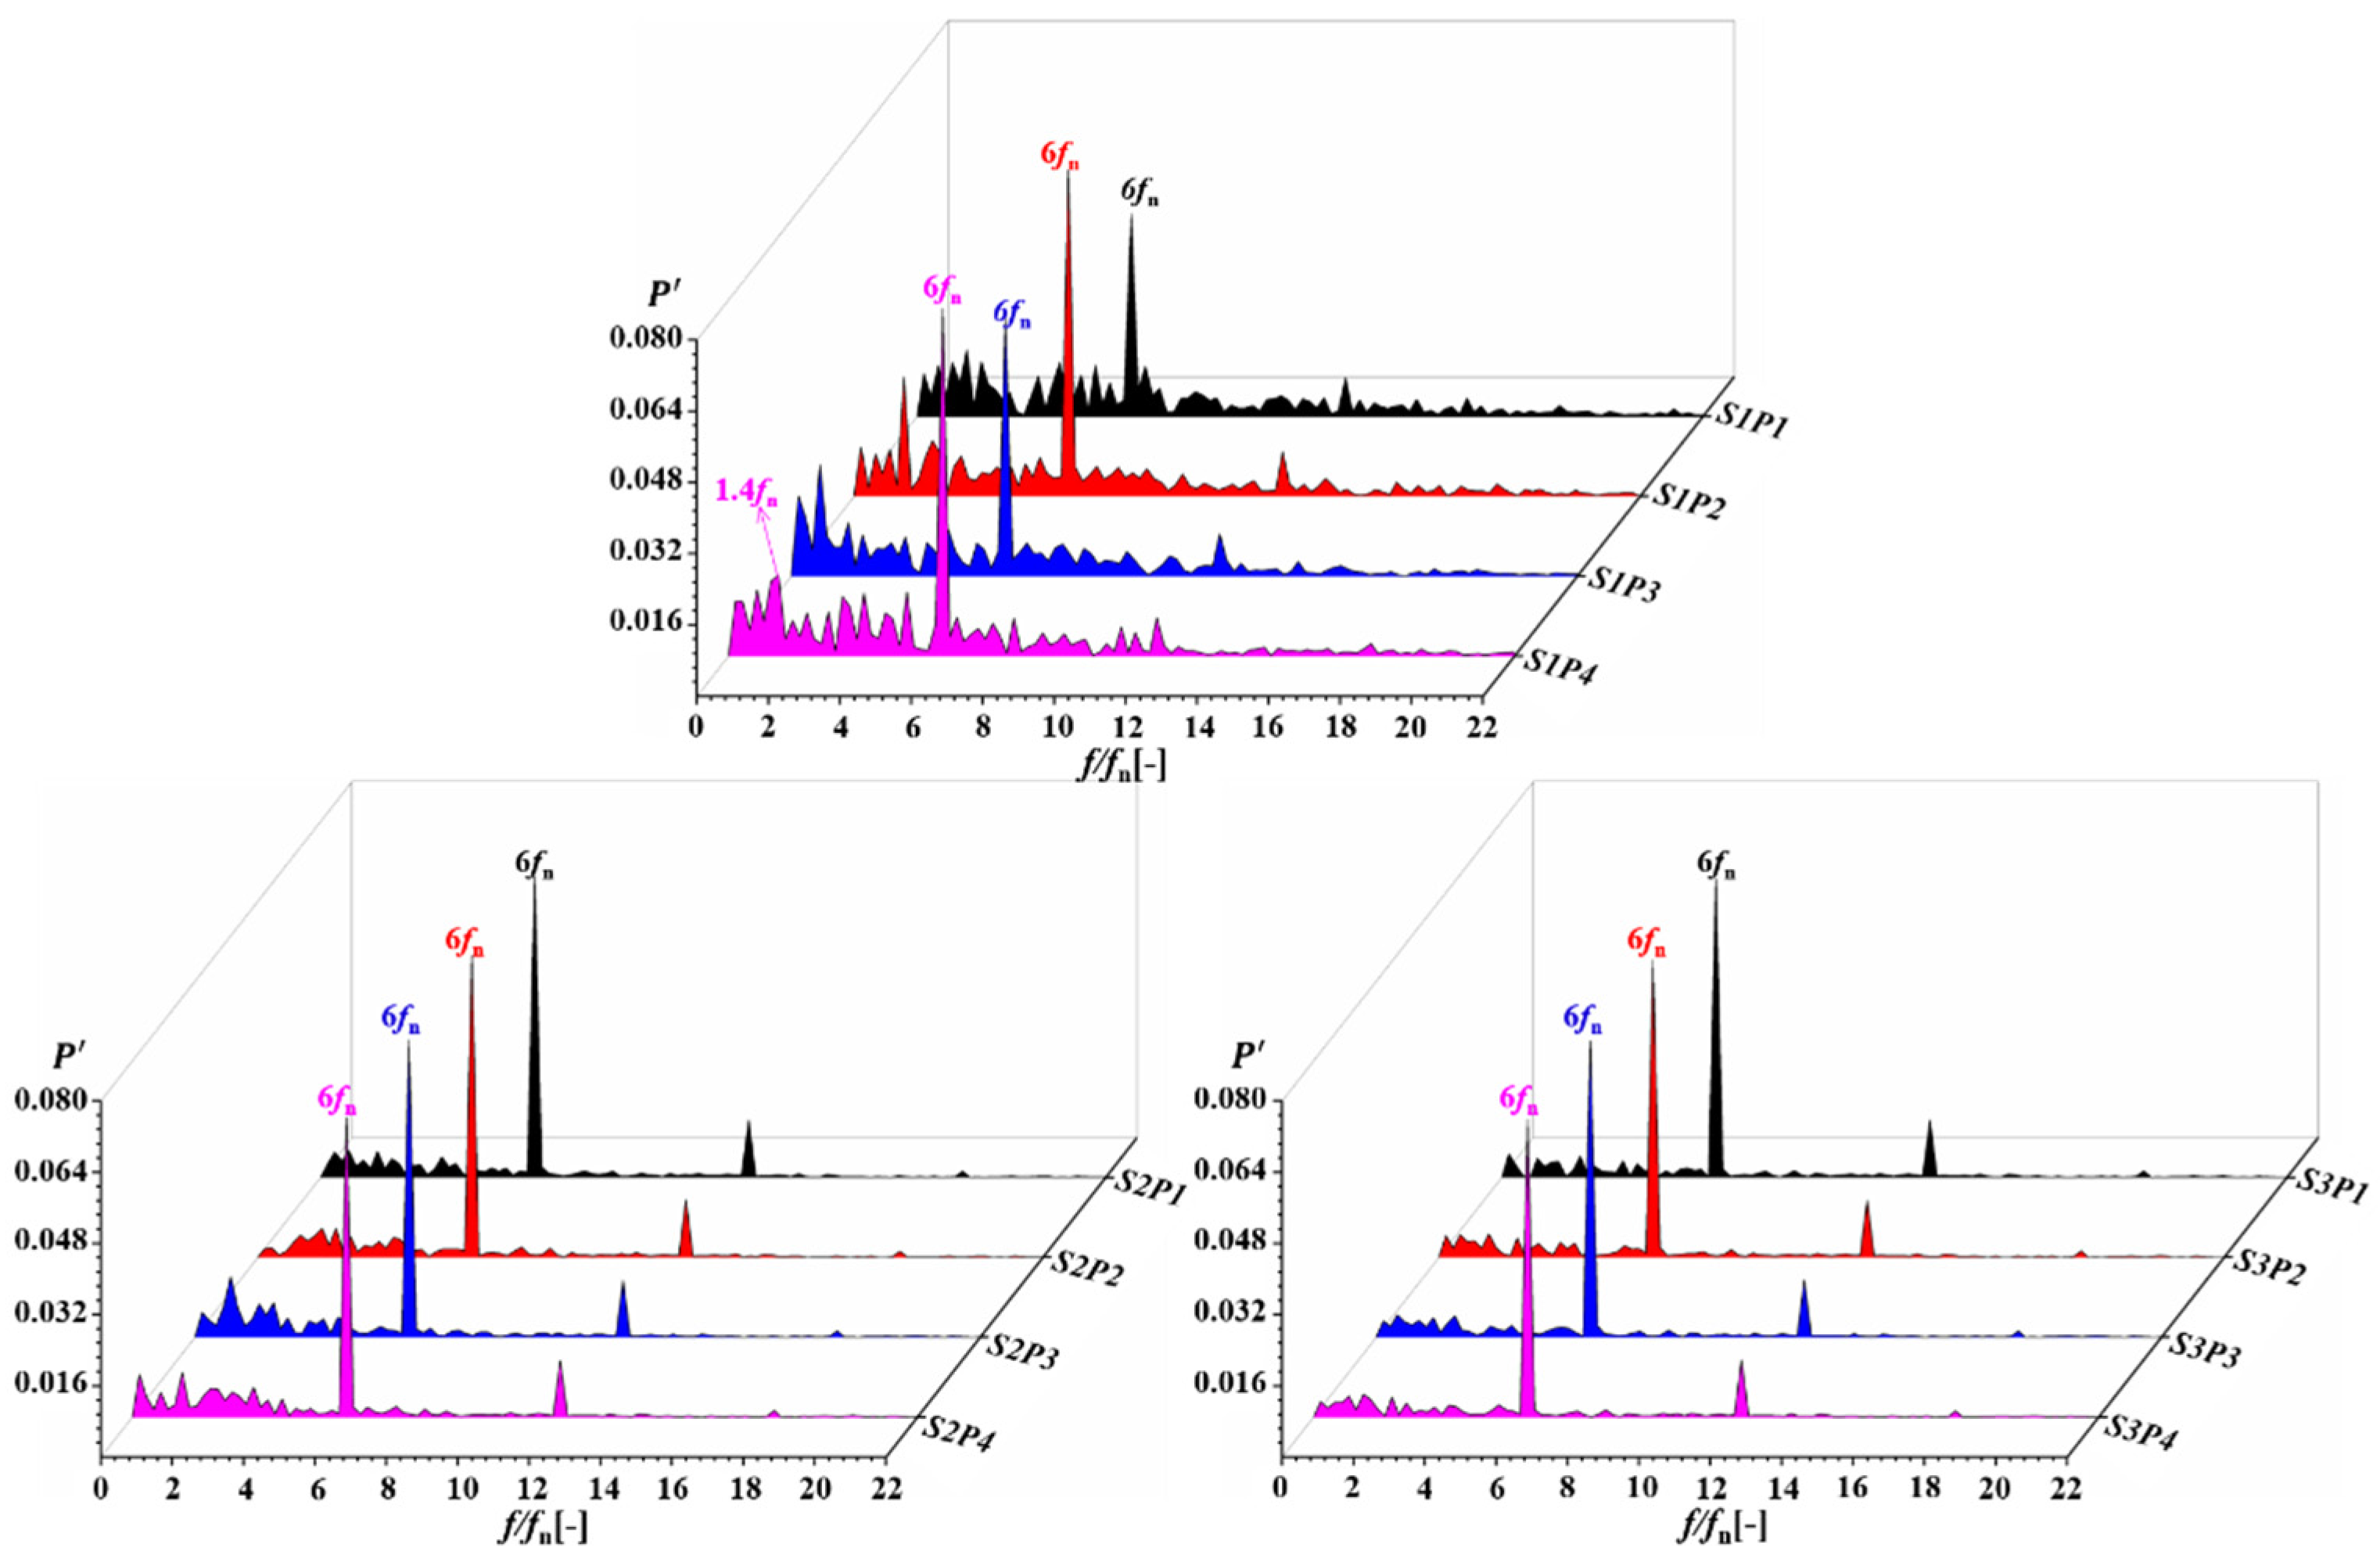
Figure 17 presents the frequency dominant of pressure fluctuation under the over load condition. Similar to the other conditions, the pressure fluctuation characteristic in the outlet duct was mainly affected by the rotor-stator interaction. The amplitude of pressure fluctuation increased with increasing flow rate, and the maximum amplitude was about double that compared with the BEP condition. The dominant frequency amplitude did not change when the position of monitoring points varied. Compared with the part load condition, the pressure fluctuation amplitude caused by the vortex evolution clearly declined in the S2 and S3 planes. For the monitoring of S1P4, the amplitude under its vorticity fluctuation dominant frequency was relatively large.

4. Conclusions

The vorticity-pressure fluctuation interaction in the outlet duct of a centrifugal pump as turbines was herein investigated by the numerical method. The accuracy of energy performance and pressure fluctuation characteristic of PATs predicted by the simulation method was verified through the experiment. The spatial and temporal evolution of vortexes in the outlet duct under different operation conditions were compared. What’s more, the relationship between vortex evolution with the pressure pulsations in the outlet duct was established by clarifying the frequency components that correspond to local high amplitude vorticity and pressure pulsations. The major conclusions can be summarized as follow:
(1)
The vortex behavior in the outlet duct of PATs was determined by the flow rate. Under the part load condition, the vortex with small-scale and the multiple vortex rope was slender at the central of outlet duct. The vortex rope was spiral, and its length varied with the impeller rotating at over load condition. At BEP condition, the location of the vortex was basically consistent with other operating conditions, but the vortex rope did not appear in the outlet duct.
(2)
The leakage flow and the blade-vortex or trailing edge vortex propagated from upstream significantly influenced the distribution of the vortex in the outlet duct. The different types of vortexes, such as source vortexes and sink vortexes, were located at the local low-velocity regions in the section planes of the outlet duct. With the section plane away from the inlet of the outlet duct, the number of vortexes in the section planes declined.
(3)
The vorticity fluctuation dominant frequency in the outlet duct was comprehensively affected by the rotor-stator interaction, the vortex propagated from the upstream, and the new vortex generated in it. However, the pressure fluctuation dominant frequency was blade pass frequency and did not change with the flow rate and position of monitoring points. As the flow rate increased, the amplitude of pressure fluctuation increased, while the effect of vortex evolution affecting the local pressure fluctuation weakened in the outlet duct. With the section plane away from the inlet of the outlet duct, the evolution effect of the vortex affected the local pressure fluctuation, which decreased.

Author Contributions

Conceptualization, T.L.; methodology, T.L.; software, Z.Z.; validation, X.W.; investigation, T.L. and J.L.; resources, T.L. and B.X.; writing—review and editing, T.L., J.L. and Z.Z.; visualization, Z.Z.; supervision, Z.Z. and H.Y.; project administration, Z.Z., T.L. and J.Z. All authors have read and agreed to the published version of the manuscript.

Funding

This work was supported by the National Natural Science Foundation of China (Grant No. U2006221, 51906223), the Science and Technology Research Project of Jiangxi Provincial Department of Education (Grant No. GJJ214903, GJJ214901), the High-level talent research start-up project of Jiangxi College of Applied Technology (Grant No. JXYY-G2022002). The supports are gratefully acknowledged.

Institutional Review Board Statement

Not applicable.

Informed Consent Statement

Not applicable.

Data Availability Statement

All the data in this paper are obtained by physical experiment and numerical simulation, respectively, and the data used to support the findings of this study are available from the corresponding author upon request.

Conflicts of Interest

The authors declare no conflict of interest.

References

  1. Xin, T.; Wei, J.; Qiuying, L.; Hou, G.; Ning, Z.; Yuchuan, W.; Diyi, C. Analysis of hydraulic loss of the centrifugal pump as turbine based on internal flow feature and entropy generation theory. Sustain. Energy Technol. Assess. 2022, 52, 102070. [Google Scholar] [CrossRef]
  2. Lin, T.; Zhu, Z.; Li, X.; Li, J.; Lin, Y. Theoretical, experimental, and numerical methods to predict the best efficiency point of centrifugal pump as turbine. Renew. Energy 2021, 168, 31–44. [Google Scholar] [CrossRef]
  3. Lin, T.; Li, X.; Zhu, Z.; Xie, J.; Li, Y.; Yang, H. Application of enstrophy dissipation to analyze energy loss in a centrifugal pump as turbine. Renew. Energy 2021, 163, 41–55. [Google Scholar] [CrossRef]
  4. Zhou, L.; Hang, J.; Bai, L.; Krzemianowski, Z.; El-Emam, M.A.; Yasser, E.; Agarwal, R. Application of entropy production theory for energy losses and other investigation in pumps and turbines: A review. Appl. Energy 2022, 318, 119211. [Google Scholar] [CrossRef]
  5. Binama, M.; Su, W.-T.; Li, X.-B.; Li, F.-C.; Wei, X.-Z.; An, S. Investigation on pump as turbine (PAT) technical aspects for micro hydropower schemes: A state-of-the-art review. Renew. Sustain. Energy Rev. 2017, 79, 148–179. [Google Scholar] [CrossRef]
  6. Liu, M.; Tan, L.; Cao, S. Theoretical model of energy performance prediction and BEP determination for centrifugal pump as turbine. Energy 2019, 172, 712–732. [Google Scholar] [CrossRef]
  7. Li, W. Vortex Pump as Turbine—A Type Turbine for Energy Generation or Recovery Based on Computational Fluid Dynamics Prediction. J. Fluids Eng. 2019, 141, 101105. [Google Scholar] [CrossRef]
  8. Abazariyan, S.; Rafee, R.; Derakhshan, S. Experimental study of viscosity effects on a pump as turbine performance. Renew. Energy 2018, 127, 539–547. [Google Scholar] [CrossRef]
  9. Plua, F.; Hidalgo, V.; López-Jiménez, P.; Pérez-Sánchez, M. Analysis of Applicability of CFD Numerical Studies Applied to Problem When Pump Working as Turbine. Water 2021, 13, 2134. [Google Scholar] [CrossRef]
  10. Lin, T.; Li, X.; Zhu, Z.; Xie, R.; Lin, Y. Investigation of flow separation characteristics in a pump as turbines impeller under the best efficiency point condition. J. Fluids Eng. 2021, 143, 061204. [Google Scholar] [CrossRef]
  11. Štefan, D.; Rossi, M.; Hudec, M.; Rudolf, P.; Nigro, A.; Renzi, M. Study of the internal flow field in a pump-as-turbine (PaT): Numerical investigation, overall performance prediction model and velocity vector analysis. Renew. Energy 2020, 156, 158–172. [Google Scholar] [CrossRef]
  12. Ghorani, M.M.; Haghighi, M.H.S.; Riasi, A. Entropy generation minimization of a pump running in reverse mode based on surrogate models and NSGA-II. Int. Commun. Heat Mass Transf. 2020, 118, 104898. [Google Scholar] [CrossRef]
  13. Ghorani, M.M.; Haghighi, M.H.S.; Maleki, A.; Riasi, A. A numerical study on mechanisms of energy dissipation in a pump as turbine (PAT) using entropy generation theory. Renew. Energy 2020, 162, 1036–1053. [Google Scholar] [CrossRef]
  14. Wang, T.; Wang, C.; Kong, F.; Gou, Q.; Yang, S. Theoretical, experimental, and numerical study of special impeller used in turbine mode of centrifugal pump as turbine. Energy 2017, 130, 473–485. [Google Scholar] [CrossRef]
  15. Wang, X.; Kuang, K.; Wu, Z.; Yang, J. Numerical simulation of axial vortex in a centrifugal pump as turbine with S-blade impeller. Processes 2020, 8, 1192. [Google Scholar] [CrossRef]
  16. Delgado, J.; Ferreira, J.P.; Covas, D.I.C.; Avellan, F. Variable speed operation of centrifugal pumps running as turbines. Experimental investigation. Renew. Energy 2019, 142, 437–450. [Google Scholar] [CrossRef]
  17. Shojaeefard, M.H.; Saremian, S. Effects of impeller geometry modification on performance of pump as turbine in the urban water distribution network. Energy 2022, 255, 124550. [Google Scholar] [CrossRef]
  18. Hongyu, G.; Wei, J.; Yuchuan, W.; Hui, T.; Ting, L.; Diyi, C. Numerical simulation and experimental investigation on the influence of the clocking effect on the hydraulic performance of the centrifugal pump as turbine. Renew. Energy 2021, 168, 21–30. [Google Scholar] [CrossRef]
  19. Dai, C.; Kong, F.; Dong, L.; Feng, Z.; Bai, Y. Analysis and experimental investigation of pressure fluctuation in draft tube of pump as turbine. J. Cent. South Univ. 2015, 46, 3131–3137. (In Chinese) [Google Scholar]
  20. Wu, X.; Liu, S.; Wu, Y. Detached eddy simulation for model hydro turbine. In Proceedings of the ASME fluids engineering Division Summer Meeting, Miami, FL, USA, 17–20 July 2006; pp. 211–218. [Google Scholar]
  21. Jain, S.V.; Patel, N.K.; Patel, R.N. Experimental investigations of cavitation characteristics of pump running in turbine mode. J. Energy Eng. 2017, 143, 04016034. [Google Scholar] [CrossRef]
  22. Dong, L.; Dai, C.; Lin, H.-B.; Chen, Y.-P. Noise comparison of centrifugal pump operating in pump and turbine mode. J. Cent. South Univ. 2018, 25, 2733–2753. [Google Scholar] [CrossRef]
  23. Fei, Z.; Zhang, R.; Xu, H.; Feng, J.; Mu, T.; Chen, Y. Energy performance and flow characteristics of a slanted axial-flow pump under cavitation conditions. Phys. Fluids 2022, 34, 035121. [Google Scholar] [CrossRef]
  24. Lin, Y.; Li, X.; Zhu, Z.; Wang, X.; Lin, T.; Cao, H. An energy consumption improvement method for centrifugal pump based on bionic optimization of blade trailing edge. Energy 2022, 246, 123323. [Google Scholar] [CrossRef]
  25. Wu, C.; Pu, K.; Li, C.; Wu, P.; Huang, B.; Wu, D. Blade redesign based on secondary flow suppression to improve energy efficiency of a centrifugal pump. Energy 2022, 246, 123394. [Google Scholar] [CrossRef]
  26. Ji, L.; Li, W.; Shi, W.; Chang, H.; Yang, Z. Energy characteristics of mixed-flow pump under different tip clearances based on entropy production analysis. Energy 2020, 199, 117447. [Google Scholar] [CrossRef]
  27. Zhang, F.; Appiah, D.; Hong, F.; Zhang, J.; Yuan, S.; Adu-Poku, K.A.; Wei, X. Energy loss evaluation in a side channel pump under different wrapping angles using entropy production method. Int. Commun. Heat Mass Transf. 2020, 113, 104526. [Google Scholar] [CrossRef]
  28. Spalart, P.R.; Shur, M. On the sensitization of turbulence models to rotation and curvature. Aerosp. Sci. Technol. 1997, 1, 297–302. [Google Scholar] [CrossRef]
  29. Roache, P.J. Quantification of uncertainty in computational fluid dynamics. Annu. Rev. Fluid Mech. 1997, 29, 123–160. [Google Scholar] [CrossRef] [Green Version]
  30. Celik, I.B.; Ghia, U.; Roache, P.; Freitas, C.J. Procedure for estimation and reporting of uncertainty due to discretization in CFD applications. J. Fluids Eng. Trans. ASME 2008, 130, 078001. [Google Scholar]
  31. Wang, L.; Wu, T.; Gong, J.; Yang, Y. Numerical simulation of the wake instabilities of a propeller. Phys. Fluids 2021, 33, 125125. [Google Scholar] [CrossRef]
  32. Manolesos, M.; Papadakis, G. Investigation of the three-dimensional flow past a flatback wind turbine airfoil at high angles of attack. Phys. Fluids 2021, 33, 085106. [Google Scholar] [CrossRef]
  33. Lu, J.; Chen, Q.; Liu, X.; Zhu, B.; Yuan, S. Investigation on pressure fluctuations induced by flow instabilities in a centrifugal pump. Ocean. Eng. 2022, 258, 111805. [Google Scholar] [CrossRef]
  34. Hunt, J.C.R.; Wray, A.A.; Moin, P. Eddies, streams, and convergence zones in turbulent flows. In Proceedings of the Studying Turbulence Using Numerical Simulation Databases, 2. Proceedings of the 1988 Summer Program, Stanford, CA, USA, 27 Jun–22 July 1988; pp. 193–208. [Google Scholar]
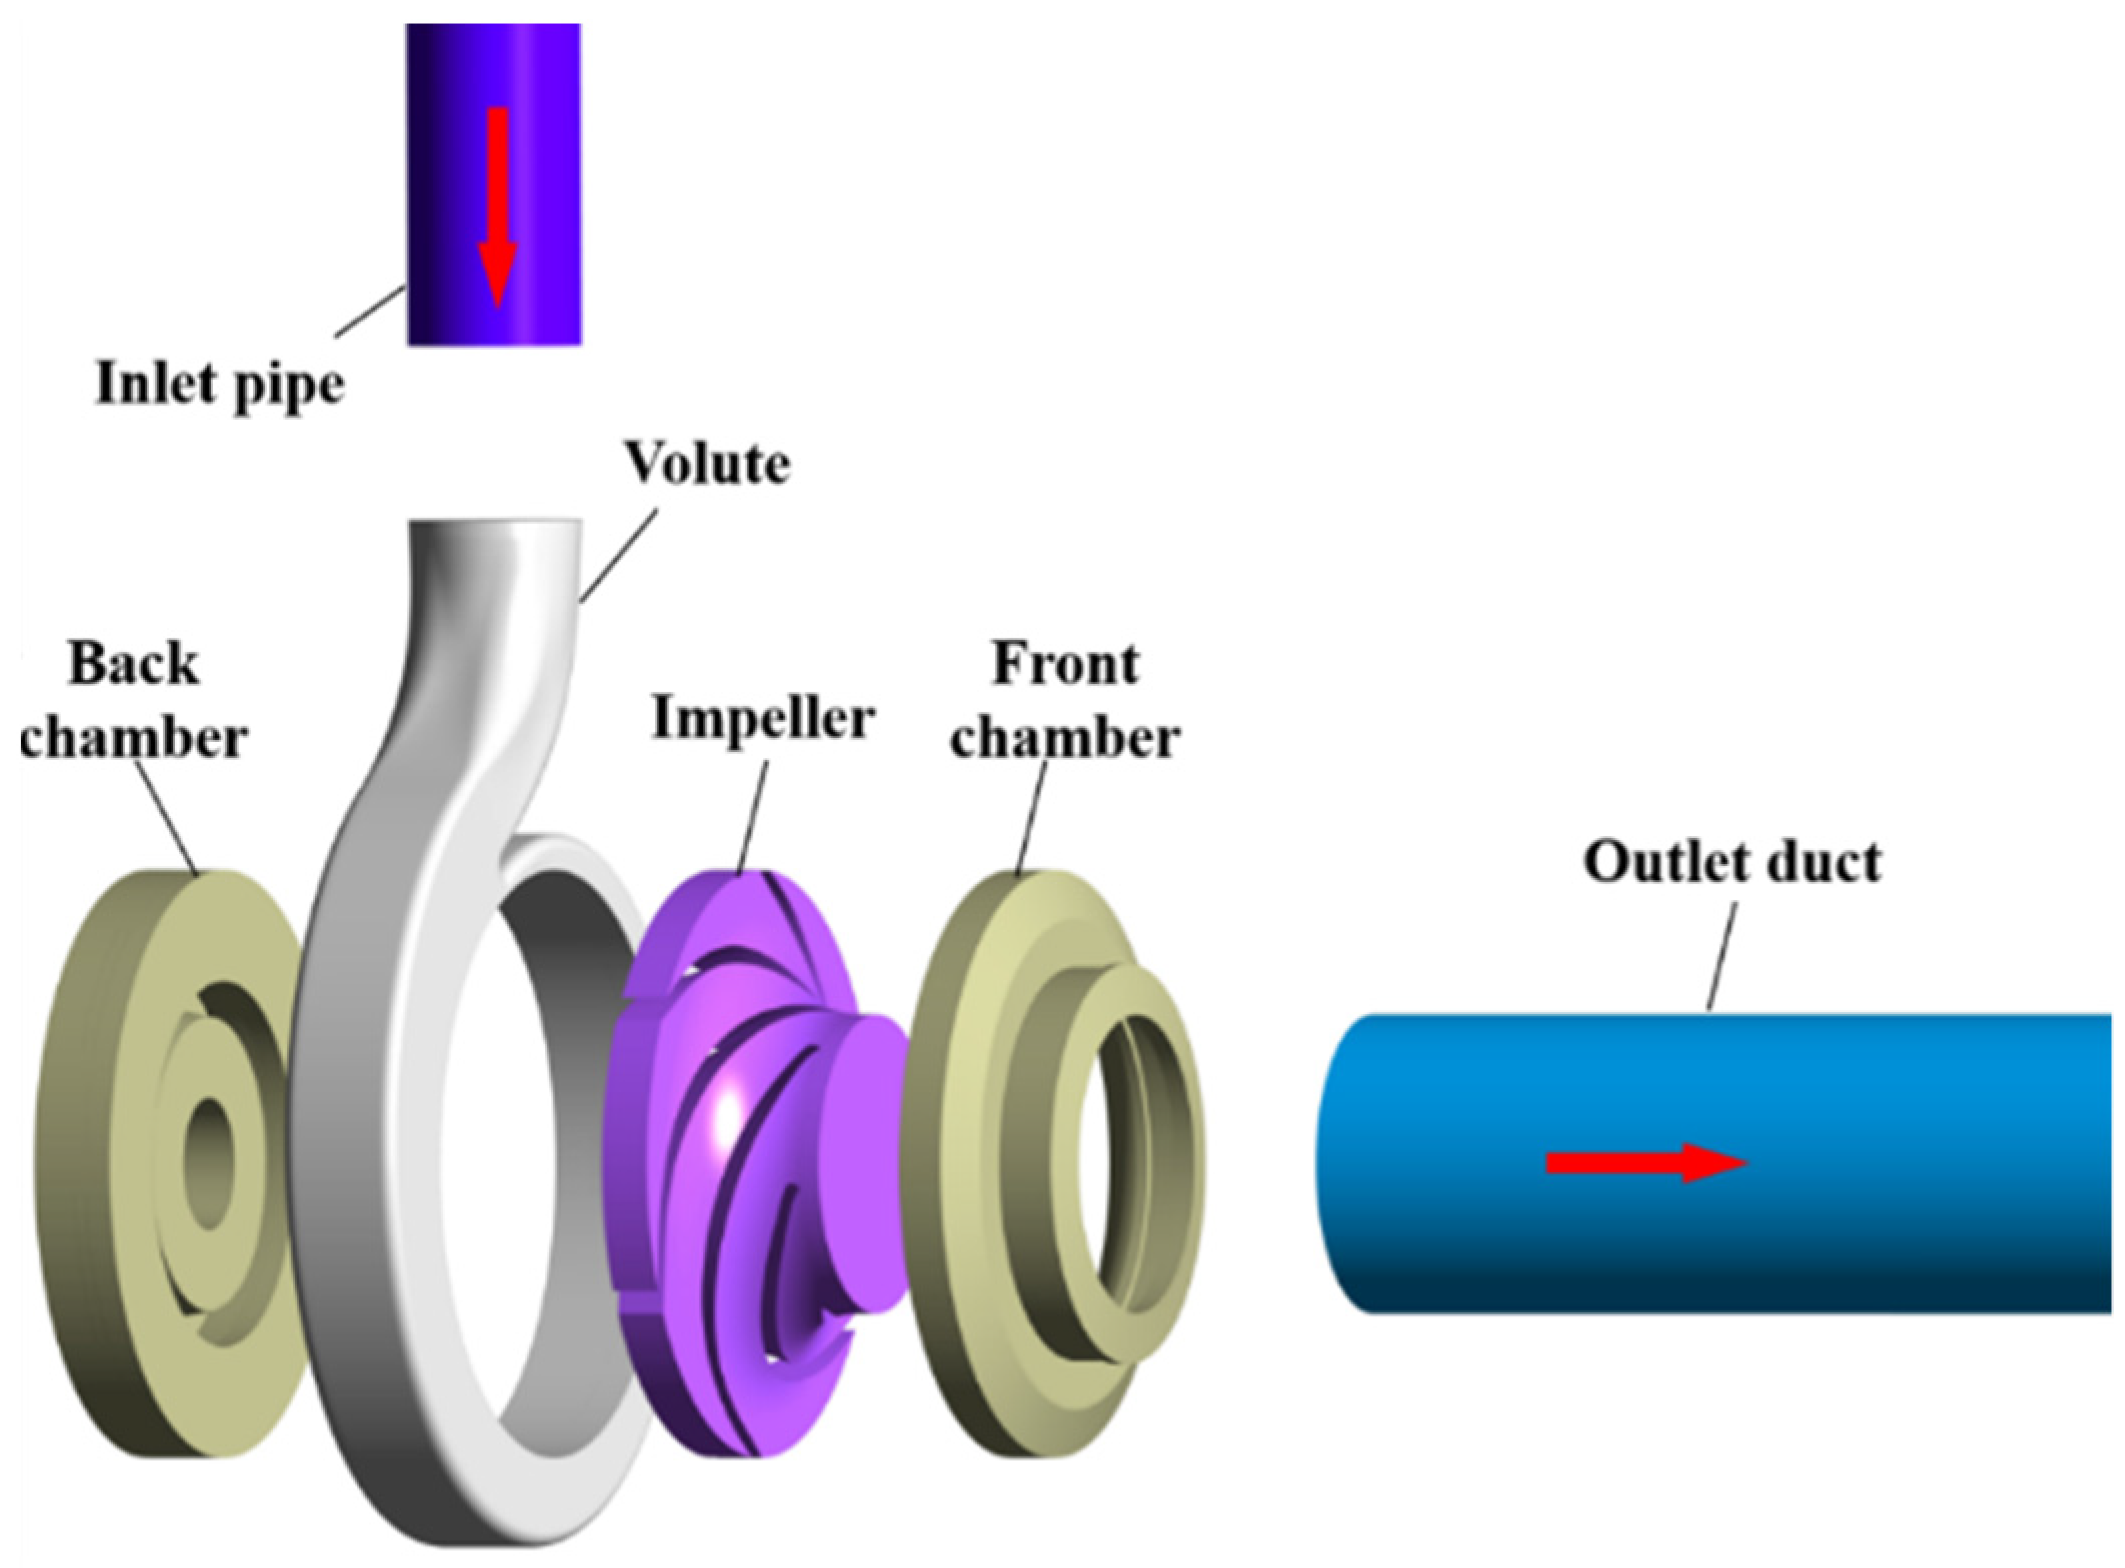
Figure 1. Calculate model of the PATs.
Sustainability 14 15250 g001
Figure 2. Monitoring points and planes in the outlet duct.
Sustainability 14 15250 g002
Figure 3. Grids of computational domains.
Sustainability 14 15250 g003
Figure 4. Grid independence verification.
Sustainability 14 15250 g004
Figure 5. PATs test system. (a) Schematic of PATs hydraulic and dynamic characteristics test system; (b) PATs test site.
Sustainability 14 15250 g005
Figure 6. Hydraulic performance characteristics comparison between CFD and experiment.
Sustainability 14 15250 g006
Figure 7. Pressure fluctuations frequency domain signal comparison between CFD and test.
Sustainability 14 15250 g007
Figure 8. Vortex and static pressure evolution at part-load condition.
Sustainability 14 15250 g008
Figure 9. Vortex and static pressure evolution at over load condition.
Sustainability 14 15250 g009
Figure 10. Vortex and static pressure evolution at BEP condition.
Sustainability 14 15250 g010
Figure 11. Streamline by velocity in the outlet duct in different sections at the BEP condition.
Sustainability 14 15250 g011
Figure 12. Frequency domain of vorticity fluctuation at the BEP condition.
Sustainability 14 15250 g012
Figure 13. Frequency domain of pressure fluctuation at the BEP condition.
Sustainability 14 15250 g013
Figure 14. Frequency domain of vorticity fluctuation at the part load condition.
Sustainability 14 15250 g014
Figure 15. Frequency domain of pressure fluctuation at the part load condition.
Sustainability 14 15250 g015
Figure 16. Frequency domain of vorticity fluctuation at the over load condition.
Sustainability 14 15250 g016
Figure 17. Frequency domain of pressure fluctuation at the over load condition.
Sustainability 14 15250 g017
Table 1. Main geometric parameters of the PATs.
ParameterNotationValueParameterNotationValue
Impeller inlet diameter (mm)D1169Blade inlet angle (°)β225
Impeller outlet diameter (mm)D286Blade outlet angle (°)β130
Impeller inlet width (mm)b114Volute base circle diameter (mm)D3172
Impeller outlet width (mm)b220Blade numberZ6
Table 2. Computed discretization errors in head and efficiency.
r 21 r 32 p φ ext 21 e a 21 e ext 21 GCI fine 21 φ ext 32 e a 32 e ext 32 GCI fine 32
H (m)1.321.310.98657.830.0032%0.0104%1.30%57.820.0024%0.0079%0.99%
η (%)1.321.314.94375.160.0014%0.0005%0.06%75.160.0052%0.0019%0.23%
Table 3. Mesh information for of each domain.
DomainNode (Million)Wall Average y+Worst Quality
Inlet duct0.34153.240.88
Volute2.69146.370.52
Impeller2.76246.240.43
Front chamber0.47645.540.74
Back chamber0.62134.840.72
Outlet duct0.36493.760.87
Publisher’s Note: MDPI stays neutral with regard to jurisdictional claims in published maps and institutional affiliations.