Aridity Analysis Using a Prospective Geospatial Simulation Model in This Mid-Century for the Northwest Region of Mexico
Abstract
1. Introduction
2. Materials and Methods
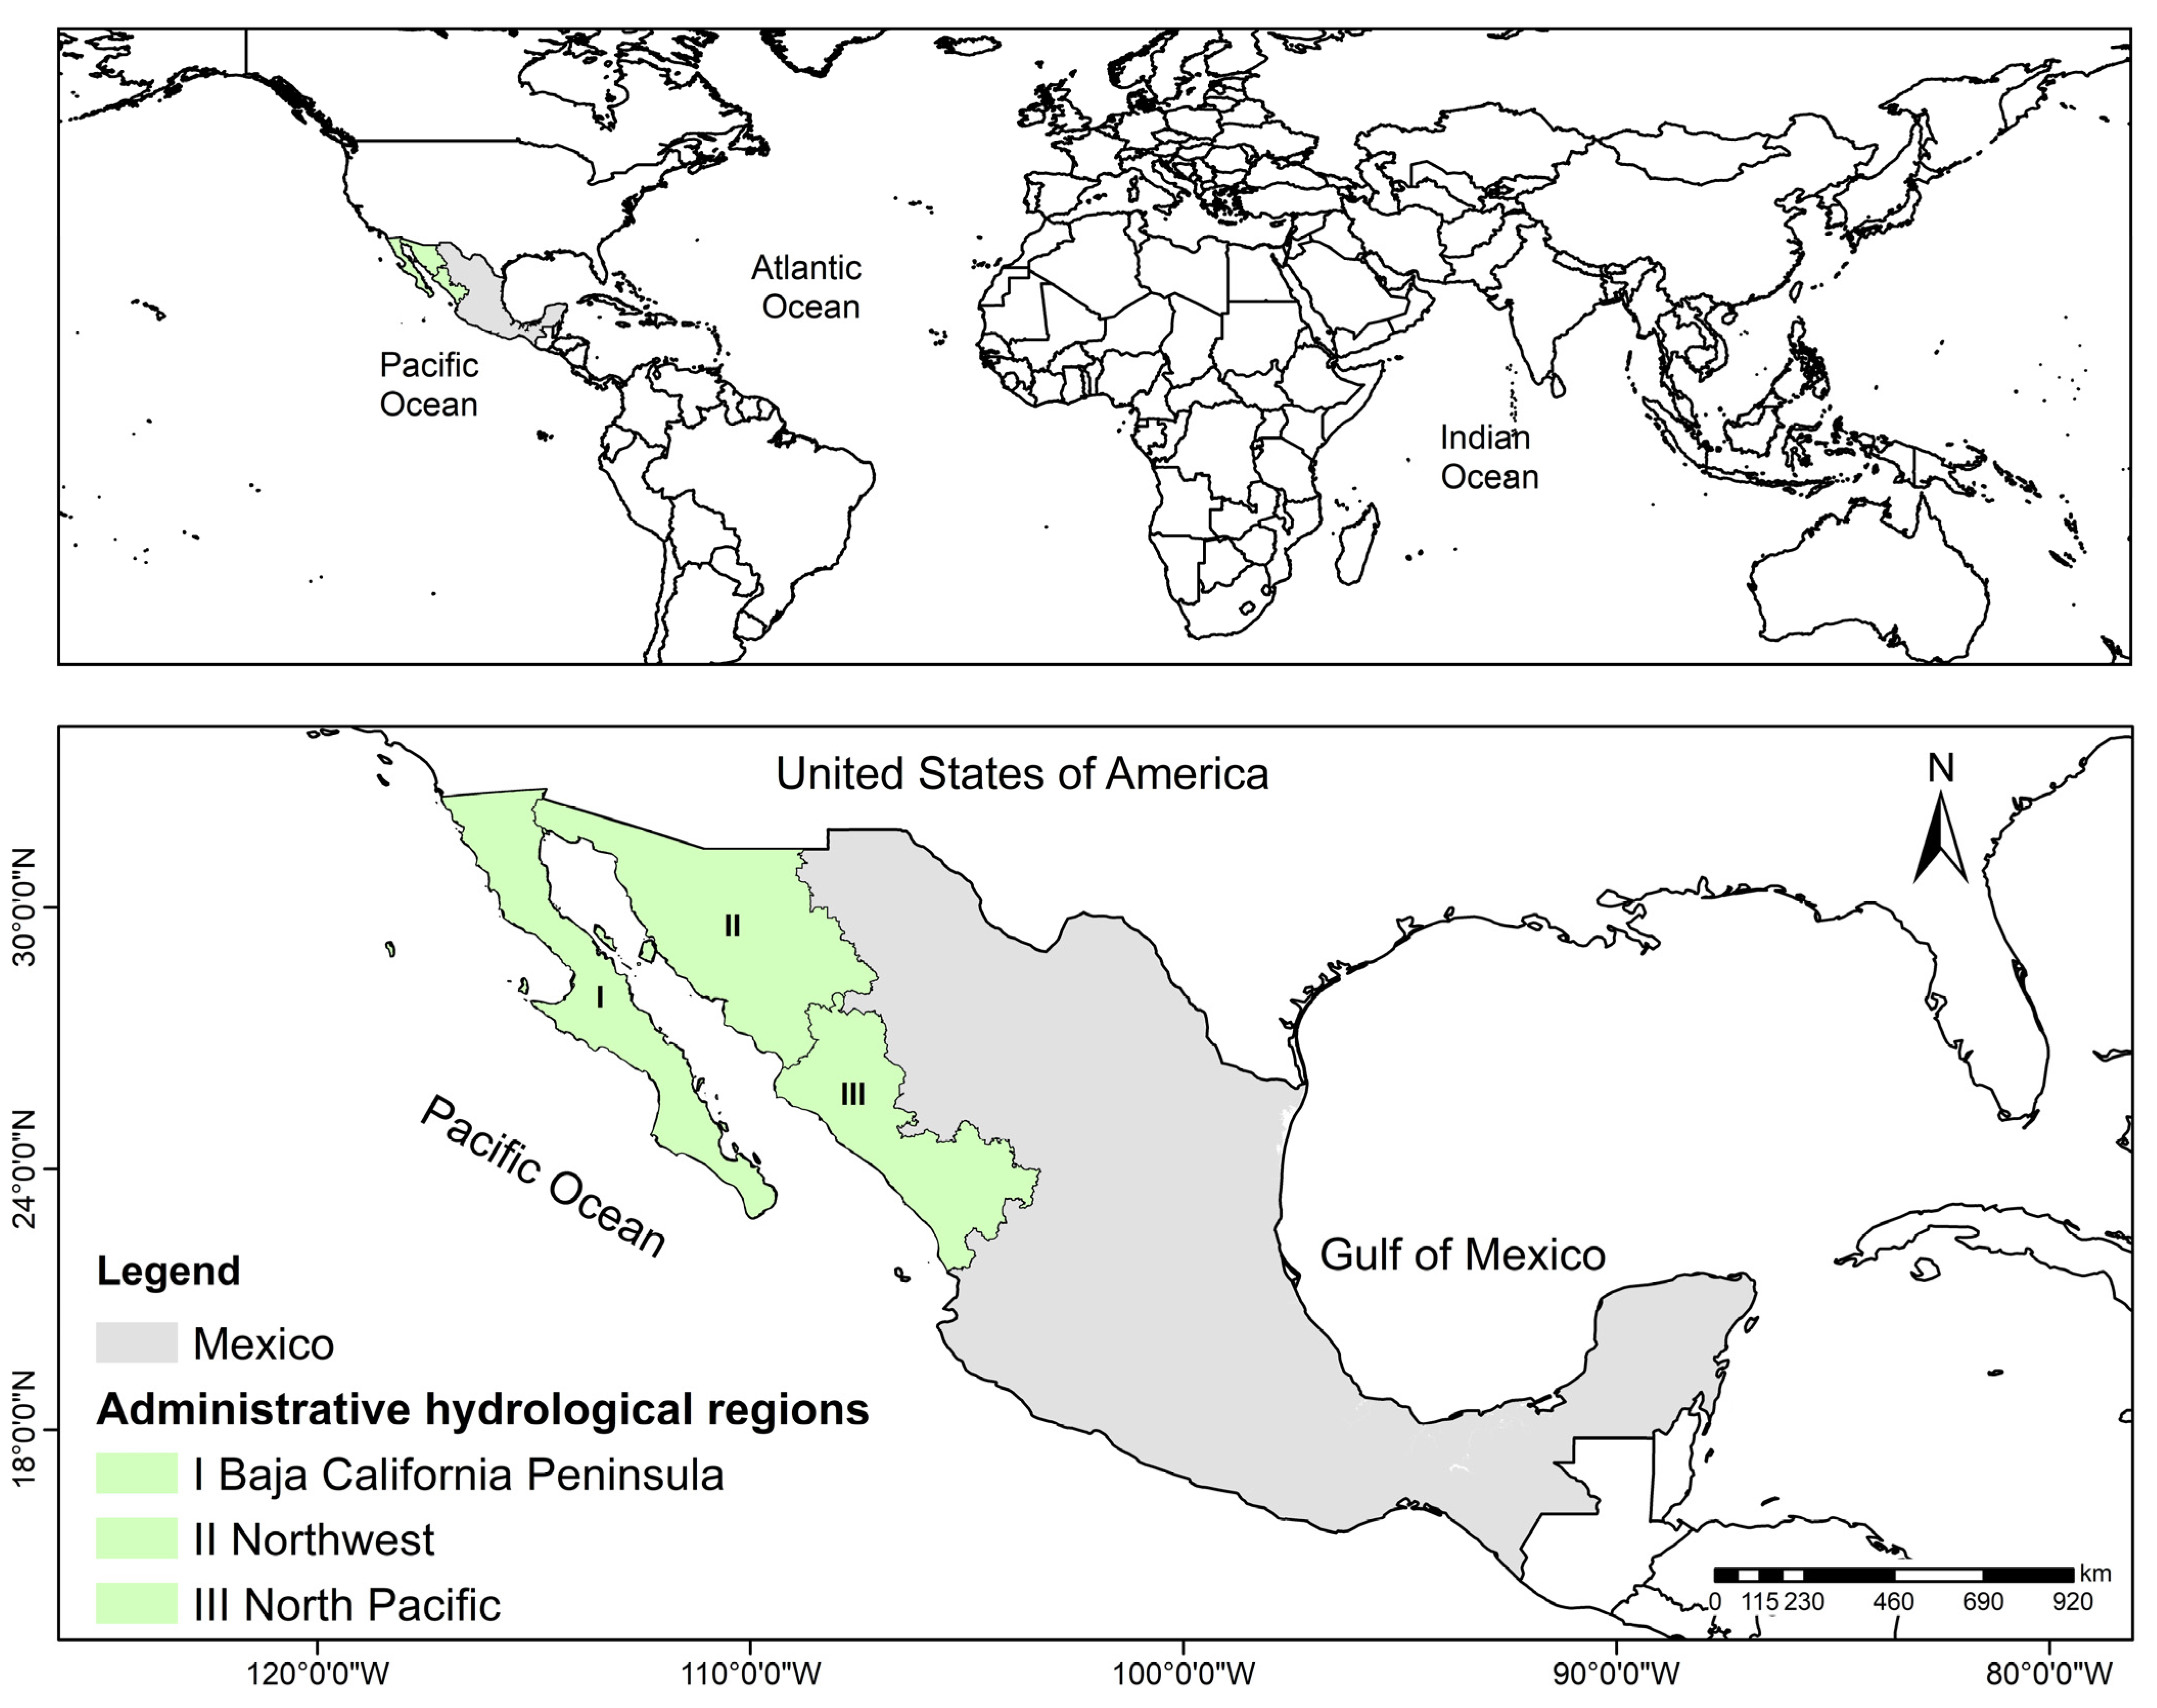
2.1. Study Area
2.2. Data
2.3. Methodology
2.4. Geospatial Model of Drylands Based on Multicriteria Evaluation and GIS for the Year 2020
2.4.1. Data Download and Processing
2.4.2. Standardization of the Criteria through the Fuzzy-Logic Method
2.4.3. Weighted Linear Combination
2.4.4. Classification Method
2.5. Prospective Geospatial Model of Arid Zones in the Years 2030 and 2050
2.5.1. Calculation of Change Rates per Period
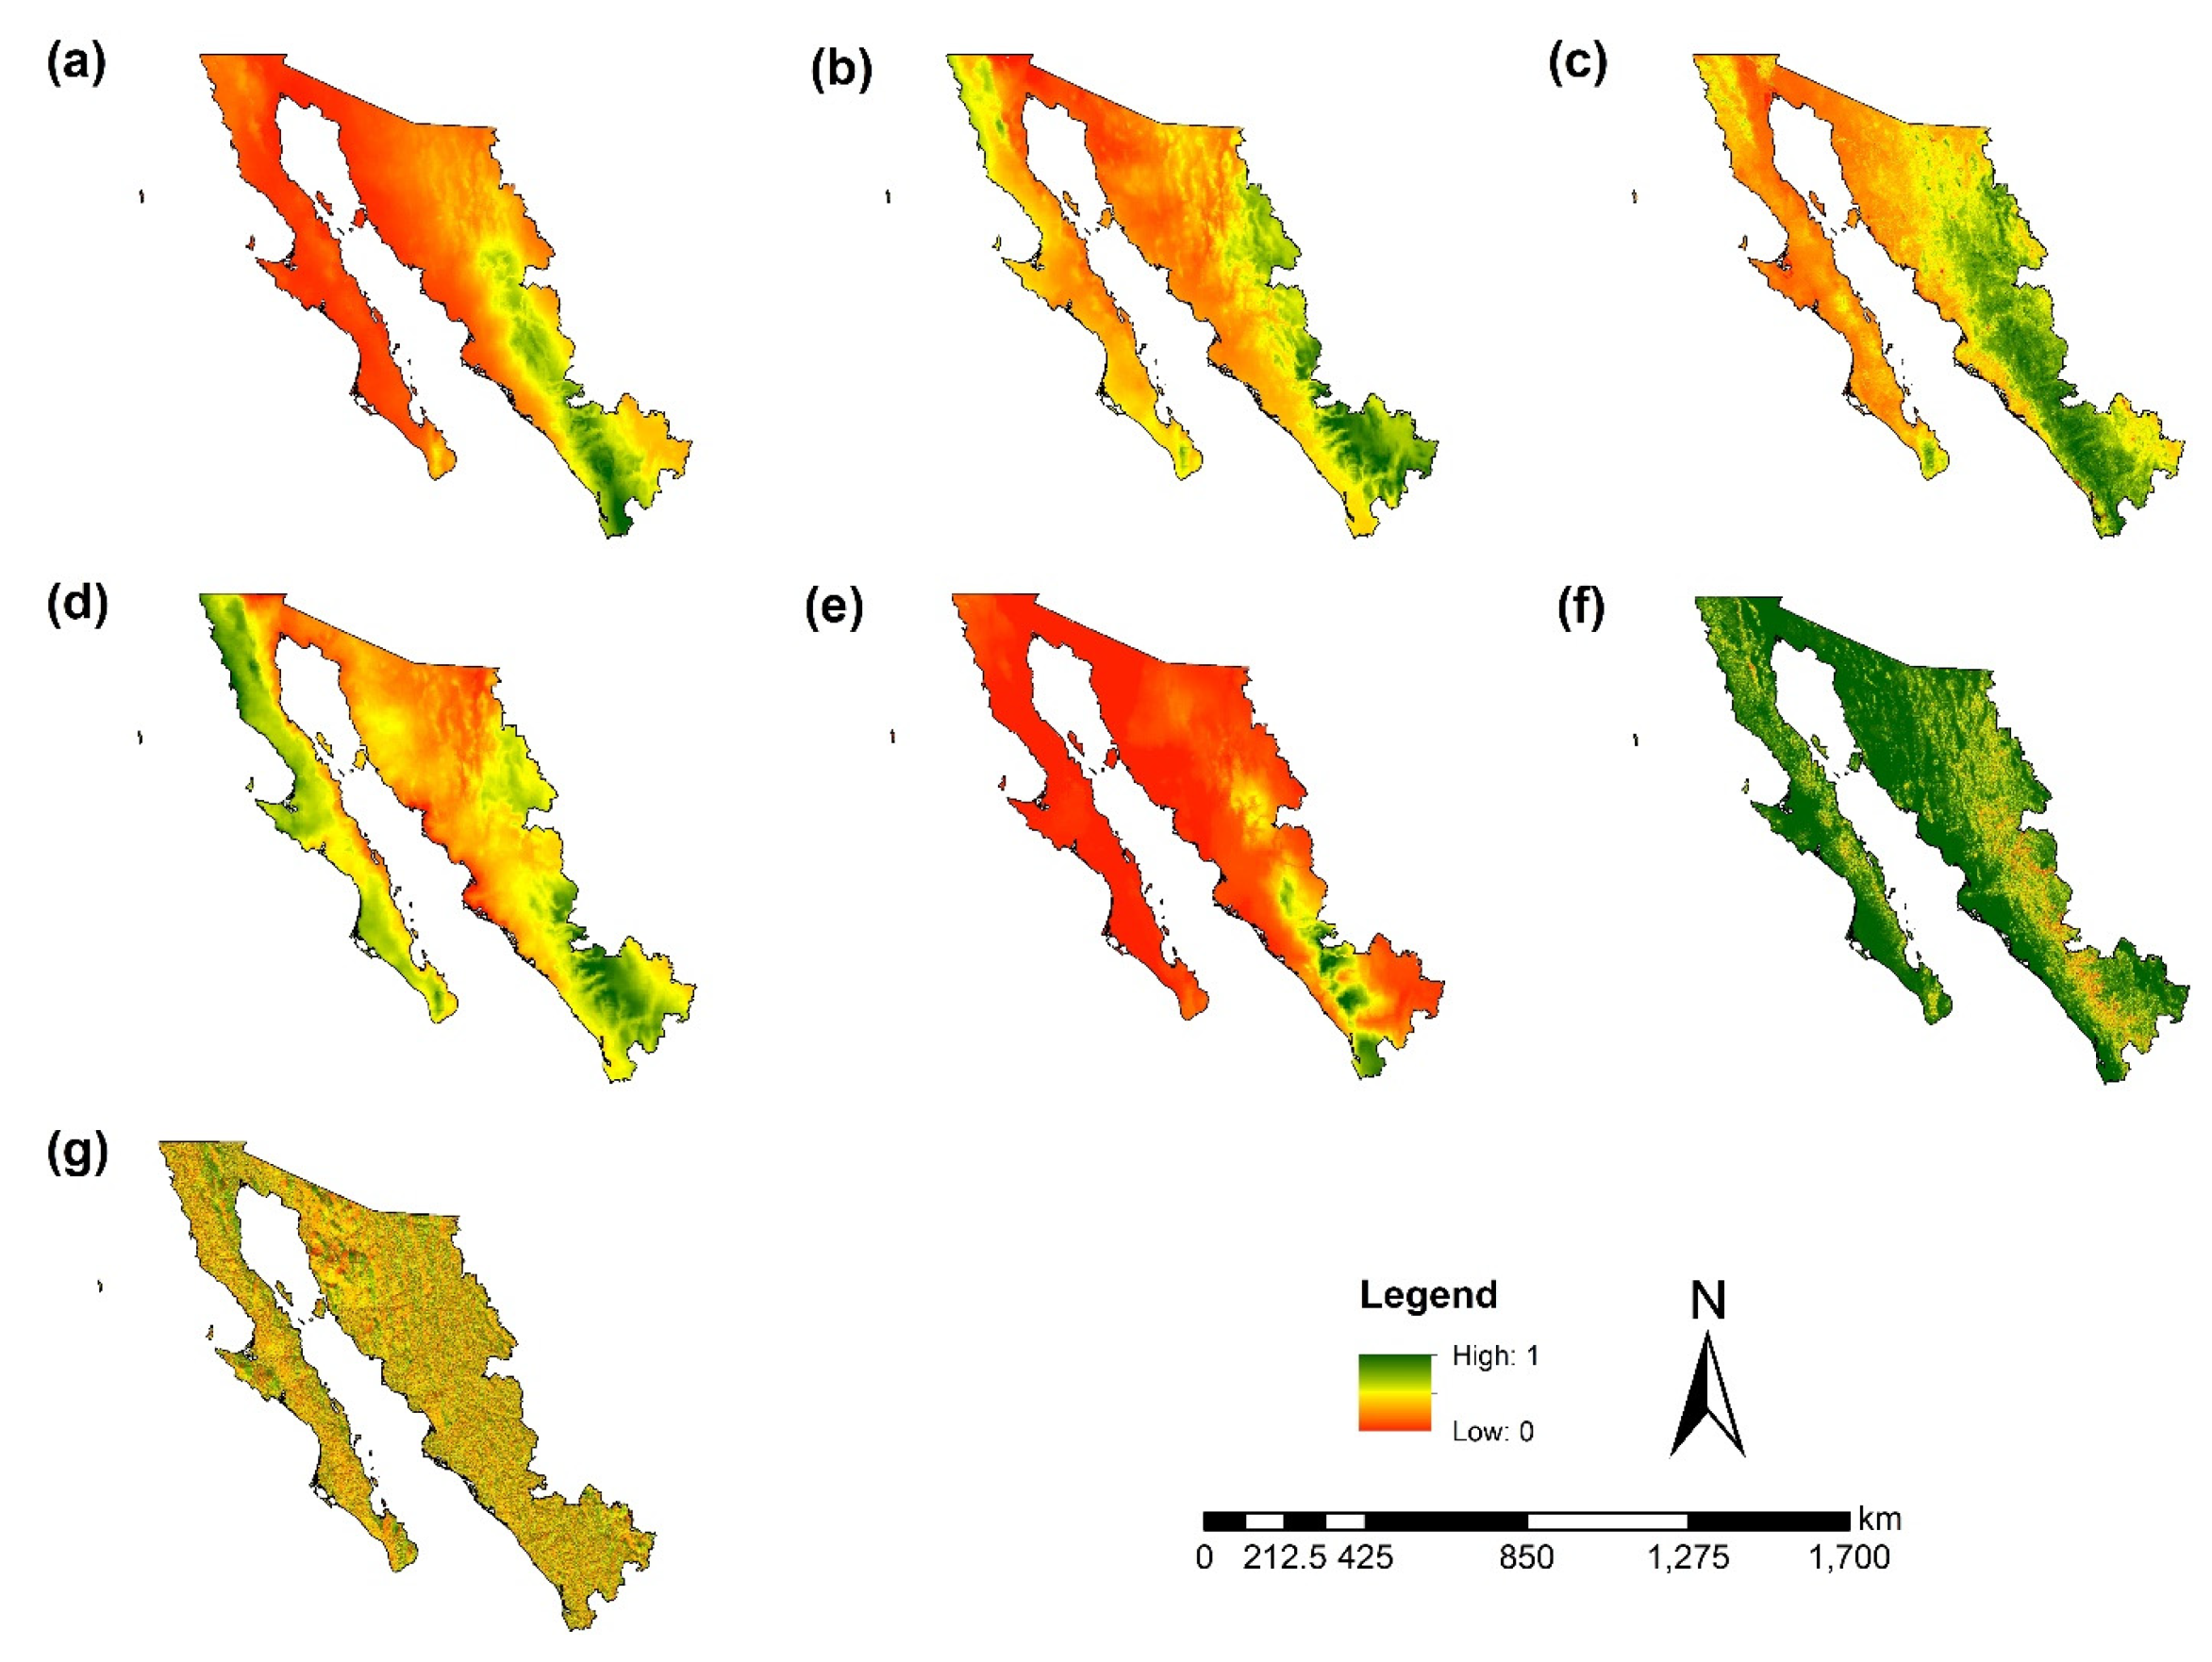
2.5.2. Standardization of Factors
2.5.3. Weighted Linear Combination and Criteria Ranking
2.5.4. Quantitative and Geospatial Indicators
3. Results
3.1. Prospective Geospatial Model of Aridity
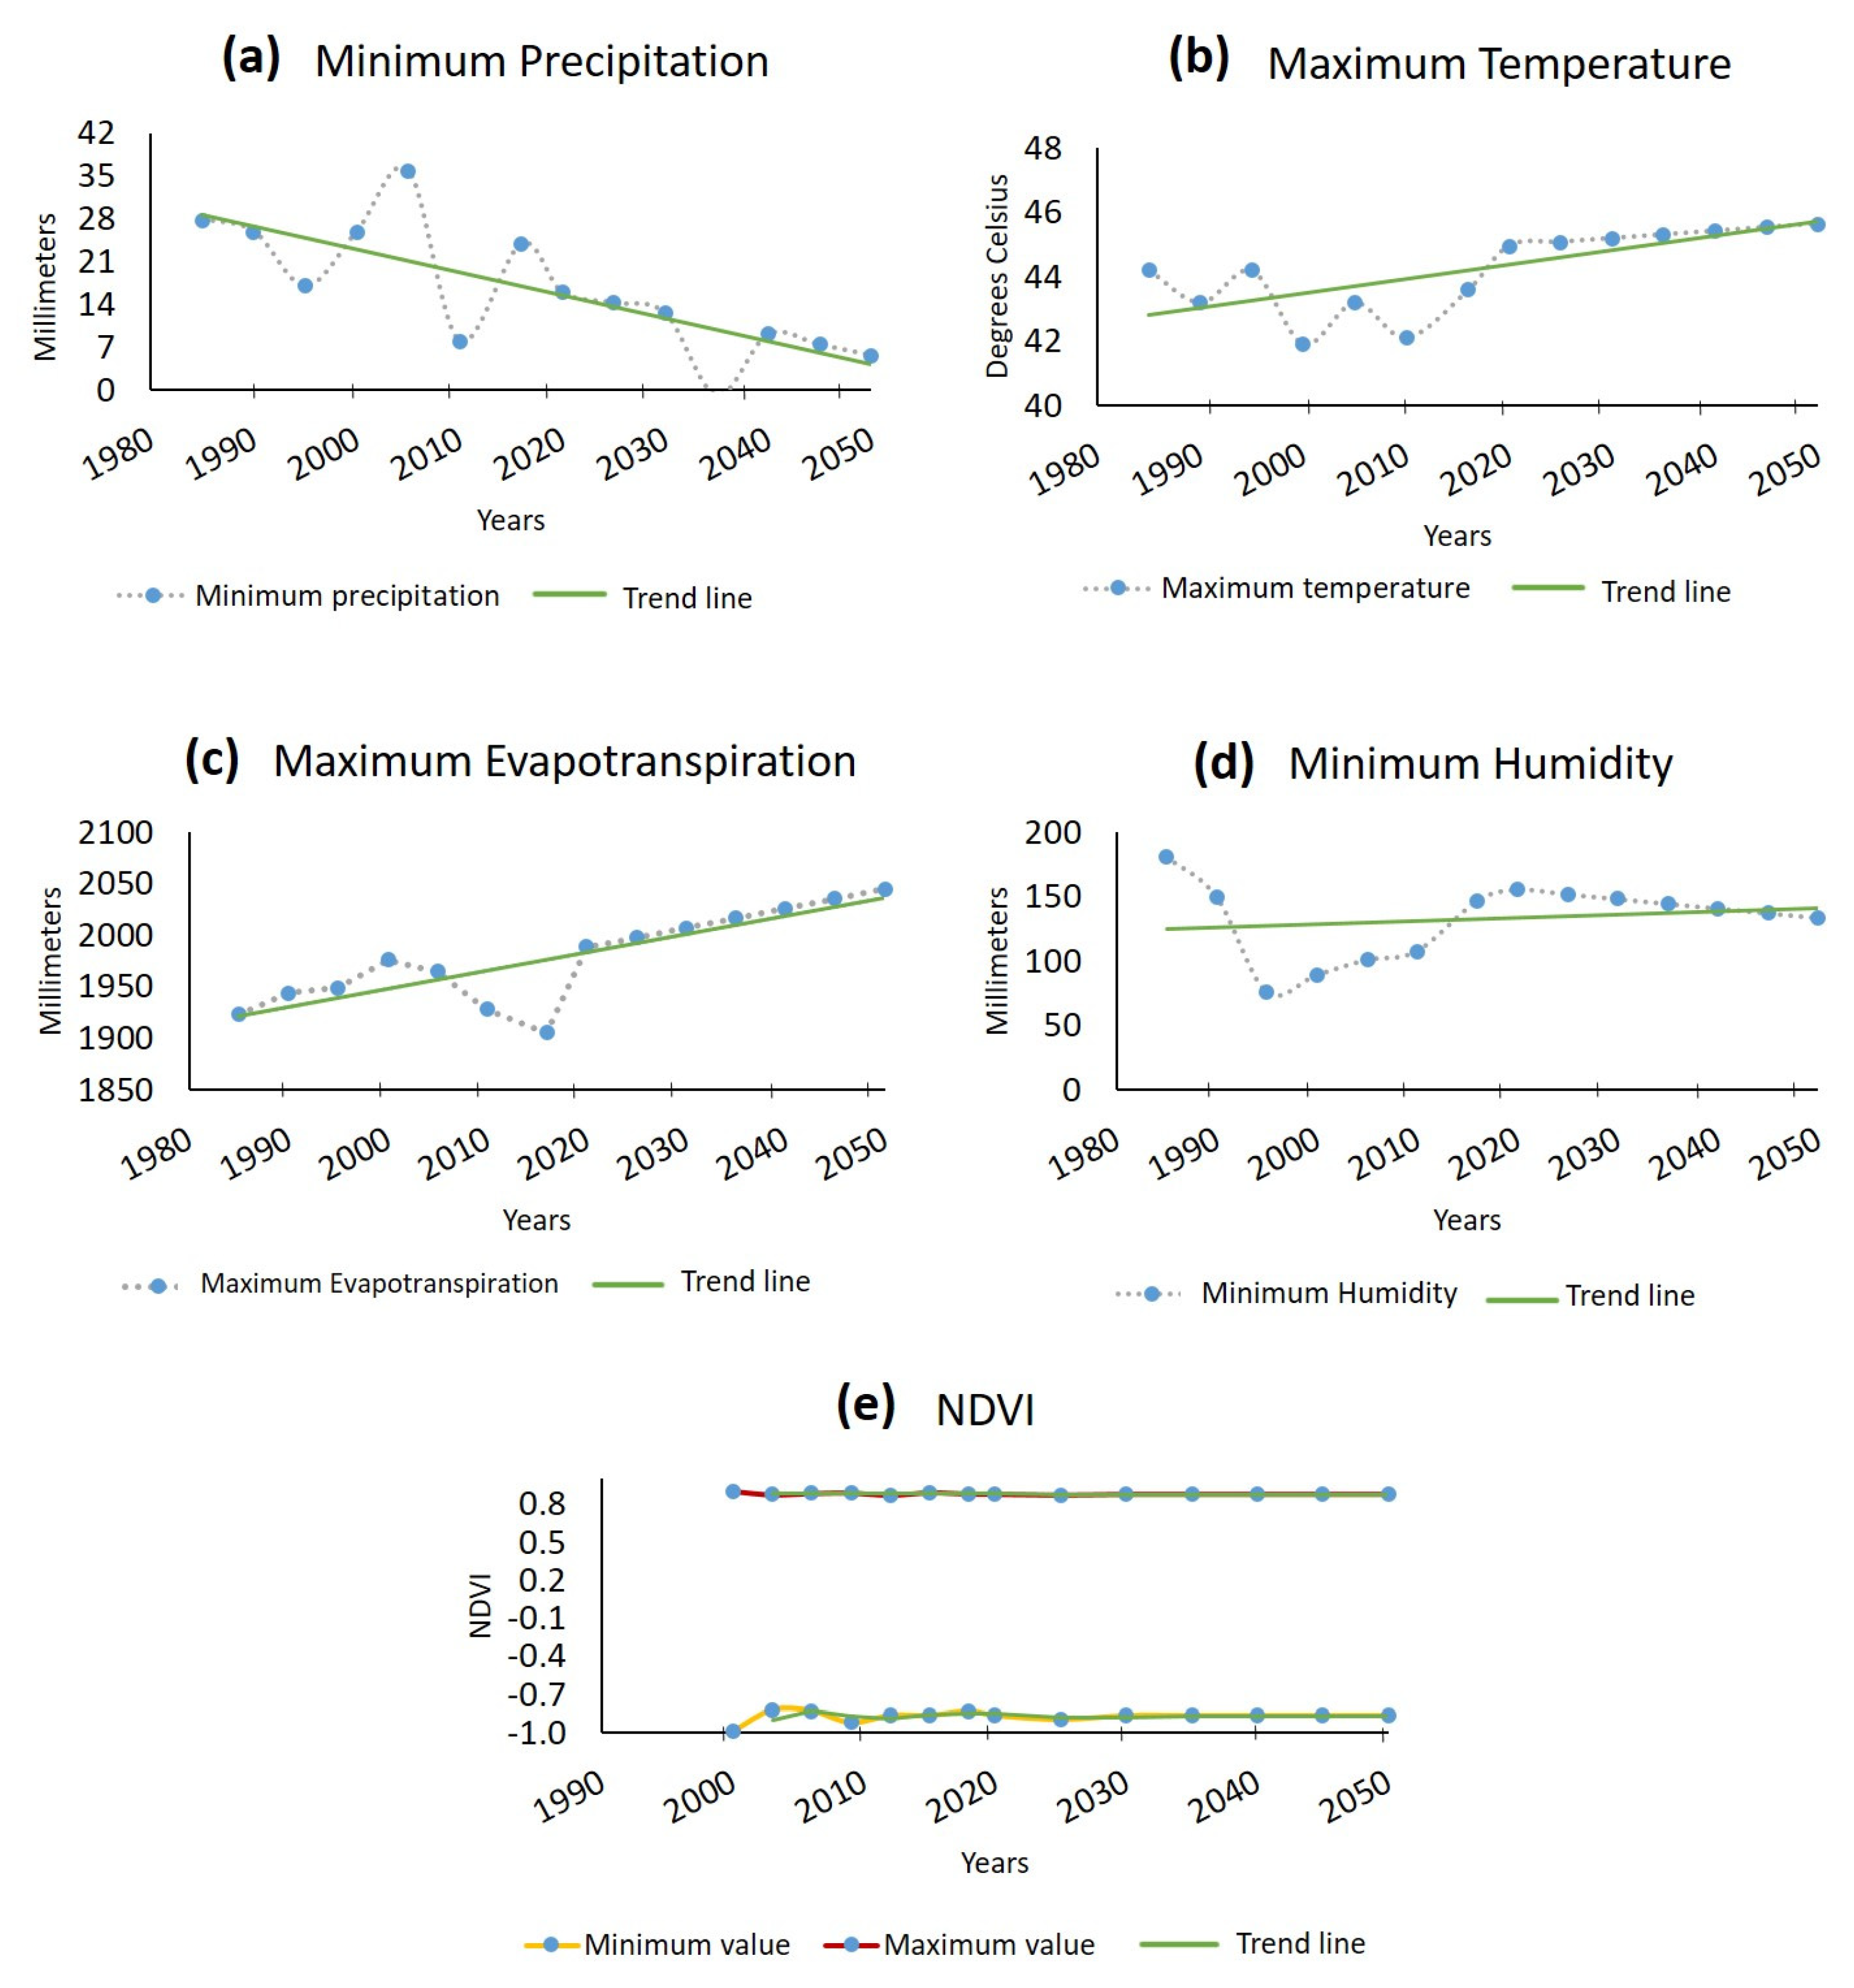
3.1.1. Annual Rates for the Variables Used
3.1.2. Variables Obtained for the Years 2030 and 2050
3.1.3. Normalized Factors
3.2. Quantitative and Geospatial Indicators of Aridity for the Year 2020 and Prospective Aridity for the Years 2030 and 2050
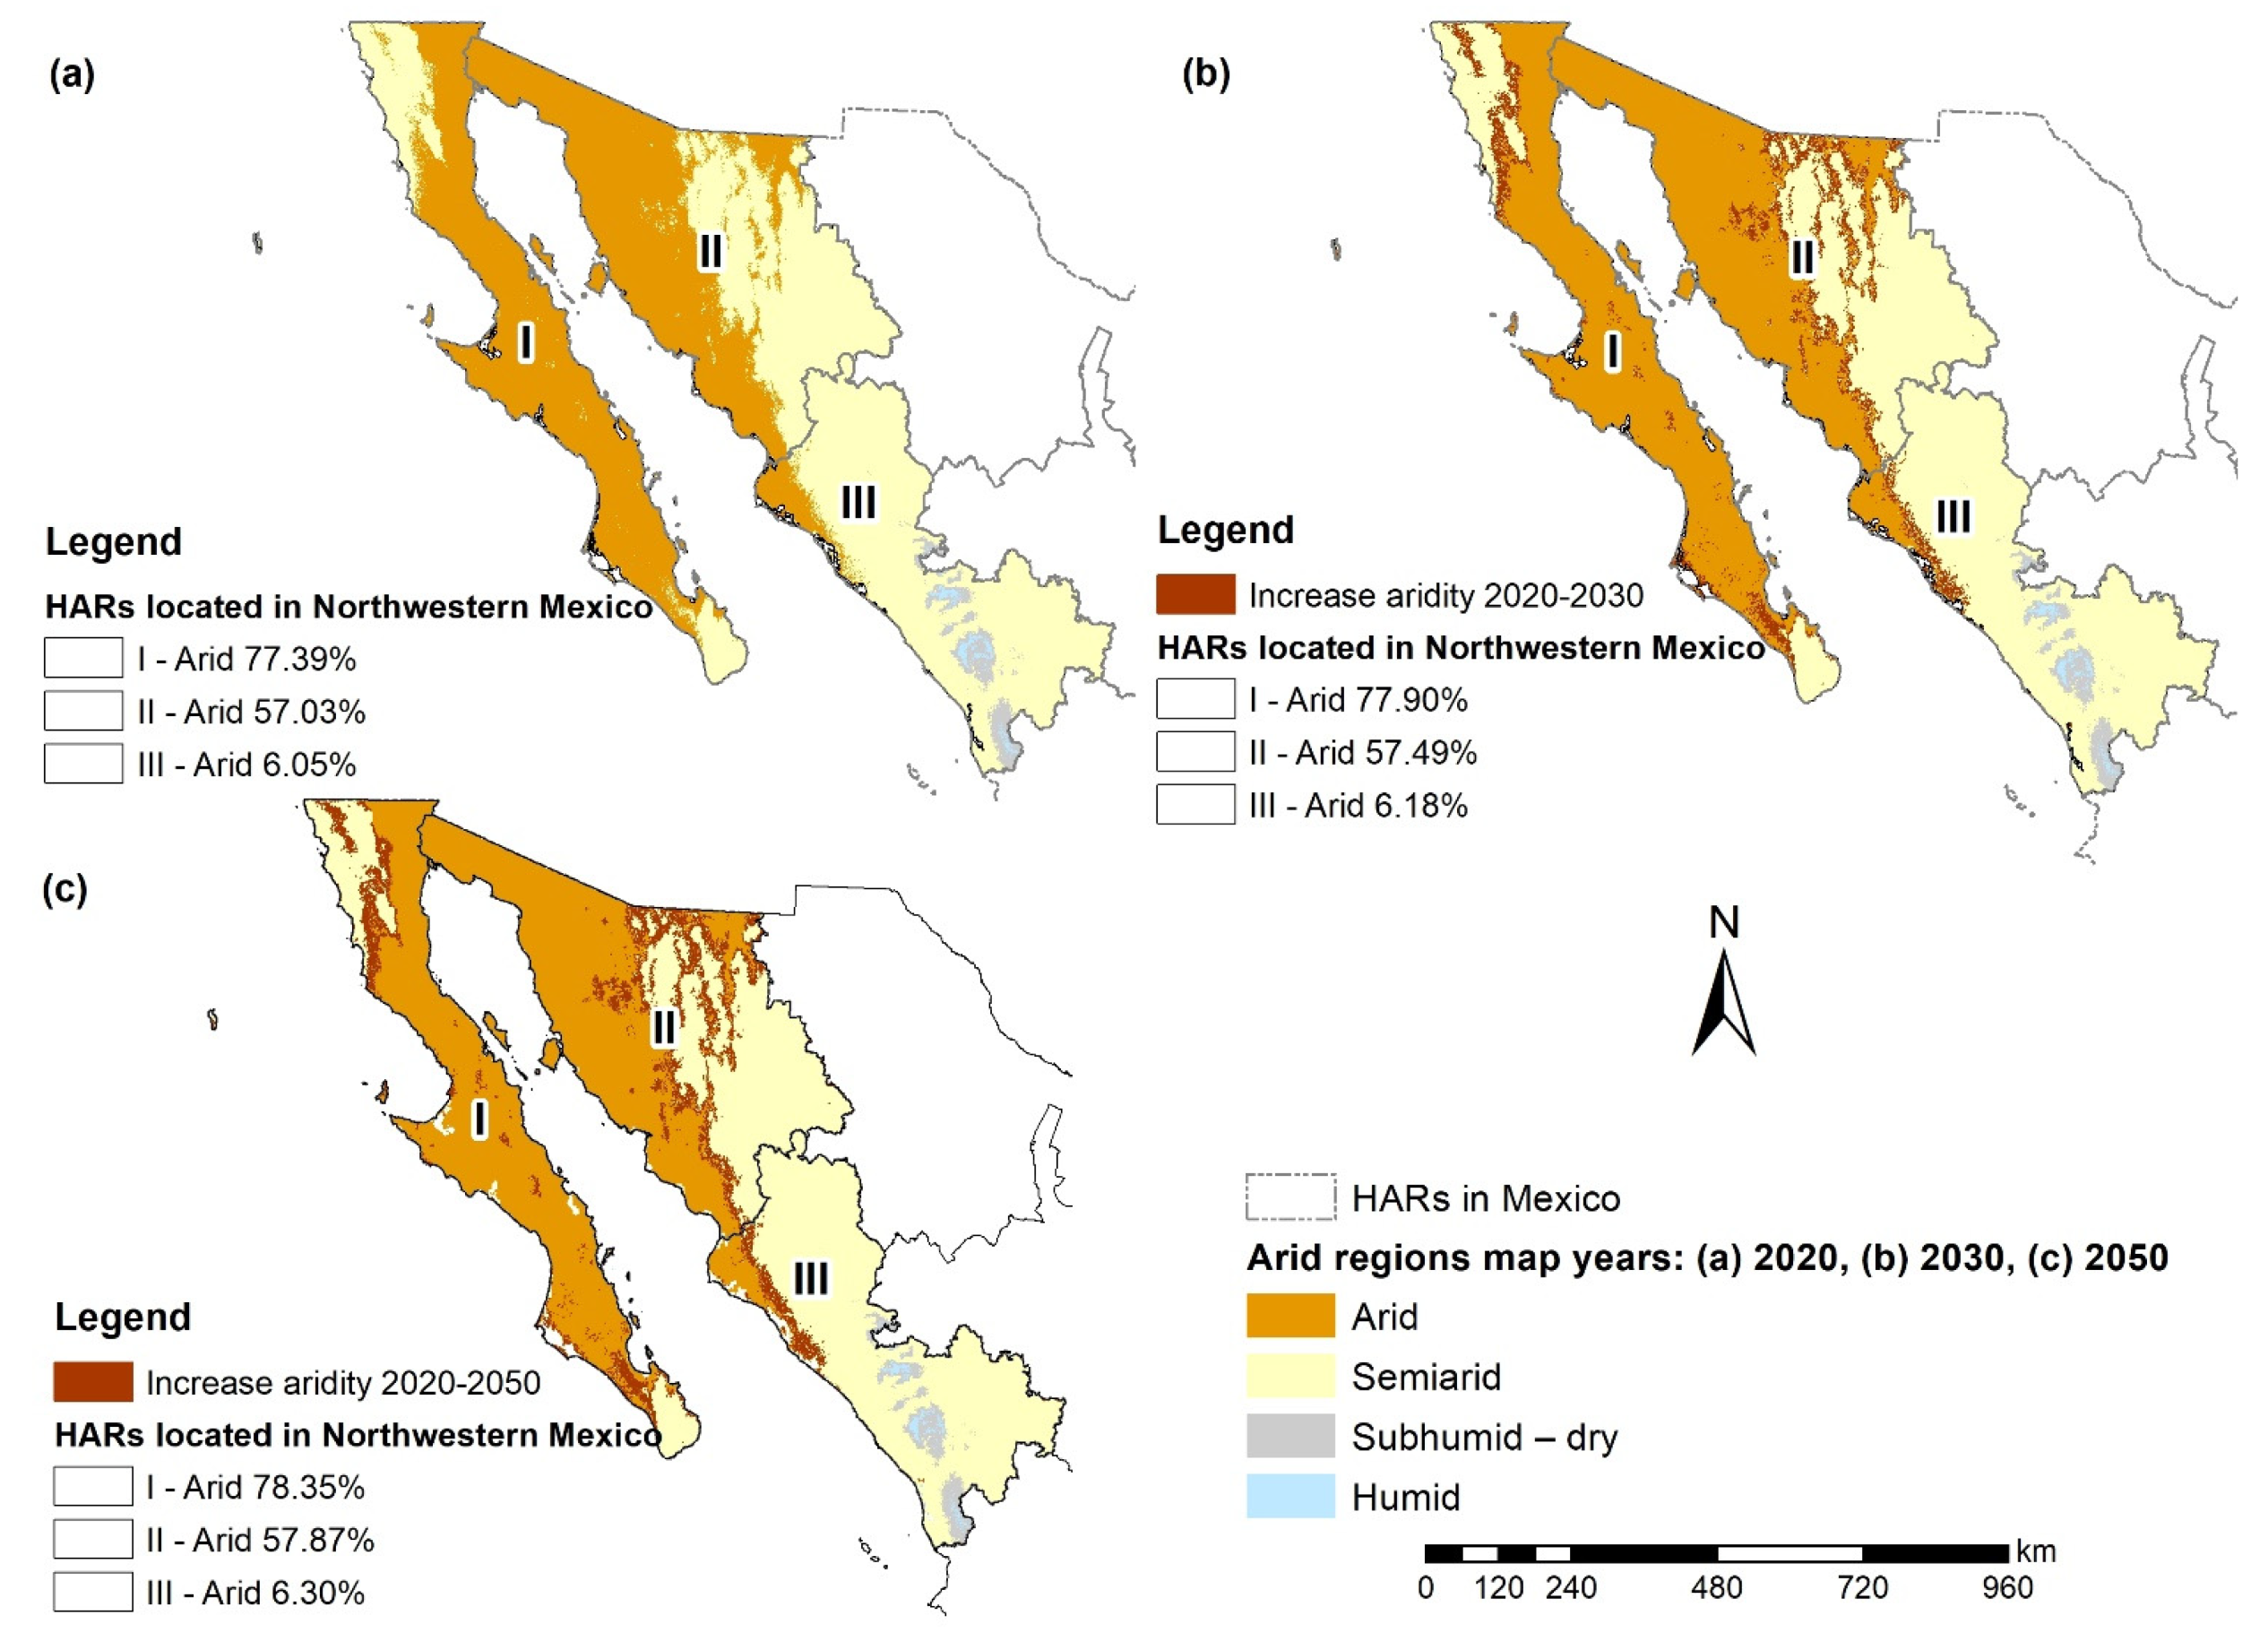
3.2.1. HAR-Level Indicators
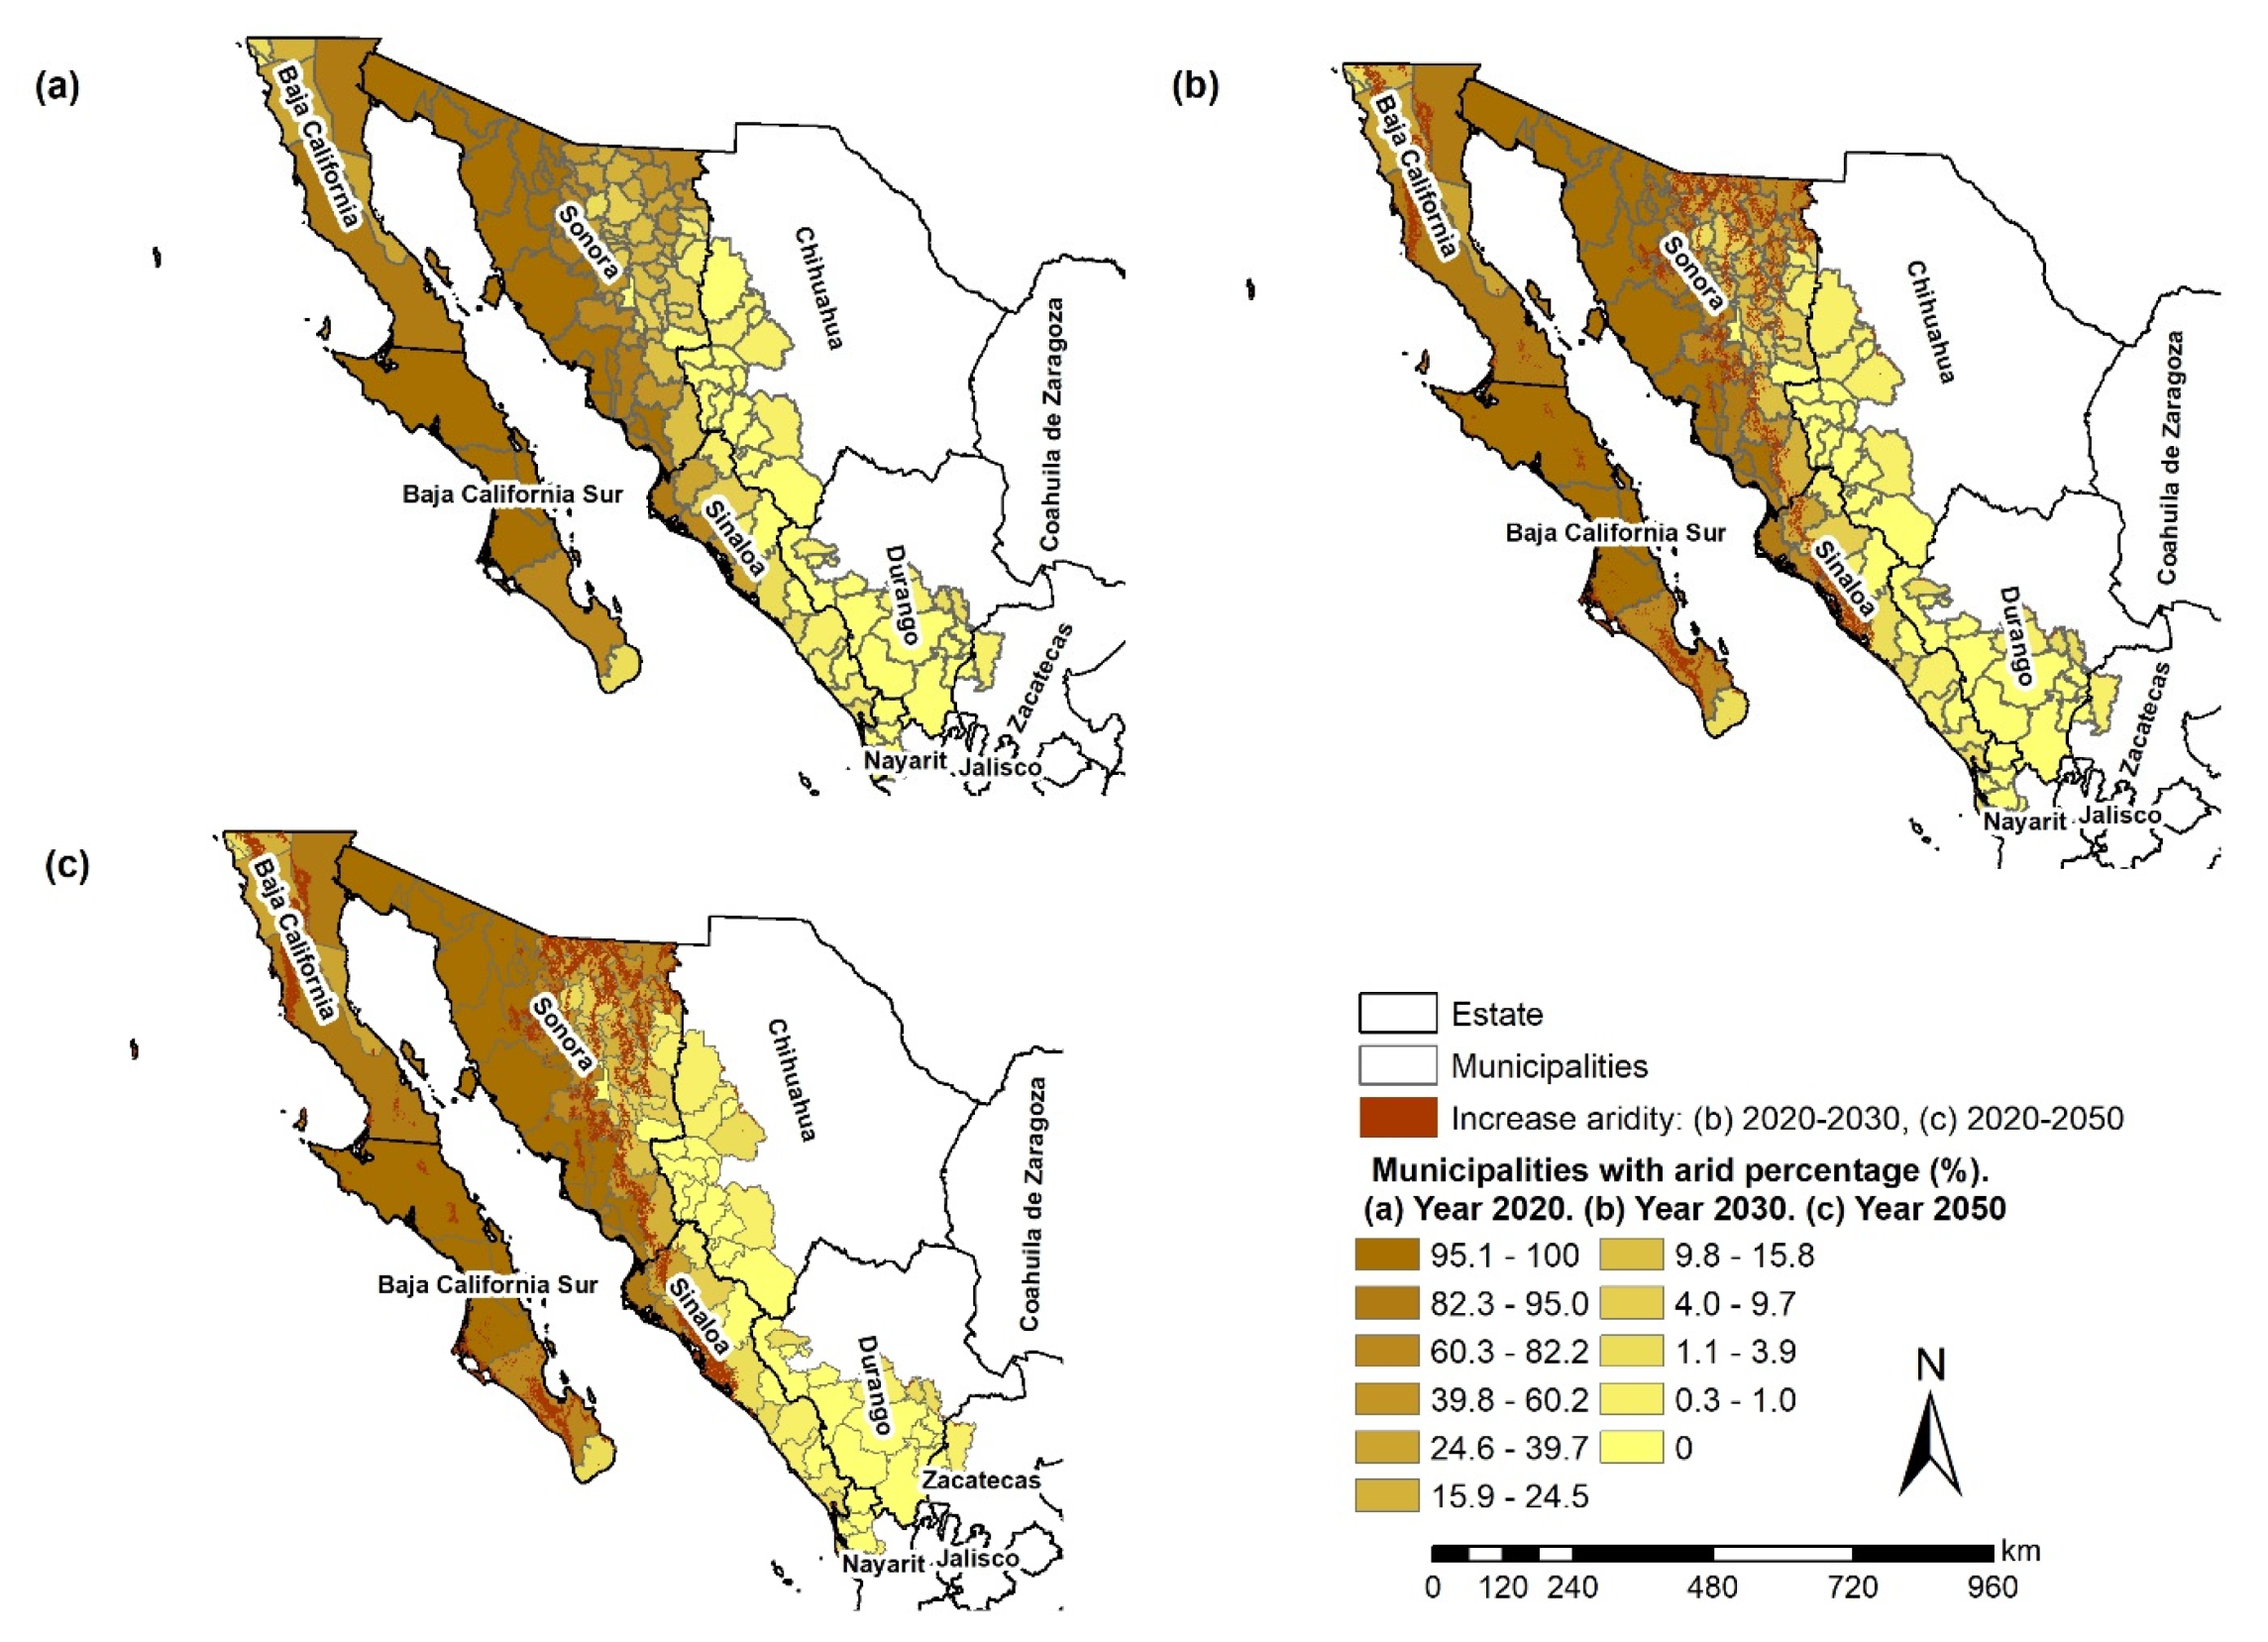
3.2.2. Municipal-Level Indicators
3.2.3. Land-Use Indicators
4. Discussion
5. Conclusions
6. Future Research Directions
Author Contributions
Funding
Institutional Review Board Statement
Informed Consent Statement
Acknowledgments
Conflicts of Interest
References
- Abrha, H.; Hagos, H. Future Drought and Aridity Monitoring Using Multi-Model Approach under Climate Change in Hintalo Wejerat District, Ethiopia. Sustain. Water Resour. Manag. 2019, 5, 1963–1972. [Google Scholar] [CrossRef]
- Asadi Zarch, M.A.; Sivakumar, B.; Sharma, A. Droughts in a Warming Climate: A Global Assessment of Standardized Precipitation Index (SPI) and Reconnaissance Drought Index (RDI). J. Hydrol. 2015, 526, 183–195. [Google Scholar] [CrossRef]
- Dadhich, A.P.; Goyal, R.; Dadhich, P.N. Assessment and Prediction of Groundwater Using Geospatial and ANN Modeling. Water Resour. Manag. 2021, 35, 2879–2893. [Google Scholar] [CrossRef]
- Greve, P.; Roderick, M.L.; Ukkola, A.M.; Wada, Y. The Aridity Index under Global Warming. Environ. Res. Lett. 2019, 14, 124006. [Google Scholar] [CrossRef]
- Maliva, R.; Missimer, T. Aridity and Drought. In Arid Lands Water Evaluation and Management; Maliva, R., Missimer, T., Eds.; Environmental Science and Engineering; Springer: Berlin/Heidelberg, Germany, 2012; pp. 21–39. ISBN 978-3-642-29104-3. [Google Scholar]
- Gebremedhin, M.A.; Kahsay, G.H.; Fanta, H.G. Assessment of Spatial Distribution of Aridity Indices in Raya Valley, Northern Ethiopia. Appl. Water Sci. 2018, 8, 217. [Google Scholar] [CrossRef]
- Stefanidis, S. Ability of Different Spatial Resolution Regional Climate Model to Simulate Air Temperature in a Forest Ecosystem of Central Greece. J. Environ. Prot. Ecol. 2021, 22, 1488–1495. [Google Scholar]
- Carvalho, D.; Cardoso Pereira, S.; Rocha, A. Future Surface Temperature Changes for the Iberian Peninsula According to EURO-CORDEX Climate Projections. Clim. Dyn. 2021, 56, 123–138. [Google Scholar] [CrossRef]
- Girvetz, E.H.; Zganjar, C. Dissecting Indices of Aridity for Assessing the Impacts of Global Climate Change. Clim. Change 2014, 126, 469–483. [Google Scholar] [CrossRef]
- Ullah, S.; You, Q.; Sachindra, D.A.; Nowosad, M.; Ullah, W.; Bhatti, A.S.; Jin, Z.; Ali, A. Spatiotemporal Changes in Global Aridity in Terms of Multiple Aridity Indices: An Assessment Based on the CRU Data. Atmos. Res. 2022, 268, 105998. [Google Scholar] [CrossRef]
- Dai, A. Drought under Global Warming: A Review. WIREs Clim. Change 2011, 2, 45–65. [Google Scholar] [CrossRef]
- Wallén, C.C. Aridity Definitions and Their Applicability. Geogr. Ann. Ser. A Phys. Geogr. 1967, 49, 367–384. [Google Scholar] [CrossRef]
- Marengo, J.A.; Bernasconi, M. Regional Differences in Aridity/Drought Conditions over Northeast Brazil: Present State and Future Projections. Clim. Change 2015, 129, 103–115. [Google Scholar] [CrossRef]
- Zhou, S.; Williams, A.P.; Berg, A.M.; Cook, B.I.; Zhang, Y.; Hagemann, S.; Lorenz, R.; Seneviratne, S.I.; Gentine, P. Land–Atmosphere Feedbacks Exacerbate Concurrent Soil Drought and Atmospheric Aridity. Proc. Natl. Acad. Sci. USA 2019, 116, 18848–18853. [Google Scholar] [CrossRef]
- Panday, P.K.; Coe, M.T.; Macedo, M.N.; Lefebvre, P.; Castanho, A.D. de A. Deforestation Offsets Water Balance Changes Due to Climate Variability in the Xingu River in Eastern Amazonia. J. Hydrol. 2015, 523, 822–829. [Google Scholar] [CrossRef]
- IPCC Intergovernmental Panel on Climate Change. Available online: https://www.dcceew.gov.au/climate-change/international-commitments/intergovernmental-panel (accessed on 5 November 2022).
- Masson-Delmotte, V.; Zhai, P.; Pirani, A.; Connors, S.L.; Péan, C.; Berger, S.; Caud, N.; Chen, Y.; Goldfarb, L.; Gomis, M.I.; et al. Climate Change 2021: The Physical Science Basis. Contribution of Working Group I to the Sixth Assessment Report of the Intergovernmental Panel on Climate Change; Cambridge University Press: Cambridge, UK; New York, NY, USA, 2021. Available online: https://pubs.giss.nasa.gov/abs/ar03200x.html (accessed on 5 November 2022).
- Pörtner, H.-O.; Roberts, D.C.; Tignor, M.M.B.; Poloczanska, E.S.; Mintenbeck, K.; Alegría, A.; Craig, M.; Langsdorf, S.; Löschke, S.; Möller, V.; et al. Climate Change 2022: Impacts, Adaptation and Vulnerability. Contribution of Working Group II to the Sixth Assessment Report of the Intergovernmental Panel on Climate Change. 2022. Available online: https://www.ipcc.ch/report/sixth-assessment-report-working-group-ii/ (accessed on 5 November 2022).
- Climate Change 2022: Mitigation of Climate Change. Available online: https://www.ipcc.ch/report/ar6/wg3/ (accessed on 5 November 2022).
- AR6 Synthesis Report: Climate Change 2022—IPCC. Available online: https://www.ipcc.ch/report/sixth-assessment-report-cycle/ (accessed on 5 November 2022).
- Sundholm, M. UNEP: United Nations Environment Programme. Office of the Secretary-General’s Envoy on Youth. 2013. Available online: https://www.un.org/youthenvoy/2013/08/unep-united-nations-environment-programme/ (accessed on 5 November 2022).
- Peña, L.C.B.; Córdova, M.O.G.; Cejudo, L.C.A.; Olave, M.E.T.; Murrieta, R.L.M.; Aguilar, V.M.S.; Villalobos, H.L.R.; Gómez, V.M.R.; Campos, M.I.U.; León, M.O.G. Degradación y deforestación en la cuenca del río Conchos (México): Modelado predictivo mediante regresión logística (1985–2016). Cuad. Geográficos 2022, 61, 129–149. [Google Scholar] [CrossRef]
- Lee, J.; Kim, B. Scenario-Based Real-Time Flood Prediction with Logistic Regression. Water 2021, 13, 1191. [Google Scholar] [CrossRef]
- Nhu, V.-H.; Mohammadi, A.; Shahabi, H.; Ahmad, B.B.; Al-Ansari, N.; Shirzadi, A.; Geertsema, M.; Kress, V.R.; Karimzadeh, S.; Valizadeh Kamran, K.; et al. Landslide Detection and Susceptibility Modeling on Cameron Highlands (Malaysia): A Comparison between Random Forest, Logistic Regression and Logistic Model Tree Algorithms. Forests 2020, 11, 830. [Google Scholar] [CrossRef]
- Aburas, M.M.; Ho, Y.M.; Ramli, M.F.; Ash’aari, Z.H. The Simulation and Prediction of Spatio-Temporal Urban Growth Trends Using Cellular Automata Models: A Review. Int. J. Appl. Earth Obs. Geoinf. 2016, 52, 380–389. [Google Scholar] [CrossRef]
- Nunes de Oliveira, S.; Abílio de Carvalho Júnior, O.; Trancoso Gomes, R.A.; Fontes Guimarães, R.; McManus, C.M. Deforestation Analysis in Protected Areas and Scenario Simulation for Structural Corridors in the Agricultural Frontier of Western Bahia, Brazil. Land Use Policy 2017, 61, 40–52. [Google Scholar] [CrossRef]
- Csábrági, A.; Molnár, S.; Tanos, P.; Kovács, J. Application of Artificial Neural Networks to the Forecasting of Dissolved Oxygen Content in the Hungarian Section of the River Danube. Ecol. Eng. 2017, 100, 63–72. [Google Scholar] [CrossRef]
- Bagheri, M.; Zaiton Ibrahim, Z.; Bin Mansor, S.; Abd Manaf, L.; Badarulzaman, N.; Vaghefi, N. Shoreline Change Analysis and Erosion Prediction Using Historical Data of Kuala Terengganu, Malaysia. Env. Earth Sci. 2019, 78, 477. [Google Scholar] [CrossRef]
- Maulud, D.H.; Mohsin Abdulazeez, A. A Review on Linear Regression Comprehensive in Machine Learning. J. Appl. Sci. Technol. Trends 2020, 1, 140–147. [Google Scholar] [CrossRef]
- James, G.; Witten, D.; Hastie, T.; Tibshirani, R. Linear Regression. In An Introduction to Statistical Learning; Springer Texts in Statistics: Liverpool, UK, 2021; pp. 59–128. [Google Scholar] [CrossRef]
- Maryati, I.; Sumartini, T.S.; Sofyan, D. Experiences of Pearson Formula in Analysis Regression. IOP Conf. Ser. Mater. Sci. Eng. 2021, 1098, 032088. [Google Scholar] [CrossRef]
- Etemadi, S.; Khashei, M. Etemadi Multiple Linear Regression. Measurement 2021, 186, 110080. [Google Scholar] [CrossRef]
- Lin, H.; Wang, J.; Li, F.; Xie, Y.; Jiang, C.; Sun, L. Drought Trends and the Extreme Drought Frequency and Characteristics under Climate Change Based on SPI and HI in the Upper and Middle Reaches of the Huai River Basin, China. Water 2020, 12, 1100. [Google Scholar] [CrossRef]
- Wang, W.; Chen, X.; Shi, P.; van Gelder, P.H.A.J.M. Detecting Changes in Extreme Precipitation and Extreme Streamflow in the Dongjiang River Basin in Southern China. Hydrol. Earth Syst. Sci. 2008, 12, 207–221. [Google Scholar] [CrossRef]
- Jiang, G.; Gu, X.; Zhao, D.; Xu, J.; Yang, C.; Wang, S.; Li, Y.; Li, B.-L. The Study of Drought in Future Climate Scenarios in the Huang-Huai-Hai Region. Water 2021, 13, 3474. [Google Scholar] [CrossRef]
- An, Q.; He, H.; Nie, Q.; Cui, Y.; Gao, J.; Wei, C.; Xie, X.; You, J. Spatial and Temporal Variations of Drought in Inner Mongolia, China. Water 2020, 12, 1715. [Google Scholar] [CrossRef]
- Henríquez, C.; Azócar, G.; Aguayo, M. Cambio de Uso Del Suelo y Escorrentía Superficial: Aplicación de Un Modelo de Simulación Espacial En Los Ángeles, VIII Región Del Biobío, Chile. Rev. Geogr. Norte Gd. 2006, 61–74. [Google Scholar] [CrossRef]
- Henríquez, C.; Azócar, G.; Romero, H. Monitoring and Modeling the Urban Growth of Two Mid-Sized Chilean Cities. Habitat Int. 2006, 30, 945–964. [Google Scholar] [CrossRef]
- Jat, M.K.; Garg, P.K.; Khare, D. Monitoring and Modelling of Urban Sprawl Using Remote Sensing and GIS Techniques. Int. J. Appl. Earth Obs. Geoinf. 2008, 10, 26–43. [Google Scholar] [CrossRef]
- Singh, S.; Reddy, C.S.; Pasha, S.V.; Dutta, K.; Saranya, K.R.L.; Satish, K.V. Modeling the Spatial Dynamics of Deforestation and Fragmentation Using Multi-Layer Perceptron Neural Network and Landscape Fragmentation Tool. Ecol. Eng. 2017, 99, 543–551. [Google Scholar] [CrossRef]
- Patel, M.; Kok, K.; Rothman, D.S. Participatory Scenario Construction in Land Use Analysis: An Insight into the Experiences Created by Stakeholder Involvement in the Northern Mediterranean. Land Use Policy 2007, 24, 546–561. [Google Scholar] [CrossRef]
- Overmars, K.P.; Verburg, P.H. Multilevel Modelling of Land Use from Field to Village Level in the Philippines. Agric. Syst. 2006, 89, 435–456. [Google Scholar] [CrossRef]
- Verburg, P.H.; Overmars, K.P.; Huigen, M.G.A.; de Groot, W.T.; Veldkamp, A. Analysis of the Effects of Land Use Change on Protected Areas in the Philippines. Appl. Geogr. 2006, 26, 153–173. [Google Scholar] [CrossRef]
- Thapa, R.B.; Shimada, M.; Watanabe, M.; Motohka, T.; Shiraishi, T. L-Band SAR Data and Spatially Explicit Model to Analyse Forest Loss between 2007 and 2030 in Central Sumatra. In Proceedings of the 2013 Asia-Pacific Conference on Synthetic Aperture Radar (APSAR), Tsukuba, Japan, 23–27 September 2013; pp. 108–111. [Google Scholar]
- Perez-Aguilar, L.Y.; Plata-Rocha, W.; Monjardin-Armenta, S.A.; Franco-Ochoa, C.; Zambrano-Medina, Y.G. The Identification and Classification of Arid Zones through Multicriteria Evaluation and Geographic Information Systems—Case Study: Arid Regions of Northwest Mexico. ISPRS Int. J. Geo-Inf. 2021, 10, 720. [Google Scholar] [CrossRef]
- INEGI Instituto Nacional de Estadística y Geografía. INEGI. Available online: https://www.inegi.org.mx/ (accessed on 4 February 2021).
- Monjardin-Armenta, S.A.; Plata-Rocha, W.; Pacheco-Angulo, C.E.; Franco-Ochoa, C.; Rangel-Peraza, J.G. Geospatial Simulation Model of Deforestation and Reforestation Using Multicriteria Evaluation. Sustainability 2020, 12, 10387. [Google Scholar] [CrossRef]
- Zabihi, H.; Alizadeh, M.; Langat, P.K.; Karami, M.; Shahabi, H.; Ahmad, A.; Said, M.N.; Lee, S. GIS Multi-Criteria Analysis by Orderedweighted Averaging (OWA): Toward an Integrated Citrus Management Strategy. Sustainability 2019, 11, 1009. [Google Scholar] [CrossRef]
- Azareh, A.; Rafiei Sardooi, E.; Choubin, B.; Barkhori, S.; Shahdadi, A.; Adamowski, J.; Shamshirband, S. Incorporating Multi-Criteria Decision-Making and Fuzzy-Value Functions for Flood Susceptibility Assessment. Geocarto Int. 2021, 36, 2345–2365. [Google Scholar] [CrossRef]
- Feizizadeh, B.; Blaschke, T. GIS-Multicriteria Decision Analysis for Landslide Susceptibility Mapping: Comparing Three Methods for the Urmia Lake Basin, Iran. Nat. Hazards 2013, 65, 2105–2128. [Google Scholar] [CrossRef]
- Ajaj, Q.M.; Pradhan, B.; Noori, A.M.; Jebur, M.N. Spatial Monitoring of Desertification Extent in Western Iraq Using Landsat Images and GIS. Land Degrad. Dev. 2017, 28, 2418–2431. [Google Scholar] [CrossRef]
- Akbari, M.; Neamatollahi, E.; Neamatollahi, P. Evaluating Land Suitability for Spatial Planning in Arid Regions of Eastern Iran Using Fuzzy Logic and Multi-Criteria Analysis. Ecol. Indic. 2019, 98, 587–598. [Google Scholar] [CrossRef]
- Zoghi, M.; Houshang Ehsani, A.; Sadat, M.; javad Amiri, M.; Karimi, S. Optimization Solar Site Selection by Fuzzy Logic Model and Weighted Linear Combination Method in Arid and Semi-Arid Region: A Case Study Isfahan-IRAN. Renew. Sustain. Energy Rev. 2017, 68, 986–996. [Google Scholar] [CrossRef]
- Aydi, A. Evaluation of Groundwater Vulnerability to Pollution Using a GIS-Based Multi-Criteria Decision Analysis. Groundw. Sustain. Dev. 2018, 7, 204–211. [Google Scholar] [CrossRef]
- Barrow, C.J. World Atlas of Desertification (United Nations Environment Programme), Edited by N. Middleton and D. S. G. Thomas. Edward Arnold, London, 1992. Isbn 0 340 55512 2, £89.50 (Hardback), Ix + 69 pp. Land Degrad. Dev. 1992, 3, 249. [Google Scholar] [CrossRef]
- Cherlet, M.; Hutchinson, C.; Reynolds, J.; Hill, J.; Sommer, S.; von Maltitz, G. World Atlas of Desertification, 3rd ed.; Office of the European Union: Luxembourg, 2018; ISBN 978-92-79-75350-3. [Google Scholar]
- Torres, L.; Abraham, E.M.; Rubio, C.; Barbero-Sierra, C.; Ruiz-Pérez, M. Desertification Research in Argentina. Land Degrad. Dev. 2015, 26, 433–440. [Google Scholar] [CrossRef]
- Stephen, J. Aridity Indexes. In Encyclopedia of World Climatology; Oliver, J.E., Ed.; Springer: Dordrecht, The Netherlands, 2005; pp. 89–94. ISBN 978-1-4020-3266-0. [Google Scholar] [CrossRef]
- Lin, L.; Gettelman, A.; Fu, Q.; Xu, Y. Simulated Differences in 21st Century Aridity Due to Different Scenarios of Greenhouse Gases and Aerosols. Clim. Change 2018, 146, 407–422. [Google Scholar] [CrossRef]
- Verbist, K.; Santibañez, F.; Gabriels, D.; Soto, G. Atlas of Arid and Semi Arid Zones of Latin America and the Caribbean. Available online: https://unesdoc.unesco.org/ark:/48223/pf0000228135 (accessed on 27 July 2022).
- Díaz-Padilla, G.; Sánchez-Cohen, I.; Guajardo-Panes, R.A.; Del Ángel-Pérez, A.L.; Ruíz-Corral, A.; Medina-García, G.; Ibarra-Castillo, D. Mapeo del índice de aridez y su distribución poblacional en México. Rev. Chapingo Ser. Cienc. For. Y Del Ambiente 2011, 17, 267–275. [Google Scholar] [CrossRef]
- Bachand, C.L.; Walsh, J.E. Extreme Precipitation Events in Alaska: Historical Trends and Projected Changes. Atmosphere 2022, 13, 388. [Google Scholar] [CrossRef]
- Pontius, R.G.; Cheuk, M.L. A Generalized Cross-tabulation Matrix to Compare Soft-classified Maps at Multiple Resolutions. Int. J. Geogr. Inf. Sci. 2006, 20, 1–30. [Google Scholar] [CrossRef]
- Gll Pontlus, R., Jr. Quantification Error versus Location Error in Comparison of Categorical Maps. Photogramm. Eng. Remote Sens. 2000, 66. Available online: https://www.asprs.org/wp-content/uploads/pers/2000journal/august/2000_aug_1011-1016.pdf (accessed on 9 July 2021).
- Trabucco, A.; Zomer, R.J. Global Geospatial Potential EvapoTranspiration & Aridity Index Methodology and Dataset Description. CGIAR-CSI 2009. Available online: https://cgiarcsi.community/2019/01/24/global-aridity-index-and-potential-evapotranspiration-climate-database-v2/ (accessed on 9 July 2021).
- CONAGUA Monitor de Sequía en México. Available online: https://smn.conagua.gob.mx/es/climatologia/monitor-de-sequia/monitor-de-sequia-en-mexico (accessed on 9 July 2021).
- Lobato-Sánchez, R. El monitor de la sequía en México. Tecnol. Y Cienc. Del Agua 2016, 7, 197–211. [Google Scholar]
- CONAGUA; UNAM Monitor de Sequía Multivariado En México (MoSeMM). Available online: http://www.ii.unam.mx/es-mx/Investigacion/Proyecto/Paginas/Monitordesequia.aspx (accessed on 3 July 2022).
- Campos-Aranda, D.F. Estudio de sequías meteorológicas anuales por medio del índice de aridez, en el estado de Zacatecas, México. Ing. Investig. Y Tecnol. 2016, 17, 405–417. [Google Scholar] [CrossRef][Green Version]
- SEMARNAT El Medio Ambiente En México 2013–2014. Available online: https://apps1.semarnat.gob.mx:8443/dgeia/informe_resumen14/03_suelos/3_3.html (accessed on 10 June 2019).
- Troyo Diéguez, E.; Mercado Mancera, G.; Cruz Falcón, A.; Nieto Garibay, A.; Valdez Cepeda, R.D.; García Hernández, J.L.; Murillo Amador, B. Análisis de la sequía y desertificación mediante índices de aridez y estimación de la brecha hídrica en Baja California Sur, noroeste de México. Investig. Geográficas 2014, 85, 66–81. [Google Scholar] [CrossRef][Green Version]
- CONAZA Comisión Nacional de Zonas Áridas. Available online: https://www.gob.mx/conaza (accessed on 23 June 2022).

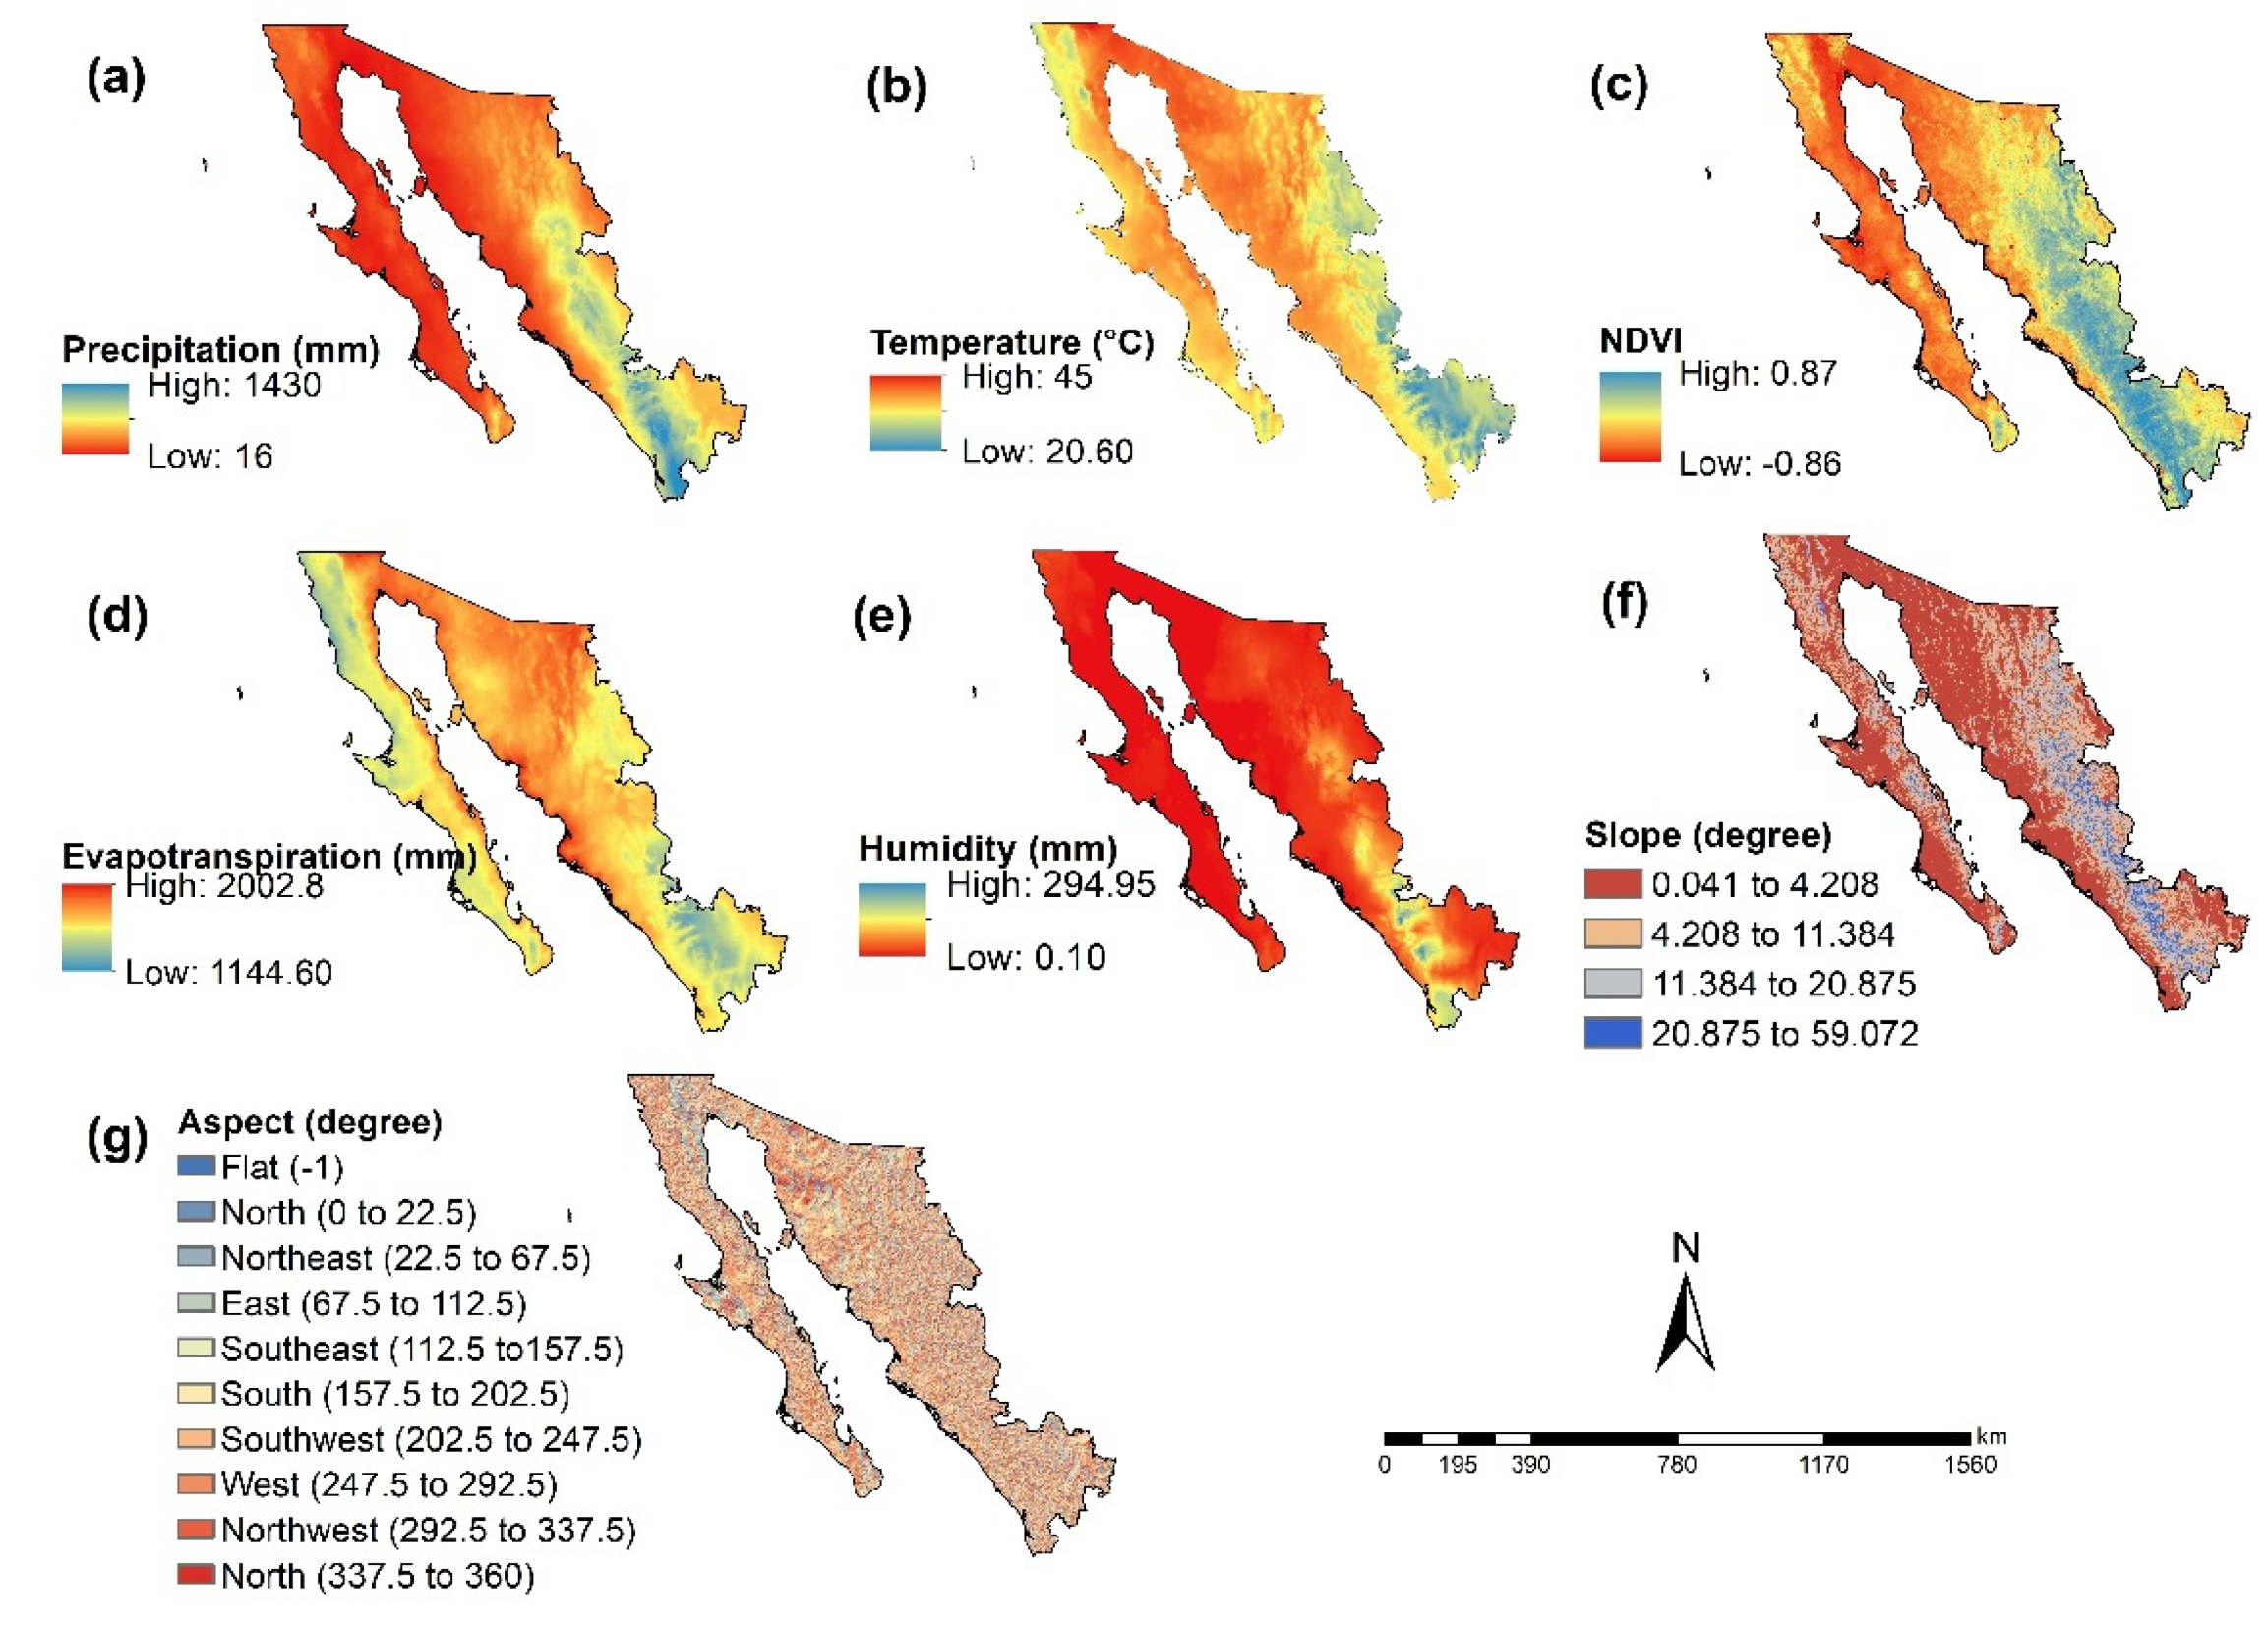
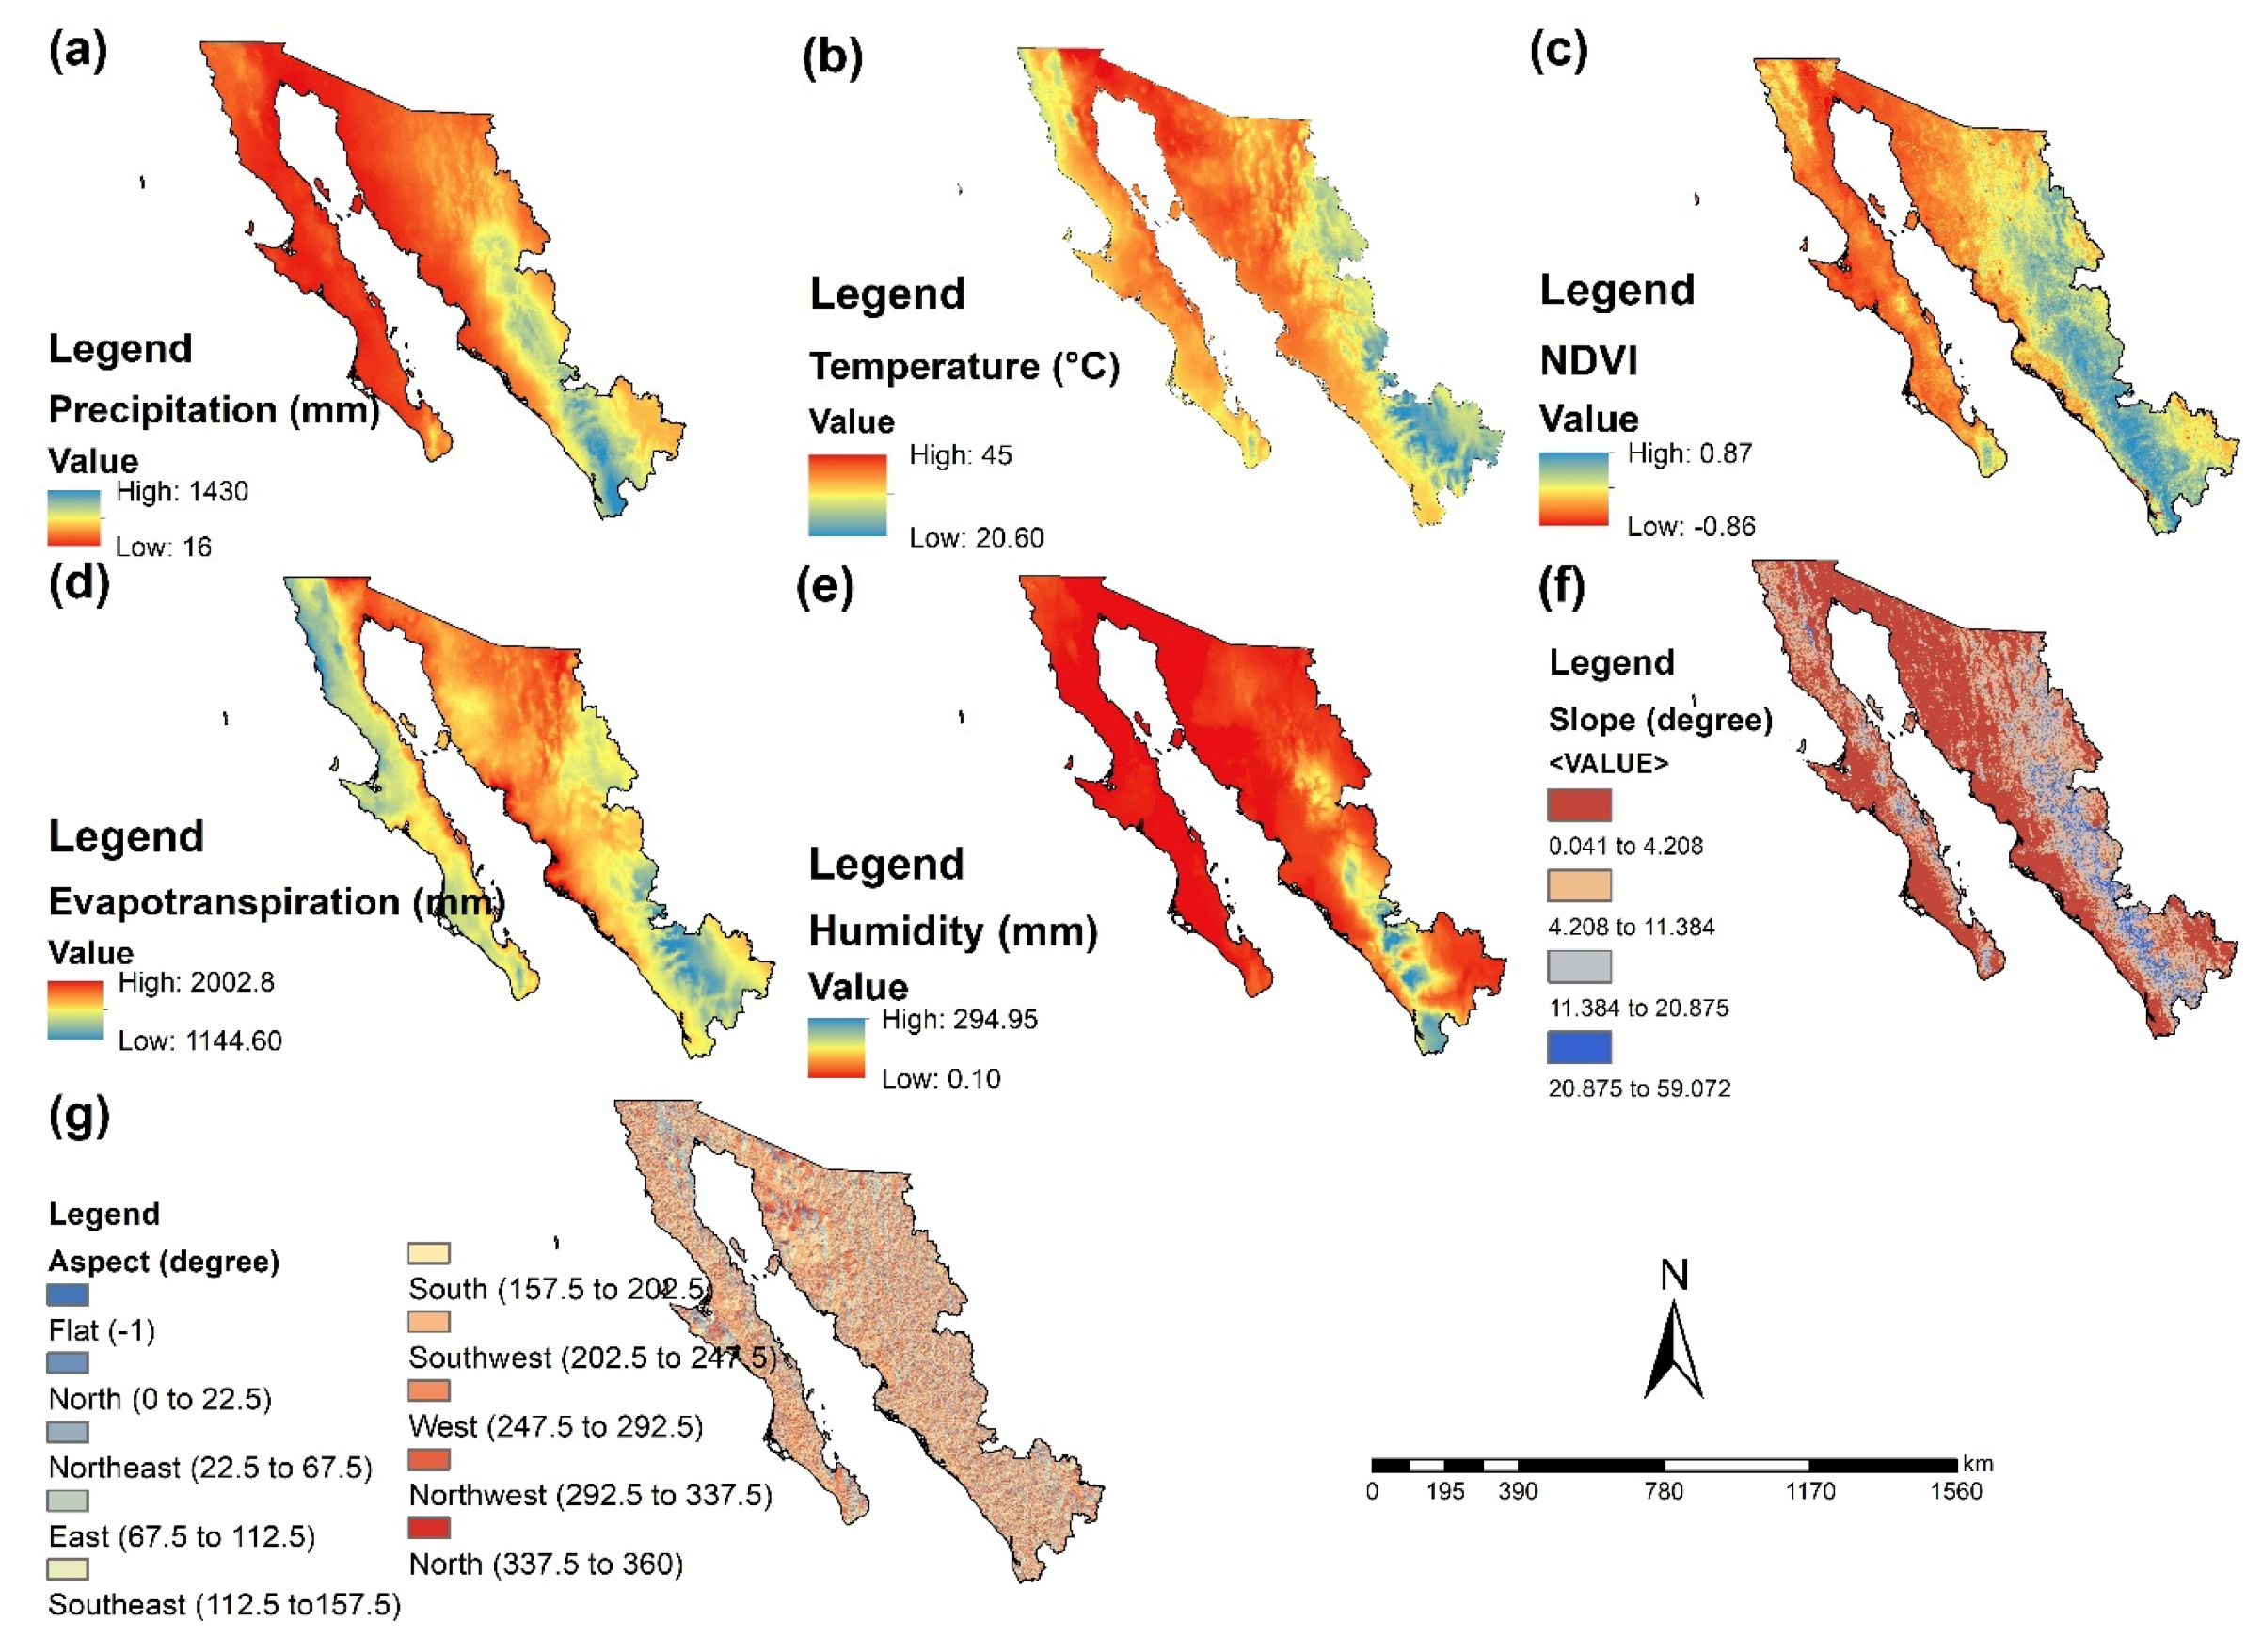

| Data (Year 2020) | Data Type | Spatial Resolution | Temporal Resolution | Units | Source | Link |
|---|---|---|---|---|---|---|
| Precipitation | Raster | 4 km | Monthly, 2019 | Millimeters | TerraClimate | https://app.climateengine.org/climateEngine (accessed on 16 March 2022). |
| Temperature | Raster | 1 km | 8 days, annual average 2019 annual average 2019 | °K | Dataset | https://earthexplorer.usgs.gov/ (accessed on 16 March 2022). |
| Evapotranspiration | Raster | 4 km | Monthly, 2019 | Millimeters | MODIS/ USGS | https://app.climateengine.org/climateEngine (accessed on 16 March 2022). |
| DEM | Raster | 90 m | Year 2008 | Meters | TerraClimate | https://srtm.csi.cgiar.org (accessed on 16 March 2022). |
| NDVI | Raster | 500 m | 16 days | NDVI | Dataset | https://earthexplorer.usgs.gov/ (accessed on 16 March 2022). |
| Humidity | Raster | 9 km | Monthly, 2019 | Millimeters | SRTM | https://app.climateengine.org/climateEngine (accessed on 16 March 2022). |
| Slopes | Raster | 90 m | Year 2008 | Degree | MODIS/ USGS | https://srtm.csi.cgiar.org (accessed on 16 March 2022). |
| Aspect | Raster | 90 m | Year 2008 | Degree | FLDAS | https://srtm.csi.cgiar.org (accessed on 16 March 2022). |
| Factor | Weights |
|---|---|
| Precipitation | 0.28 |
| Temperature | 0.22 |
| Evapotranspiration | 0.19 |
| Humidity | 0.13 |
| NDVI | 0.09 |
| Slope | 0.06 |
| Aspect | 0.03 |
| Data. | Units | Data Type | Temporal Resolution | Spatial Resolution | Source | Link |
|---|---|---|---|---|---|---|
| Minimum precipitation | Millimeters | Raster | Monthly | 4000 Meters | TerraClimate Dataset | https://app.climateengine.org/climateEngine (accessed on 16 March 2022). |
| Maximum temperature | °C | Raster | Monthly | 4000 Meters | TerraClimate Dataset | https://app.climateengine.org/climateEngine (accessed on 16 March 2022). |
| Maximum Evapotranspiration | Millimeters | Raster | Monthly | 4000 Meters | TerraClimate Dataset | https://app.climateengine.org/climateEngine (accessed on 16 March 2022). |
| Minimum Humidity | Millimeters | Raster | Monthly | 4000 Meters | TerraClimate Dataset | https://app.climateengine.org/climateEngine (accessed on 16 March 2022). |
| NDVI | NDVI | Raster | 16 days | 500 Meters | Modis Terranet | https://app.climateengine.org/climateEngine (accessed on 16 March 2022). |
| Data. | Data Type | Year | Scale | Author | Source | Link |
|---|---|---|---|---|---|---|
| Hydrological Administrative Regions | Vector | 2007 | 1:250,000 | CONAGUA | CONABIO | http://www.conabio.gob.mx/informacion/gis/ (accessed on 25 May 2022). |
| State political division | Vector | 2020 | 1:250,000 | INEGI | CONABIO | http://www.conabio.gob.mx/informacion/gis/ (accessed on 25 May 2022). |
| Municipal political division | Vector | 2020 | 1:250,000 | INEGI | CONABIO | http://www.conabio.gob.mx/informacion/gis/ (accessed on 25 May 2022). |
| Land use and vegetation, series VII | Vector | 2021 | 1:250,000 | INEGI | CONABIO | http://www.conabio.gob.mx/informacion/gis/ (accessed on 25 May 2022). |
| Factor (Annual Average) | Minimum Value | Maximum Value | Units | Function | Minimum Standardized Value | Maximum Standardized Value |
|---|---|---|---|---|---|---|
| Precipitation | 16 | 1430 | Millimeters | Linear increasing | 0 | 1 |
| Temperature | 20.60 | 45 | °C | Linear decreasing | 0 | 1 |
| NDVI | −0.86 | 0.87 | NDVI | Linear increasing | 0 | 1 |
| Evapotranspiration | 1144.60 | 2002.8 | Millimeters | Linear decreasing | 0 | 1 |
| Humidity | 0.10 | 294.95 | Millimeters | Linear increasing | 0 | 1 |
| Slopes | 0 | 144.96 | Degree | Linear decreasing | 0 | 1 |
| Aspect | 0 | 359.97 | Degree | Linear decreasing | 0 | 1 |
| AI. | Classification |
|---|---|
| <0.05 | Hyperarid |
| 0.05–0.2 | Arid |
| 0.2–0.5 | Semiarid |
| 0.5–0.65 | Subhumid–dry |
| >0.65 | Humid |
| Data | Year | |||||||
|---|---|---|---|---|---|---|---|---|
| 1985 | 1990 | 1995 | 2000 | 2005 | 2010 | 2015 | 2020 | |
| Minimum precipitation (mm) | 28 | 26 | 17 | 26 | 36 | 8 | 24 | 16 |
| Maximum temperature (°C) | 44.2 | 43.2 | 44.2 | 41.9 | 43.2 | 42.1 | 43.6 | 45 |
| Maximum evapotranspiration (mm) | 1922.7 | 1943.5 | 1949 | 1976.2 | 1964.5 | 1928.2 | 1905.5 | 1988.3 |
| Minimum Humidity (mm) | 181.2 | 150 | 75.5 | 88.8 | 100.6 | 107.4 | 146.6 | 155.4 |
| 2000 | 2003 | 2006 | 2009 | 2012 | 2015 | 2018 | 2020 | |
| NDVI minimum | −0.984 | −0.821 | −0.829 | −0.919 | −0.863 | −0.864 | −0.831 | −0.864 |
| NDVI maximum | 0.898 | 0.874 | 0.884 | 0.886 | 0.871 | 0.889 | 0.880 | 0.878 |
| Factor (Annual Average) | Year 2030 | Year 2050 | Function | Normalized Minimum Value | Normalized Maximum Value | ||
|---|---|---|---|---|---|---|---|
| Minimum Value | Maximum Value | Minimum Value | Maximum Value | ||||
| Precipitation | 0 | 1426.57 | 0 | 1419.71 | Linear increasing | 0 | 1 |
| Temperature | 0.23 | 45.23 | 0.69 | 45.69 | Linear decreasing | 0 | 1 |
| NDVI | −0.804 | 0.862 | −0.685 | 0.8426 | Linear increasing | 0 | 1 |
| Evapotranspiration | 18.74 | 2021.54 | 56.23 | 2059.03 | Linear decreasing | 0 | 1 |
| Humidity | 0.01 | 287.584 | 0 | 272.844 | Linear increasing | 0 | 1 |
| Slope | 0 | 144.96 | 0 | 144.96 | Linear decreasing | 0 | 1 |
| Aspect | 0 | 359.97 | 0 | 359.97 | Linear decreasing | 0 | 1 |
| Data | 1990 | 1995 | 2000 | 2005 | 2010 | 2015 | 2020 | Annual Exchange Rate | Exchange Rate to 2030 | Exchange Rate to 2050 |
|---|---|---|---|---|---|---|---|---|---|---|
| Minimum precipitation | −0.4 | −1.8 | 1.8 | 2 | −5.6 | 3.2 | −1.6 | −0.34 | −3.43 | −10.29 |
| Maximum temperature | −0.2 | 0.2 | −0.46 | 0.26 | −0.22 | 0.3 | 0.28 | 0.023 | 0.23 | 0.69 |
| Maximum Evapotranspiration | 4.16 | 1.1 | 5.44 | −2.34 | −7.26 | −4.54 | 16.56 | 1.87 | 18.74 | 56.23 |
| Minimum Humidity | −6.24 | −14.9 | 2.66 | 2.36 | 1.36 | 7.84 | 1.76 | −0.74 | −7.37 | −22.11 |
| 2003 | 2006 | 2009 | 2012 | 2015 | 2018 | 2020 | Annual Exchange Rate | Exchange Rate to 2030 | Exchange Rate to 2050 | |
| NDVI minimum value | 0.054 | −0.003 | −0.030 | 0.019 | 0.000 | 0.011 | −0.011 | −0.006 | −0.060 | −0.180 |
| NDVI maximum value | −0.008 | 0.003 | 0.001 | −0.005 | 0.006 | −0.003 | −0.008 | −0.001 | −0.010 | −0.030 |
| Region | Reference Year 2020 | Trend Year | ||||||
|---|---|---|---|---|---|---|---|---|
| 2030 | 2050 | |||||||
| km2 | % | km2 | % | % Exchange | km2 | % | % Exchange | |
| Arid | 238,290.25 | 47.74 | 240,164.63 | 48.12 | 0.38 | 24,1760.75 | 48.44 | 0.70 |
| Semiarid | 246,389.31 | 49.37 | 244,995.75 | 49.09 | −0.28 | 24,3867.44 | 48.86 | −0.51 |
| Subhumid–dry | 11,160.56 | 2.24 | 11,008.13 | 2.21 | −0.03 | 10,838.06 | 2.17 | −0.06 |
| Humid | 3254.81 | 0.65 | 2926.44 | 0.59 | −0.07 | 2628.69 | 0.53 | −0.13 |
| Year | Region | HAR (Surface km2) | ||
|---|---|---|---|---|
| I | II | III | ||
| 2020 | Arid | 111,729.19 | 117,571.06 | 8990.00 |
| Semiarid | 32,575.69 | 88,390.69 | 125,422.94 | |
| Subhumid–dry | 61.13 | 183.19 | 10,916.25 | |
| Humid | 0 | 19 | 3235.81 | |
| 2030 | Arid | 112,457.69 | 118,521.06 | 9185.88 |
| Semiarid | 31,852.94 | 87,449.00 | 125,693.81 | |
| Subhumid–dry | 55.38 | 175.31 | 10,777.44 | |
| Humid | 0 | 18.56 | 2907.88 | |
| 2050 | Arid | 113,107.50 | 119,298.44 | 9354.81 |
| Semiarid | 31,221.06 | 86,711.63 | 125,934.75 | |
| Subhumid–dry | 37.44 | 136.38 | 10,664.25 | |
| Humid | 0 | 17.5 | 2611.19 | |
| Transitions from Coverage to Arid Regions | |||||
|---|---|---|---|---|---|
| Type of Coverage | Region | Region | Gains by 2030 (km2) | Gains by 2050 (km2) | |
| Scrubland | Semiarid | → | Arid | 876.06 | 1627.00 |
| Forest | Subhumid–dry | → | Semiarid | 332.19 | 624.44 |
| Grassland | Semiarid | → | Arid | 298.56 | 537.81 |
| Forest | Subhumid | → | Subhumid–dry | 234.38 | 433.19 |
| Agriculture | Semiarid | → | Arid | 216.63 | 402.00 |
| Secondary vegetation | Semiarid | → | Arid | 151.06 | 280.81 |
Publisher’s Note: MDPI stays neutral with regard to jurisdictional claims in published maps and institutional affiliations. |
© 2022 by the authors. Licensee MDPI, Basel, Switzerland. This article is an open access article distributed under the terms and conditions of the Creative Commons Attribution (CC BY) license (https://creativecommons.org/licenses/by/4.0/).
Share and Cite
Perez-Aguilar, L.Y.; Plata-Rocha, W.; Monjardin-Armenta, S.A.; Franco-Ochoa, C. Aridity Analysis Using a Prospective Geospatial Simulation Model in This Mid-Century for the Northwest Region of Mexico. Sustainability 2022, 14, 15223. https://doi.org/10.3390/su142215223
Perez-Aguilar LY, Plata-Rocha W, Monjardin-Armenta SA, Franco-Ochoa C. Aridity Analysis Using a Prospective Geospatial Simulation Model in This Mid-Century for the Northwest Region of Mexico. Sustainability. 2022; 14(22):15223. https://doi.org/10.3390/su142215223
Chicago/Turabian StylePerez-Aguilar, Lidia Yadira, Wenseslao Plata-Rocha, Sergio Alberto Monjardin-Armenta, and Cuauhtémoc Franco-Ochoa. 2022. "Aridity Analysis Using a Prospective Geospatial Simulation Model in This Mid-Century for the Northwest Region of Mexico" Sustainability 14, no. 22: 15223. https://doi.org/10.3390/su142215223
APA StylePerez-Aguilar, L. Y., Plata-Rocha, W., Monjardin-Armenta, S. A., & Franco-Ochoa, C. (2022). Aridity Analysis Using a Prospective Geospatial Simulation Model in This Mid-Century for the Northwest Region of Mexico. Sustainability, 14(22), 15223. https://doi.org/10.3390/su142215223


