Abstract
Aridity is a condition in which there is a moisture deficit in the air and soil that affects large areas of the earth’s surface worldwide. It is a global problem caused mainly by factors related to climatic events and human actions. In the arid regions of Mexico, prolonged periods of drought are very common and water scarcity is the predominant feature. The main objective of this study is to develop a prospective geospatial simulation model for arid zones in the short and medium term (2030 and 2050) for the northwestern region of Mexico. A retrospective analysis of the variables that cause aridity was conducted based on historical data from satellite information obtained from various sources between 1985 and 2020, taking 2020 as the reference year; from this information the rate of change per year was obtained, followed by the simulated rates of change for the years 2030 and 2050. A methodology used to obtain arid zones using multicriteria evaluation techniques, weighted linear combination, and Geographic Information Systems. In order to generate the prospective model for arid zones, the variables were modeled to adjust the rate of change for each of them, with the same methodology subsequently applied to obtain the base year (2020), and aridity suitability maps were obtained for the years 2030 and 2050. The main results indicate that the prospective scenarios point to an increase in arid regions of 0.38% and 0.70%, respectively, which is equivalent to an area of approximately 240,164.63 km2 and 241,760.75 km2, respectively. This will cause a decrease in the subhumid–dry and humid regions of 0.10% and 0.19%, respectively, for the projected years. Statistical and geospatial aridity indicators were also generated at different levels, which helps to better understand the problem of aridity in vulnerable regions.
1. Introduction
Aridity can be defined as the scarcity of humidity and the temporary reduction of precipitation in an area [1,2,3,4,5]. Hydroclimatological and hydrogeological data are contemplated to understand changes in aridity [4]. Therefore, increased aridity represents a higher incidence of dry years in a region [6] and is closely related to prolonged periods of drought that affect environmental factors, agriculture, flora, fauna, population, and the economy [1]. Recent studies using high-resolution regional climate models for future projection of temperature data [7,8] suggest that rising temperatures will increase evapotranspiration rates, so climate change will increase aridity worldwide [9]. Likewise, [10] indicated that the maximum intensity and expansion of worldwide aridity have been observed in recent decades (1991–2019), with major hotspots of aridity located in the equator and subtropical zones of the world.
It is important to highlight the difference between drought and aridity. Drought is a recurrent extreme climatic event on earth whose its main characteristic is a decrease in rainfall over a period of months to years [11] and can occur in any region, not only in arid or semi-arid regions, causing water scarcity [12]. Another important factor in drought is increased evaporation and changes in land cover. The main consequences caused by drought are soil degradation, changes in ecosystems, reduction of agricultural production, and decrease in runoff from water catchments, and, in the long term, desertification [13].
On the other hand, aridity is a stable and permanent climatic condition in arid zones [11,12] that are prone to drought since the amount of rainfall depends significantly on a few rainfall events. The consequences caused by aridity are the reduction of the biological and economic productivity of terrestrial ecosystems, which represents a serious danger for ecological and hydrological processes. In addition, the human misuse of vulnerable ecosystems of arid and semi-arid lands can cause unsustainable land management [11]. Drought and aridity can be disastrous for ecosystems and society [14].
Consequently, aridity in the short and long term could increase by approximately 10% and 22%, respectively, so it is of utmost importance to implement sustainable management of water resources and a drought policy in these regions to ensure food security for the population [1]. Therefore, there is a need to quantify aridity and analyze changes and variations in temperature and precipitation that alter the hydrological cycle and soil humidity, which also generates climatic stress [9,15]. Given this problem, analysts consider it extremely important to develop measures to predict and counteract the effects of aridity in the most vulnerable regions, as well as to reduce the effects of climate change due to humidity loss and, therefore, increased drought, vegetation loss, and land degradation [1].
In this sense, the Intergovernmental Panel on Climate Change (IPCC) is the main international organization for the evaluation of climate change [16] and has, to date, produced three special reports and a methodological report on national inventories of greenhouse gases. Said reports include (I) Physical Bases (9 August 2021), which addresses the physical understanding of the climate system and climate change, thus bringing together the latest advances in climate science [17]; (II) Impacts, Adaptation, and Vulnerability (28 February 2022), in which the impacts of climate change are estimated and ecosystems, biodiversity, and human communities are analyzed at the global and regional levels, as well as the vulnerability and capacity to adapt to climate change [18]; and (III) Climate Change Mitigation (4 April 2022), which assesses the climate-change mitigation progress and examines the origin of global emissions. It shows the advances in the reduction and mitigation of greenhouse gas emissions [19]. In addition, a Synthesis Report, which is based on the content of the assessment reports of the three working groups, according to the IPCC “synthesise and integrate materials contained within the Assessment Reports and Special Reports” and “should be written in a non-technical style suitable for policymakers and address a broad range of policy-relevant but policy-neutral questions approved by the Panel” [20].
For its part, the United Nations Environment Program (UNEP) is the main environmental authority of the United Nations system. It helps strengthen environmental standards and practices and promotes care for the environment by informing and empowering nations to improve their quality of life. It works with six strategic areas, among which climate change stands out, and it helps strengthen the capacity of countries to integrate responses to climate change by providing leadership in adaptation, mitigation, technology, and financing [21].
Some simulations and prediction techniques based on quantitative models such as logistic regression, such is the case of [22], wherein useful results were obtained to prevent the loss and degradation of forests, since areas at risk of being deforested and degraded in the future were identified, and in [23], who used this technique to predict and issue flood alerts in real time. In addition, in [24], remote-sensing and machine-learning techniques were used to detect and map susceptibility and landslides.
Other types of studies include those on Markov chains; cellular automata, in which a basis is provided for a simulation as close as possible to the reality of changes in land use and simulation models of urban growth [25]; and spatial morphological pattern analysis [26], where scenarios are simulated to increase the potential of permanent preservation areas, considering a gradual increase in the preserved areas, presenting themselves as alternatives to ensure the maintenance of ecological and hydrological services.
Artificial neural networks have been employed, such as in [3], where an accurate prediction of the groundwater level was obtained to determine the quality parameters, and [27], who used four models, including neural networks and linear regression, to predict the concentration of dissolved oxygen, and better performance was observed in the results. Another method used is the Bruun rule to predict future erosion in coastal zones, which can lead to significant results analyzed in GIS [28]. GIS is also used to predict prospective scenarios as close as possible to reality by analyzing historical information or time series to understand the spatial and temporal relationships of the factors [3,25].
Other methods have been used to predict and forecast changes in certain factors over time [29,30]. Linear regression is a very useful technique to see the effect between two or more variables, such as in [31], where the Pearson regression analysis formula was used to analyze and interpret the effect between two or more variables applied to real life. However, the reliability and results of the regression-modeling process have not been considered [32]. That is why the use of time series of historical data is very useful for simulating and predicting changes in environmental issues [3,25,28].
In turn, one of the techniques widely used and recommended by the World Meteorological Organization is the Mann–Kendall trend method, which examines the variation trend in a time series of data over time and operates a considerable test range, without the data needing to follow a specific distribution [33,34,35]. Such is the case of [36], in which technique was used to analyze the trends of change and the points of mutation of drought and climatic conditions, and was used to identify the trend of the standardized precipitation index and humidity index of the series [33].
Consequently, and given that retrospective analysis of changes is not enough but that medium- and long-term analysis is also necessary [37,38,39], one option is the generation of spatial models, such as the simulation of future scenarios that will allow the changes in a geographic area to be understood [40]. However, these models should not be taken as a forecast or prediction but rather interpreted as information and coherent descriptions of a possible future state [41].
Prospective models enable an existing phenomenon to be repeated to generate future alternatives and analyze the potential consequences of each of them [42,43]. In this regard, several works and methodologies have been developed to perform geospatial simulations of future scenarios for studies of different purposes. Most of them simulate forest processes to understand the associated impacts and implement measures to mitigate these forest-loss processes [44]. Similarly, other studies have analyzed changes in precipitation and temperature to examine the effects of future droughts [3,25,28,33,34,35].
As a consequence of the abovementioned, one contribution to this study is the analysis of changes in the factors considered responsible for aridity, specifically based on the historical variations in the data. In this regard, and given the importance of having updated maps of arid zones in the short and long term, the main objective of this research is to generate prospective geospatial aridity models that include the multicriteria evaluation technique (MCE), weighted linear combination technique (WLC), and GIS for the northwestern region of Mexico that can be applied nationally and globally.
The reference year for this study was 2020, based on the methodology developed by [45], and was used to generate the map of arid regions. Subsequently, in order to obtain the prospective geospatial model for aridity in the short and long term (2030 and 2050), a retrospective analysis of historical data was performed to obtain the rates of change of the factors considered constant changes (precipitation, temperature, normalized difference vegetation index (NDVI), evapotranspiration, and humidity) for data integration using MCE and GIS techniques.
2. Materials and Methods
2.1. Study Area
The study area constituted three Hydrological Administrative Regions (HAR) located in northwestern Mexico: (I) Baja California, (II) Northwest, and (III) North Pacific (Figure 1), located at geographical coordinates 32°39′ and 21°22′ North latitude and 118°52′ and 103°20′ West longitude. It borders the Pacific Ocean to the west; Phoenix, Arizona to the north; Chihuahua and Durango to the east; and Nayarit to the south, representing approximately 26% of the Mexican territory [46].
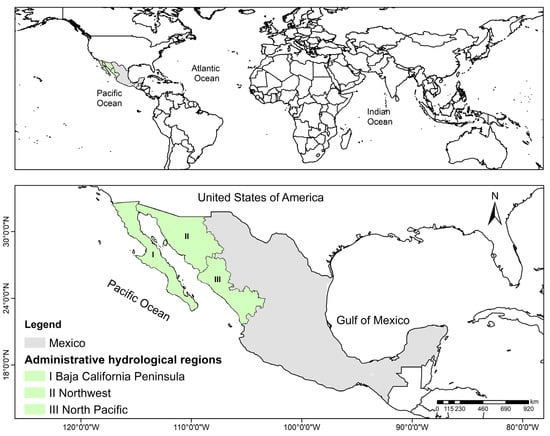
Figure 1.
Location of the study area. Northwest Mexico: HAR: (I) Baja California Peninsula, (II) Northwest, and (III) North Pacific.
2.2. Data
For this study, a map of arid regions was generated, taking 2020 as the reference year. The variables used and the methodology were based on the information used in the geospatial model of arid zones described in [33], which was conducted taking into consideration a review by experts and a bibliographic review (Table 1). The weights of the weighted factors used in this research are shown in Table 2, which were obtained using the analytical hierarchy technique to determine the level of importance of each factor.

Table 1.
Data used for prospective geospatial models of arid zones. Source [45]. URL: https://www.mdpi.com/2220-9964/10/11/720.

Table 2.
Matrix of factor weights. Source [45]. URL: https://www.mdpi.com/2220-9964/10/11/720.
Historical data were used to generate the prospective geospatial model for arid zones, such as minimum precipitation, maximum temperature, evapotranspiration, and humidity from 1985 to 2020 in periods of 5 years, and for NDVI data, according to the availability of information, from 2000 to 2020 in periods of 3 years (Table 3).

Table 3.
Data are used as a reference to generate the prospective scenario for arid zones.
To generate quantitative and geospatial indicators of aridity at different levels, it was necessary to use the maps of arid regions generated together with the maps of Hydrological Administrative Regions, state political division, municipal political division, and land use and vegetation (Table 4)

Table 4.
Data are used to generate quantitative and geospatial indicators.
2.3. Methodology
The methodology used for the prospective geospatial model of aridity for the years 2030 and 2050 began by obtaining maps of vulnerability to aridity for the reference year 2020, based on the methodology developed in [45]. Initially, the data involved in the aridity process were standardized. Then, a normalization of the variables was performed, and using the weighting of the factors (Table 2), the MCE was applied with the weighted linear combination (WLC) technique. This way, the aridity map was obtained, which was reclassified into the different arid regions based on the United Nations Environment Program (UNEP) Aridity Index (AI) classification. Subsequently, a retrospective analysis of historical data from 1985 to 2020 was performed (Table 3). The average annual rate and the average rate for the years 2030 and 2050 were calculated. Afterwards, the variables were processed, applying the corresponding rate of change, thus obtaining the new variables for each evaluation period. Similarly, the factors were normalized and the MCE was applied using the WLC. The resulting maps were classified according to the UNEP AI to obtain the prospective aridity maps for the years 2030 and 2050. Finally, indicators were negotiated at different levels, such as at the general, municipal, HAR, and land-use levels (Figure 2).
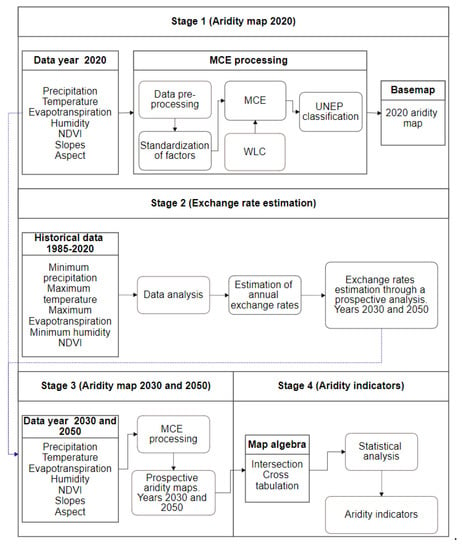
Figure 2.
Methodological scheme for the prospective geospatial model for arid zones. Stage 1, aridity map 2020. Stage 2, exchange rate estimation. Stage 3, aridity map 2030 and 2050. Stage 4, aridity indicators.
2.4. Geospatial Model of Drylands Based on Multicriteria Evaluation and GIS for the Year 2020
2.4.1. Data Download and Processing
In order to obtain the base map of aridity vulnerability for the year 2020, data were downloaded from the different download sources described in Figure 2. Following the methodology developed by [45], the variables were processed and standardized according to the technical specifications of the map of the study area, which is a bitmap of 0 and 1, where 0 represents areas excluded from the model and 1 represents the area where the information processing is included.
2.4.2. Standardization of the Criteria through the Fuzzy-Logic Method
Once the variables were processed, the standardization of the factors was performed using the fuzzy-logic method, which is used to standardize values [45,47,48,49,50]. This analysis applied this method to a scale of 0 to 1 bytes to indicate the susceptibility to aridity. Table 5 shows the function used. A decreasing linear function means lower scale values, indicating a greater possibility of aridity extremes. On the contrary, an increasing linear function means higher values, indicating a lower susceptibility to aridity. The variables standardized using the fuzzy logic method are shown in Figure 3.

Table 5.
Standardization of the factors by the fuzzy-logic method for the year 2020.
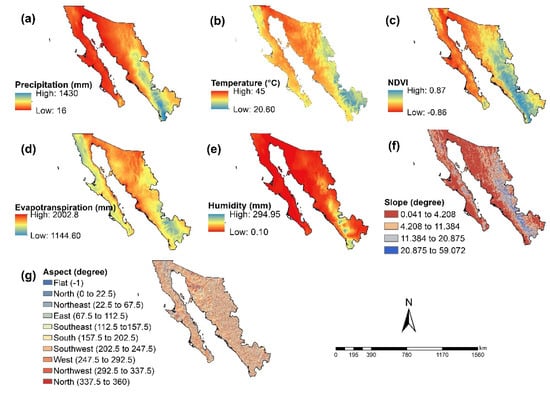
Figure 3.
Variables used for the arid-zones model for the year 2020. Legend: (a) precipitation, (b) temperature, (c) NDVI, (d) evapotranspiration, (e) humidity, (f) slopes, and (g) aspect.
2.4.3. Weighted Linear Combination
Weighted linear combination is the most common GIS-based multicriteria evaluation method for soil-suitability analysis, which consists of combining a set of criteria and constraint maps [50,51,52,53]. As a constraint, the binary map of the study area was used, where 0 indicates excluded areas and 1 corresponds to the area included in the aridity model. In this study, to identify the arid regions in 2020, the WLC method was used, which calculates the suitability of a potential region using Equation (1) [47,53,54]:
where R is the weighted variable, yi is the weight of the factor, is the weighted value of alternative i of factor j, and n represents the number of indexes.
2.4.4. Classification Method
The aridity vulnerability map of 2020 obtained as a result of the WLC method was classified using the AI classification proposed by UNEP [4,55,56,57,58,59], which defines arid regions in five classes, as shown in Table 6.

Table 6.
UNEP aridity index classification [4,60,61].
2.5. Prospective Geospatial Model of Arid Zones in the Years 2030 and 2050
2.5.1. Calculation of Change Rates per Period
There are several methods for predicting and forecasting changes in certain factors over time [29,30,62]. The use of time series of historical data has been very useful for simulating and predicting changes in environmental matters [3,25,28]. The Mann–Kendall (MK) trend method is widely used [36] to examine the trend of variation in a data series over time. It operates a very wide test range and the data do not need to follow a specific distribution [33,34,35].
The present study was based on the Mann–Kendall trend test, and the original formula was adapted to this study to analyze time series of historical data of the variables in periods of five years (minimum precipitation, maximum temperature, evapotranspiration, and humidity) and three years (NDVI) (Table 7). From that information, the average change per period was obtained and, subsequently, the rate of change per year. This way, the change factor for the years 2030 and 2050 was obtained. For the time series p1, ..., pn, Equation (2) was used:
where Ta is the average annual rate obtained, pi is period 1 and pj is period 2 of the time series, t is the number of years between periods, and n is the total number of periods of the historical data series analyzed.

Table 7.
Historical data used to calculate the rate of change for the years 1985–2020 and 2000–2020.
2.5.2. Standardization of Factors
Factor standardization refers to the process of determining the level of importance of each criterion. It is a widely used technique of pairwise comparison to rate and standardize values [47,48,49,50]. A fuzzy set was applied to the processed variables for the years 2030 and 2050 at a scale of 0 to 1 bytes to show the vulnerability to aridity. Table 8 shows the maximum and minimum values for each factor and, in addition, the function used.

Table 8.
Standardization of factors for the years 2030 and 2050.
2.5.3. Weighted Linear Combination and Criteria Ranking
Based on the normalized factors for the years 2030 and 2050, the WLC method was used to generate the prospective geospatial aridity model using the same methodology for the 2020 arid-zone model, which calculated the suitability of a region to present aridity levels using Equation (1). This way, aridity vulnerability maps were obtained for the projected years. Once the aridity maps were obtained, the UNEP AI classification was used to obtain the maps of arid regions for the years 2030 and 2050.
2.5.4. Quantitative and Geospatial Indicators
The cross-tabulation method was applied to generate the different quantitative and geospatial indicators of arid zones, called a confusion matrix, transition matrix, or contingency table [63]. This method generates a tabular matrix in proportion to the total number of pixels, which compares the relationship between two maps that have different categories [64] and which in turn shows the number of pixels that correspond to each combination of categories of the two images being compared [63]. Multilevel arid-region indicators (general, HAR, municipal, land use) were obtained. Each indicator was obtained with the combination of the arid-zone map for each date generated and the map representing that indicator (Table 4).
3. Results
3.1. Prospective Geospatial Model of Aridity
3.1.1. Annual Rates for the Variables Used
Based on the time-series analysis of the variables and periods used (1985–2020 and 2000–2020), annual rates were obtained (Table 9) that show the changes by period, the annual rate of change, and the trends of change towards the years 2030 and 2050; these data were used to generate the prospective maps. According to the results, it can be said that, in a prospective scenario, a decrease in precipitation of 0.34 mm per year was seen that meant that by the year 2050, there would be a decrease of 10.29 mm (Figure 4a). In contrast, the temperature was estimated to increase by 0.023 °C per year, projected to the year 2050, reflecting an increase of 0.69 °C (Figure 4b); similarly, evapotranspiration would increase by 56.23 mm (Figure 4c) and humidity would decrease by 22.11 mm (Figure 4d) by the year 2050 in the study region, whereas vegetation cover would be decreased according to the change values observed in the NDVI (Figure 4e).

Table 9.
Rates of change during the period from 1985 to 2020.
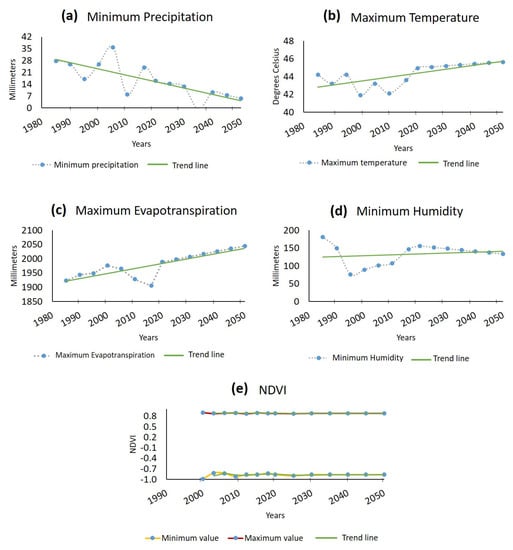
Figure 4.
Trend lines of the variables for the years 1985–2050. Legend: (a) minimum precipitation, (b) maximum temperature, (c) maximum evapotranspiration, (d) minimum humidity, (e) NDVI.
3.1.2. Variables Obtained for the Years 2030 and 2050
The results of processing and standardizing the data using 2020 as the reference year and applying the rate of change are shown in Table 8. The variables for the years 2030 and 2050 were obtained, and an example of the variables for the year 2030 is shown (Figure 5).
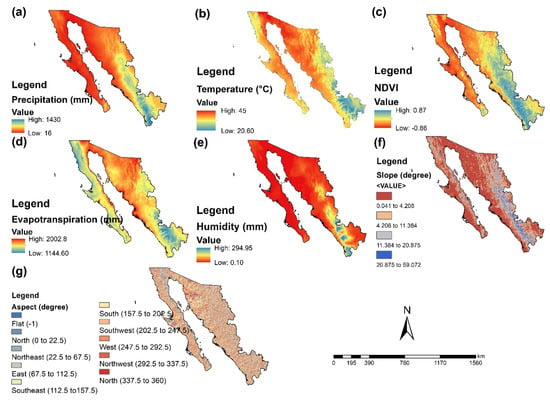
Figure 5.
Variables were obtained to use in the trend model. Year 2030. Legend: (a) precipitation, (b) temperature, (c) NDVI, (d) evapotranspiration, (e) humidity, (f) slopes, and (g) aspect.
3.1.3. Normalized Factors
Applying the fuzzy-logic method, the normalized factors were obtained for the years 2030 and 2050, and an example of the variables for the year 2030 is shown (Figure 6).
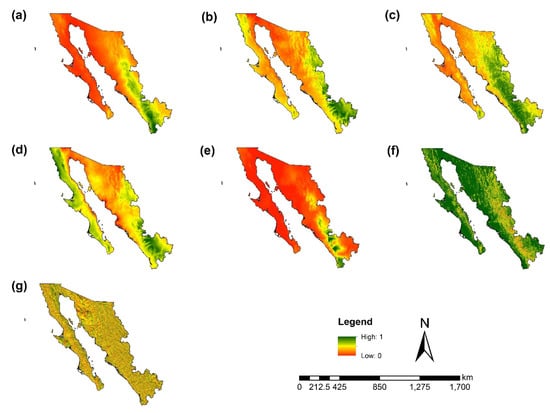
Figure 6.
Factors obtained as a result of standardization. Year 2030. Legend: (a) precipitation, (b) temperature, (c) NDVI, (d) evapotranspiration, (e) humidity, (f) slopes, and (g) aspect.
3.2. Quantitative and Geospatial Indicators of Aridity for the Year 2020 and Prospective Aridity for the Years 2030 and 2050
Based on the classification of the arid regions employed, an aridity vulnerability map was generated for the year 2020, which was used as the basis for obtaining the prospective aridity maps (Figure 7a). The indicators show that arid and semiarid regions predominated in the study region, with more than 90% of the surface area, whereas subhumid–dry and humid regions covered approximately 3% (Table 10).
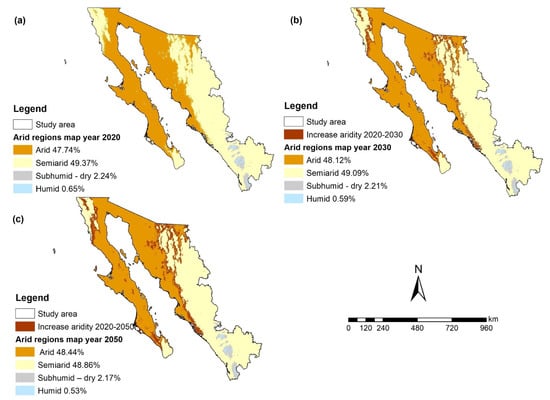
Figure 7.
Aridity vulnerability map obtained. Legend: (a) year 2020, (b) year 2030, and (c) year 2050.

Table 10.
Areas and percentages of change by a period concerning the reference year 2020.
For their part, the prospective maps show that by the year 2030, the arid regions would represent 48.12% of the study area, which means an increase of 0.38% for 2020, whereas the semiarid regions would show a loss of 0.28%; likewise, the subhumid–dry and humid regions would decrease by approximately 0.10% (Figure 7b).
The results obtained for the year 2050 show that the arid regions represented 48.44% of the surface of the study area, which means an increase of 0.7% for the year 2020; likewise, the semiarid regions continued without much change, at 0.51% loss of surface, whereas the subhumid–dry and humid regions continued their tendency to decrease at 0.19% (Figure 7c).
3.2.1. HAR-Level Indicators
The map of arid regions by HAR was also obtained, and it was observed that in 2020, in region I, arid regions predominated with 111,729.19 km2 (77.39% of the total area of the region), whereas semiarid regions covered 32,575.69 km2 (22.56%); likewise, dry subhumid regions represented less than 1% in this region, and there were no humid areas (Table 11). Similarly, in region II, the arid zones predominated with 117,571.06 km2 (57.03%), whereas the semiarid zones represented 88,390.69 km2 (42.58%); in this region, less than 1% of dry subhumid and humid zones were observed. For its part, region III represented a larger area of semiarid zones with 125,422.94 km2 (84.42%), whereas arid regions represented 8990.00 km2 (6%); in this region, there was a larger area of subhumid–dry and humid regions, with about 10% between both categories (Figure 8a and Table 11).

Table 11.
Areas and percentages of change by HAR for 2020, 2030, and 2050.
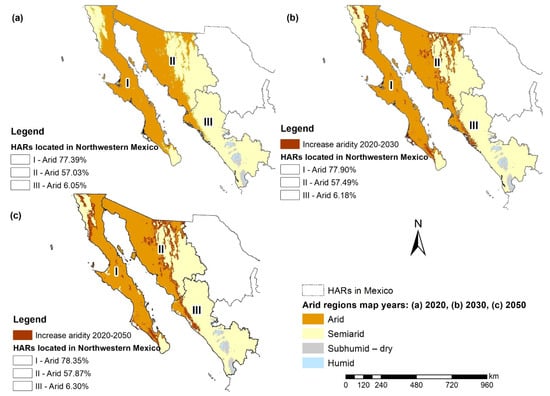
Figure 8.
Prospective aridity maps obtained by HAR. Legend: (a) year 2020, (b) year 2030, and (c) year 2050.
In Table 11, the prospective indicators obtained at the HAR level are also shown, which reflect that the arid zones would continue to increase in HAR-II Northwest for the years 2030 and 2050, with an area of 118,521 km2 and 119,298.44 km2, respectively, showing an increase of 0.7% for 2020 (Figure 8b,c). The semiarid regions were primarily reflected in HAR-III North Pacific, which showed an increasing trend for the year 2050 of 0.2% for 2020, with areas of 125,693.81 km2 for the year 2030 and 125,934.75 km2 for the year 2050. Nevertheless, the trend of semiarid and subhumid–dry areas in HAR-I and HAR-II showed a decrease, which can be understood as an increase in aridity in these regions.
The trends of humid and subhumid–dry regions were reflected in a greater surface area in HAR-III North Pacific, which was decreasing; this can be concluded to reflect an increase in the arid and semiarid regions of this zone.
3.2.2. Municipal-Level Indicators
The aridity indicators at the municipal level for 2020 (Figure 9a), 2030 (Figure 9b), and 2050 (Figure 9c) were determined, and the most arid and semiarid municipalities in the northwestern region of Mexico stood out. These indicators show that the municipalities with more than 90% of aridity were located in the states of Sonora (Atil, Oquitoa, Etchojoa, Altar, Caborca, Hermosillo, San Miguel de Horcasitas, Puerto Peñasco, Navojoa, San Luis Río Colorado, General Plutarco Elías Calles, Sáric, Empalme, San Ignacio, Río Muerto, Trincheras, Guaymas, Benito Juárez, Huatabampo, Cajeme, Benjamín Hill), Baja California (Mexicali), Baja California Sur (Mulegé, Comondú, Loreto), and Sinaloa (Ahome).
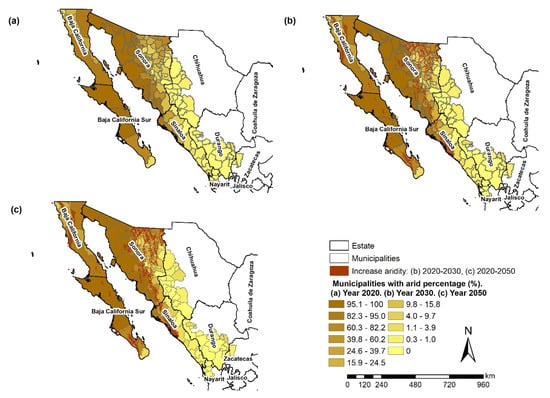
Figure 9.
Prospective aridity indicators at the municipal level. Municipalities with the highest percentage of arid zones: (a) year 2000, (b) year 2030, and (c) year 2050.
3.2.3. Land-Use Indicators
One way to validate the results of the models obtained is the generation of aridity indicators of land use for the years 2020, 2030, and 2050. In 2020, it was indicated that arid regions were mostly concentrated in scrubland (86%), wetlands (76%), and bare soil types (73%). On the other hand, the regions with the largest humid areas were found in forests (7.3%), secondary vegetation (3%), and jungles (2.3%).
By 2030, scrublands would increase in arid regions by 0.43% (876.06 km2), gaining coverage over semiarid regions, whereas forests would reflect a decrease over subhumid–dry regions to become semiarid, with an increase of 0.1% (332.19 km2); meanwhile, grassland coverage would lose area in semiarid regions to become arid regions with 0.77% (298.56 km2) (Table 12). Similarly, the regions with the greatest humid surface area would continue to be forests (2.13%), secondary vegetation (0.70%), and jungles (0.5%).

Table 12.
Areas (km2) of soil-cover transition over arid regions.
In terms of indicators for the year 2050, arid regions would continue to increase the coverage of scrubland, gaining surface area over semiarid regions by 0.8% (1,627 km2). Forests would gain 624.44 km2 in semiarid regions over subhumid-dry regions, and grasslands would increase by 537.81 km2 over arid regions (Table 12).
4. Discussion
At a global level, aridity indices have been obtained [56,65] that show the state of aridity worldwide on a large scale and with a very low temporal resolution, and in some cases, updates of these aridity indices are null but still serve to provide a general idea of the state of aridity on a global level.
In Mexico, the Drought Monitor inspects the areas with significant drought problems, which shows indicators of deficit or excess rainfall [66,67], and in turn, the Multivariate Drought Monitor also considers soil humidity and runoff [68].
Some studies in Mexico use different aridity indices (AI) to understand the magnitude of arid regions. In [69] and through the AI proposed by UNEP (The United Nations Environment Programme), the duration, severity, frequency, and affected area of meteorological droughts for which rainfall and evapotranspiration are used as parameters are analyzed. As in [61], this same AI defines Mexico’s arid and humid zones and quantifies the population.
Similarly, in [70], soil degradation in drylands was studied by applying the Thornthwaite AI, mainly based on potential evapotranspiration and water-vapor balance. On the other hand, in [71], the water deficit was quantified with temperature and precipitation data corresponding to the different climate-change scenarios by means of an AI by De Martonne; they calculated the Index of Hydroenvironmental Availability (IDHA) and the Hydroenvironmental Drought Index (ISHA) to determine its tendency.
In this regard, the National Arid Zones Commission, within the framework of the Sustainable Use of Natural Resources for Primary Production Programme, implements actions to conserve soil, water, and vegetation and, through the Arid Zone Development Component, promotes and generates projects that promote rural development in drylands with a comprehensive and territorial approach [72].
However, none of the studies mentioned conducted a retrospective analysis of the behavior of the variables or the arid zones themselves, nor did they study the future state of the regions; these are couple of advantages that this research presents, as well as complementing the constant updating of the temporal resolution of the data used (monthly) and the immediate availability and free access, in addition to considering seven factors of major importance, which were integrated to generate the model (Figure 2).
This study analyzed the variations over time of the factors involved in the aridity process, which indicates that precipitation and humidity would decrease, thus impacting subhumid–dry regions and humid areas, which will continue to lose surface area, favoring the increase of arid regions. This could be considered an early warning to pay more attention to these statistics since, if the trend towards humidity loss were to continue, drought situations could be accentuated, leading to major problems such as the degradation of regions with a direct impact on society and economy.
In addition, indicators of multilevel aridity were obtained, which allow us to understand in more detail the levels of aridity by region at the municipal level and land use; in the latter, it was possible to observe which land uses had and will have the greatest impact on arid zones in the scrub. Aquaculture and removal of vegetation are the land uses that predominate in the arid zones and, in addition, human settlements will continue to increase in these regions according to the aridity tendency.
Therefore, the results show that the present study contributes significantly to managing arid ecosystems and supporting decision-making, as it provides information on an approximation of the current and future state of arid and semiarid regions. One of the main contributions of this research is the generation of a prospective geospatial model that contemplates one of the processes of greatest importance within drylands, aridity, using new methodological aspects of the problem facing northwestern Mexico.
On the other hand, it is important to note that the simulation of the prospective model requires a significant effort, especially to analyze the criteria and their variations over time and to determine an approach to the future. In addition, the problem that can cause an increase in aridity in the territory can be discussed exhaustively, since the future scenarios that contemplate aspects of aridity, drought, and land degradation are under interrelated social and ecological systems and issues.
5. Conclusions
In Mexico, several aridity studies have been carried out using different indices to understand the current state of arid zones. However, no prospective models have been generated to determine this condition in the short and medium term; therefore, the prospective maps of the model proposed in this study provide important and useful information on the current and future state of the dry regions for northwestern Mexico and showed how arid and semi-arid zones will continue to predominate, with an increase in aridity and a decrease in humid regions.
In the same way, the temporal analysis and the data obtained from the prospective aridity model according to the time series of historical data analyzed showed an increase in temperature and evapotranspiration in the short and medium term, as well as a decrease in precipitation, humidity, and vegetation cover, representing an increasing trend of arid regions that are located within the Sonoran Desert, mostly in the northwest and center of the study area, in which dry and semi-dry climates predominate. For their part, the subhumid–dry and humid regions, located to the southeast of the region and mainly in the state of Chihuahua, face a decrease in surface area that indicates that the resulting geospatial model simulations are logical.
Therefore, we can confirm that the methods used helped generate valuable information to solve problems of management of arid regions. Likewise, the applied EMC techniques were fundamental for developing the prospective aridity model. The results obtained allowed the change rates of aridity factors to be estimated and, in turn, it was possible to generate maps of vulnerability to aridity towards the years 2030 and 2050.
Additionally, the land-use indicators allowed the results of the model to be quantitatively validated, which validates the theoretical hypothesis about the most significant changes in land uses located in arid and semiarid zones, such as scrubland, forest, grassland, agriculture, and secondary vegetation. In such a way, we can confirm that the model of arid zones as well as the prospective model of aridity for the years 2030 and 2050 is adequate to analyze the current and future states of these regions.
Finally, the methodology used in this analysis is presented as an initiative to generate, integrate, and model geospatial variables that favor the aridity process that is directly related to climate change at the local, regional, and global levels. This can also be considered an alternative for the continuous study of arid regions in the future and can be extrapolated at a global level and, with this, obtain indicators that serve as a basis for developing public policies, in addition to being of great support for making important decisions in the management, mitigation, planning, and adaptation to arid ecosystems that guarantee human, environmental, economic, and social well-being in said regions from a sustainable point of view.
6. Future Research Directions
The methodology to obtain arid zones was proposed by Perez-Aguilar et. al (2021) [45] and was successfully complemented with the prospective aridity model for arid regions of northwestern Mexico proposed here. Given that this model can be adapted to any geographic area and that the data are available globally, it is intended to replicate this analysis throughout Mexico and thus acquire a scope at the national level of the severity and magnitude of the current aridity in the short and medium term, with another scope to be able to do so in the long term. In addition, it is proposed to complement this methodology with other climatic and aridity indices in order to obtain a more robust model that allows us to understand in more detail the future of arid regions in Mexico. Another future objective is to bring these results to different national organizations in charge of conserving and promoting development in the arid zones of the country in order to establish action, adaptation, and mitigation policies for the population in arid regions.
Author Contributions
Conceptualization, L.Y.P.-A., W.P.-R. and S.A.M.-A.; formal analysis, L.Y.P.-A., W.P.-R. and C.F.-O.; investigation, L.Y.P.-A. and S.A.M.-A.; methodology, L.Y.P.-A., W.P.-R., S.A.M.-A. and C.F.-O.; writing—original draft, L.Y.P.-A., W.P.-R. and S.A.M.-A.; writing— review and editing, L.Y.P.-A., W.P.-R., S.A.M.-A. and C.F.-O. All authors have read and agreed to the published version of the manuscript.
Funding
This research received no external funding.
Institutional Review Board Statement
Not applicable.
Informed Consent Statement
Not applicable.
Acknowledgments
The authors thank the Faculty of Earth and Space Sciences, the Autonomous University of Sinaloa, and CONACYT.
Conflicts of Interest
The author declares no conflict of interest.
References
- Abrha, H.; Hagos, H. Future Drought and Aridity Monitoring Using Multi-Model Approach under Climate Change in Hintalo Wejerat District, Ethiopia. Sustain. Water Resour. Manag. 2019, 5, 1963–1972. [Google Scholar] [CrossRef]
- Asadi Zarch, M.A.; Sivakumar, B.; Sharma, A. Droughts in a Warming Climate: A Global Assessment of Standardized Precipitation Index (SPI) and Reconnaissance Drought Index (RDI). J. Hydrol. 2015, 526, 183–195. [Google Scholar] [CrossRef]
- Dadhich, A.P.; Goyal, R.; Dadhich, P.N. Assessment and Prediction of Groundwater Using Geospatial and ANN Modeling. Water Resour. Manag. 2021, 35, 2879–2893. [Google Scholar] [CrossRef]
- Greve, P.; Roderick, M.L.; Ukkola, A.M.; Wada, Y. The Aridity Index under Global Warming. Environ. Res. Lett. 2019, 14, 124006. [Google Scholar] [CrossRef]
- Maliva, R.; Missimer, T. Aridity and Drought. In Arid Lands Water Evaluation and Management; Maliva, R., Missimer, T., Eds.; Environmental Science and Engineering; Springer: Berlin/Heidelberg, Germany, 2012; pp. 21–39. ISBN 978-3-642-29104-3. [Google Scholar]
- Gebremedhin, M.A.; Kahsay, G.H.; Fanta, H.G. Assessment of Spatial Distribution of Aridity Indices in Raya Valley, Northern Ethiopia. Appl. Water Sci. 2018, 8, 217. [Google Scholar] [CrossRef]
- Stefanidis, S. Ability of Different Spatial Resolution Regional Climate Model to Simulate Air Temperature in a Forest Ecosystem of Central Greece. J. Environ. Prot. Ecol. 2021, 22, 1488–1495. [Google Scholar]
- Carvalho, D.; Cardoso Pereira, S.; Rocha, A. Future Surface Temperature Changes for the Iberian Peninsula According to EURO-CORDEX Climate Projections. Clim. Dyn. 2021, 56, 123–138. [Google Scholar] [CrossRef]
- Girvetz, E.H.; Zganjar, C. Dissecting Indices of Aridity for Assessing the Impacts of Global Climate Change. Clim. Change 2014, 126, 469–483. [Google Scholar] [CrossRef]
- Ullah, S.; You, Q.; Sachindra, D.A.; Nowosad, M.; Ullah, W.; Bhatti, A.S.; Jin, Z.; Ali, A. Spatiotemporal Changes in Global Aridity in Terms of Multiple Aridity Indices: An Assessment Based on the CRU Data. Atmos. Res. 2022, 268, 105998. [Google Scholar] [CrossRef]
- Dai, A. Drought under Global Warming: A Review. WIREs Clim. Change 2011, 2, 45–65. [Google Scholar] [CrossRef]
- Wallén, C.C. Aridity Definitions and Their Applicability. Geogr. Ann. Ser. A Phys. Geogr. 1967, 49, 367–384. [Google Scholar] [CrossRef]
- Marengo, J.A.; Bernasconi, M. Regional Differences in Aridity/Drought Conditions over Northeast Brazil: Present State and Future Projections. Clim. Change 2015, 129, 103–115. [Google Scholar] [CrossRef]
- Zhou, S.; Williams, A.P.; Berg, A.M.; Cook, B.I.; Zhang, Y.; Hagemann, S.; Lorenz, R.; Seneviratne, S.I.; Gentine, P. Land–Atmosphere Feedbacks Exacerbate Concurrent Soil Drought and Atmospheric Aridity. Proc. Natl. Acad. Sci. USA 2019, 116, 18848–18853. [Google Scholar] [CrossRef]
- Panday, P.K.; Coe, M.T.; Macedo, M.N.; Lefebvre, P.; Castanho, A.D. de A. Deforestation Offsets Water Balance Changes Due to Climate Variability in the Xingu River in Eastern Amazonia. J. Hydrol. 2015, 523, 822–829. [Google Scholar] [CrossRef]
- IPCC Intergovernmental Panel on Climate Change. Available online: https://www.dcceew.gov.au/climate-change/international-commitments/intergovernmental-panel (accessed on 5 November 2022).
- Masson-Delmotte, V.; Zhai, P.; Pirani, A.; Connors, S.L.; Péan, C.; Berger, S.; Caud, N.; Chen, Y.; Goldfarb, L.; Gomis, M.I.; et al. Climate Change 2021: The Physical Science Basis. Contribution of Working Group I to the Sixth Assessment Report of the Intergovernmental Panel on Climate Change; Cambridge University Press: Cambridge, UK; New York, NY, USA, 2021. Available online: https://pubs.giss.nasa.gov/abs/ar03200x.html (accessed on 5 November 2022).
- Pörtner, H.-O.; Roberts, D.C.; Tignor, M.M.B.; Poloczanska, E.S.; Mintenbeck, K.; Alegría, A.; Craig, M.; Langsdorf, S.; Löschke, S.; Möller, V.; et al. Climate Change 2022: Impacts, Adaptation and Vulnerability. Contribution of Working Group II to the Sixth Assessment Report of the Intergovernmental Panel on Climate Change. 2022. Available online: https://www.ipcc.ch/report/sixth-assessment-report-working-group-ii/ (accessed on 5 November 2022).
- Climate Change 2022: Mitigation of Climate Change. Available online: https://www.ipcc.ch/report/ar6/wg3/ (accessed on 5 November 2022).
- AR6 Synthesis Report: Climate Change 2022—IPCC. Available online: https://www.ipcc.ch/report/sixth-assessment-report-cycle/ (accessed on 5 November 2022).
- Sundholm, M. UNEP: United Nations Environment Programme. Office of the Secretary-General’s Envoy on Youth. 2013. Available online: https://www.un.org/youthenvoy/2013/08/unep-united-nations-environment-programme/ (accessed on 5 November 2022).
- Peña, L.C.B.; Córdova, M.O.G.; Cejudo, L.C.A.; Olave, M.E.T.; Murrieta, R.L.M.; Aguilar, V.M.S.; Villalobos, H.L.R.; Gómez, V.M.R.; Campos, M.I.U.; León, M.O.G. Degradación y deforestación en la cuenca del río Conchos (México): Modelado predictivo mediante regresión logística (1985–2016). Cuad. Geográficos 2022, 61, 129–149. [Google Scholar] [CrossRef]
- Lee, J.; Kim, B. Scenario-Based Real-Time Flood Prediction with Logistic Regression. Water 2021, 13, 1191. [Google Scholar] [CrossRef]
- Nhu, V.-H.; Mohammadi, A.; Shahabi, H.; Ahmad, B.B.; Al-Ansari, N.; Shirzadi, A.; Geertsema, M.; Kress, V.R.; Karimzadeh, S.; Valizadeh Kamran, K.; et al. Landslide Detection and Susceptibility Modeling on Cameron Highlands (Malaysia): A Comparison between Random Forest, Logistic Regression and Logistic Model Tree Algorithms. Forests 2020, 11, 830. [Google Scholar] [CrossRef]
- Aburas, M.M.; Ho, Y.M.; Ramli, M.F.; Ash’aari, Z.H. The Simulation and Prediction of Spatio-Temporal Urban Growth Trends Using Cellular Automata Models: A Review. Int. J. Appl. Earth Obs. Geoinf. 2016, 52, 380–389. [Google Scholar] [CrossRef]
- Nunes de Oliveira, S.; Abílio de Carvalho Júnior, O.; Trancoso Gomes, R.A.; Fontes Guimarães, R.; McManus, C.M. Deforestation Analysis in Protected Areas and Scenario Simulation for Structural Corridors in the Agricultural Frontier of Western Bahia, Brazil. Land Use Policy 2017, 61, 40–52. [Google Scholar] [CrossRef]
- Csábrági, A.; Molnár, S.; Tanos, P.; Kovács, J. Application of Artificial Neural Networks to the Forecasting of Dissolved Oxygen Content in the Hungarian Section of the River Danube. Ecol. Eng. 2017, 100, 63–72. [Google Scholar] [CrossRef]
- Bagheri, M.; Zaiton Ibrahim, Z.; Bin Mansor, S.; Abd Manaf, L.; Badarulzaman, N.; Vaghefi, N. Shoreline Change Analysis and Erosion Prediction Using Historical Data of Kuala Terengganu, Malaysia. Env. Earth Sci. 2019, 78, 477. [Google Scholar] [CrossRef]
- Maulud, D.H.; Mohsin Abdulazeez, A. A Review on Linear Regression Comprehensive in Machine Learning. J. Appl. Sci. Technol. Trends 2020, 1, 140–147. [Google Scholar] [CrossRef]
- James, G.; Witten, D.; Hastie, T.; Tibshirani, R. Linear Regression. In An Introduction to Statistical Learning; Springer Texts in Statistics: Liverpool, UK, 2021; pp. 59–128. [Google Scholar] [CrossRef]
- Maryati, I.; Sumartini, T.S.; Sofyan, D. Experiences of Pearson Formula in Analysis Regression. IOP Conf. Ser. Mater. Sci. Eng. 2021, 1098, 032088. [Google Scholar] [CrossRef]
- Etemadi, S.; Khashei, M. Etemadi Multiple Linear Regression. Measurement 2021, 186, 110080. [Google Scholar] [CrossRef]
- Lin, H.; Wang, J.; Li, F.; Xie, Y.; Jiang, C.; Sun, L. Drought Trends and the Extreme Drought Frequency and Characteristics under Climate Change Based on SPI and HI in the Upper and Middle Reaches of the Huai River Basin, China. Water 2020, 12, 1100. [Google Scholar] [CrossRef]
- Wang, W.; Chen, X.; Shi, P.; van Gelder, P.H.A.J.M. Detecting Changes in Extreme Precipitation and Extreme Streamflow in the Dongjiang River Basin in Southern China. Hydrol. Earth Syst. Sci. 2008, 12, 207–221. [Google Scholar] [CrossRef]
- Jiang, G.; Gu, X.; Zhao, D.; Xu, J.; Yang, C.; Wang, S.; Li, Y.; Li, B.-L. The Study of Drought in Future Climate Scenarios in the Huang-Huai-Hai Region. Water 2021, 13, 3474. [Google Scholar] [CrossRef]
- An, Q.; He, H.; Nie, Q.; Cui, Y.; Gao, J.; Wei, C.; Xie, X.; You, J. Spatial and Temporal Variations of Drought in Inner Mongolia, China. Water 2020, 12, 1715. [Google Scholar] [CrossRef]
- Henríquez, C.; Azócar, G.; Aguayo, M. Cambio de Uso Del Suelo y Escorrentía Superficial: Aplicación de Un Modelo de Simulación Espacial En Los Ángeles, VIII Región Del Biobío, Chile. Rev. Geogr. Norte Gd. 2006, 61–74. [Google Scholar] [CrossRef]
- Henríquez, C.; Azócar, G.; Romero, H. Monitoring and Modeling the Urban Growth of Two Mid-Sized Chilean Cities. Habitat Int. 2006, 30, 945–964. [Google Scholar] [CrossRef]
- Jat, M.K.; Garg, P.K.; Khare, D. Monitoring and Modelling of Urban Sprawl Using Remote Sensing and GIS Techniques. Int. J. Appl. Earth Obs. Geoinf. 2008, 10, 26–43. [Google Scholar] [CrossRef]
- Singh, S.; Reddy, C.S.; Pasha, S.V.; Dutta, K.; Saranya, K.R.L.; Satish, K.V. Modeling the Spatial Dynamics of Deforestation and Fragmentation Using Multi-Layer Perceptron Neural Network and Landscape Fragmentation Tool. Ecol. Eng. 2017, 99, 543–551. [Google Scholar] [CrossRef]
- Patel, M.; Kok, K.; Rothman, D.S. Participatory Scenario Construction in Land Use Analysis: An Insight into the Experiences Created by Stakeholder Involvement in the Northern Mediterranean. Land Use Policy 2007, 24, 546–561. [Google Scholar] [CrossRef]
- Overmars, K.P.; Verburg, P.H. Multilevel Modelling of Land Use from Field to Village Level in the Philippines. Agric. Syst. 2006, 89, 435–456. [Google Scholar] [CrossRef]
- Verburg, P.H.; Overmars, K.P.; Huigen, M.G.A.; de Groot, W.T.; Veldkamp, A. Analysis of the Effects of Land Use Change on Protected Areas in the Philippines. Appl. Geogr. 2006, 26, 153–173. [Google Scholar] [CrossRef]
- Thapa, R.B.; Shimada, M.; Watanabe, M.; Motohka, T.; Shiraishi, T. L-Band SAR Data and Spatially Explicit Model to Analyse Forest Loss between 2007 and 2030 in Central Sumatra. In Proceedings of the 2013 Asia-Pacific Conference on Synthetic Aperture Radar (APSAR), Tsukuba, Japan, 23–27 September 2013; pp. 108–111. [Google Scholar]
- Perez-Aguilar, L.Y.; Plata-Rocha, W.; Monjardin-Armenta, S.A.; Franco-Ochoa, C.; Zambrano-Medina, Y.G. The Identification and Classification of Arid Zones through Multicriteria Evaluation and Geographic Information Systems—Case Study: Arid Regions of Northwest Mexico. ISPRS Int. J. Geo-Inf. 2021, 10, 720. [Google Scholar] [CrossRef]
- INEGI Instituto Nacional de Estadística y Geografía. INEGI. Available online: https://www.inegi.org.mx/ (accessed on 4 February 2021).
- Monjardin-Armenta, S.A.; Plata-Rocha, W.; Pacheco-Angulo, C.E.; Franco-Ochoa, C.; Rangel-Peraza, J.G. Geospatial Simulation Model of Deforestation and Reforestation Using Multicriteria Evaluation. Sustainability 2020, 12, 10387. [Google Scholar] [CrossRef]
- Zabihi, H.; Alizadeh, M.; Langat, P.K.; Karami, M.; Shahabi, H.; Ahmad, A.; Said, M.N.; Lee, S. GIS Multi-Criteria Analysis by Orderedweighted Averaging (OWA): Toward an Integrated Citrus Management Strategy. Sustainability 2019, 11, 1009. [Google Scholar] [CrossRef]
- Azareh, A.; Rafiei Sardooi, E.; Choubin, B.; Barkhori, S.; Shahdadi, A.; Adamowski, J.; Shamshirband, S. Incorporating Multi-Criteria Decision-Making and Fuzzy-Value Functions for Flood Susceptibility Assessment. Geocarto Int. 2021, 36, 2345–2365. [Google Scholar] [CrossRef]
- Feizizadeh, B.; Blaschke, T. GIS-Multicriteria Decision Analysis for Landslide Susceptibility Mapping: Comparing Three Methods for the Urmia Lake Basin, Iran. Nat. Hazards 2013, 65, 2105–2128. [Google Scholar] [CrossRef]
- Ajaj, Q.M.; Pradhan, B.; Noori, A.M.; Jebur, M.N. Spatial Monitoring of Desertification Extent in Western Iraq Using Landsat Images and GIS. Land Degrad. Dev. 2017, 28, 2418–2431. [Google Scholar] [CrossRef]
- Akbari, M.; Neamatollahi, E.; Neamatollahi, P. Evaluating Land Suitability for Spatial Planning in Arid Regions of Eastern Iran Using Fuzzy Logic and Multi-Criteria Analysis. Ecol. Indic. 2019, 98, 587–598. [Google Scholar] [CrossRef]
- Zoghi, M.; Houshang Ehsani, A.; Sadat, M.; javad Amiri, M.; Karimi, S. Optimization Solar Site Selection by Fuzzy Logic Model and Weighted Linear Combination Method in Arid and Semi-Arid Region: A Case Study Isfahan-IRAN. Renew. Sustain. Energy Rev. 2017, 68, 986–996. [Google Scholar] [CrossRef]
- Aydi, A. Evaluation of Groundwater Vulnerability to Pollution Using a GIS-Based Multi-Criteria Decision Analysis. Groundw. Sustain. Dev. 2018, 7, 204–211. [Google Scholar] [CrossRef]
- Barrow, C.J. World Atlas of Desertification (United Nations Environment Programme), Edited by N. Middleton and D. S. G. Thomas. Edward Arnold, London, 1992. Isbn 0 340 55512 2, £89.50 (Hardback), Ix + 69 pp. Land Degrad. Dev. 1992, 3, 249. [Google Scholar] [CrossRef]
- Cherlet, M.; Hutchinson, C.; Reynolds, J.; Hill, J.; Sommer, S.; von Maltitz, G. World Atlas of Desertification, 3rd ed.; Office of the European Union: Luxembourg, 2018; ISBN 978-92-79-75350-3. [Google Scholar]
- Torres, L.; Abraham, E.M.; Rubio, C.; Barbero-Sierra, C.; Ruiz-Pérez, M. Desertification Research in Argentina. Land Degrad. Dev. 2015, 26, 433–440. [Google Scholar] [CrossRef]
- Stephen, J. Aridity Indexes. In Encyclopedia of World Climatology; Oliver, J.E., Ed.; Springer: Dordrecht, The Netherlands, 2005; pp. 89–94. ISBN 978-1-4020-3266-0. [Google Scholar] [CrossRef]
- Lin, L.; Gettelman, A.; Fu, Q.; Xu, Y. Simulated Differences in 21st Century Aridity Due to Different Scenarios of Greenhouse Gases and Aerosols. Clim. Change 2018, 146, 407–422. [Google Scholar] [CrossRef]
- Verbist, K.; Santibañez, F.; Gabriels, D.; Soto, G. Atlas of Arid and Semi Arid Zones of Latin America and the Caribbean. Available online: https://unesdoc.unesco.org/ark:/48223/pf0000228135 (accessed on 27 July 2022).
- Díaz-Padilla, G.; Sánchez-Cohen, I.; Guajardo-Panes, R.A.; Del Ángel-Pérez, A.L.; Ruíz-Corral, A.; Medina-García, G.; Ibarra-Castillo, D. Mapeo del índice de aridez y su distribución poblacional en México. Rev. Chapingo Ser. Cienc. For. Y Del Ambiente 2011, 17, 267–275. [Google Scholar] [CrossRef]
- Bachand, C.L.; Walsh, J.E. Extreme Precipitation Events in Alaska: Historical Trends and Projected Changes. Atmosphere 2022, 13, 388. [Google Scholar] [CrossRef]
- Pontius, R.G.; Cheuk, M.L. A Generalized Cross-tabulation Matrix to Compare Soft-classified Maps at Multiple Resolutions. Int. J. Geogr. Inf. Sci. 2006, 20, 1–30. [Google Scholar] [CrossRef]
- Gll Pontlus, R., Jr. Quantification Error versus Location Error in Comparison of Categorical Maps. Photogramm. Eng. Remote Sens. 2000, 66. Available online: https://www.asprs.org/wp-content/uploads/pers/2000journal/august/2000_aug_1011-1016.pdf (accessed on 9 July 2021).
- Trabucco, A.; Zomer, R.J. Global Geospatial Potential EvapoTranspiration & Aridity Index Methodology and Dataset Description. CGIAR-CSI 2009. Available online: https://cgiarcsi.community/2019/01/24/global-aridity-index-and-potential-evapotranspiration-climate-database-v2/ (accessed on 9 July 2021).
- CONAGUA Monitor de Sequía en México. Available online: https://smn.conagua.gob.mx/es/climatologia/monitor-de-sequia/monitor-de-sequia-en-mexico (accessed on 9 July 2021).
- Lobato-Sánchez, R. El monitor de la sequía en México. Tecnol. Y Cienc. Del Agua 2016, 7, 197–211. [Google Scholar]
- CONAGUA; UNAM Monitor de Sequía Multivariado En México (MoSeMM). Available online: http://www.ii.unam.mx/es-mx/Investigacion/Proyecto/Paginas/Monitordesequia.aspx (accessed on 3 July 2022).
- Campos-Aranda, D.F. Estudio de sequías meteorológicas anuales por medio del índice de aridez, en el estado de Zacatecas, México. Ing. Investig. Y Tecnol. 2016, 17, 405–417. [Google Scholar] [CrossRef][Green Version]
- SEMARNAT El Medio Ambiente En México 2013–2014. Available online: https://apps1.semarnat.gob.mx:8443/dgeia/informe_resumen14/03_suelos/3_3.html (accessed on 10 June 2019).
- Troyo Diéguez, E.; Mercado Mancera, G.; Cruz Falcón, A.; Nieto Garibay, A.; Valdez Cepeda, R.D.; García Hernández, J.L.; Murillo Amador, B. Análisis de la sequía y desertificación mediante índices de aridez y estimación de la brecha hídrica en Baja California Sur, noroeste de México. Investig. Geográficas 2014, 85, 66–81. [Google Scholar] [CrossRef][Green Version]
- CONAZA Comisión Nacional de Zonas Áridas. Available online: https://www.gob.mx/conaza (accessed on 23 June 2022).
Publisher’s Note: MDPI stays neutral with regard to jurisdictional claims in published maps and institutional affiliations. |
© 2022 by the authors. Licensee MDPI, Basel, Switzerland. This article is an open access article distributed under the terms and conditions of the Creative Commons Attribution (CC BY) license (https://creativecommons.org/licenses/by/4.0/).