Abstract
Reckless urbanization in developing regions is leading to the deterioration of the urban environment. The ensuing impacts can place a burden on urban ecology, urban infrastructure, and residents. This scenario requires a combination of avoidance measures and a detailed assessment of the ecological sustainability of the city. While monetary assessments are certainly conceivable, in this study, the contributions of urban environmental infrastructure are weighed financially. Semi-planned (Jhang) and planned (Faisalabad) urban settlements provided the context for this survey. The study uses the Benefit Transfer Method (BTM) to assess changes in the monetary value of urban ecosystem services (UES) from remote sensing data. This finding suggests that urbanization in Pakistan is devouring productive ecological land in urban areas. The assessment shows that between 1989 and 2019, the agricultural area in Faisalabad shrank (−17.38%), and the built-up area increased (16.05%). Likewise, in Jhang City, the built-up area (4.44%) and wasteland (3.10%) swelled. However, during this period (1989–2019), the proportion of agricultural land in Jhang City decreased (−8.93%). As a result, prime areas of UES are falling back into low-return areas. It also found that provisioning ecosystem services (PES) accounted for a significant portion (68.12%) of the UES produced in Faisalabad and Jhang (69.72%), respectively. In contrast, Cultural Ecosystem Services (CES) contributed the smallest share of UES in Faisalabad (1.63%) and Jhang (1.65%). However, the remaining two services, regulatory and support services, made significant contributions. The assessment shows the role of incoherence, inconsistency, resource constraints, and neglect in compromising the urban environmental integrity of these cities. This situation requires a comprehensive assessment and coordinated effort. For this, it is feasible and useful to combine socioeconomic information with land cover data through computerized equipment.
1. Introduction
Ecosystem services (ES) are the rewards of blue-green infrastructure on Earth [1,2]. The endowments of these ecosystems have symbiotic effects on biotic and abiotic environments [3,4]. Interests often determine socioeconomic norms, human-environment interactions, and environmental well-being [2,5,6]. As a result, recovery strategies and measures for these natural dividends are constantly evolving. To this end, Costanza et al. [4] and the Millennium Ecosystem Assessment [7] initiated academic discussions on cataloging ES [8]. These services are essentially grouped into marketable, regulatory, aesthetic, and support categories.
However, human intervention in the natural environment can affect the supply and demand for ES [6]. Demographic pressure, technological acquisition, and the urge for socioeconomic progress disadvantageously promote encroachment on nature. The associated industrialization, infrastructure development, and resulting urbanization have exacerbated environmental ecological resources [9,10]. The resulting traces are visible in the form of large-scale land use/land cover (LULC) conversions. These changes upset the balance between the regulations and requirements of ES [6]. However, these impressions are not the same in size and scope. These imprints are more vivid and visible in urban landscapes than in rural settings. Furthermore, these effects are implicitly influenced by the size of urban settlements and the orientation of ecological resources.
Therefore, the assessment of natural, social, and economic capital is essential to ensure the ecological integrity of cities [11]. However, the dynamics of urban growth and densification in developing and developed regions are inherently different [9,12]. Therefore, urbanization does not have a similar impact on urban areas around the world [12,13]. Thus, the ongoing ‘urban century’ requires context-based diagnostics. Holistic assessments based on empirical evidence can help turn reckless urbanization into opportunity. Research dynamics will enable policymakers to weigh options for urban resilience. To this end, LULC-based assessments meaningfully account for the resilience of urban ecosystem services (UES). Ratings are also used to quantify the supply and demand budget of UES in monetary and/or non-monetary terms [14,15]. In the current era of market economies, however, monetary estimates are increasingly credible. The information embodied in financial and monetary terms is easy to conceive and implement. Therefore, monetary insights promote urban environmental resilience more effectively [16,17,18]. As a result, financial aspects of assessment have become increasingly important in urban environmental research.
However, trends in developing countries face particular challenges. The availability, accessibility, and reliability of information expressed in monetary form is questionable and therefore raises legitimate concerns [19]. Consequently, currency valuations are bypassed in poorly documented economies [8,20]. In contrast, the challenge and response paradigm assumes that adversity must open up new avenues for improvement [21,22]. Therefore, the current study assesses the monetary impact of urbanization on UES in planned (Faisalabad) and semi-planned (Jhang) cities. These urban centers co-exist in similar geographic contexts. Faisalabad is planned as a trade center [23]. In contrast, Jhang is a semi-planned, agriculture-based urban settlement [24]. However, subsequent urbanization had different impacts on its urban ecological infrastructure. Furthermore, the pace and direction of urbanization in these cities are not similar [9]. Nonetheless, these effects are exacerbating environmental degradation in these cities. The consequences are more severe for disadvantaged groups than for resource-rich residents. The emerging scenarios call for a comprehensive approach to the urban ecological integrity of these cities.
The review shows that the evaluation of UES is a challenge from an economic and financial point of view [6]. Therefore, this study attempts a strategy related to the benefit transfer mechanism (BTM). Therefore, BTM and remote sensing-based assessments were synchronized for estimating the monetary value of UES. Thus, the study is a novel trial to evaluate UES using economic parameters from a different socioeconomic context. This novice experimentation from the study area yielded cost and time-effective insights. The improvisations provided a robust mechanism for evaluating UES in financial terms. Therefore, given the scarcity of data, this study offers a practical option. Hence, the findings of this study will incentivize monetary scrutiny of UES in less/undocumented economies. In addition, feedback from developing countries is needed to ensure the resilience of the environment and ecological resources.
The study inherently assesses the impact of urbanization on the environmental sustainability of cities. To achieve this, we developed an integrated spatial approach with the following specific objectives: (1) test the robustness of BTM as a reliable mechanism for assessing ecosystem services; and (2) decipher the currency of temporal and spatial changes in land cover to UES influences.
The rest of this work is structured as follows. We present the methodology of this study in Section 2. Section 3 deals only with results. This section summarizes the main assessments and key findings. Section 4 weighs the possible causes and significant effects of the reported observations. The conclusion is drawn in the last section.
2. Materials and Methods
2.1. Study Area
The study focuses on the urban centers of Faisalabad and Jhang (Figure 1). These urban settlements are located in the province of Punjab (Pakistan). The city of Faisalabad is located between 72°55′15.041″ E to 73°13′38.803″ eastern longitudes and from 31°33′44.988″ N to 31°18′9.275″ northern latitudes. It covers an area of about 1163.60 km2. In contrast, Jhang City is a self-sustaining urban settlement. This semi-planned city has an area of about 287.64 km2. It is located between 72°16′24.521″ E to 72°23′55.075″ in the east longitudes and from 31°20′27.309″ N to 31°11′0.647″ in the north latitude.
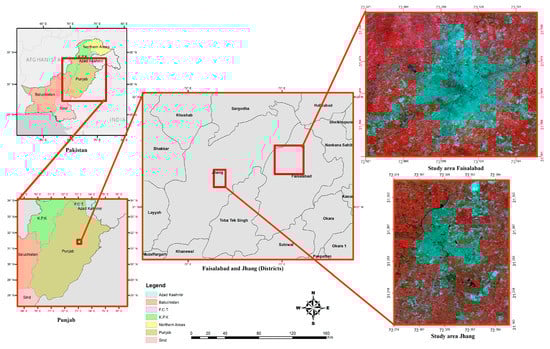
Figure 1.
The procedures for assessments.
The study relies on the Benefit Transfer Method (BTM) to assess ecosystem services. This mechanism assumes that reported ES ratings are surrogate rating parameters [6,25]. The effectiveness of BTM-based evaluations depends heavily on the choice of metrics and the accuracy of the measurements [26]. Therefore, the framework and parameters for evaluating ES assumed by [4] and subsequently modified by [14] are applicable. To this end, a benchmark for assessing the monetary contribution of the ESS from 16 land-cover biomes was considered sufficient. The methodological framework (Figure 2) allows researchers to determine the context-specific monetary value of UES based on LULC information.
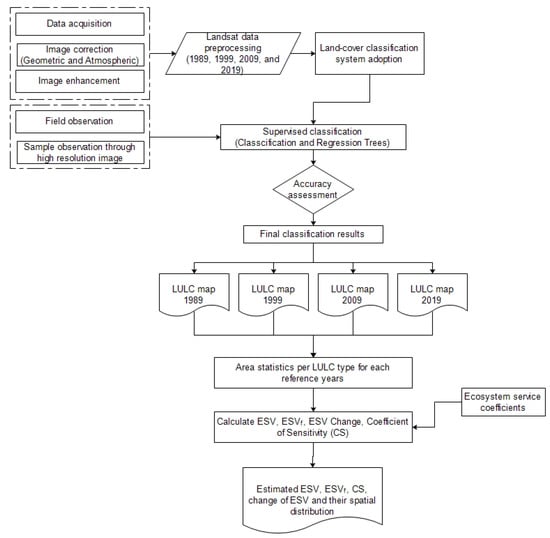
Figure 2.
The methodological framework of this study.
Therefore, LULCs data were retrieved by remote sensing (RS). This information is filtered through satellite imagery and processed in a geographic information system (GIS). The required images are provided free of charge with a resolution of 30 m (https://www.usgs.gov (accessed on 3 April 2019). The images were viewed (Appendix A) and processed online in the Google Earth Engine (GEE) (https://earthengine.google.com (accessed on 3 April 2019)). Image normalization was performed using LEDAPS (Landsat Ecosystem Disturbance Disturbance Processing System) parameters. Therefore, a cloud occlusion framework with the “Pixel-QA” technique is used [27]. The classification was performed using separate scripts/codes (Supplementary Materials File S1) and yearly datasets (1989, 1999, 2009, and 2019). Therefore, top-of-atmosphere (TOA) reflections decomposed by bands 1 to 5 and 7 are classified as relevant to Landsat 5 TM and 7 EMT+. While bands 2 to 7, 10, and 11 are used for Landsat 8, this strategy allows for the quantification of spatiotemporal changes for the specified LULC categories. Therefore, the information on LULC transformations in Faisalabad (Appendix A) and Jhang (Appendix B) has been condensed. The integrity of the findings was verified (Appendix C). Subsequently, land cover mapping is performed by a classification and regression tree (CART) classifier [28,29]. The classifier is based on a supervised classification mechanism [30]. The approved framework covers five of the six selected LULC classes (Appendix D). However, in Barrens’ case, an alternative class of rock biomes was chosen as a viable alternative. LULC-based maps were cross-validated and reasonably assessed against kappa statistics (Appendix B) criteria [31] (Appendix C) (Supplementary Materials File S1).
2.2. Assessing the Monetary Values of UES
The monetary value of UES for selected LULCs is based on reported coefficients (Table 1). The total monetary value of a single UES is calculated by multiplying the land area of the selected category by the reported coefficient value [32,33] (Equation (1)); ESV is the estimated total ecosystem services value, as shown below,
where Ak is the area (hectare) and VCk is the value coefficient (USD $ ha−1yr−1). However, ‘k’ is selected as the LULC category.

Table 1.
Biome equivalent for LULC types and coefficient as per Costanza et al. [14].
Subsequently, the change in the value of UES was assessed. For this purpose, the estimations about each LULC category were calculated for the selected years, i.e., 1989, 1999, 2009, and 2019 [33,34] (Equation (2)).
ESVcr denotes the yearly rate of change in ESV for a selected LULC. While ESVi and ESVj are the initial and final values of ecosystem service and T sands for the specified time interval.
Moreover, estimations were also made to determine the value of 17 ecosystem functions. For this purpose, the value coefficients (Table 2) relied upon [33,34] (Equation (3)).
where ESVf refers to the estimated value of ecosystem service function (f); for each LULC category, ‘k’ Ak is the area (ha), and VCfk is the value for the coefficient of f (USD $ ha−1yr−1).
Table 2.
The estimated values per unit area of ecosystem services as per Costanza et al. [14].
The validity of the proxy-based results was determined by sensitivity analysis (SA). Therefore, the sensitivity coefficient (CS) was determined. It derives a change in ESV due to different value coefficients for a given LULC type [35,36,37,38]. CS [39,40,41] is then calculated using the concept of elasticity (Equation (4)).
where i and j show the initial and adjusted values, and k represents the specific LULC type.
3. Results
3.1. Assessing the Spatial-Temporal Changes in LULC
Absolute and proportional urban land cover transitions were assessed for Faisalabad (Appendix E) and Jhang (Appendix F) cities at selected time intervals (1989–2019). Figure 3 and Figure 4 show the dynamics of this transition. The assessment shows that the agricultural area in these cities is shrinking while the built-up area is increasing. Unified intensity lines (Figure 5) are used to identify differences between cities. The comparison (Figure 5) shows that the LULC convergence speed and magnitude are more pronounced in Faisalabad compared to Jhang. The assessment shows that urban expansion in these settlements is more toward arterial roads and highways (Figure 3 and Figure 4). As a result, farmland became a desolate wasteland. Furthermore, observations suggest that urban densification is accelerating. Therefore, the observed changes significantly affect the UES supply and demand equation.
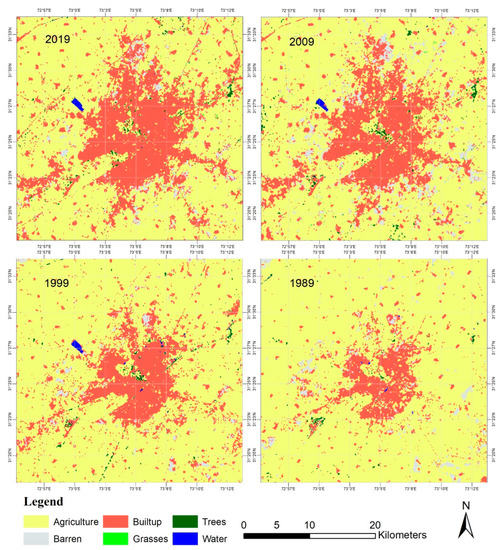
Figure 3.
The land use land cover of Faisalabad City (1989–2019).
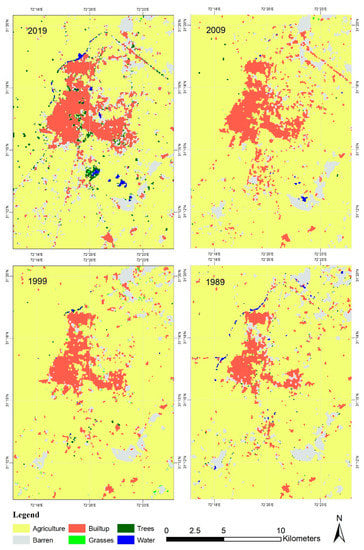
Figure 4.
The land use land cover of Jhang City (1989–2019).
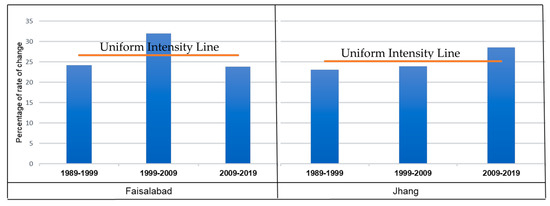
Figure 5.
The comparison of land cover convergences between Faisalabad and Jhang.
3.2. Estimating the Monetary Values of UES
LULC data from Faisalabad (Appendix A) and Jhang (Appendix B) are used as a benchmark for estimating the monetary value of UES. The approximations given (Table 1) are improvised for this purpose. It facilitates the determination of environment-specific monetary parameters for selected UESs (Table 2). Measurements to detect the change and land use change are measured in square kilometers. However, the estimate of the value factor is in hectares.
Figure 6 and Figure 7 show the impact of the land cover conversion on UES. Whereas estimates for Faisalabad (Table 3) and Jhang (Table 4) succinctly reflect currency fluctuations. The UES is estimated to be worth around USD $572.69, $545.99, $484.98, and $482.44 million in the selected years, namely Faisalabad 1989, 1999, 2009, and 2019. USD $128.23 million worth of UES was generated in the same year.
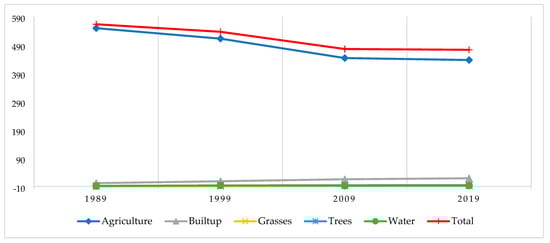
Figure 6.
The trend of total ESV in Faisalabad during 1989–2019.
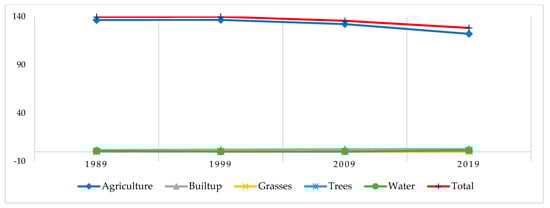
Figure 7.
Trend of total ESV in Jhang during 1989–2019.
Table 3.
Service values of ecosystem estimated for each LULC class along with the changes in Faisalabad.
Table 4.
Service values of ecosystem estimated for each LULC class along with the changes in Jhang.
Table 3 and Table 4 summarize that these settlements and their surrounding agricultural land accounted for approximately 90% of the estimated monetary value of the UES. However, the contribution of cultivated land declined significantly over the selected time interval (1989–2019). Faisalabad (USD $112.58 million) saw a more pronounced financial decline than Jhang (USD $14.3 million).
3.3. Estimating Oscillations in UES
The estimates from Faisalabad (Figure 8) and Jhang (Figure 9) illustrate the spatiotemporal fluctuations of the UES. The survey showed a steady decline in the contribution of the UES in Faisalabad (Figure 8). It is inferred from this that urban sprawl and densification put pressure on the ecological landscape. Consequently, the natural capital endowment in the form of UES decreases. A similar trend was observed in Jhang City (Figure 9). However, Jhang’s deterioration was less pronounced than in Faisalabad. The sources of the differences lie in the magnitude of urban density/growth, the economic base of cities, and the availability of agricultural land around these cities.
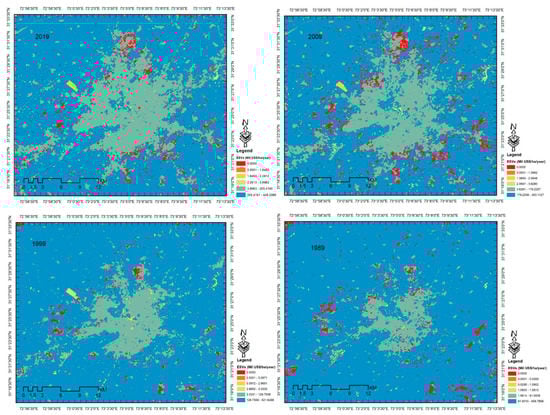
Figure 8.
The spatial distribution of ESV for the years 1989, 1999, 2009, and 2019 of Faisalabad.
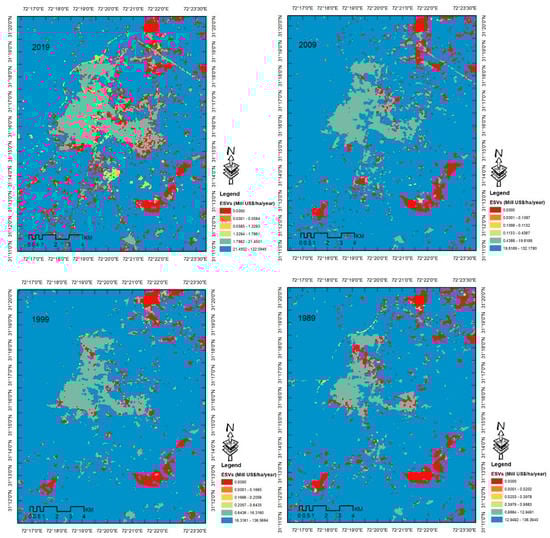
Figure 9.
The spatial distribution of ESV for the years 1989, 1999, 2009, and 2019 of Jhang.
3.4. Estimated Valuation of Selected UES
The study selected (17) UES for currency rating. Ratings are derived from coefficient ratings (Table 1) and selected measures (Table 2). The services of the collection (17) are divided into four main categories: provision (04), supervision (07), support (04), and cultural services (02). Partitioning makes it possible to determine the contribution of a single UES. Subsequently, the monetary contributions of selected UES services to Faisalabad (Table 5) and Jhang (Table 6) were determined. The results (Figure 10) concluded that provisioning ecosystem services (PES) were a major contributor (68.12%) to ESV in Faisalabad (1989–2019). This was followed by regulatory (20.66%), support (9.59%), and cultural (1.63%) services. The summary (Figure 11) also confirms the dominance of PES in Jhang. The estimates confirm that PES contributed approximately (69.72%) to Jhang’s UES estimate from 1989 to 2019. This is followed by regulated (18.84%), support (9.79%), and cultural (1.65%) services produced in the city. Fluctuations in individual UES values were also assessed for Faisalabad (Table 7) and Jhang (Table 8).
Table 5.
Estimations regarding ecosystem functions in the urban center of Faisalabad (1989–2019).
Table 6.
Estimations regarding ecosystem functions in the urban center of Jhang (1989–2019).
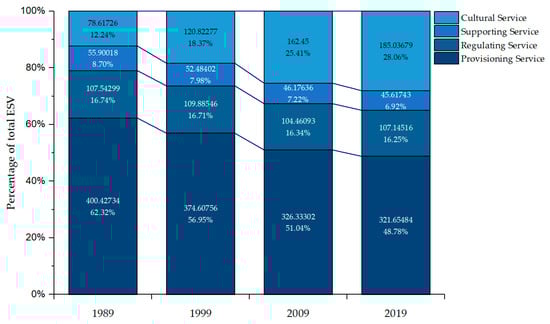
Figure 10.
The proportionate shares of ecosystem service categories toward ESV in Faisalabad City.
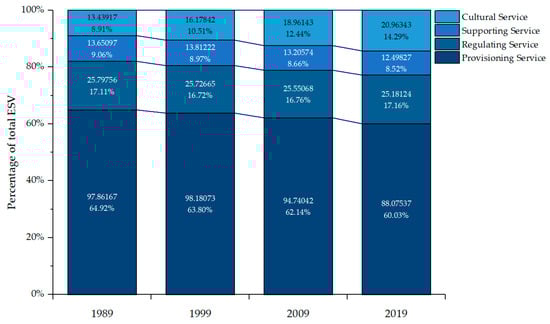
Figure 11.
The proportionate shares of ecosystem service categories toward ESV in Jhang City.
Table 7.
Changes in the monetary value (million USD) of individual ecosystem services in Faisalabad City (1989–2019).
Table 8.
Changes in the monetary value (million USD) of individual ecosystem services in Jhang City (1989–2019).
3.5. Sensitivity Analysis
The integrity of the estimates was verified by sensitivity analysis. Therefore, the sensitivity coefficient (CS) was calculated. Therefore, the value coefficient for each LULC category is baseline adjusted by ±50% as it fine-tunes the adjusted ESV and CS [39,40,42]. The estimated reliability requires a value of CS less than 1. It confirms that estimates about ESV are not elastic and robust. Therefore, the ratings of Faisalabad (Table 9) and Jhang (Table 10) were condensed according to the sensitivity analysis.
Table 9.
Estimated change in total ESV and coefficients of sensitivity (CSs) based on adjustments regarding Faisalabad.
Table 10.
Estimated change in total ESV and coefficients of sensitivity (CSs) based on adjustments regarding Jhang.
4. Discussion
Pakistan is urbanizing [43,44] at an alarming rate [45,46,47]. This process is the cumulative result of natural growth and migration from rural to urban areas [9,10]. Business prospects and employment opportunities are driving rural migration to urban centers in Pakistan [48]. The concentration of industrial and commercial activity in urban settlements is the pull factor. Consequently, this exodus prefers settlement in industrial and commercial cities compared to agricultural-based urban settlements [13,49]. The pressure inflates the vertical and horizontal expansion of existing urban settlements.
The associated changes are having a negative impact on the urban environment. In developing countries such as Pakistan, visible traces have begun to increase. This effect has dire proportions in summer heatwave and winter smog scenarios [50,51]. However, the impact on the poor is more painful than on the resourceful. Therefore, it requires comprehensive measures through a holistic assessment. This is a question of equality and a debate about justice. However, the limitations of objective assessments are documented.
Exploratory studies evaluating ES essentially rely on two types of assessments. These are called primary data-based and piece-value-based methods. A sub-variant of the unit-value-based approach was used in the current study [4,14,52]. This is a user-friendly mechanism. However, it requires formulating standard equivalence factors and creating an equivalence factor table. Standard equivalents are derived from the reported economic value of the product per unit of arable land. Statistics reflect national average production. It is convenient for researchers in developed countries to collect such information [53], but obtaining such data in undocumented economies is very difficult.
Consequently, currency valuations associated with developing countries are more complex and demanding [2,54]. The restrictions are delaying efforts by countries such as Pakistan to objectively measure and assess the overall picture. So researchers improvised measures to address such challenges in a changing economy. This is one of the main barriers to the informed assessment of UES in countries such as Pakistan. However, the conceptual framework of this study provides a simplified but feasible approach to assess the contribution of UES.
However, improvisation through BTM continued to fill in the gaps. Academic evaluations demonstrate that the findings of these studies are relevant, transferable, and applicable [55]. Therefore, this study provides reliable estimates through improvisation [14,56,57]. Therefore, Bokhari et al. [6] adopted a similar technique to assess the contribution of urban ecological resources in Pakistan. It assesses the impact of the land cover conversion on UES through non-monetary parameters. However, this study is fundamentally different from this study in that it weighs UES against financial benchmarks. Therefore, this program is a novel experiment to evaluate UES using economic parameters from a completely different socioeconomic context setting [9]. Thus, the results of this study suggest that alternative values provide a pragmatic and reliable way to value ecological resources in monetary terms. In the era of the market economy, a well-founded assessment of UES is responsible.
Furthermore, the study comprehensively assesses the significant impacts of urbanization (1989–2019) on urban land resources in Faisalabad (Appendix E) and Jhang (Appendix F). She noted that the impact on the cityscape is not the same in size or appearance. However, built-up areas are expanding, and agricultural land is squeezing these cities. Retrofits are eating away at the vacant land and farmland in and around these cities (Figure 3 and Figure 4). Unfortunately, and worryingly, green space is shrinking quantitatively (Figure 8 and Figure 9) and deteriorating qualitatively (Figure 10 and Figure 11). These shifts threaten the ecological resilience of these cities.
The results (Appendix A and Appendix B) and (Figure 3 and Figure 4) also show that the contribution of urban ecological infrastructure is devalued. The observations confirm the reported view [58,59,60,61] that urbanization in Pakistan distorts the UES supply and demand equation. However, the deterioration between these urban centers is asymmetric. A plausible explanation for the observed differences (Table 3 and Table 4) stems from the varying degrees and rates of urbanization. These claims are consistent with the observations reported by Zaman et al. [9] and Bokhari et al. [10].
The assessment (Figure 8) confirms the importance of government oversight to the integrity of the urban environment. Estimates suggest that lax regulatory controls are the main cause of the observed unregulated urban sprawl in Faisalabad (1989–2019) [62,63]. As a result, unregulated/unplanned settlements appeared on Dijkot and Samundri streets. Moreover, unplanned places such as Duglus Pura, St. Nagar, Dobigat, and Islam Nagar are springing up. These communities threaten the integrity of the UES and cause a depreciation of the reported monetary value of these environmental services. The situation in Jhang (Figure 9) is not entirely different from Faisalabad. However, unplanned urban developments in Jhang, such as Kot Akbar, Ludhan Shah, Loharan Wali, Jalal Abad, and Deewan Wali, are being transformed into planned communities such as Satellite City and Lal Zar Housing Scheme. These changes indicate a growing awareness of healthy cities in the urban environment Jhang people’s awareness and pressure are forcing developers to pursue green urban development in the city of Jhang.
Furthermore, the study points out that rapid urbanization in developing countries is draining their administrative capacity and financial resources. It is increasingly evident that the slowing pace of urbanization in Jhang Province is a boon for the country and its ecological resources. At the same time, rapid urbanization is killing the blue-green infrastructure in Faisalabad.
The results (Table 5 and Table 6) and (Figure 8 and Figure 9) show that a large proportion of UES in these cities is in the form of PES. Notably, these urban centers are located on the fertile Indus Plain (Figure 1). This is a tangible factor in reported UES assessments. This irrigated area is known as the “food basket” [64]. The contribution of CES to the cumulative share of UES in these cities (Figure 8 and Figure 9) is lower than its potential (Table 7 and Table 8). Lack of awareness and socioeconomic constraints delayed the recognition of CES [8].
The final assessment shows that individuals primarily design urban agglomerations and vertical growth trends, but institutions adjust for urban expansion. To be sure, urban expansion in changing economies is driven more by private companies. The audit found that the private and privately managed housing sector is driving this urban sprawl. With the connivance of state officials, these entities spurred the convergence of unregulated letters of credit. These “quick fix development” businesses are designed to maximize profits without worrying about the environment.
Consequently, unplanned urbanization in developing countries is causing urban environmental degradation. Thus, making inhabitants prone to environment-related perils. Therefore, context-based assessments of urban land resources and planning are needed for realistic management. This scenario entails reassessing Pakistan’s land allocation mechanisms through improved regulatory supervision for the resilience of urban land and ecological resources. Raising awareness, reliance on technology, and stakeholder engagement through participatory decision making seems feasible. It will become a panacea for the happiness of urban social life. Besides this, the focus on population control is vitally required. The reported demographic pressure is compromising the durability of corrective measures. It calls for population control through awareness and policy interventions. Moreover, a curtailment of rural-to-urban-area migration in Pakistan is also needed. For this purpose, a focus on infrastructural development in less-developed regions of the country is incumbent. It will discourage the human population’s exodus toward the country’s big urban centers. The assessments substantiate that the adopted approach has proven practical for evaluating UES.
RS and GIS have proven to be effective tools for the monetary evaluation of UES. Access to low-cost cloud platforms such as Google Earth Engine (GEE) is reliable and provides reliable estimates [65]. The results of this survey will help promote urban environmental health in a similar context.
5. Conclusions
Urban areas and surrounding areas are victims of Pakistan’s rapid urbanization. This effect seriously compromises the UES. Statistics confirm this, as the blue-green areas in Faisalabad and Jhang continue to shrink. However, the resulting impact on UES supply and demand budgets has been observed to be asymmetric. It was found that urban structure, urban economic base, population size, and regulatory oversight significantly influence urban environmental integrity. However, trade-offs in urban planning are not conducive to the environmental resilience of cities. Faisalabad’s insignificant concessions to urban planning are largely responsible for the observed ecological degradation of the city. Examining trends shows that public awareness and vigilance have made fruitful contributions to Jhang’s green urban development. It pointed out that awareness of the importance of natural vegetation can affect the positioning of urban ecological resources. Therefore, the provision of ecosystem services in urban areas of developing countries is more recognized than that of cultural ecosystem services. It called for attention to parks and urban green spaces. This impetus is necessary for the sustainability of the urban environment.
This situation requires immediate attention and pragmatic action. This scenario includes overall considerations for assessing the importance of urban ecological resources. By providing comparisons and showing alternatives, UES’s monetary assessment can be used effectively for this purpose. Contextual understanding coupled with currency estimates from developing regions will facilitate improvisation mechanisms to obtain context-specific information in currency. This study and its conclusions are intended to serve as a milestone from which further monetary assessments of UES should begin. Furthermore, the frameworks, protocols, and mechanisms employed in this study were found to be robust, making the conclusions trustworthy. The strategy will address the lack or unreliability of data in developing countries. It will enable stakeholders to address the environmental threats posed by the increasing urbanization of the world’s resource-poor regions.
Supplementary Materials
The following are available online at https://www.mdpi.com/article/10.3390/su142215136/s1.
Author Contributions
Authors Conceptualization, M.Z.-u.-H., Z.S. and S.A.B; methodology, M.Z.-u.-H., S.A.B., A.K. and M.S.; software, A.K, M.S. and A.A.G.; validation, E.A.N., A.A.G. and S.A.; formal analysis, M.Z.-u.-H. and S.A.B.; investigation, M.Z.-u.-H., S.A., H.F., M.S., A.K. and E.A.N.; resources and data curation, M.Z.-u.-H. and M.S.; writing—original draft preparation, M.Z.-u.-H., Z.S.; writing—review and editing, S.A.B., H.F., M.S. and S.A.; visualization, M.Z.-u.-H. and A.A.G.; supervision, Z.S., M.S. and E.A.N.; project administration, M.S., E.A.N., A.A.G. and S.A.B.; All authors have read and agreed to the published version of the manuscript.
Funding
This research has received funding from King Saud University through Researchers Supporting Project number (RSP-2021/164), King Saud University, Riyadh, Saudi Arabia.
Institutional Review Board Statement
Not applicable.
Informed Consent Statement
Not applicable.
Data Availability Statement
Not applicable.
Acknowledgments
The authors extend their appreciation to King Saud University for funding this work through the Researchers Supporting Project number (RSP-2021/164), King Saud University, Riyadh, Saudi Arabia.
Conflicts of Interest
The authors declare no conflict of interest.
Appendix A
Table A1.
Land use land cover (LULC) area of Urban Center of Faisalabad.
Table A1.
Land use land cover (LULC) area of Urban Center of Faisalabad.
| 1989 | 1999 | 2009 | 2019 | |||||||||
|---|---|---|---|---|---|---|---|---|---|---|---|---|
| Class | km2 | ha | % | km2 | Ha | % | km2 | Ha | % | km2 | ha | % |
| Agriculture | 1003.57 | 100,357.36 | 86.25 | 936.87 | 93,686.93 | 80.51 | 813.78 | 81,378.00 | 69.94 | 801.38 | 80,138.03 | 68.87 |
| Barren | 33.33 | 3332.94 | 2.86 | 21.23 | 2123.40 | 1.82 | 66.22 | 6622.33 | 5.69 | 37.80 | 3779.68 | 3.25 |
| Built-up | 121.60 | 12,160.48 | 10.45 | 194.80 | 19,479.92 | 16.74 | 269.07 | 26,906.73 | 23.12 | 308.39 | 30,839.07 | 26.50 |
| Grasses | 0.06 | 6.12 | 0.01 | 0.23 | 23.31 | 0.02 | 3.33 | 333.47 | 0.29 | 3.96 | 395.86 | 0.34 |
| Trees | 4.16 | 416.03 | 0.36 | 7.80 | 780.08 | 0.67 | 9.54 | 954.49 | 0.82 | 10.25 | 1025.05 | 0.88 |
| Water | 0.87 | 87.13 | 0.07 | 2.66 | 266.39 | 0.23 | 1.65 | 165.01 | 0.14 | 1.82 | 182.32 | 0.16 |
| Total | 1163.60 | 11,6360.06 | 100.00 | 1163.60 | 11,6360.03 | 100.00 | 1163.60 | 116,360.03 | 100.00 | 1163.60 | 116,360.01 | 100.00 |
Appendix B
Table A2.
Land use land cover (LULC) area of Urban Center of Jhang.
Table A2.
Land use land cover (LULC) area of Urban Center of Jhang.
| 1989 | 1999 | 2009 | 2019 | |||||||||
|---|---|---|---|---|---|---|---|---|---|---|---|---|
| Class | km2 | ha | % | km2 | Ha | % | km2 | Ha | % | km2 | Ha | % |
| Agriculture | 244.96 | 24,496.05 | 85.16 | 245.27 | 24,527.02 | 85.27 | 237.39 | 23,738.86 | 82.53 | 219.28 | 21,927.89 | 76.23 |
| Barren | 21.35 | 2135.46 | 7.42 | 15.73 | 1572.79 | 5.47 | 19.89 | 1988.74 | 6.91 | 30.26 | 3025.73 | 10.52 |
| Built-up | 19.44 | 1944.01 | 6.76 | 24.49 | 2449.48 | 8.52 | 29.45 | 2945.32 | 10.24 | 32.20 | 3220.25 | 11.20 |
| Grasses | 0.05 | 4.84 | 0.02 | 1.54 | 154.47 | 0.54 | 0.27 | 27.17 | 0.09 | 0.14 | 14.01 | 0.05 |
| Trees | 1.05 | 104.66 | 0.36 | 0.44 | 43.80 | 0.15 | 0.29 | 28.85 | 0.10 | 4.70 | 469.90 | 1.63 |
| Water | 0.79 | 78.99 | 0.27 | 0.16 | 16.43 | 0.06 | 0.35 | 35.06 | 0.12 | 1.06 | 106.24 | 0.37 |
| Total | 287.64 | 28,764.01 | 100.00 | 287.64 | 28,764.01 | 100.00 | 287.64 | 28,764.01 | 100.00 | 287.64 | 28,764.01 | 100.00 |
Appendix C
Table A3.
Accuracy assessment for each classified image.
Table A3.
Accuracy assessment for each classified image.
| Image (Path/Raw) | Year | Classified Image | Overall Classification Accuracy | Overall Kappa Statistics |
|---|---|---|---|---|
| Urban Center of Faisalabad (149/38) | 1989 | Landsat 5 TM | 81.73% | 0.6863 |
| 1999 | Landsat 5 TM | 86.42% | 0.7478 | |
| 2009 | Landsat 7 EMT+ | 83.93% | 0.7068 | |
| 2019 | Landsat 8 TOA | 91.11% | 0.9285 | |
| Urban Center of Jhang (150/38) | 1989 | Landsat 5 TM | 82.33% | 0.6923 |
| 1999 | Landsat 5 TM | 87.23% | 0.7631 | |
| 2009 | Landsat 7 EMT+ | 81.53% | 0.7958 | |
| 2019 | Landsat 8 TOA | 89.41% | 0.9101 |
Appendix D
Table A4.
LULC classes considered for classification.
Table A4.
LULC classes considered for classification.
| Class | Discerption |
|---|---|
| Agriculture | Planned crop land, agriculture fallow land, herbaceous vegetation and crop, lands that are regularly used for hay and grazing |
| Barren | Areas of sparse vegetation cover. The tract is likely to change or be converted to other uses in the near future |
| Built-up | Areas covered by man-made infrastructures such as residential, commercial, industrial, etc. |
| Grasses | Characterized by high percentage of grasses, other herbaceous vegetation, city parks, etc. |
| Trees | Areas covered by dense vegetation/trees |
| Water | All areas of open water, generally with greater than 95% cover of water, such as lakes, streams, and water reservoirs |
Appendix E

Figure A1.
Gains and losses in the LULC classes of Faisalabad (1989–2019).
Appendix F

Figure A2.
Gains and losses in the LULC classes of Jhang (1989–2019).
References
- De Groot, R.S.; Wilson, M.A.; Boumans, R.M. A typology for the classification, description and valuation of ecosystem functions, goods and services. Ecol. Econ. 2002, 41, 393–408. [Google Scholar] [CrossRef]
- Atif, S.; Saqib, Z.; Ali, A.; Zaman, M. The impacts of socio-economic factors on the perception of residents about urban vegetation: A comparative study of planned versus semi-planned cities of Islamabad and Rawalpindi, Pakistan. Appl. Ecol. Environ. Res. 2018, 16, 4265–4287. [Google Scholar] [CrossRef]
- Reid, W.V.; Mooney, H.A.; Cropper, A.; Capistrano, D.; Carpenter, S.R.; Chopra, K.; Dasgupta, P.; Dietz, T.; Duraiappah, A.K.; Hassan, R. Ecosystems and Human Well-Being-Synthesis: A Report of the Millennium Ecosystem Assessment; Island Press: Washingotn, DC, USA, 2005. [Google Scholar]
- Costanza, R.; d’Arge, R.; De Groot, R.; Farber, S.; Grasso, M.; Hannon, B.; Limburg, K.; Naeem, S.; O’neill, R.V.; Paruelo, J. The value of the world’s ecosystem services and natural capital. Nature 1997, 387, 253–260. [Google Scholar] [CrossRef]
- Collins, S.L.; Carpenter, S.R.; Swinton, S.M.; Orenstein, D.E.; Childers, D.L.; Gragson, T.L.; Grimm, N.B.; Grove, J.M.; Harlan, S.L.; Kaye, J.P. An integrated conceptual framework for long-term social–ecological research. Front. Ecol. Environ. 2011, 9, 351–357. [Google Scholar] [CrossRef]
- Bokhari, S.A.; Saqib, Z.; Ali, A.; Mahmud, A.; Akhtar, N.; Kanwal, A.; ul Haq, M.Z. The impacts of land use/land cover changes on the supply-demand budget of urban ecosystem services. Arab. J. Geosci. 2021, 14, 1402. [Google Scholar] [CrossRef]
- Millennium Ecosystem Assessment. Millennium Ecosystem Assessment. Ecosystems and Human Wellbeing: A Framework for Assessment; Island Press: Washington, DC, USA, 2005. [Google Scholar]
- Atif, S.; Saqib, Z.; Ali, A.; Zaman, M.; Akhtar, N.; Fatima, H.; Atif, M.; Farooqi, S. Identification of key-trends and evaluation of contemporary research regarding urban ecosystem services: A path towards socio-ecological sustainability of urban areas. Appl. Ecol. Environ. Res. 2018, 16, 3545–3581. [Google Scholar] [CrossRef]
- Zaman, H.M.; Saqib, Z.; Atif, B.S.; Akhtar, N.; Amir, S. The Dynamics of Urbanizations and Concomitant Land Use Land Cover Transformations in Planned and Quasi-Planned Urban Settlements of Pakistan. Geogr. Environ. Sustain. 2020, 13, 107–120. [Google Scholar] [CrossRef]
- Bokhari, S.A.; Saqib, Z.; Amir, S.; Naseer, S.; Shafiq, M.; Ali, A.; Zaman-ul-Haq, M.; Irshad, A.; Hamam, H. Assessing Land Cover Transformation for Urban Environmental Sustainability through Satellite Sensing. Sustainability 2022, 14, 2810. [Google Scholar] [CrossRef]
- Liu, Z.; Wu, R.; Chen, Y.; Fang, C.; Wang, S. Factors of ecosystem service values in a fast-developing region in China: Insights from the joint impacts of human activities and natural conditions. J. Clean. Prod. 2021, 297, 126588. [Google Scholar] [CrossRef]
- Rimal, B.; Zhang, L.; Stork, N.; Sloan, S.; Rijal, S. Urban expansion occurred at the expense of agricultural lands in the Tarai region of Nepal from 1989 to 2016. Sustainability 2018, 10, 1341. [Google Scholar] [CrossRef]
- Adaku, E. Urban Sprawl: A view from developing and developed Countries. Afr. J. Geogr. Reg. Plan. 2014, 1, 193–207. [Google Scholar]
- Costanza, R.; de Groot, R.; Sutton, P.; van der Ploeg, S.; Anderson, S.J.; Kubiszewski, I.; Farber, S.; Turner, R.K. Changes in the global value of ecosystem services. Glob. Environ. Change 2014, 26, 152–158. [Google Scholar] [CrossRef]
- Metzger, M.; Rounsevell, M.; Acosta-Michlik, L.; Leemans, R.; Schröter, D. The vulnerability of ecosystem services to land use change. Agric. Ecosyst. Environ. 2006, 114, 69–85. [Google Scholar] [CrossRef]
- Song, W.; Deng, X.; Yuan, Y.; Wang, Z.; Li, Z. Impacts of land-use change on valued ecosystem service in rapidly urbanized North China Plain. Ecol. Model. 2015, 318, 245–253. [Google Scholar] [CrossRef]
- Chi, Y.; Zhang, Z.; Gao, J.; Xie, Z.; Zhao, M.; Wang, E. Evaluating landscape ecological sensitivity of an estuarine island based on landscape pattern across temporal and spatial scales. Ecol. Indic. 2019, 101, 221–237. [Google Scholar] [CrossRef]
- Rincón, C.A.R.; Santos, J.; Volker, L.; Rouwenhorst, R. Identifying Institutional Barriers and Enablers for Sustainable Urban Planning from a Municipal Perspective. Sustainability 2021, 13, 11231. [Google Scholar] [CrossRef]
- De Groot, R.; Brander, L.; Van Der Ploeg, S.; Costanza, R.; Bernard, F.; Braat, L.; Christie, M.; Crossman, N.; Ghermandi, A.; Hein, L. Global estimates of the value of ecosystems and their services in monetary units. Ecosyst. Serv. 2012, 1, 50–61. [Google Scholar] [CrossRef]
- Zaman-ul-Haq, M.; Saqib, Z.; Kanwal, A.; Naseer, S.; Shafiq, M.; Akhtar, N.; Bokhari, S.A.; Irshad, A.; Hamam, H. The Trajectories, Trends, and Opportunities for Assessing Urban Ecosystem Services: A Systematic Review of Geospatial Methods. Sustainability 2022, 14, 1471. [Google Scholar] [CrossRef]
- Schmandt, J.; Ward, C. Challenge and response. In Sustainable Development: The Challenge of Transition; Cambridge University Press: Cambridge, UK, 2000; pp. 1–10. [Google Scholar]
- Toynbee, A.; Somervell, D.C. A Study of History: Abridgement of vol. I-VI/by DC Somervell; Oxford University Press: Oxford, UK, 1946; Volume 1. [Google Scholar]
- Stock, J.L.; Chusid, J.M. Urbanizing India’s frontier: Sriganganagar and canal-town planning on the Indus plains. Plan. Perspect. 2019, 35, 253–276. [Google Scholar] [CrossRef]
- Steedman, E.B. Report on the Revised Settlement of the Jhang District of the Punjab, 1874–1880; W. Ball: Chicago, IL, USA, 1882. [Google Scholar]
- Brander, L. Guidance Manual on Value Transfer Methods for Ecosystem Services; UNEP: New York, NY, USA, 2013. [Google Scholar]
- Plummer, M.L. Assessing benefit transfer for the valuation of ecosystem services. Front. Ecol. Environ. 2009, 7, 38–45. [Google Scholar] [CrossRef]
- Dwyer, J.L.; Roy, D.P.; Sauer, B.; Jenkerson, C.B.; Zhang, H.K.; Lymburner, L. Analysis ready data: Enabling analysis of the Landsat archive. Remote Sens. 2018, 10, 1363. [Google Scholar] [CrossRef]
- Loh, W.-Y. Classification and regression tree methods. Encycl. Stat. Qual. Reliab. 2008, 1, 315–323. [Google Scholar]
- Shetty, S. Analysis of Machine Learning Classifiers for LULC Classification on Google Earth Engine; University of Twente: Enschede, The Netherlands, 2019. [Google Scholar]
- Ye, J.; Hu, Y.; Zhen, L.; Wang, H.; Zhang, Y. Analysis on Land-Use Change and its driving mechanism in Xilingol, China, during 2000–2020 using the google earth engine. Remote Sens. 2021, 13, 5134. [Google Scholar] [CrossRef]
- Manandhar, R.; Odeh, I.O.; Ancev, T. Improving the accuracy of land use and land cover classification of Landsat data using post-classification enhancement. Remote Sens. 2009, 1, 330–344. [Google Scholar] [CrossRef]
- Tripathi, R.; Moharana, K.; Nayak, A.; Dhal, B.; Shahid, M.; Mondal, B.; Mohapatra, S.; Bhattacharyya, P.; Fitton, N.; Smith, P. Ecosystem services in different agro-climatic zones in eastern India: Impact of land use and land cover change. Environ. Monit. Assess. 2019, 191, 98. [Google Scholar] [CrossRef]
- Rahman, M.M.; Szabó, G. Impact of land use and land cover changes on urban ecosystem service value in Dhaka, Bangladesh. Land 2021, 10, 793. [Google Scholar] [CrossRef]
- Lin, X.; Xu, M.; Cao, C.; Singh, R.P.; Chen, W.; Ju, H. Land-use/land-cover changes and their influence on the ecosystem in Chengdu City, China during the period of 1992–2018. Sustainability 2018, 10, 3580. [Google Scholar] [CrossRef]
- Wang, Z.; Cao, J.; Zhu, C.; Yang, H. The impact of land use change on ecosystem service value in the upstream of Xiong’an new area. Sustainability 2020, 12, 5707. [Google Scholar] [CrossRef]
- Yuan, K.; Li, F.; Yang, H.; Wang, Y. The influence of land use change on ecosystem service value in Shangzhou District. Int. J. Environ. Res. Public Health 2019, 16, 1321. [Google Scholar] [CrossRef]
- Chuai, X.; Huang, X.; Wu, C.; Li, J.; Lu, Q.; Qi, X.; Zhang, M.; Zuo, T.; Lu, J. Land use and ecosystems services value changes and ecological land management in coastal Jiangsu, China. Habitat Int. 2016, 57, 164–174. [Google Scholar] [CrossRef]
- Gashaw, T.; Tulu, T.; Argaw, M.; Worqlul, A.W.; Tolessa, T.; Kindu, M. Estimating the impacts of land use/land cover changes on Ecosystem Service Values: The case of the Andassa watershed in the Upper Blue Nile basin of Ethiopia. Ecosyst. Serv. 2018, 31, 219–228. [Google Scholar] [CrossRef]
- Hu, H.; Liu, W.; Cao, M. Impact of land use and land cover changes on ecosystem services in Menglun, Xishuangbanna, Southwest China. Environ. Monit. Assess. 2008, 146, 147–156. [Google Scholar] [CrossRef]
- Li, R.-Q.; Dong, M.; Cui, J.-Y.; Zhang, L.-L.; Cui, Q.-G.; He, W.-M. Quantification of the impact of land-use changes on ecosystem services: A case study in Pingbian County, China. Environ. Monit. Assess. 2007, 128, 503–510. [Google Scholar] [CrossRef]
- Kreuter, U.P.; Harris, H.G.; Matlock, M.D.; Lacey, R.E. Change in ecosystem service values in the San Antonio area, Texas. Ecol. Econ. 2001, 39, 333–346. [Google Scholar] [CrossRef]
- Cai, Y.-B.; Zhang, H.; Pan, W.-B.; Chen, Y.-H.; Wang, X.-R. Land use pattern, socio-economic development, and assessment of their impacts on ecosystem service value: Study on natural wetlands distribution area (NWDA) in Fuzhou city, southeastern China. Environ. Monit. Assess. 2013, 185, 5111–5123. [Google Scholar] [CrossRef]
- Jabeen, N.; Farwa, U.; Jadoon, M. Urbanization in Pakistan: A governance perspective. J. Res. Soc. Pak. 2017, 54, 127–136. [Google Scholar]
- Gondal, M.W. Exploring the Concept of Smart Cities in Rapidly Urbanizing Pakistan. J. Indian Stud. 2021, 7, 385–398. [Google Scholar]
- Shah, A.; Ali, K.; Nizami, M. Four Decade Land Degradation in Capital City of Islamabad Pakistan during 2017–2019—A Comparative Assessment. Authorea Preprints 2020. [Google Scholar] [CrossRef]
- UNDP. Human Development Reports; The 2018 Global Multidimensional Poverty Index (MPI); United Nations Development Programme (UNDP): New York, NY, USA, 2018. [Google Scholar]
- Shah, S.A.R.; Naqvi, S.A.A.; Anwar, S. Exploring the linkage among energy intensity, carbon emission and urbanization in Pakistan: Fresh evidence from ecological modernization and environment transition theories. Environ. Sci. Pollut. Res. 2020, 27, 40907–40929. [Google Scholar] [CrossRef]
- Kugelman, M. Understanding Pakistan’s unstoppable urbanization. In Pakistan’s Runaway Urbanization: What Can Be Done?; Wilson Center: Washington, DC, USA, 2014; Volume 1. [Google Scholar]
- Quieti, M.G. Agriculture and Trade Liberalisation: Discourses and Paradigm Shifts; Cardiff University: Cardiff, UK, 2007. [Google Scholar]
- Fiore, A.M.; Naik, V.; Leibensperger, E.M. Air quality and climate connections. J. Air Waste Manag. Assoc. 2015, 65, 645–685. [Google Scholar] [CrossRef]
- Aslam, B.; Maqsoom, A.; Khalid, N.; Ullah, F.; Sepasgozar, S. Urban overheating assessment through prediction of surface temperatures: A case study of karachi, Pakistan. ISPRS Int. J. Geo-Inf. 2021, 10, 539. [Google Scholar] [CrossRef]
- Wang, W.; Guo, H.; Chuai, X.; Dai, C.; Lai, L.; Zhang, M. The impact of land use change on the temporospatial variations of ecosystems services value in China and an optimized land use solution. Environ. Sci. Policy 2014, 44, 62–72. [Google Scholar] [CrossRef]
- Xie, G.; Zhen, L.; Lu, C.-X.; Xiao, Y.; Chen, C. Expert knowledge based valuation method of ecosystem services in China. J. Nat. Resour. 2008, 23, 911–919. [Google Scholar]
- Pandeya, B.; Buytaert, W.; Zulkafli, Z.; Karpouzoglou, T.; Mao, F.; Hannah, D.M. A comparative analysis of ecosystem services valuation approaches for application at the local scale and in data scarce regions. Ecosyst. Serv. 2016, 22, 250–259. [Google Scholar] [CrossRef]
- Burkhard, B.; Kroll, F.; Müller, F.; Windhorst, W. Landscapes’ capacities to provide ecosystem services—A concept for land-cover based assessments. Landsc. Online 2009, 15, 1–22. [Google Scholar] [CrossRef]
- Richardson, L.; Loomis, J.; Kroeger, T.; Casey, F. The role of benefit transfer in ecosystem service valuation. Ecol. Econ. 2015, 115, 51–58. [Google Scholar] [CrossRef]
- Zhao, B.; Kreuter, U.; Li, B.; Ma, Z.; Chen, J.; Nakagoshi, N. An ecosystem service value assessment of land-use change on Chongming Island, China. Land Use Policy 2004, 21, 139–148. [Google Scholar] [CrossRef]
- Mazhar, F.; Jamal, T. Temporal population growth of Faisalabad city. Pak. J. Sci. 2011, 63, 249–251. [Google Scholar]
- Bukhari, M. Growth and development of Lyallpurcity. Pak. Geogr. Rev. 1971, 26, 1–15. [Google Scholar]
- Farah, N.; Zafar, M.I.; Nawaz, N. Socio-Economic and Cultural Factors Affecting Migration Behavior in District Faisalabad, Pakistan. Pak. J. Life Soc. Sci. 2012, 10, 28–32. [Google Scholar]
- Ghalib, A.; Qadir, A.; Ahmad, S. Evaluation of developmental progress in some cities of punjab, pakistan, using urban sustainability indicators. Sustainability 2017, 9, 1473. [Google Scholar] [CrossRef]
- Saeed, Q.; Bhatti, I.; Ashraf, A.; Ahmad, B. Physiochemical Analysis of Drinking Water from Different Urban Areas of Faisalabad. Int. J. Basic Appl. Sci. IJBAS-IJENS 2012, 12, 183–186. [Google Scholar]
- Shakeel, M.; Khan, A.U.; Munir, A.R.; Ahmed, T. Spatial Variation in Urban Air Pollution: A GIS Based Approach in Faisalabad, Pakistan. Asian J. Nat. Appl. Sci. 2015, 4, 40–48. [Google Scholar]
- Waseem, M.; Khurshid, T.; Abbas, A.; Ahmad, I.; Javed, Z. Impact of meteorological drought on agriculture production at different scales in Punjab, Pakistan. J. Water Clim. Change 2022, 13, 113–124. [Google Scholar] [CrossRef]
- La Rosa, D.; Wiesmann, D. Land cover and impervious surface extraction using parametric and non-parametric algorithms from the open-source software R: An application to sustainable urban planning in Sicily. GISci. Remote Sens. 2013, 50, 231–250. [Google Scholar] [CrossRef]
Publisher’s Note: MDPI stays neutral with regard to jurisdictional claims in published maps and institutional affiliations. |
© 2022 by the authors. Licensee MDPI, Basel, Switzerland. This article is an open access article distributed under the terms and conditions of the Creative Commons Attribution (CC BY) license (https://creativecommons.org/licenses/by/4.0/).