Article

Coal Discards and Sewage Sludge Derived-Hydrochar for HIV Antiretroviral Pollutant Removal from Wastewater and Spent Adsorption Residue Evaluation for Sustainable Carbon Management

1
DSI-NRF SARChI Clean Coal Technology Research Group, School of Chemical and Metallurgical Engineering, Faculty of Engineering and the Built Environment, University of the Witwatersrand, Wits 2050, Johannesburg 2000, South Africa
2
Sustainable Energy and Environment Research Group, School of Chemical Engineering, University of Witwatersrand, Wits 2050, Johannesburg 2000, South Africa
*
Author to whom correspondence should be addressed.
Sustainability 2022, 14(22), 15113; https://doi.org/10.3390/su142215113
Submission received: 12 October 2022 / Revised: 8 November 2022 / Accepted: 9 November 2022 / Published: 15 November 2022

Abstract

:
The effects of various parameter interactions on the textural structure of hydrochars produced via hydrothermal (HTC) and co-hydrothermal (Co-HTC) treatments of coal discards and sewage sludge (wastes), as well as the subsequent use of the hydrochars (HCs) synthesized for HIV drug (nevirapine and lamivudine) removal from wastewater, were investigated in this study. The HTC and Co-HTC process improved the carbon content of the raw material by 13.47%, 7.08%, and 30.65% for hydrochar coal tailing (HCT), hydrochar coal slurry (HCS), and hydrochar from coal–sewage blend (HCB), respectively. The Co-HTC-derived HCB had a high SBET of 20.35 m2/g and pore volume of 0.38 cm3/g, leading to significant adsorptive reductions of nevirapine (NEV) and lamivudine (LAM) (97.19% and 93.32%, respectively). HCT and HCS displayed high NEV and LAM adsorption capacities (50 mg g−1, 42 mg g−1 and 52 mg g−1, 41 mg g−1), respectively, despite being less effective than HCB (53.8 mg g−1, 42.8 mg g−1). In addition, the use of spent adsorption residues for energy storage applications was investigated further. The findings showed that spent adsorption residues are an effective carbonaceous material precursor to produce electrical double-layer capacitors (EDLCs).

1. Introduction

South African coal beneficiation plants produce more than sixty million tons of coal waste annually [1]. The majority of these coal wastes are disposed of in tailings piles and slurry dams [1]. As a result, concerns about the solubilization and/or volatilization of toxic substances in coal waste are seen as a major threat to the nation’s environmental waste management [2,3]. South Africa’s population has grown rapidly during the past two decades, from 48.8 million in 2005 to 51.58 million in 2010 and 57.7 million in 2018. More than half the population is currently living and working in densely populated urban areas [4]. This rapid population growth, combined with growing urbanization, has put additional strain on existing wastewater treatment plant (WWTP) infrastructure, resulting in increased sewage sludge production at these facilities [5]. Several lines of evidence suggest that landfilling sewage sludge is not a sustainable solution for sewage sludge management [6]. Despite the potential concerns regarding soil and subsoil pollution, roughly 80% of wastewater treatment plants continue to dispose of their sewage sludge in specified locations [7]. The need for innovative techniques to minimize sewage sludge waste quantities has become an environmental and societal imperative.
On the other hand, data from the World Health Organization (WHO) g Lobal Health Observatory report that 70% of the estimated 36.7 million persons g Lobally living with HIV/AIDS at the end of 2016 were from Africa [8]. South Africa’s antiretroviral therapy (ART) program is the world’s largest, with an estimated 3.9 million people receiving antiretrovirals (ARVs), accounting for roughly 24% of the g Lobal ART program as an estimated 19.8 million people use ART in the world. ARVs are used to treat and prevent a variety of viral infections, including HIV, influenza, hepatitis, and herpes [9]. In South Africa, they are mainly used for the treatment of HIV/AIDS. South Africa uses the most antiretroviral drugs per capita of any country [10,11]. Although several studies have shown that ARVs are sterilized during wastewater treatment, little work in the literature has been done on the presence of dissolved ARVs, their metabolic products, and removal strategies in wastewater [9]. P Recent research in this area by Kebede (2020), Ndilimeke Akawa (2021), and Zitha (2022) demonstrated the existence of antiviral and other pharmacological compounds in bodies of water [12,13,14]. According to these studies, nevirapine and lamivudine were found in South African ambient water at a maximum concentration of 1.640 ng·L−1, posing a substantial environmental risk due to their potential influence on aquatic life and medication resistance in humans [14]. As a result, there is a need for enhanced pharmaceutical component removal methods from water bodies. So far, research into the removal of pharmaceutical components from water bodies has been limited, owing to the high expense of prospective researched strategies such as adsorption, degradation, and phytoremediation [12,14]. Furthermore, recent research conducted by Späth (2021) employing biochar as adsorbents revealed a moderate ARV removal efficacy in wastewater, which may be attributed to the textural properties of the adsorbent materials as well as the adsorption process parameters employed [15]. Despite the fact that a significant amount of biochar (100 g/L) was required for the efficient removal of nevirapine and lamivudine from wastewater at ambient temperatures (rather than the 45 °C reported in most studies), Späth’s research demonstrated that the results were comparable to those achieved using high-cost synthetic adsorbents and that there was still potential for improvement. South Africa has a high HIV/AIDS prevalence, and it is anticipated that an increasing load of antiretroviral drugs may circumvent the WWTP systems and infiltrate the country’s water networks [16,17,18]. The premise of this work is that the physicochemical and textural characteristics of HTC-derived biochar may be enhanced for usage as low-cost potential adsorbents for pharmaceutical component removal from water bodies.
In this study, we focus on two antiretroviral drugs, namely (i) Nevirapine (NVP), which is an oral drug used to treat and prevent retroviral infections, particularly those caused by human immunodeficiency virus type 1 (HIV-1). HIV-1 is a virus that primarily infects CD4-T cells, which are immune system cells. HIV-1 ART, on the other hand, neither cures nor destroys the virus; rather, it suppresses or delays its reproduction [19]. It is typically used in conjunction with other ARV medicines. Nevirapine is a non-nucleoside reverse transcriptase inhibitor (NNRTI) antiretroviral medication (ARVD) commonly used to prevent HIV transmission to the fetus. The nucleoside/nucleotide reverse transcriptase inhibitors (NRTIs) impede the HIV viral RNA’s reverse transcription into its DNA, which is essential before the virus can integrate into the host cell. This is accomplished by interfering with the viral enzyme reverse transcriptase, which oversees the performance of this activity. After intake, it is excreted in urine at a rate of 2.7% [20,21]. (ii) Lamivudine (3TC) is a first-generation nucleoside reverse transcriptase inhibitor that was licensed in 1995 for the treatment of HIV-1 infection and hepatitis B virus (HBV) infection. EPIVIR (2013); EPIVIR–HBV (2016). Since 2002, the WHO has recommended HIV treatment regimens, and 3TC or emtricitabine (FTC) are almost always the preferred components of fixed-dose combos (WHO, 2016). Only one study used HPLC/MS to determine its content in water, which was less than 1 ng·L−1 [22,23,24].
The release of micropollutants into the environment via wastewater treatment plant (WWTP) effluents is one of the most important concerns with micropollutants in sanitation. For a long time, these discharges were recognized as a major source of micropollutant introduction into the environment, and their centrality to environmental contamination has been established [22,23]. Pharmaceutical residues and hormones, pesticides, phthalates, artificial sweeteners, and personal care products are all detected in these discharges at trace amounts (ng/L to µg/L) [23,24]. One of the current challenges is the removal of micropollutants from WWTP discharges. This is crucial for creating cutting-edge innovations, guiding management strategies, and optimizing treatment operations and routes to reduce micropollutant concentrations in discharges and hence in the environment. It is well-known that traditional WWTPs significantly reduce hydrophobic, volatile, or biodegradable chemicals while having little or no effect on many micropollutants such as pharmaceutical compounds [22,23,24,25]. As a result, there is a need for additional pollution reduction solutions, and the implementation of additional tertiary treatments aimed at the eradication of micropollutants is a viable option; among these the use of activated carbon adsorption, in particular, appears to be a highly adaptable, efficient, and fairly priced method.
Though activated carbon adsorption has been widely used in drinking water treatment, it has only recently attracted more attention in wastewater for the elimination of micropollutant concentrations in WWTP discharges. There is relatively little research on the elimination of micropollutants, and in particular, of ARVs micropollutants from WWTP discharges [26,27,28,29,30].
This is the motivation behind this research, which aims to synthesize low-cost AC from sewage sludge and coal discards for the removal of ARV micropollutants from WWTPs, thereby contributing to the closure of the waste loop in WWTPs by optimizing the carbon yield of HCs synthesized from CD and SS, examining their efficiency for the adsorption of dissolved pharmaceutical micropollutants in water (nevirapine and lamivudine), and then investigating the use of the spent adsorption residues obtained for energy storage applications.

2. Experimental Method

2.1. Materials

The standard non-nucleoside nevirapine (NEV) and nucleoside lamivudine (LAM) reverse transcriptase inhibitor tablets supplied by Dischem pharmacy of South Africa with 99.9% purity were utilized for adsorption tests. The tablets were crushed and dissolved in ultra-pure water obtained from a Direct-Q®3 with a pump (Millipore, Merck system). The dissolution was carried out in a laboratory g Lass beaker using a predetermined volume of ultra-pure water (pH 6.8) at 20 °C for stirring speed of 50 rpm and time of 30 min.
Coal tailing (CT) and coal slurry (CS) were collected from a coal beneficiation plant in Mpumalanga, South Africa, for use in this study (Figure 1A,B). Before use, the collected samples were dried in an ambient atmosphere, loaded, and transported in airtight bags to the laboratory, then dried once more at room temperature. The dried samples were mixed for homogenization and split into two portions from which one was screened into various particle sizes and the other was pulverized for physicochemical characterization (proximal, ultimate, total sulfur, SEM, and FTIR). The sewage sludge (SS) used in this study (Figure 1C) was collected from a wastewater treatment plant (Ekurhuleni Water Care Company (ERWAT)) and split into two portions. The first portion was dried in a laboratory dryer at 105 °C for 24 h and crushed for physiochemical characterization, while the second portion was used for HTC tests as received.

2.2. Methods

Batch experiments were conducted to evaluate the adsorption performance of the synthesized HCs for the removal of NEV and LAM from synthetic aqueous solutions made using ultra-pure water at an initial concentration of 20 μmol L−1. The adsorption test was performed in volumetric polypropylene flasks of 200 mL. The flasks were filled with a mixture of HCs and prepared aqueous solutions (containing the dissolved medicines) and shaken on a Platform shaker at 80 rpm at 25 °C. (Labcon-Instrulab). Two adsorption parameters were considered: the concentration of adsorbent® and the residence time (t). For the experiments, 1 g of each HC was combined with a similar amount of water solution. To assess the adsorption of NEV and LAM on the selected HCs concentration, 10 g L−1, 20 g L−1, 50 g L−1, 100 g L−1, and 300 g L−1 were used for a range of residence duration between 10 and 360 min. After allowing the mixtures to equilibrate for 24 h to guarantee saturation, they were centrifuged for 15 min at 1500 rpm. The supernatant from each flask was then filtered through a 0.22 µm Whatman filter paper. The filtrates were then tested against corresponding produced aqueous solutions using a UV-1800 spectrophotometer and the gas chromatograph linked to the mass spectrometer Shimadzu (GCMS-2010) The experiments were repeated three times to guarantee the accuracy of the results. The dissolved drug concentrations (NEV and LAM) in the initial aqueous solutions were used as a reference for calculating adsorption percentages using Equation (1):
Adsorption (%) = (Ci − Cf) /Ci × 100
where Ci (µmol L−1) is the concentration of the transcriptase inhibitor drugs in the corresponding initial solution and Cf (µmol L−1) is the remaining drug concentration in the liquid phase at the end of the adsorption experiment with each HCs.
The hydrothermal carbonization (HTC) and co-hydrothermal (Co-HTC) experimental test runs were designed using Design-Expert software (DoE) (Version 13, State–Ease, Inc., Minneapolis, MN, USA). For experimental designs, the central composite design (CCD) and the custom design (CD) were utilized to know the number of runs that will be required to optimize the HTC and Co-HTC runs, respectively. HTC experiments were conducted using variations in temperature, pressure, and time ranging from 150 to 270 °C, 10 to 27 bar, and 10 to 180 min, respectively. However, the Co-HTC experiments were performed using variations in residence time ranging from 10 to 360 min for the same range of temperature and pressure utilized in HTC experiments, i.e., 150 to 270 °C, 10 to 27 bar, respectively. The Co-HTC experiments used a coal feedstock combination (CT + CS) of 50% coal tailing and 50% coal slurry. For the sake of simplicity, a 1:1 coal tailing to coal slurry blend was adopted. The coals–sewage sludge blend ratio (CT + CS: SS) used for Co-HTC experiments varied from 0:25 to 25:0 (wt:wt). High fixed carbon (FC) content hydrochars by means of the DoEwere selected using the response surface methodology (RSM) and the optimal combined methodology (OCM) techniques for HTC and Co-HTC, respectively. RSM and OCM were adopted to understand the interactions of the HTC and Co-HTC factors on the fixed carbon contents of the HC produced from the individual CT, CS, and from the mixture of coals with sewage sludge, respectively. In addition, RSM and OCM were used to develop appropriate models to enable the prediction of the optimum operating conditions required to produce high-carbon content hydrochars. The analysis of variance (ANOVA) was used to evaluate the statistical significance of the designed models.
The spent HC residues from nevirapine and lamivudine adsorption experiments were chemically activated using a KOH reagent to produce activated carbons (ACs). Several studies on the activation process of coal-based materials have shown that the impregnation ratio of KOH/carbonaceous material (CM) has an effect on the textural features of the generated ACs [27,31,32]. Furthermore, a recent study done by Abdulsalam Jibril et al. (2019) found that increasing the activation temperature from 400 °C to 800 °C and the KOH/CM impregnation ratio from 1/1 to 4/1 increased the specific surface area (SBET) of the generated ACs. SBET values of 1925 m2/g for run-of-mine coal, 1826.41 m2/g for coal waste, and 1484.96 m2/g for coal slurry ACs were obtained [33]. The optimum conditions established by Abdulsalam Jibril et al. [34] were adopted in this investigation to synthesize ACs from nevirapine and lamivudine adsorption tests. To remove residual alkali, the ACs were rinsed with 0.5 N HCl and then distilled water [34]. The washed samples were then dried in an oven at 60 °C overnight before being kept in airtight bags for physicochemical analysis. ACs were labeled as follows: AC–HCT–NEV, AC–HCT–LAM, AC–HCS–NEV, AC–HCS–LAM, AC–HCB–NEV, and AC–HCB–LAM. Because of the abundant charge storage sites on the highly porous surface of ACs, they may be used as electrode materials in supercapacitors [35]. As a consequence, ACs derived from nevirapine and lamivudine adsorption tests were evaluated as electrode materials in ionic solutions (Na (+) SO4 (2−)).

2.3. Physicochemical and Textural Analyses

The concentrations and dissolved organic compounds of transcriptase inhibitor drugs (NEV and LAM) in the initial solution and produced filtrates from adsorption experiments were determined using the UV-1800 spectrophotometer and the gas chromatograph linked to the mass spectrometer Shimadzu (GC-MS-2010). The drug release concentration (CR%) was evaluated at a wavelength of 270 nm. The GC-MS instrument was set at an initial temperature of 140 °C. The initial temperature was held for five minutes then increased to 50 °C at a heating rate of 4 °C/min and maintained for 12.5 min. The samples were injected at 220 °C using the spitless mode. The analysis was performed using the following procedure: sampling time: 1.00 min; flow control mode: pressure: 100.00 kPa, total flow: 50.00 mL/min; column flow: 1.13 mL/min; linear velocity: 3.00 mL/min. The identification of the organic compounds in the PW was conducted using the NIST 14 database and compared with published mass spectra.
Spectra of nevirapine and lamivudine standards were built in the range from 200 to 350 nm using quartz cuvettes with 1 cm of path length and water as blank. Solutions of NEV and LAM standards at 15 g mL−1 prepared in water were used in this analysis. Ten tablets of each drug were weighed and powdered. The equivalent of 150 mg of nevirapine and lamivudine was weighed and transferred into a 200 mL volumetric flask with ultra-pure water. This solution was filtered, and 1.0 mL was transferred into a 100 mL volumetric flask using water to obtain a solution at 15 g mL−1. A calibration curve with five points, in the range from 5 to 25 g mL−1, was produced at the wavelength of 270 nm (ICH Q2 (R1) 2005).
A variety of analytical techniques were used to compare the physicochemical properties of the initial absorbent (HCs) and the residues obtained after adsorption experiments, namely the proximate analysis of 1 g of −212 µm of the sample was carried out using the Thermo Gravimetric analyzer equipment (Leco TGA 701) in accordance with ASTM D5142. The FTIR analysis was conducted on a spectrometer Perkin Elmer Spectrometer coupled with a diamond attenuated total reflectance accessory in the wavenumber range between 4000 and 450 cm−1. The interpretation of the spectra was performed based on reference tables provided by Smith Brian (2018). The scanning electron microscopy (SEM) was done using a Carl Zeiss Sigma Field scanning electron microscope connected to the Oxford X-act EDS detector. The analysis was carried out in this procedure according to the operational mode of the equipment. The SEM/EDS analysis settings were on 10 kV and a working distance (WD) of 7.2–8.2 mm using a backscattered electrons (BSE) signal. The SEM/EDS analysis provided the surface structure and the homogeneity of the samples [36]. The porous properties were obtained from Brunauer Emmet Teller analysis (BET) using a nitrogen adsorption test at 77 K. For BET analysis, the autosorb iQ gas sorption instrument (Quantachrome Instruments, Boynton Beach, FL, USA) was used while the Quantachrome® ASiQwinTM software (Boynton Beach, FL, USA), which interfaces the autosorb iQ to a computer, was used for data acquisition and data reduction.

3. Results and Discussion

3.1. HTC and Co-HTC Statistical Analysis

Table 1 shows the optimum parameters evaluated using the design of experiment (DoE version 13) on the HTC (coal tailing and coal slurry) and Co-HTC (coal sewage sludge blend) experimental results obtained from the proximate analysis. From the ANOVA, the regression models (Equations (2)–(4)) developed using response surface methodology (RSM) for HTC and optimal combined methodology (OCM) for Co-HTC were then used to assess the impact of the process factors on the fixed carbon (FC) of the produced hydrochar (HCs). Due to the high F-value and low p-value, the results show that all models are of statistical significance [33]. Temperature, pressure and residence time, and the coal–sewage sludge blend ratio all influenced the FC that the HCT, HCS, and HCB produced. The regression models obtained from the RSM of the HTC and OCM of Co-HTC experimental data revealed that temperature and the coal–sewage sludge blend ratio are the most significant model terms.
H C T   F i x e d   C a r b o n     = 37.66 1.20 A + 0.1090 B + 0.0040 C 0.0837 A B   0.0388 A C + 0.0337 B C + 1.04 A 2 + 0.113 B 2 0.2714 C 2
H C S   F i x e d   C a r b o n = 53.01 3.29 A + 0.5520 B 0.3410 C  
H C B   F i x e d   C a r b o n     = 30.46 A + 45.36 B + 55.13 A B + 9.11 A C + 6.58 A D   + 13.69 A E 0.6847 B C 0.1279 B D 4.28 B E 15.83 A B C   10.52 A B D + 14.57 A B
where A is the temperature, B is the pressure, C is the time, D is the mass of sewage sludge (SS), and E is the mass of the mixture of coal tailing and coal slurry (CT + CS).
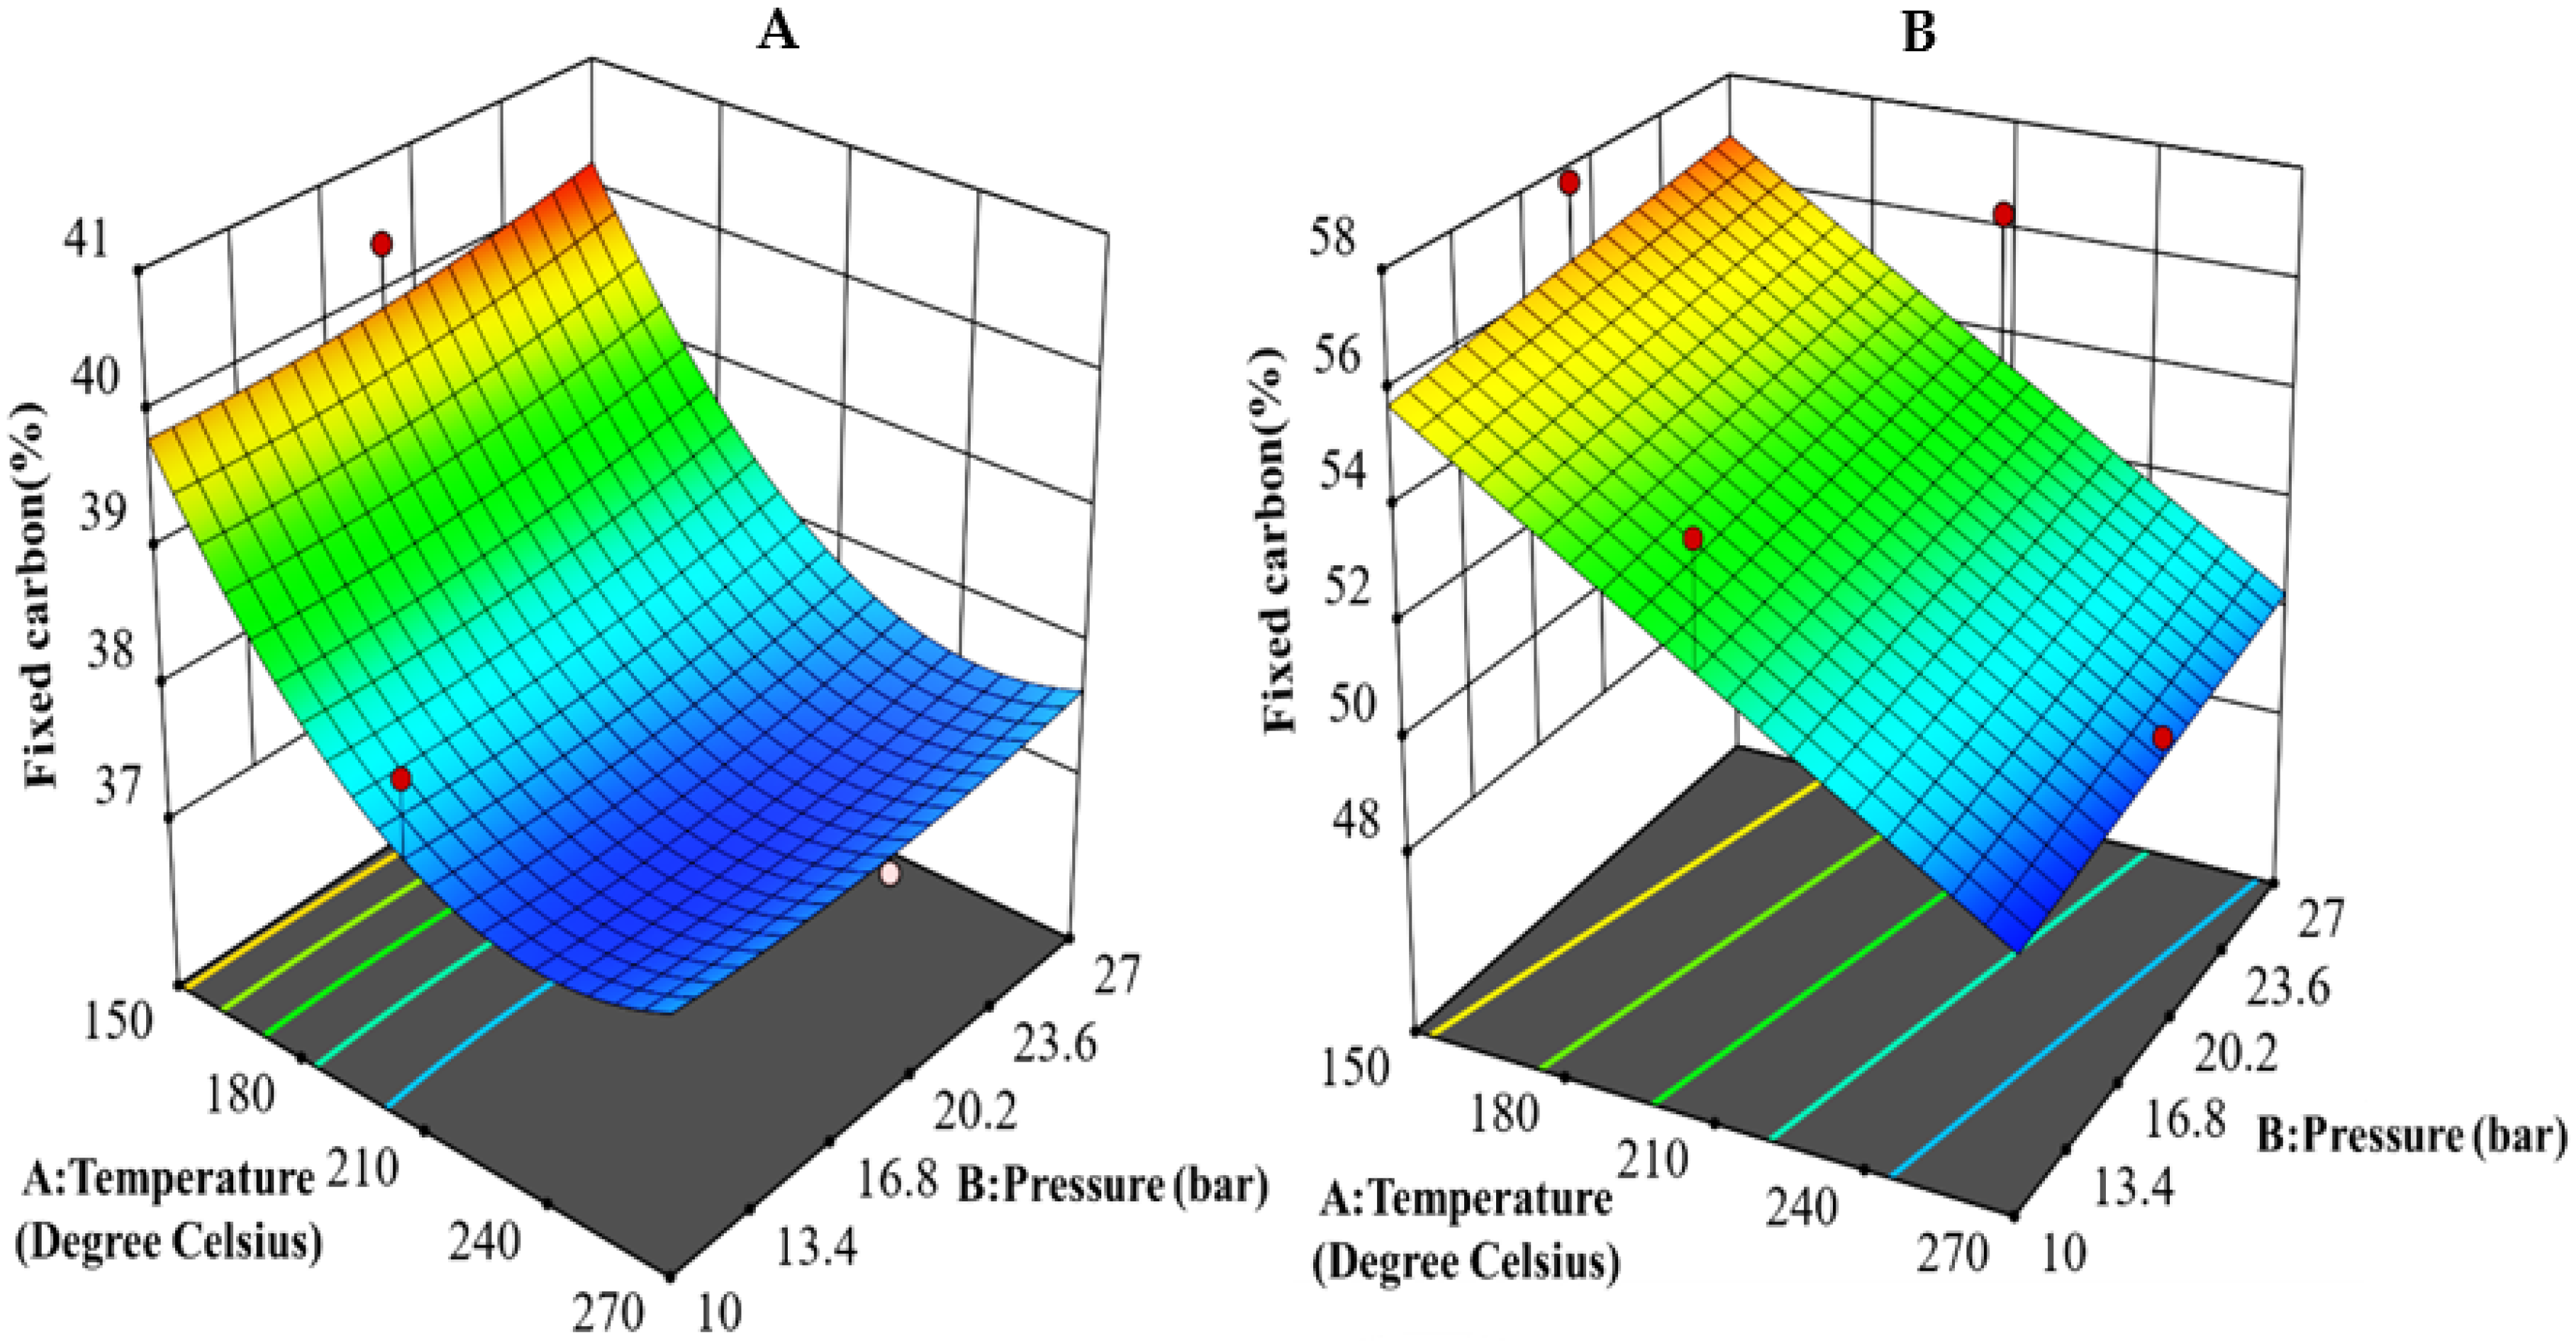
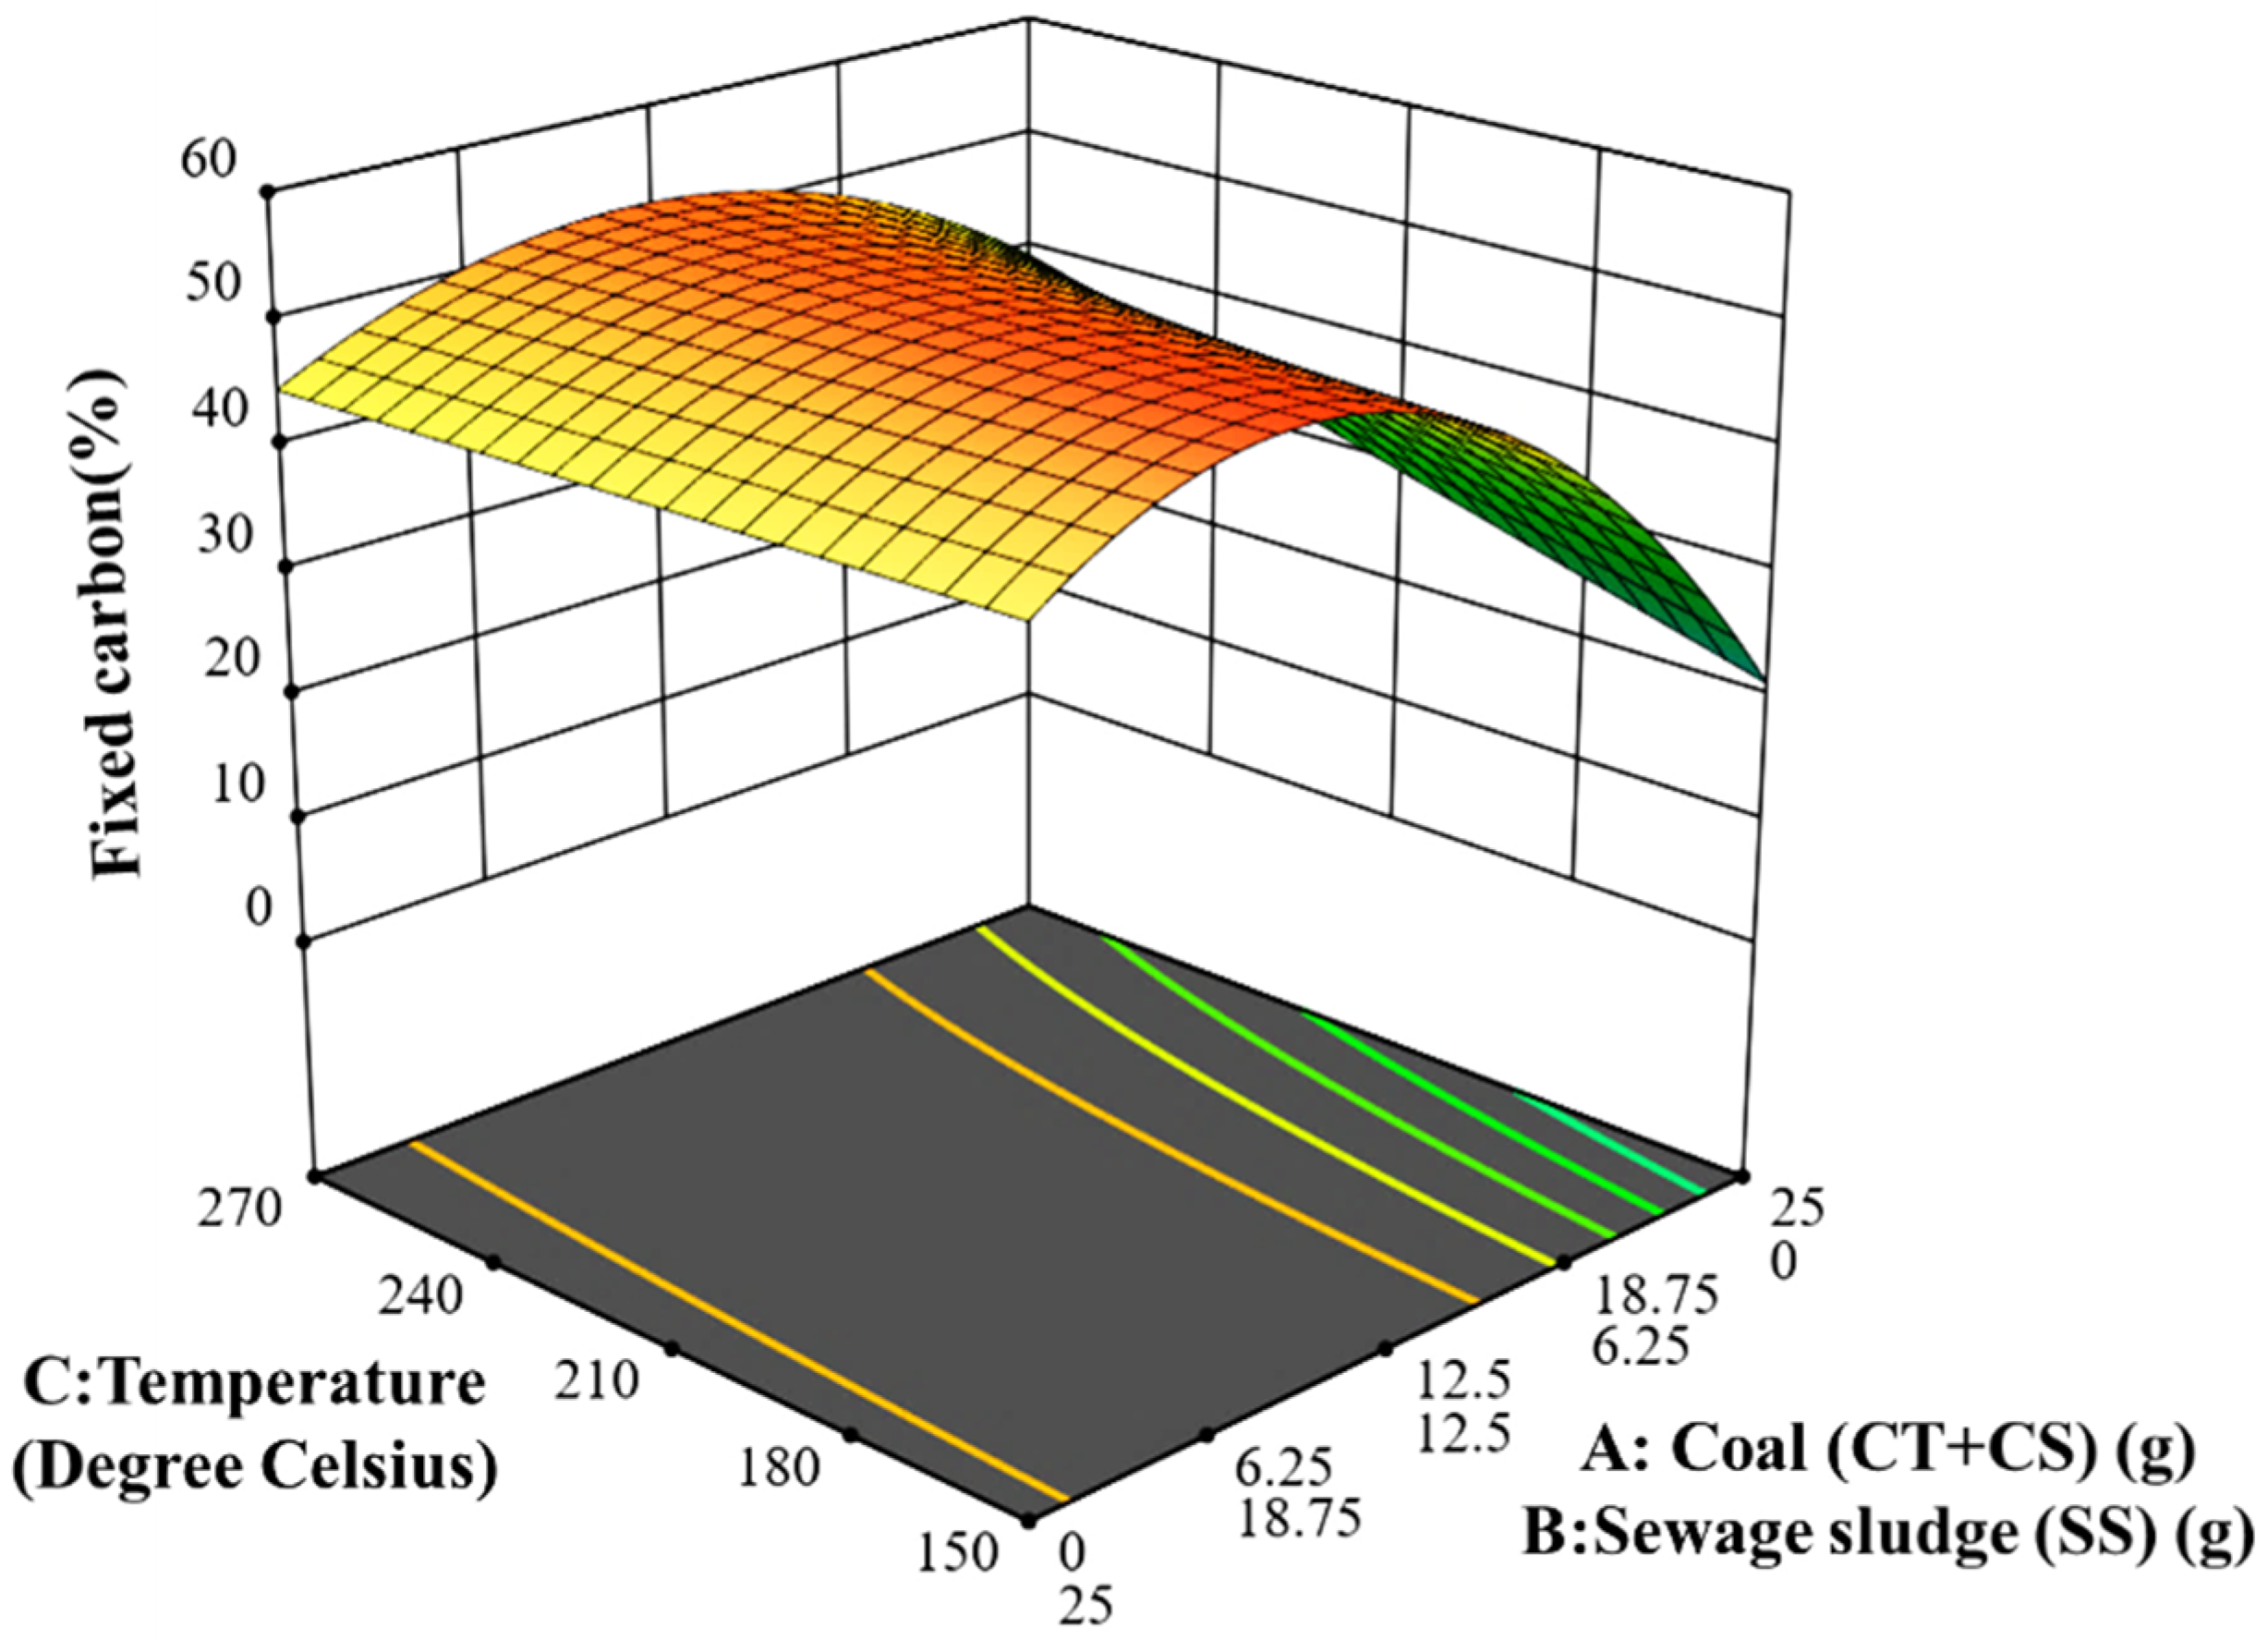
The effects of operating conditions on the FC of produced hydrochars (HCs) are depicted in Figure 2 and Figure 3. The curvature seen in Figure 2A and Figure 3 describes the significant impact of the interaction between the HTC and Co-HTC parameters. A linear slope observed in Figure 2B indicates insignificant interactions (high p-values > 0.2) between the HTC of CS process parameters. As a result, quadratic and linear models accurately fitted the HTC of CT, Co-HTC of CB, and HTC of CS, respectively. Temperatures above 150 °C reduce the FC of the produced HCT and HCS. However, increasing the temperature to 208 °C and the (CT + CS: SS) ratio to 5:1 increases the FC of the produced HCB. The results shown in Figure 3 show that an interaction effect of reaction temperature and coal–sewage sludge mass ratio had a significant effect on the FC of produced HCB.

3.2. Optimum Operating Conditions

The optimization of input factors and response surface constraints concluded the analysis and evaluation of the resulting data. The goal was to assess the input variables in order to maximize FC for the generated HCs. The input parameters for the HTC process ranged from 150 °C, 10 bar, and 10 min as lower values and 270 °C, 27 bar, and 180 min as upper limits. On the other hand, the Co-HTC produced optimization solutions that were established using input factors of 150 °C, 10 bar, 10 min, and 0:25 g (CT + CS: SS) as lower limits and 270 °C, 27 bar, 360 min, and 25:0 g (CT + CS: SS) as the upper limits. The conditions that produced the highest desirability factor were selected as the optimum process parameters. The optimum HTC conditions obtained were 150 °C, 27 bar, and 92.13 min, while the ideal Co-HTC conditions were 208 °C, 22.5 bar, 331 min, and 20.02:4.98 (CT + CS: SS mass ratio). Results in Table 1 show that the optimized predicted results were in agreement with the experimental measurement.
absolute error (POAE) (fraction) = (Experimental-Predicted)/Experimental
However, results from this study are more conservative than those obtained in previous research that used a different feedstock to optimize HTC and Co-HTC operating conditions [37]. However, the implemnetation of the optimal conditions found in this study could have a significant positive effect on the economics of the HTC and Co-HTC process, and so this work lays the groundwork for the development and economic feasibility of the operating conditions used for other similar thermal processes, such as pyrolysis and gasification [37,38].

3.3. Adsorption Results

Table 2 presents the results of the NEV and LAM adsorption experiments conducted with the synthesized HCs. The uptake results for the different HCs (HCT, HCS, and HCB) are shown in Figure 4A,B, respectively. The highest uptake of NEV and LAM was achieved at 90 min and at an adsorbent concentration of 100 g/L. For all the tested HCs, increasing the process time (t) and lowering the adsorbent concentration improves NEV and LAM uptake. This is in line with Yang’s (2007) finding that as process time and adsorbate concentration increase, the proportion of saturation in the adsorption process increases [39]. This happens because of the adsorbate remaining in contact with the adsorbent surface for a long time [40]. The adsorbate eventually saturated the porous media as there was a plateau after 90 min (Figure 4B). Additionally, as the adsorbent concentration increased, the uptakes of NEV and LAM on all HCs used decreased. The higher the adsorbent concentration, the less readily dissolved drugs moved from the liquid (AS) to the solid pores (HC), and the stronger the driving force of liquid adsorption into the solid (HC) [41].
HCT: Hydrochar coal tailing. HCS: Hydrochar coal slurry. HCB: hydrochar from the blend of coal tailing, coal slurry, and sewage sludge. NEV: Nevirapine. LAM: Lamivudine. HC/AS: hydrochar–aqueous solution (charged with inhibitor drugs dissolved) solid/liquid ratio. STD: Standard deviation. The results demonstrate that the HCB has a higher drug uptake performance (5.37 μg L−1 of NEV and 4.2737 μg L−1 of LAM) than the HCT and HCS. This may be due to HCB’s higher porous textural structure (high SBET and pore volume). In all cases, NEV uptake was higher than LAM uptake under similar operating conditions. This could be attributable to NEV’s higher capillary uptake degree in aqueous solution compared to LAM. Overall, the highest NEV and LAM uptakes were 90.32% and 91.78% for HCT, 93.97% and 89.67% for HCS, and 97.19% and 93.32% for HCB.
The results obtained showed that the HCB owned the highest NEV and LAM uptake efficiency (Figure 4). Hence, the GC-MS analysis was performed on the final filtrates from the HCB adsorbent to identify the remaining organic elements dissolved.
Table 3 and Table 4 demonstrate that the final adsorbates include fewer dissolved organic components than the antiretroviral-seeded solutions. Organic acids, sugars, and methyl compounds were among the organic molecules identified in traces in the final adsorbates. Further chemical analysis of the dissolved organic molecules in the final adsorbates revealed a preponderance of acid, aromatic, alcohol, and esters compounds, as well as modest levels of aliphatic hydrocarbons. The organic chemicals are produced when NEV and LAM break down (dissolve) in water, and it is anticipated that their presence in discharge water will pose environmental risks to possible receiving waterbodies [15].
The most abundant organic acids were hexadecanoic acid, propanoic acid, 2-hydroxy, and 9,12–0ctadecadienoic acid, followed by l-l -Cyclopropyl-4-methyl-5,11-dihydro-6H, 6-0xa-bicyclo [3.1.0] hexan-3-one, and hexadecanoic acid. As depicted in Figure 4, the GC-MS outcomes for LAM adsorption followed the same pattern as NEV adsorption (higher adsorption performance of HCB). In the adsorbate of LAM, hexenoic acid, methyl and heptadecyl ester, heptanol, 1,2,3-propanetriol, and alkanes were the most common organic molecules. The GC-MS analysis reveals a slightly more extensive dispersion of organic compounds for both NEV and LAM, and the presence of organic components in the final adsorbates likely indicates the necessity for an additional removal stage before contaminated water is released into bodies of water.

3.4. Proximate, Ultimate, and BET Analysis

Table 5 provides the proximate and ultimate analysis results of CT, CS, SS, selected hydrochar (HCs) from hydrothermal carbonization (HTC) and co-hydrothermal carbonization (Co-HTC), and adsorbent residues from the adsorption process under optimal conditions. The HTC and Co-HTC processes proved the ability to enhance the fixed carbon content of raw materials by releasing mineral matter, oxygen, and sulfur from their molecular structures [42,43]. The HTC and Co-HTC processes increased the FC concentration of the raw samples in order to produce hydrochar. The optimum HTC and Co-HTC conditions maintained the liquid state of water and promoted the hydrolysis of aliphatic components, dissolution, and release of mineral materials, resulting in the formation of porous solids [44]. In addition, the optimum HTC and Co-HTC conditions retained a considerable amount of the atomic carbon content of the feedstock in the solid HC produced, validating the HTC and Co-HTC process’s potential for sequestration and repolymerization [45]. The rise in total carbon content in the generated HC may be related to a decrease in hydrogen, oxygen, and total sulfur contents (Table 5), while the decrease in sulfur content in the produced hydrochar likely contributes to the enlargement of pores [46]. Following the adsorption process, the nitrogen adsorption isotherms of synthesized fresh HCs and spent HCs residues exhibited a decrease in the amount of nitrogen absorbed (Figure 5). This confirmed that pores formed during HTC and Co-HTC synthesis of HCs were occluded [47]. Figure 6, Figure 7 and Figure 8 demonstrate that the lateral interaction between dissolved drug molecules and HCs likely contributed to a change in the surface texture of the absorbent. It is also likely that drug molecules repopulate the mesopores created when the initial sulfur and oxygen content is oxidized. As seen in Table 5, this decreases the SBET and total pore volume of HCs in the ensuing spent residues.
Table 5 illustrates the increase in the volatile matter (VM) and total carbon in the spent residues comparative to the source materials and the synthesized HCs. This provides evidence of NEV and LAM dissolved adsorption on HCs. The NEV and LAM are organic compounds with cyclic carbon structures incorporating nitrogen and sulfur, especially in the case of LAM [48]. As a result of their adsorption on HCs, the nitrogen and total sulfur content of the solid residues increase.
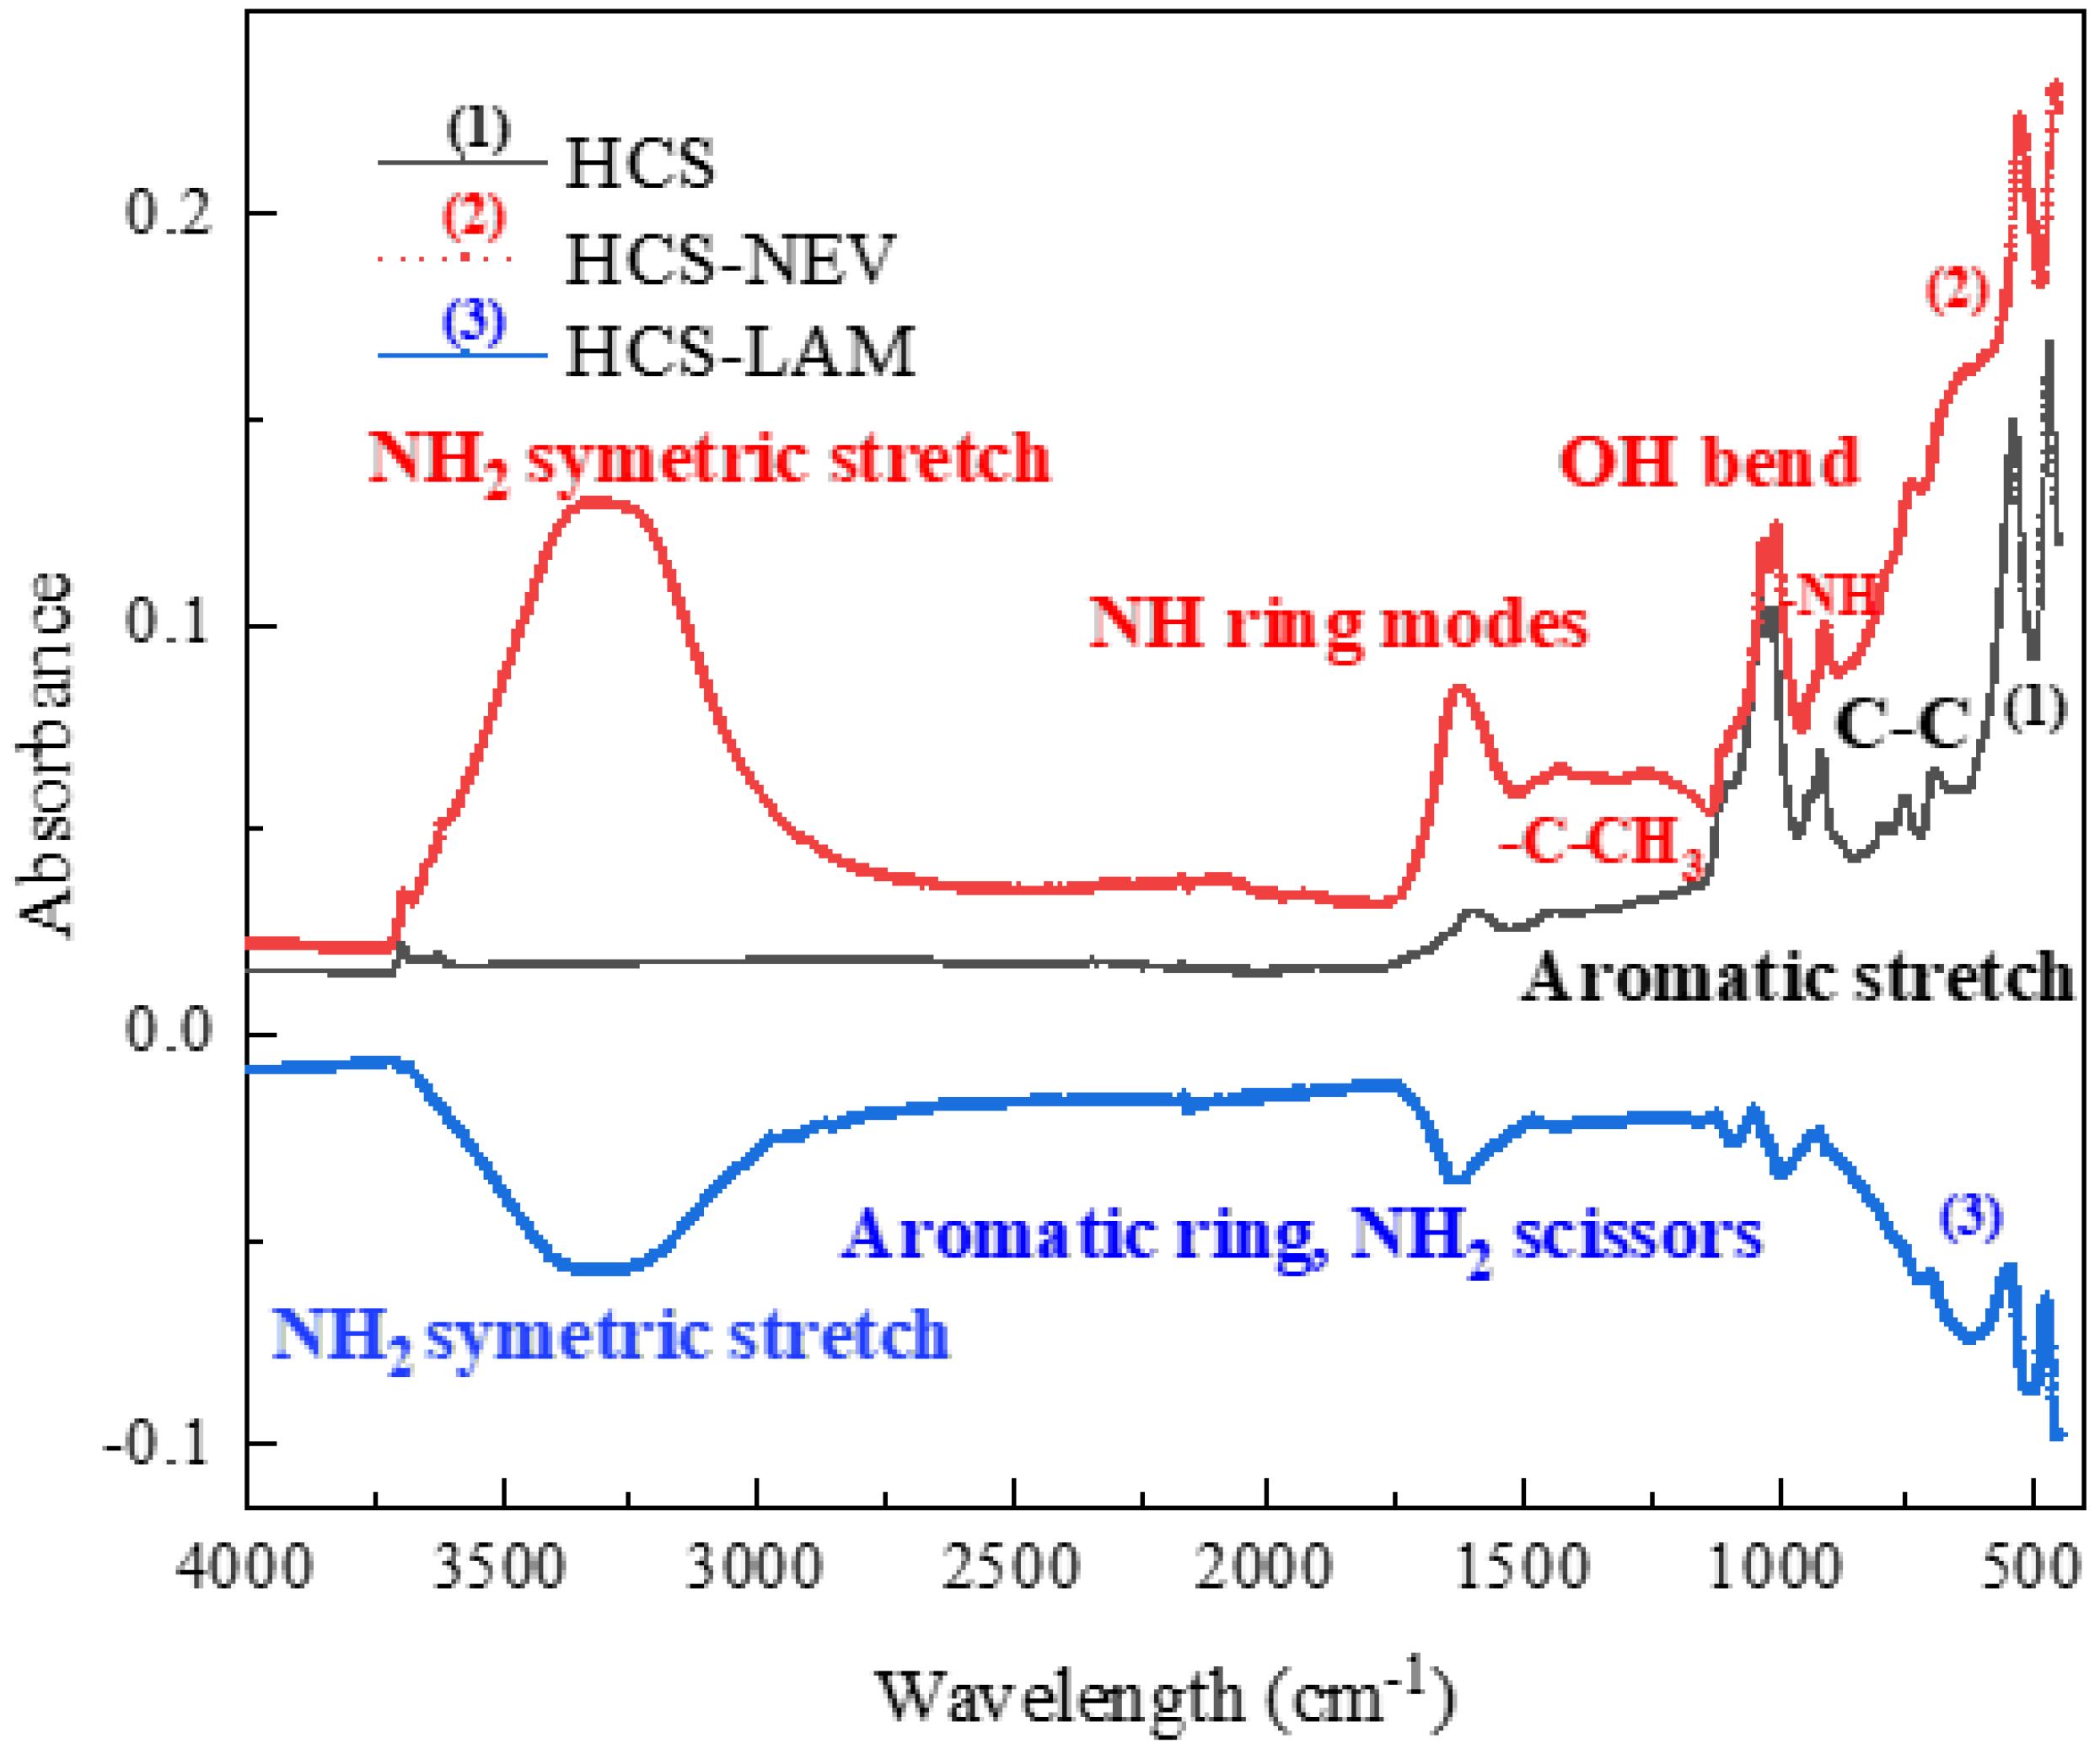
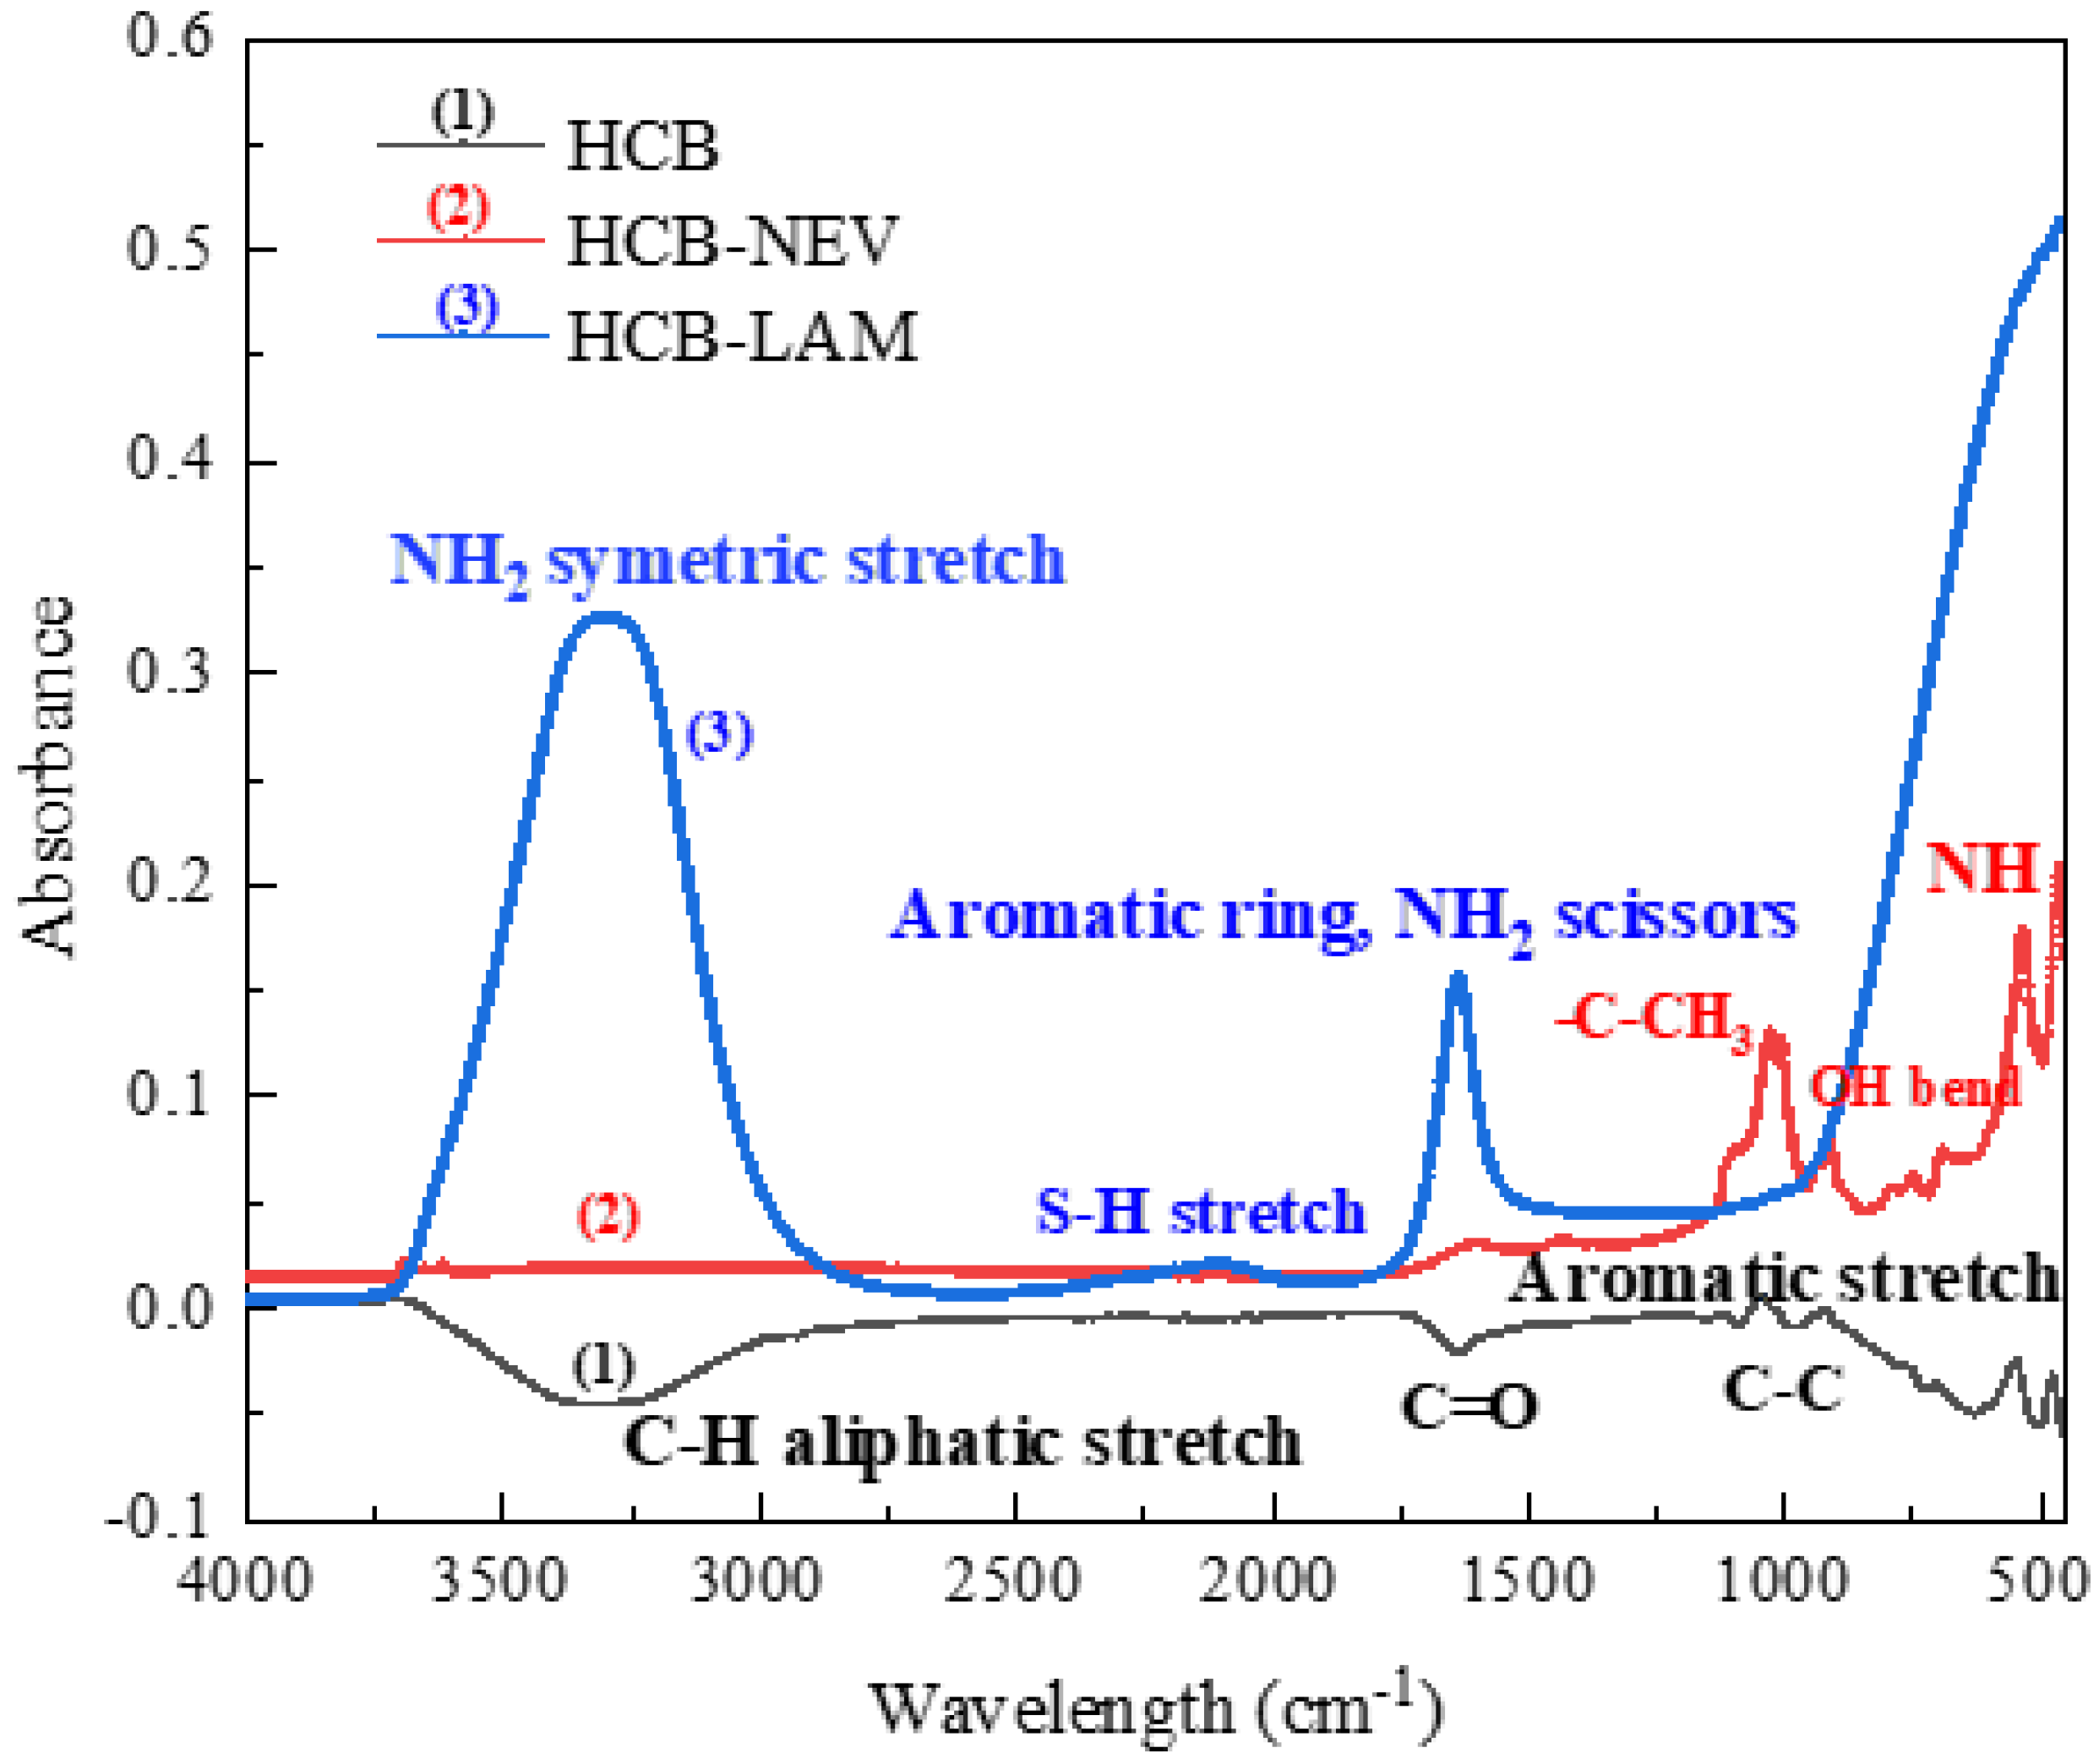
The FTIR spectra of NEV and LAM provided by John Wiley & Sons (2022) in Figure 9A,B were used as a reference to illustrate the changes of the chemical structural features of the hydrochar after adsorption of the drug molecules (Figure 10, Figure 11 and Figure 12) [49]. Spectra were interpreted using reference tables supplied by Smith Brian (2018) [50]. The enhanced peaks at wavelengths between 1700 cm−1 and 1350 cm−1 observed in Figure 10, Figure 11 and Figure 12 indicated NEV and LAM adsorption. The adsorption peaks identified at the wavelengths 3250 cm−1, 3000 cm−1, and 2250 cm−1 were attributed to the absorbed NH2, aliphatic C-H, and S-H stretch characteristics of the decomposition of NEV and LAM in water. The broad adsorption peaks of S-H stretch vibration validated the better performance of HCB for the adsorption of LAM (Figure 12), followed by HCT (Figure 10) and then HCS (Figure 11). According to Table 5, the high porosity of HCB enhanced its absorption capacity. The peaks found at 1650 cm−1 wavelength suggested the existence of double-bound carbonyl groups (C=O) associated with aromatic stretch, confirming the presence of cyclic hydrocarbons with carbonyl attached from NEV and LAM [51]. At 1600 cm−1 bands, which correspond to aromatic rings in the NH2 scissor structure, HCT–LAM has the highest peak intensity, followed by HCB and HCS (Figure 10). This demonstrated the ability of HCT to adsorb -NH2 groups because of its polarity caused by the hydrolysis equilibrium induced by the substitution of higher -OH bending vibrations groups of C11H8O (HCT) resulting in a lower probability of hydrogen bond formation [49]. The adsorption of -NH rings from NEV was characterized by the peaks seen at 1495 cm−1 and 1465 cm−1 in wavelength. In the HCB-NEV spectrum (Figure 12), the strength of the peaks was found to be greater than in the HCS (Figure 10) and HCT (Figure 11) spectra, respectively. This was owed to the increased aromatic ring presence in HCB as compared to HCT and HCS, which decreased the basicity of -NH and led to the delocalization of the lone pair of electrons on nitrogen. The displaced pair of electrons could then participate in hydrogen bonding (nitrogen alkyl groups) for the formation of imines or organic compounds containing nitrogen double bonds [52]. At a wavelength of 1420 cm−1, the OH and aldehyde bend vibrations were detected in the spectra of all residues, demonstrating the adsorption of NEV. This may be facilitated by the basic light produced by the dissolution of NEV, which promoted the substitution of CH3 groups by OH- and aldehydes. Peaks at 1385 cm−1 were attributable to the symmetric deformation associated with the -CH3 and –C-CH3 groups formed by the interaction of hydrophobic hydrochar with the NEV [53]. The -NH group was found at 1350 cm−1 in the spectra of NEV spent residues, demonstrating the connection between the aromatic ring and the dissolved amine groups of the non-nucleoside drug medication. Numerous peaks between 900 and 800 cm−1 correspond to aromatic species in aromatic rings, trans- and cis-CH2 in long saturated aromatic -CH-CH chains, C-O stretching vibration of ether groups, and O-H bending vibrations in phenolic, phenoxy, and hydroxybenzene structures. The FTIR results demonstrate the expansion of existing peaks and the emergence of new peaks in spent residues revealing a complex interaction between the HCs and the adsorbates.
The morphological characteristics of spent adsorbent residues were compared to those of the freshly synthesized HCs.
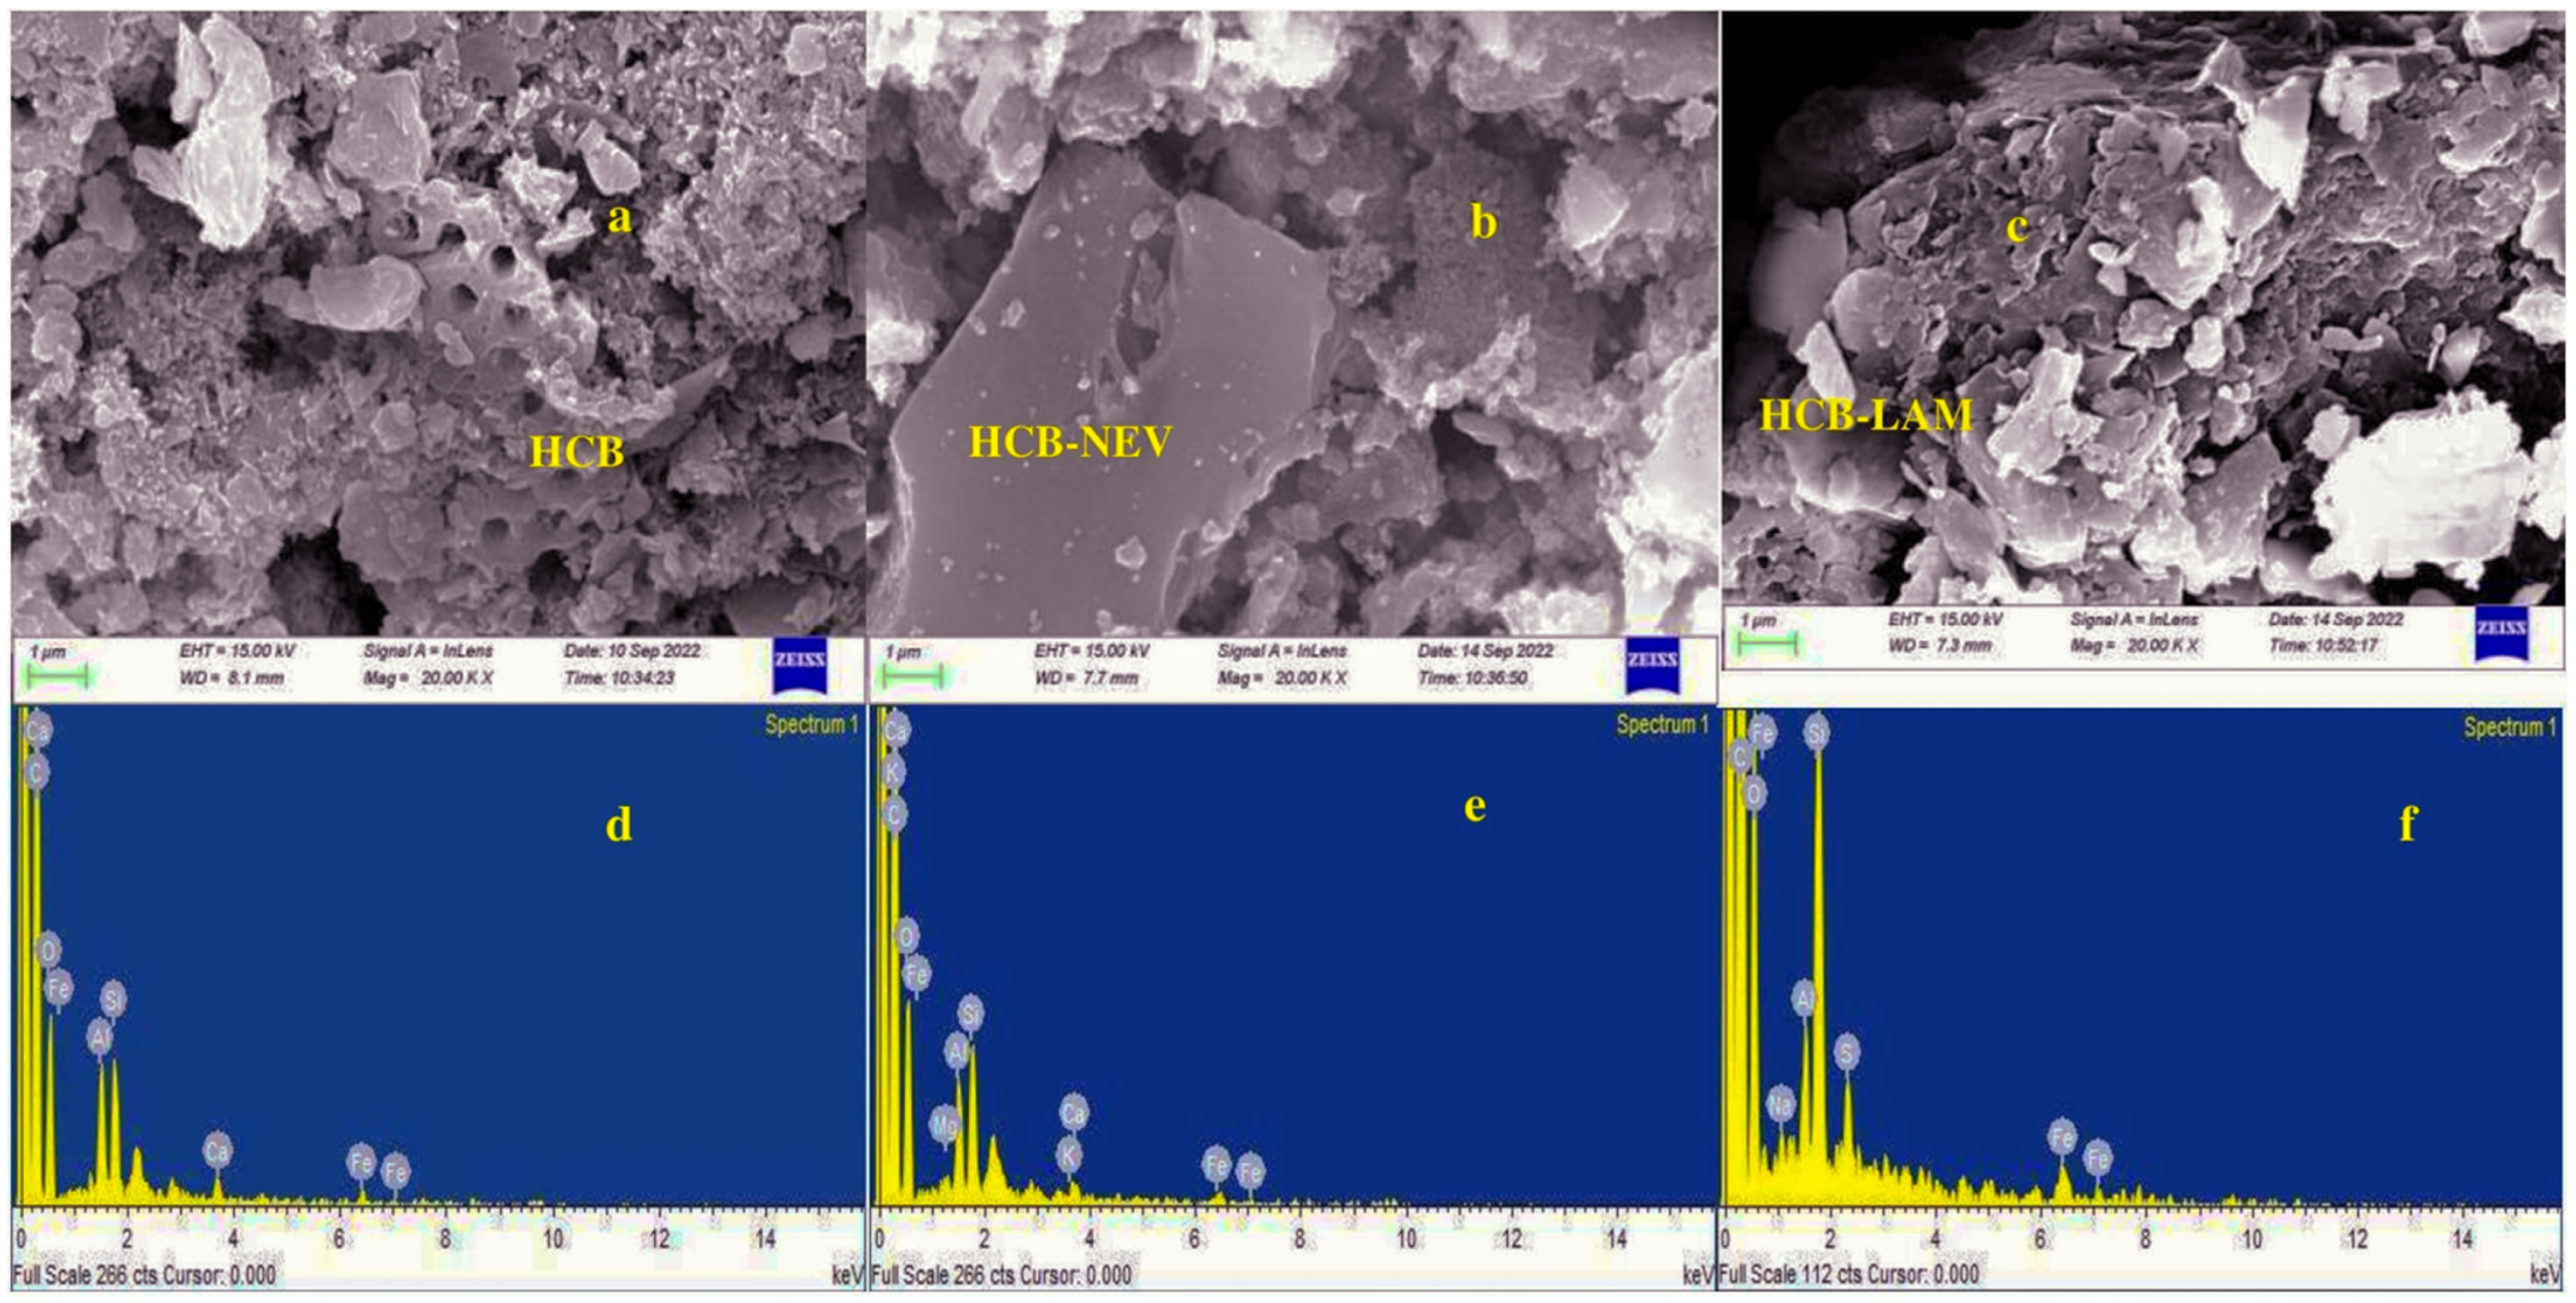
The results show that the surface of the HCs (Figure 6a, Figure 7a and Figure 8a) has a more uniform porous structure than the surface of the spent residues (Figure 6c,e, Figure 7c,e and Figure 8c,e), which lacked a discernible porous structure. The formed pores on the surfaces of HCs generated by HTC and Co-HTC process conditions were covered by absorbates that are roughly aggregated on their surfaces (NEV, LAM) (Figure 6c,e, Figure 7c,e and Figure 8c,e). During the adsorption process, the surface structural rearrangement of HCs, as seen on the surface of spent residues, may be an indication of the ability of HCs to trap drug molecules in its mesopores [26]. Sousa et al. (2022) demonstrated the ability of carbon compounds (activated carbon) formed from microwave pyrolysis of brewery wastes to adsorb dissolved pharmaceuticals (sulfamethoxazole, trimethoprim, and ciprofloxacin) [27]. The study showed that the adsorption performance of the carbon material is dependent on the material’s textural (porous) features and the adsorption equilibrium time. Effective contact between the adsorbent and adsorbates had an effect on the absorbent’s well-developed porous structures (0.67 cm3 g−1). This caused a dispersed distribution of adsorbates within the pores and altered the morphological characteristics of the absorbents [27]. This study, therefore, investigated the porous qualities of the generated HCs (total pore volume of 0.071 cm3 g−1, 0.048 cm3 g−1, and 0.38 cm3 g−1) as a potential characteristic for their use in the adsorption of dissolved pharmaceutical contaminants. The SEM pictures of the spent residues (Figure 6, Figure 7 and Figure 8a,c,e) reveal the efficiency of pharmaceutical components’ capture in the pores of the absorbents as minute particles that obscure the spots on the surface of HCs. In addition, the elemental composition of the adsorption residues (Figure 6, Figure 7 and Figure 8b,d,f) revealed a rise in carbon, sulfur, and the appearance of nitrogen peaks in comparison to the element spectra of HCs. This indicated evidence of components absorbed from the dissolved NEV and LAM onto the pores of the HCs, correlating with the proximate and ultimate analyses.
Kebede (2020), Ndilimeke Akawa (2021), and Zitha (2022) identified antiviral and other pharmaceutical compounds in bodies of water throughout their studies [12,13,14]. According to these findings, the maximum concentrations of nevirapine and lamivudine in South African ambient water were discovered at 1640 ng·L−1, posing a substantial environmental danger due to their potential harm to aquatic life and medication resistance in humans [14]. As a result, pharmaceutical-compound-removal strategies for bodies of water are required. Extensive investigations of the removal of these medications from water bodies have not yet been completed, most likely due to the significant cost of prospective remediation technologies [12,14]. Table 6 highlights selected recent adsorption studies for pharmaceutical product removal. Despite the fact that a large amount (100 g L−1) was required in this study for the efficient removal of nevirapine and lamivudine from water at ambient temperatures (rather than the 45 °C reported in most research), this investigation shows that HCs perform similarly to other synthetic adsorbents. Furthermore, because coal waste is readily available in South Africa and the HTC process is environmentally friendly, hydrochars formed from HCs could serve as excellent, cost-effective adsorbents for numerous pharmaceutical compounds discovered in water bodies.

3.5. Production and Evaluation of AC from Spent Hydrochar Residues from Nevirapine and Lamivudine Adsorption Tests

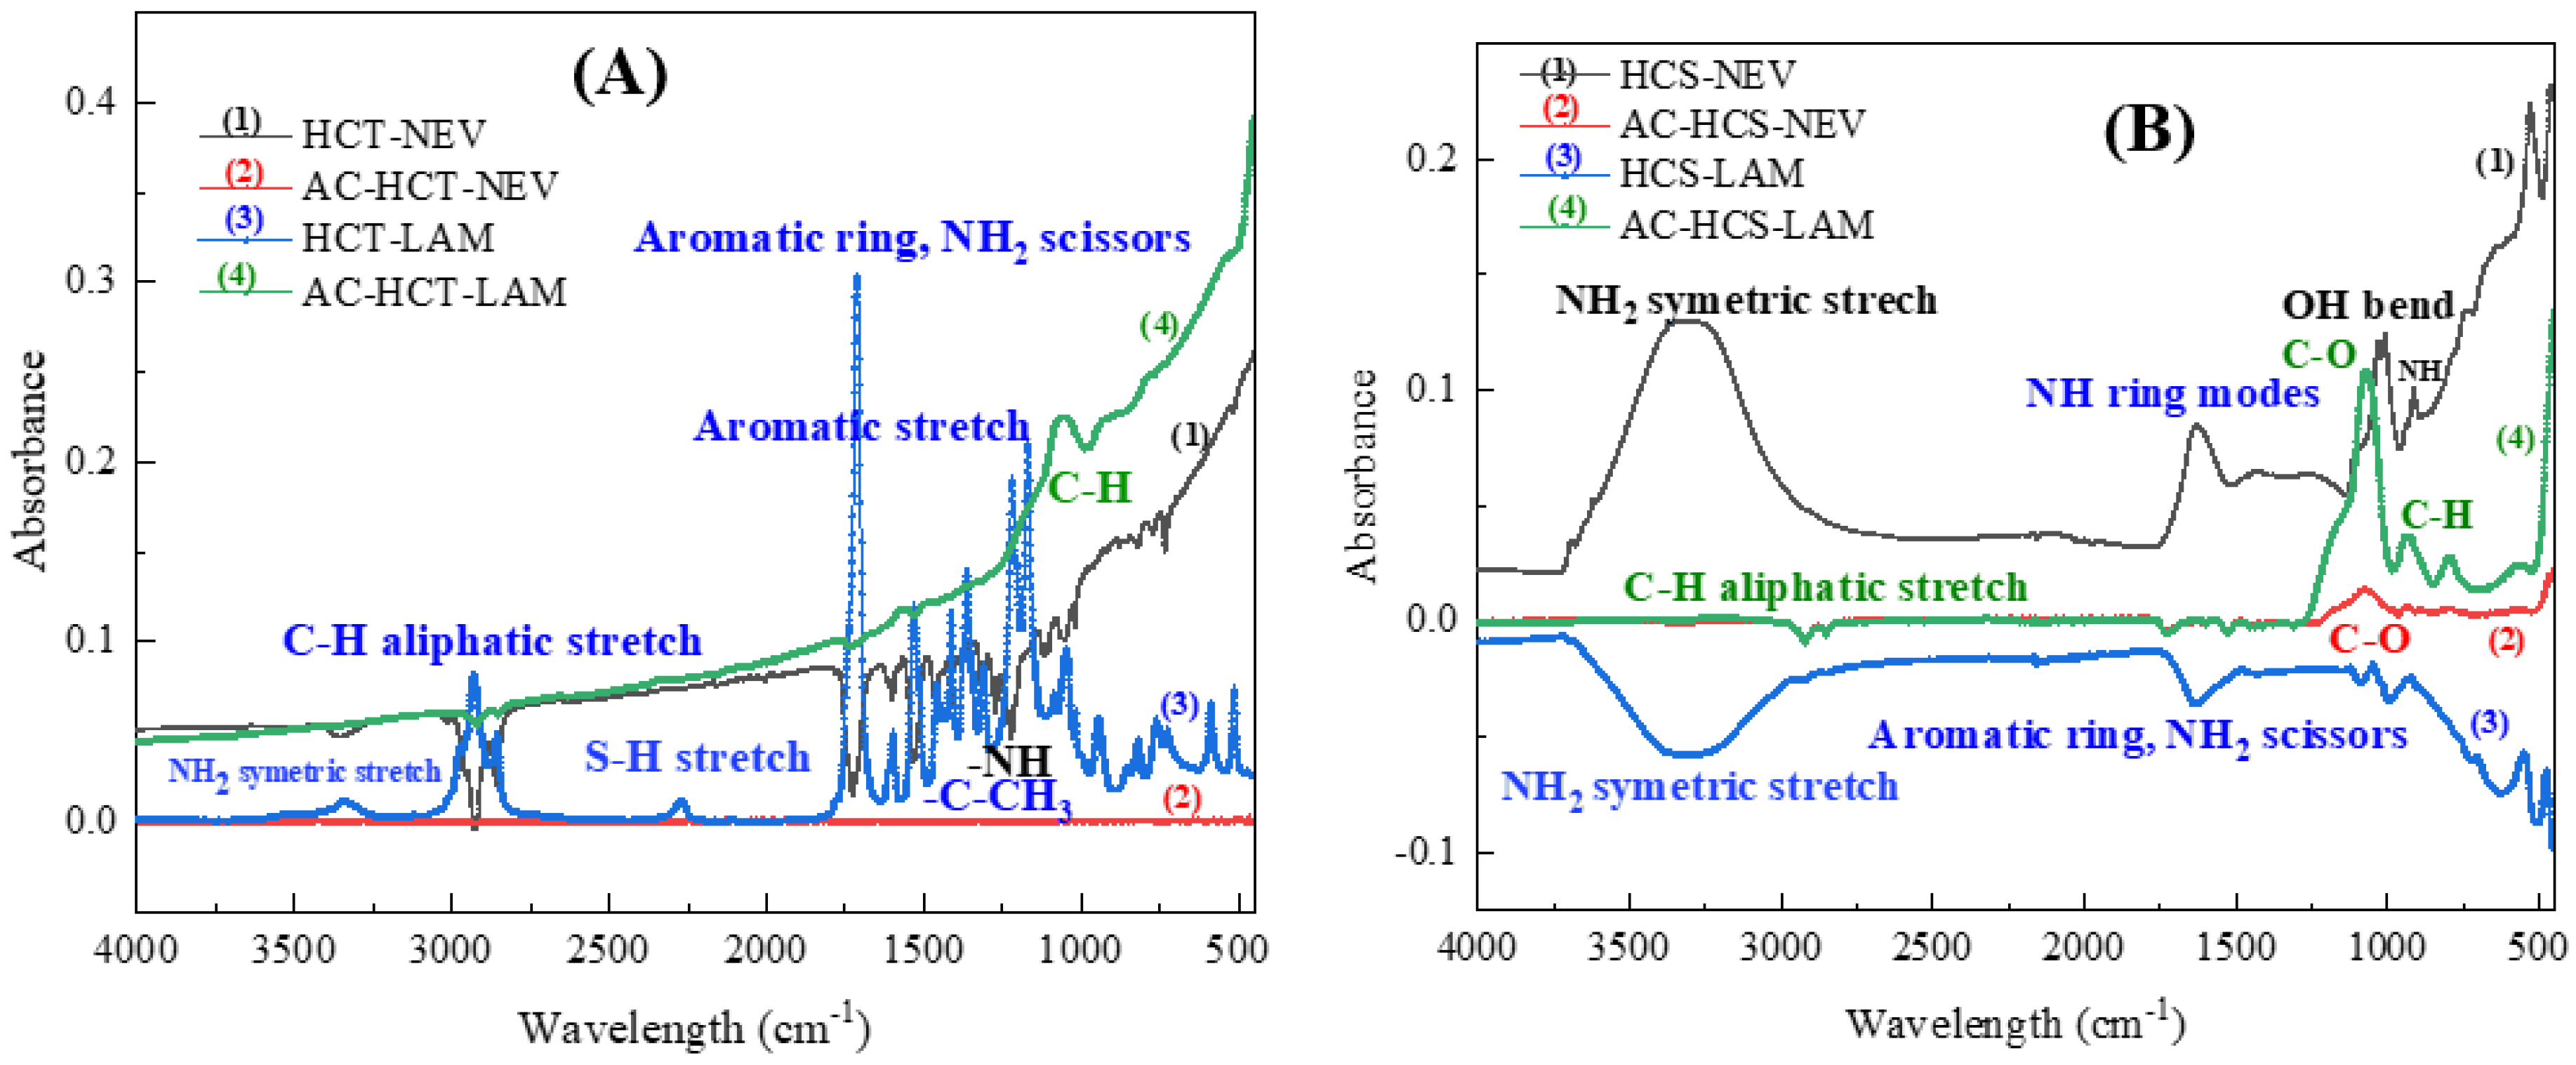
The Fourier transform infrared (FTIR) spectra of spent hydrochar residues from nevirapine and lamivudine adsorption tests and produced ACs are displayed in Figure 13 and Figure 14. The observation of these spectra revealed the impact of the activation process which led to a significant decrease, and in some cases disappearance, of adsorption peaks. This demonstrates the effectiveness of functional group removal resulting in the transformation of chemically active sites [72].
The FTIR spectra of the produced ACs presented in Figure 13 and Figure 14 depicted few peaks which indicates fewer functional groups (Smith Brian, 2018). The peak at 3430 cm−1 is observed only on the spectra of AC–HCB–LAM (Figure 14) and could be assigned to the remaining amines stretch after the activation process [73]. The peak observed at the adsorption band of 2900 cm−1 and 750 cm−1 on the spectra of AC–HCT–LAM and AC–HCS–LAM (Figure 13) indicates the presence of C–H aliphatic stretching vibrations. arising from C-CH3 groups of the hydrochar [74]. The peaks at 1650 cm−1 observed on the spectra of AC–HCB–LAM confirmed the presence of amine group NH2 (Figure 14) [73]. The identified peaks at 1050 cm−1 indicate the presence of the C–O bond and of –C–OH from carboxylic acids, alcohols, and phenols [75] whereas the peaks at 1125 cm−1 possibly result from C=C vibrations of aromatic rings in the AC–HCB–NEV and AC–HCB–LAM (Figure 14) [76].
The morphologies of the produced ACs from spent hydrochar residues from nevirapine and lamivudine adsorption tests are presented in Figure 15. The results show a surface transformation from irregular and rough surfaces (Figure 7 and Figure 8c,e) to a more porous surface of ACs (Figure 15). In addition, the distribution of pores on the surface images of ACs seemed heterogeneous (Figure 15). This is possibly due to the chemical activation reaction between KOH and the carbon structure of the residues, and most of the organic volatiles evolved, leaving behind the ruptured surface of ACs with many pores [77]. The diffusion of KOH molecules into the pores of the carbonaceous processor during the activation process tended to increase the KOH–carbon interaction and created more pores ultimately increasing the SBET and pore volume of the produced ACs [77].
The porosity helps in the diffusion of electrolyte ions at the charging–discharging process of supercapacitor cells and thus increases the capacitance performance of the synthesized device [73].
The BET results obtained from the analysis of the N2 adsorption/desorption isotherm at 77 K for the produced ACs are represented in Table 7. The highest SBET of 2047.5 m2/g and the lowest SBET of 436.5 m2/g, but higher than the lowest SBET of common activated carbons (290 m2/g), were obtained from the AC–HCT–NEV and AC–HCB–NEV, respectively [78]. This could be due to the relatively high carbon (C-C) bonds identified in the HCT–NEV spectra presented on Figure 10 compared to other spent residues. Under activation conditions, carbon bonds break and create complexes with KOH on the carbon silica matrices [79]. The average pore diameter and pore volume were in the range of 2.23 nm to 3.13 nm and 0.373 cm3/g and 1.14 cm3/g, respectively, which make the produced ACs predominated by mesopores (2–50 nm). Though Darweesh (2017) has demonstrated that mesoporosity is favorable for adsorption-based applications, the synthesized ACs could be beneficial for electrochemical applications [61]. Table 7 summarizes the BET results for the produced ACs using spent hydrochar residues from nevirapine and lamivudine adsorption tests. The results indicate that the SBET increase is influenced by the generation of pores on the carbon silica matrices [80]. Possibly, the KOH–carbon matrix interaction favored the dilatation of the carbon structure which expends the cross-linked matrix of the CM and generates pores after the acid-washing step [81].

3.6. Electrochemical Characterization

Figure 16a depicts the cyclic voltammograms (CV) of the produced ACs at a scan rate of 100 mV/s, demonstrating that all sweep curves are symmetric on the positive and negative sweeps and the currents at 0 V for electrodes made of different ACs change. The electrodes built from AC–HCT–NEV (A1) and AC–HCT–LAM (A2) outperform the other four AC electrodes tested (0.016 mA, 1 V, and 0.015 mA, 1 V), as indicated by the high current and nearly ideal standard rectangle [82]. This is consistent with the high SBET, total volume, and micropore volume of the two ACs shown in Table 7. This demonstrates that the textural structure of the AC electrode has a significant impact on the electric conductivity qualities [83]. The roughly rectangular cyclic voltammetry shape implies that the AC electrodes have rapid dynamics and good charge propagation. The charge storage mechanism of the ACs was described from the evaluation of the scan rates effect. The observation of the results (Figure 16a) revealed that the AC electrode exhibited potential independent double-layer capacitance between appreciable voltage ranges of polarization [84]. Figure 16a shows an approximately ideal double-layer trend, and the rectangular sharp specific to electrochemical capacitance was seen at the tested scan rate.
Equation (6) below was used to determine the specific capacitance of the AC electrode from the CV presented in Figure 16a.
C = ( I a I c 2 v . m ) = ( Δ I 2 v . m )
where C is the specific capacitance (F/g), DI is the average of anodic and cathodic current, v is the potential scan rate (V/s), and m is the mass of the electrode.
The specific capacitance of the produced AC electrode was in the range of 20 to 100 Fg−1 at scan rates of 10 to 100 mVs−1. The results obtained are in agreement with prior work which shows that the specific capacitance of electrodes increase is a complex fact not depending only on the specific surface area SBET [85].
Additionally, the results presented in Figure 16b show that the specific capacitance depends on the porous structure of the electrode (Table 7). The presence of macropores in AC–HCT–NEV may favor electrolyte ion displacement into the porous material. As a result, the electrolyte ions can only settle in some of the electrode’s pores to form the double layer [86]. At a current density of 10 A/g for ions transportation, the micropores’ accessibility decreases from AC–HCT–NEV (A1) to other ACs and even becomes inaccessible for AC–HCB–NEV (C1) and thus does not assist in the total double-layer capacitance of the porous electrode, resulting in a null specific capacitance [87]. The resonance of narrowed pores (micropores) could increase the ions’ mobility at high temperatures [87]. The results of this investigation reveal that when the SBET of the electrode increases, so does the specific capacitance. Furthermore, additional properties of the porous carbonaceous material, such as pore size distribution and surface chemistry, influence its electrochemical capacity (AC–HCB–NEV and AC–HCB–LAM). Furthermore, the ACs produced from NEV and LAM adsorption residues using HC absorbents exhibited good reversibility and stability, as observed from the ideal double-layer behavior shown in Figure 16a [88], implying that the produced ACs could be used as excellent electrodes for supercapacitor devices with current densities ranging from 1A/g to 5 A/g in energy storage applications.
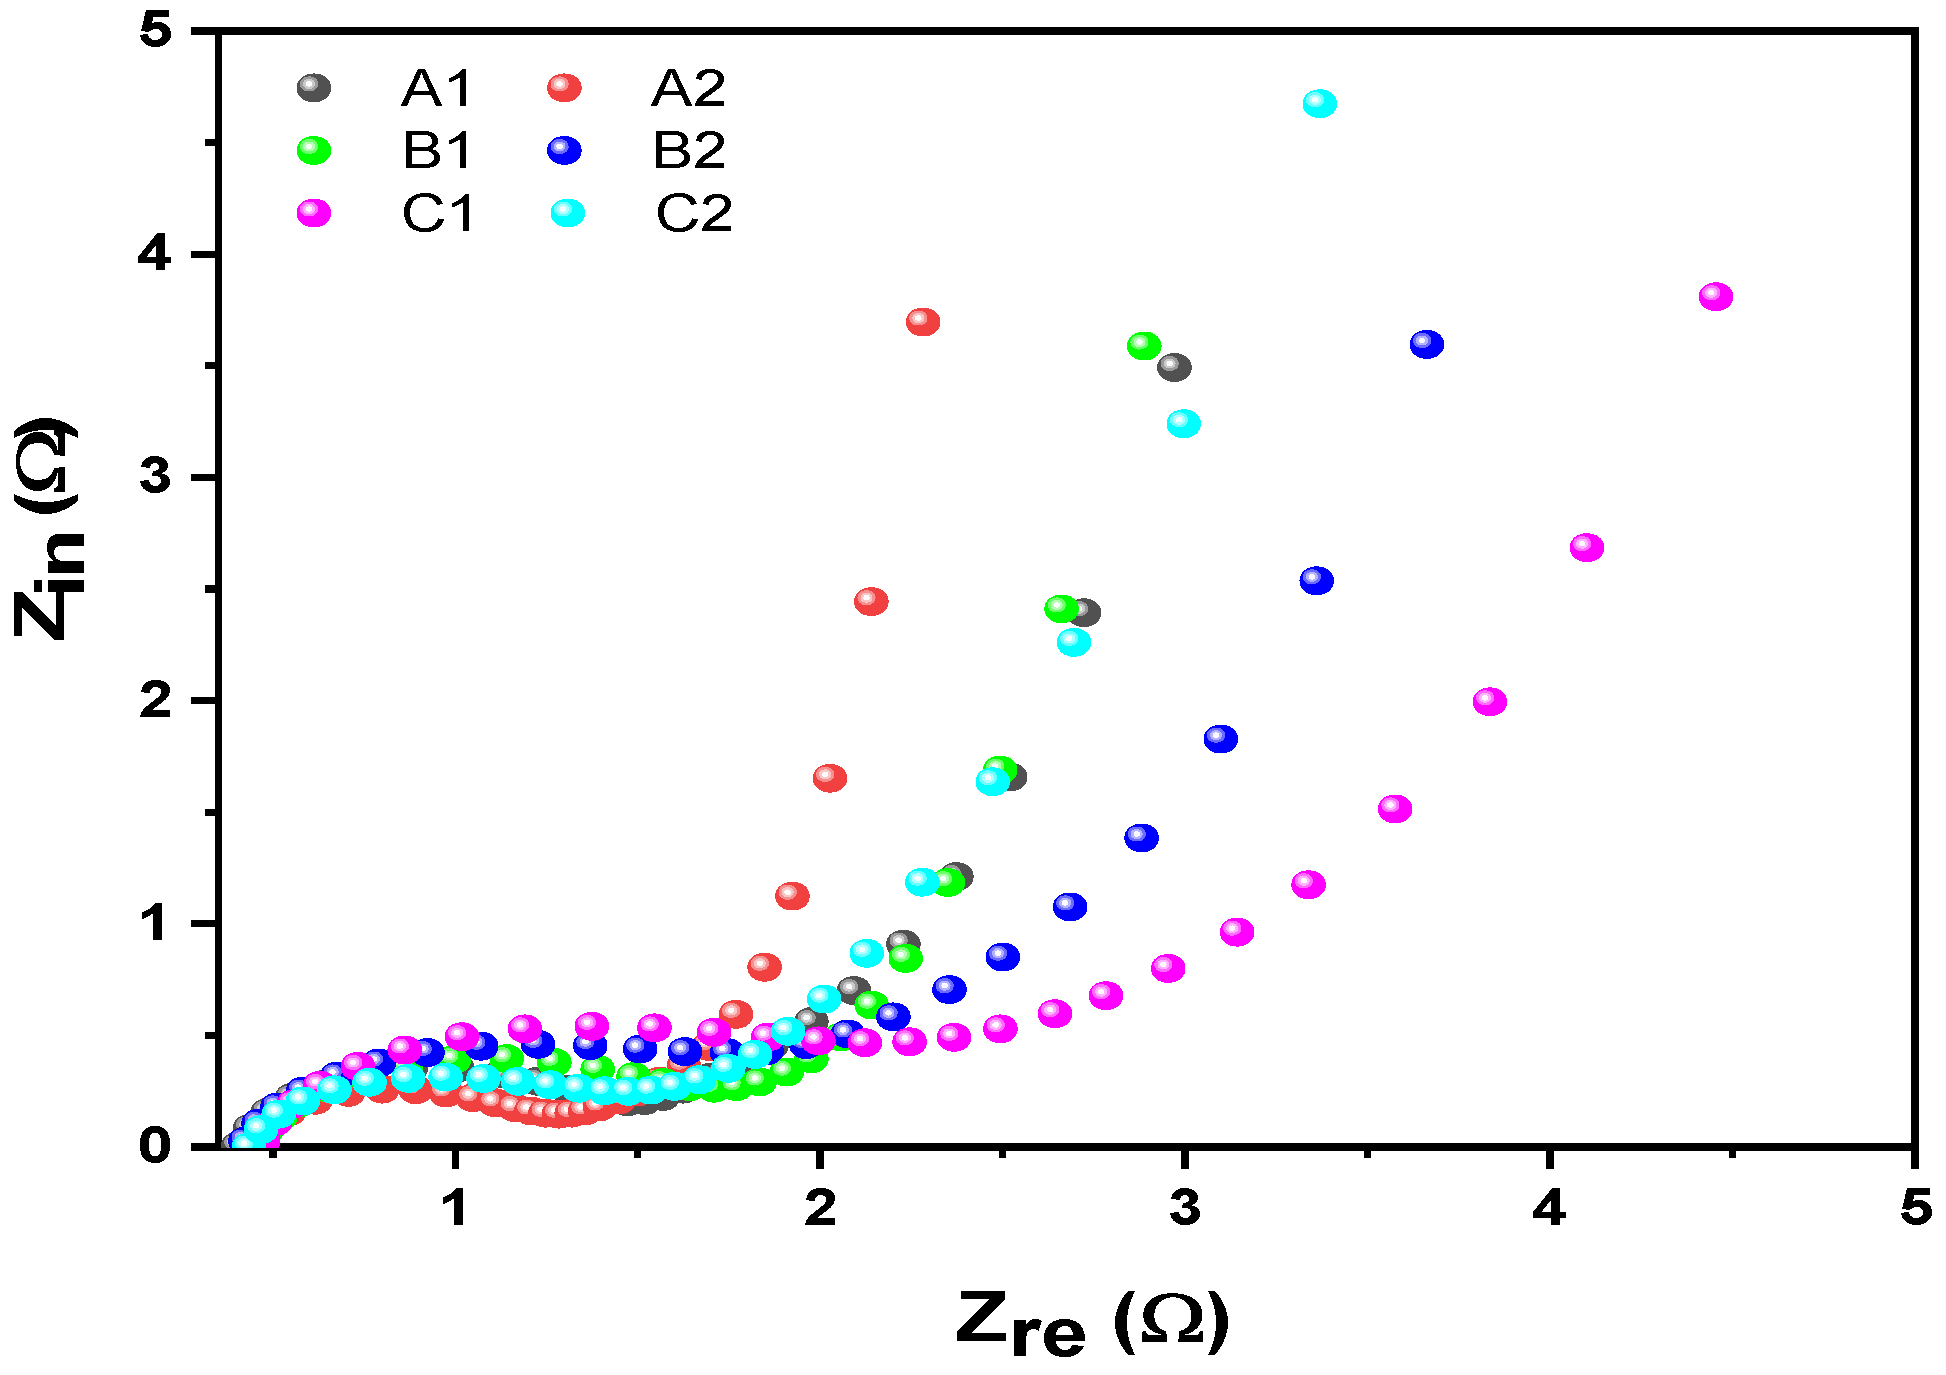
Figure 17 shows the electrochemical impedance spectroscopy (EIS) results of AC electrode, which might be used to test different circuit models for data fitting. Electro-active regions, specific capacitance, and charge transfer resistance of electrodes obtained from CV and EIS studies were evaluated [89]. The spectra depict the contact resistance and material resistance (electrode materials, electrolyte, and separator) values that prevent ions from entering the pores of electrode materials, as well as ion mobility in the solution and separator. The real axis is set at 3.5 Ω, suggesting that the AC–HCT–LAM (A2) electrode has a lower contact resistance and higher conductivity than the other five electrodes [88]. At lower frequencies, the slope of the AC curves increases from AC–HCT–LAM (A2), which is roughly vertical, to AC–HCB–NEV (C1), which acquired a considerable slope, indicating that the ions in the electrolyte are difficult to enter the pores of AC–HCB–NEV, as previously described. As a result, the manufactured AC electrodes have a high potential electrode of an electrochemical double-layer capacitor due to their wide electro-active area [89]. The findings indicate that the structural characteristics of the carbon–silica linkages impact the electrochemical properties of the ACs. The release of volatile matter during the activation process creates pores in the structure of the spent adsorption residues, whereas silica, a component of ash content from the HCs precursors (Table 1), remains in the matrix of the produced ACs, reducing its porosity and, as a result, its electrochemical conductivity [90]. As a result, applying strong compression pressure to the synthesized ACs may shatter the individual particles and condense the materials. This might pull individual particles closer together with other nearby particles, increasing the conductivity of the ACs [88,90]. The higher density of the AC produced at high pressure causes potential electron mobility across the material, increasing its electrical conductivity. Nonetheless, the reduced density of AC at low compression pressure leaves large voids between the particles of the carbon matrix, reducing electron mobility dramatically. As a result, the electrical conductivity of the AC used decreases.

4. Conclusions

This study examined the effects of various parameter interactions on the textural structure of hydrochars produced via hydrothermal (HTC) and co-hydrothermal (Co-HTC) treatments of CD and sewage sludge (wastes), as well as the subsequent utilization of the hydrochars (HCs) synthesized for HIV drug (nevirapine and lamivudine) removal from wastewater. The HCB synthesized from Co-HTC had a high SBET of 20.35 m2/g and pore volume of 0.38 cm3/g, resulting in significant adsorptive removals of NEV and LAM (97.19% and 93.32%), respectively. Despite being less effective than HCB, HCT and HCS displayed good NEV and LAM adsorption capacities. The use of coal waste and sewage sludge for the synthesis of hydrochar for the adsorption of dissolved pharmaceutical-resistant substances might be a cost-effective and environmentally friendly option in wastewater treatment. Furthermore, the use of spent adsorption residues for energy storage applications was examined further. The results reveal that spent adsorption residues are an excellent carbonaceous material precursor for the manufacture of EDLCs. This research has shown that using low-cost HTC technologies to generate value-added carbonaceous material (hydrochar) from coal waste and sewage sludge waste could be a long-term recycling strategy that reduces disposal costs while also addressing any environmental contamination caused by the release or solubilization of toxic compounds in these wastes as a result of landfill disposal. However, additional kinetics study and thermodynamic analyses are necessary to offer a deeper knowledge of HTC and Co-HTC reaction processes, as is the development and testing of a continuous ARVs components adsorption method, as well as its implications for large-scale industrial use. A life cycle evaluation of the hydrothermal treatment and adsorption procedures may also be necessary to determine the long-term sustainability of the options described in this study.

Author Contributions

Conceptualization, S.B. and J.M.; Data curation, G.M.K.; Formal analysis, G.M.K. and J.M.; Funding acquisition, S.B.; Investigation, G.M.K.; Methodology, G.M.K.; Project administration, S.B.; Resources, S.B. and J.M.; Supervision, S.B. and J.M.; Validation, G.M.K.; Visualization, G.M.K.; Writing—original draft, G.M.K.; Writing—review & editing, J.M. All authors have read and agreed to the published version of the manuscript.

Funding

DSI-NRF SARChI and Coaltech Research Association of South Africa, funding for the first author is acknowledged.

Institutional Review Board Statement

Not applicable.

Informed Consent Statement

Not applicable.

Data Availability Statement

The datasets used and/or analyed during the current study are available from the corresponding author (email: [email protected]) upon reasonable request.

Conflicts of Interest

The authors have no affiliation with any organization with a direct or indirect financial interest in the subject matter discussed in the manuscript.

References

  1. Blesa, M.J.; Miranda, J.L.; Moliner, R.; Izquierdo, M.T.; Palacios, J.M. Low-temperature co-pyrolysis of a low-rank coal and biomass to prepare smokeless fuel briquettes. J. Anal. Appl. Pyrolysis 2003, 70, 665–677. [Google Scholar] [CrossRef]
  2. Mills, E.L.; Ryan, D.G.; Prag, H.A.; Dikovskaya, D.; Menon, D.; Zaslona, Z.; Jedrychowski, M.P.; Costa, A.S.H.; Higgins, M.; Hams, E. Itaconate is an anti-inflammatory metabolite that activates Nrf2 via alkylation of KEAP1. Nature 2018, 556, 113–117. [Google Scholar] [CrossRef] [PubMed] [Green Version]
  3. Onifade, M.; Genc, B.; Bada, S. Spontaneous combustion liability between coal seams: A thermogravimetric study. Int. J. Min. Sci. Technol. 2020, 30, 691–698. [Google Scholar] [CrossRef]
  4. Water Resources Research Catalog; Water Resources Scientific Information Center, Office of Water Research and Technology, US Department of the Interior: Washington, DC, USA, 1975; Volume 10.
  5. Libhaber, M.; Orozco-Jaramillo, Á. Sustainable Treatment and Reuse of Municipal Wastewater: For Decision Makers and Practicing Engineers; Iwa Publishing: London, UK, 2012. [Google Scholar]
  6. Zhou, G.; Gu, Y.; Yuan, H.; Gong, Y.; Wu, Y. Selecting sustainable technologies for disposal of municipal sewage sludge using a multi-criterion decision-making method: A case study from China. Resour. Conserv. Recycl. 2020, 161, 104881. [Google Scholar] [CrossRef]
  7. Kacprzak, M.; Neczaj, E.; Fijałkowski, K.; Grobelak, A.; Grosser, A.; Worwag, M.; Rorat, A.; Brattebo, H.; Almås, Å.; Singh, B.R. Sewage sludge disposal strategies for sustainable development. Environ. Res. 2017, 156, 39–46. [Google Scholar] [CrossRef]
  8. del Rio, C. The g Lobal HIV epidemic: What the pathologist needs to know. Semin. Diagn. Pathol. 2017, 34, 314–317. [Google Scholar] [CrossRef]
  9. Tompa, D.R.; Immanuel, A.; Srikanth, S.; Kadhirvel, S. Trends and strategies to combat viral infections: A review on FDA approved antiviral drugs. Int. J. Biol. Macromol. 2021, 172, 524–541. [Google Scholar] [CrossRef]
  10. Evans, D.B.; Hsu, J.; Boerma, T. Universal health coverage and universal access. Bull. World Health Organ. 2013, 91, 546–546A. [Google Scholar] [CrossRef]
  11. Reddy, K.; Renuka, N.; Kumari, S.; Bux, F. Algae-mediated processes for the treatment of antiretroviral drugs in wastewater: Prospects and challenges. Chemosphere 2021, 280, 130674. [Google Scholar] [CrossRef]
  12. Kebede, T.G.; Seroto, M.B.; Chokwe, R.C.; Dube, S.; Nindi, M.M. Adsorption of antiretroviral (ARVs) and related drugs from environmental wastewaters using nanofibers. J. Environ. Chem. Eng. 2020, 8, 104049. [Google Scholar] [CrossRef]
  13. Ndilimeke Akawa, M.; Mogolodi Dimpe, K.; Nosizo Nomngongo, P. An adsorbent composed of alginate, polyvinylpyrrolidone and activated carbon (AC@PVP@alginate) for ultrasound-assisted dispersive micro-solid phase extraction of nevirapine and zidovudine in environmental water samples. Environ. Nanotechnol. Monit. Manag. 2021, 16, 100559. [Google Scholar] [CrossRef]
  14. Zitha, A.B.; Ncube, S.; Mketo, N.; Nyoni, H.; Madikizela, L.M. Antiretroviral Drugs in Water: An African Challenge with Kenya and South Africa as Hotspots and Plausible Remediation Strategies. Chem. Afr. 2022, 5, 1237–1253. [Google Scholar] [CrossRef]
  15. Abafe, O.A.; Späth, J.; Fick, J.; Jansson, S.; Buckley, C.; Stark, A.; Pietruschka, B.; Martincigh, B.S. LC-MS/MS determination of antiretroviral drugs in influents and effluents from wastewater treatment plants in KwaZulu-Natal, South Africa. Chemosphere 2018, 200, 660–670. [Google Scholar] [CrossRef] [PubMed]
  16. Hauser, A.; Sewangi, J.; Mbezi, P.; Dugange, F.; Lau, I.; Ziske, J.; Theuring, S.; Kuecherer, C.; Harms, G.; Kunz, A. Emergence of Minor Drug-Resistant HIV-1 Variants after Triple Antiretroviral Prophylaxis for Prevention of Vertical HIV-1 Transmission. PLoS ONE 2012, 7, e32055. [Google Scholar] [CrossRef] [PubMed]
  17. Obidike, L.; Mulopo, J. Effect of High Concentration of Nevirapine on the Growth of E. Coli in Wastewater Treatment. In Proceedings of the World Congress on Engineering and Computer Science 2018, San Francisco, CA, USA, 23–25 October 2018; Volume 2. [Google Scholar]
  18. Whiteley, L.; Olsen, E.; Mena, L.; Haubrick, K.; Craker, L.; Hershkowitz, D.; Brown, L.K. A Mobile Gaming Intervention for Persons on Pre-Exposure Prophylaxis: Protocol for Intervention Development and Randomized Controlled Trial. JMIR Res. Protoc. 2020, 9, e18640. [Google Scholar] [CrossRef] [PubMed]
  19. Deeks, E.D. Bictegravir/Emtricitabine/Tenofovir Alafenamide: A Review in HIV-1 Infection. Drugs 2018, 78, 1817–1828. [Google Scholar] [CrossRef] [Green Version]
  20. Swanepoel, C.R.; Atta, M.G.; D’Agati, V.D.; Estrella, M.M.; Fogo, A.B.; Naicker, S.; Post, F.A.; Wearne, N.; Winkler, C.A.; Cheung, M. Kidney Disease in the Setting of HIV Infection: Conclusions from a Kidney Disease: Improving g Lobal Outcomes (KDIGO) Controversies Conference. Nefrol. (St.-Peterbg.) 2018, 22, 84–100. [Google Scholar] [CrossRef]
  21. Yaqoob, A.A.; Parveen, T.; Umar, K.; Mohamad Ibrahim, M.N. Role of Nanomaterials in the Treatment of Wastewater: A Review. Water 2020, 12, 495. [Google Scholar] [CrossRef] [Green Version]
  22. World Health Organization. World Health Statistics 2016: Monitoring Health for the SDGs Sustainable Development Goals; World Health Organization: Geneva, Switzerland, 2016. [Google Scholar]
  23. Prasse, C.; Schlüsener, M.P.; Schulz, R.; Ternes, T.A. Antiviral Drugs in Wastewater and Surface Waters: A New Pharmaceutical Class of Environmental Relevance? Environ. Sci. Technol. 2010, 44, 1728–1735. [Google Scholar] [CrossRef]
  24. Adeola, A.O.; Forbes, P.B.C. Antiretroviral Drugs in African Surface Waters: Prevalence, Analysis, and Potential Remediation. Environ. Toxic Chem. 2022, 41, 247–262. [Google Scholar] [CrossRef]
  25. Kovalakova, P.; Cizmas, L.; McDonald, T.J.; Marsalek, B.; Feng, M.; Sharma, V.K. Occurrence and toxicity of antibiotics in the aquatic environment: A review. Chemosphere 2020, 251, 126351. [Google Scholar] [CrossRef] [PubMed]
  26. Silva, A.; Delerue-Matos, C.; Figueiredo, S.; Freitas, O. The Use of Algae and Fungi for Removal of Pharmaceuticals by Bioremediation and Biosorption Processes: A Review. Water 2019, 11, 1555. [Google Scholar] [CrossRef] [Green Version]
  27. Sousa, É.M.L.; Otero, M.; Rocha, L.S.; Gil, M.V.; Ferreira, P.; Esteves, V.I.; Calisto, V. Multivariable optimization of activated carbon production from microwave pyrolysis of brewery wastes—Application in the removal of antibiotics from water. J. Hazard. Mater. 2022, 431, 128556. [Google Scholar] [CrossRef] [PubMed]
  28. Peng, B.; Chen, L.; Que, C.; Yang, K.; Deng, F.; Deng, X.; Shi, G.; Xu, G.; Wu, M. Adsorption of Antibiotics on Graphene and Biochar in Aqueous Solutions Induced by π-π Interactions. Sci. Rep. 2016, 6, 31920. [Google Scholar] [CrossRef] [PubMed] [Green Version]
  29. Yaqoob, A.A.; Ahmad, H.; Parveen, T.; Ahmad, A.; Oves, M.; Ismail, I.M.I.; Qari, H.A.; Umar, K.; Mohamad Ibrahim, M.N. Recent Advances in Metal Decorated Nanomaterials and Their Various Biological Applications: A Review. Front. Chem. 2020, 8, 341. [Google Scholar] [CrossRef]
  30. Maqhuzu, A.B.; Yoshikawa, K.; Takahashi, F. Stochastic economic analysis of coal-alternative fuel production from municipal solid wastes employing hydrothermal carbonization in Zimbabwe. Sci. Total Environ. 2020, 716, 135337. [Google Scholar] [CrossRef]
  31. Ahmed, M.J.; Hameed, B.H. Removal of emerging pharmaceutical contaminants by adsorption in a fixed-bed column: A review. Ecotoxicol. Environ. Saf. 2018, 149, 257–266. [Google Scholar] [CrossRef]
  32. Lan, H.; Tao, Q.; Ma, N.; Chen, L.; Wei, L.; Weng, M.; Dai, Q. Electrochemical oxidation of lamivudine using graphene oxide and Yb co-modified PbO2 electrodes: Characterization, influencing factors and degradation mechanisms. Sep. Purif. Technol. 2022, 301, 121856. [Google Scholar] [CrossRef]
  33. Abdulsalam, J.; Mulopo, J.; Oboirien, B.; Bada, S.; Falcon, R. Experimental evaluation of activated carbon derived from South Africa discard coal for natural gas storage. Int. J. Coal. Sci. Technol. 2019, 6, 459–477. [Google Scholar] [CrossRef] [Green Version]
  34. Wazir, A.H.; Haq, I.; Manan, A.; Khan, A. Preparation and characterization of activated carbon from coal by chemical activation with KOH. Int. J. Coal Prep. Util. 2022, 42, 1477–1488. [Google Scholar] [CrossRef]
  35. Adinaveen, T.; Kennedy, L.J.; Vijaya, J.J.; Sekaran, G. Studies on structural, morphological, electrical and electrochemical properties of activated carbon prepared from sugarcane bagasse. J. Ind. Eng. Chem. 2013, 19, 1470–1476. [Google Scholar] [CrossRef]
  36. Kong, L.; Ostadhassan, M.; Hou, X.; Mann, M.; Li, C. Microstructure characteristics and fractal analysis of 3D-printed sandstone using micro-CT and SEM-EDS. J. Pet. Sci. Eng. 2019, 175, 1039–1048. [Google Scholar] [CrossRef]
  37. Afolabi, O.O.D.; Sohail, M.; Cheng, Y.-L. Optimisation and characterisation of hydrochar production from spent coffee grounds by hydrothermal carbonisation. Renew. Energy 2020, 147, 1380–1391. [Google Scholar] [CrossRef]
  38. Tsai, W.-T.; Liu, S.-C.; Hsieh, C.-H. Preparation and fuel properties of biochars from the pyrolysis of exhausted coffee residue. J. Anal. Appl. Pyrolysis 2012, 93, 63–67. [Google Scholar] [CrossRef]
  39. Yang, Q.B. Mechanisms of deicer-frost scaling of concrete (I): Capillary-uptake degree of saturation and ice-formation pressure. J. Build. Mater. 2007, 10, 522–527. [Google Scholar]
  40. Awasthi, R.; Madan, J.; Kamate, V.; Dua, K. Improving the solubility of nevirapine using a hydrotropyand mixed hydrotropy based solid dispersion approach. Polim. Med. 2017, 47, 83–90. [Google Scholar] [CrossRef] [PubMed] [Green Version]
  41. Luan, H.; Wu, J.; Pan, J. Saline water absorption behavior and critical saturation degree of recycled aggregate concrete during freeze-thaw cycles. Constr. Build. Mater. 2020, 258, 119640. [Google Scholar] [CrossRef]
  42. Saba, A.; Saha, P.; Reza, M.T. Co-Hydrothermal Carbonization of coal-biomass blend: Influence of temperature on solid fuel properties. Fuel Process. Technol. 2017, 167, 711–720. [Google Scholar] [CrossRef]
  43. AliAkbari, R.; Ghasemi, M.H.; Neekzad, N.; Kowsari, E.; Ramakrishna, S.; Mehrali, M.; Marfavi, Y. High value add bio-based low-carbon materials: Conversion processes and circular economy. J. Clean. Prod. 2021, 293, 126101. [Google Scholar] [CrossRef]
  44. Yoshikawa, K.; Prawisudha, P. Hydrothermal Treatment of Municipal Solid Waste for Producing Solid Fuel; Springer: Berlin/Heidelberg, Germany, 2014; pp. 355–383. [Google Scholar]
  45. Lu, X.; Ma, X.; Chen, X. Co-hydrothermal carbonization of sewage sludge and lignocellulosic biomass: Fuel properties and heavy metal transformation behaviour of hydrochars. Energy 2021, 221, 119896. [Google Scholar] [CrossRef]
  46. Channiwala, S.A.; Parikh, P.P. A unified correlation for estimating HHV of solid, liquid and gaseous fuels. Fuel 2002, 81, 1051–1063. [Google Scholar] [CrossRef]
  47. Thunshirn, P.; Wenzel, W.W.; Pfeifer, C. Pore characteristics of hydrochars and their role as a vector for soil bacteria: A critical review of engineering options. Crit. Rev. Environ. Sci. Technol. 2022, 52, 4147–4171. [Google Scholar] [CrossRef]
  48. Olabode, G.; Somerset, V. Advances in Chromatographic Determination of Selected Anti-Retrovirals in Wastewater. In Nano and Bio-Based Technologies for Wastewater Treatment: Prediction and Control Tools for the Dispersion of Pollutants in the Environment; Wiley: Hoboken, NJ, USA, 2019; pp. 105–127. [Google Scholar]
  49. Solomons, T.G.; Fryhle, C.B. Organic Chemistry, 6th ed.; John Wiley & Sons. Inc.: Hoboken, NJ, USA, 2000; pp. 646–931. [Google Scholar]
  50. Smith, B. Infrared Spectral Interpretation: A Systematic Approach; CRC Press: Boca Raton, FL, USA, 2018. [Google Scholar]
  51. Mishra, R.K.; Mohanty, K. Characterization of non-edible lignocellulosic biomass in terms of their candidacy towards alternative renewable fuels. Biomass Conv. Bioref. 2018, 8, 799–812. [Google Scholar] [CrossRef]
  52. Sandler, S.R.; Karo, W. Organic Functional Group Preparations; Academic Press: New York, NY, USA, 1983; Volume I. [Google Scholar]
  53. Madan, H.R.; Sharma, S.C.; Udayabhanu; Suresh, D.; Vidya, Y.S.; Nagabhushana, H.; Rajanaik, H.; Anantharaju, K.S.; Prashantha, S.C.; Sadananda Maiya, P. Facile green fabrication of nanostructure ZnO plates, bullets, flower, prismatic tip, closed pinecone: Their antibacterial, antioxidant, photoluminescent and photocatalytic properties. Spectrochim. Acta Part A Mol. Biomol. Spectrosc. 2016, 152, 404–416. [Google Scholar] [CrossRef] [PubMed]
  54. Patiño, Y.; Díaz, E.; Ordóñez, S.; Gallegos-Suarez, E.; Guerrero-Ruiz, A.; Rodríguez-Ramos, I. Adsorption of emerging pollutants on functionalized multiwall carbon nanotubes. Chemosphere 2015, 136, 174–180. [Google Scholar] [CrossRef] [PubMed]
  55. Zhang, S.; Dong, Y.; Yang, Z.; Yang, W.; Wu, J.; Dong, C. Adsorption of pharmaceuticals on chitosan-based magnetic composite particles with core-brush topology. Chem. Eng. J. 2016, 304, 325–334. [Google Scholar] [CrossRef]
  56. Oladipo, A.A.; Ifebajo, A.O.; Vaziri, R. Green Adsorbents for Removal of Antibiotics, Pesticides and Endocrine Disruptors. In Green Adsorbents for Pollutant Removal; Springer: Berlin/Heidelberg, Germany, 2018; pp. 327–351. [Google Scholar]
  57. Reynel-Avila, H.E.; Mendoza-Castillo, D.I.; Bonilla-Petriciolet, A.; Silvestre-Albero, J. Assessment of naproxen adsorption on bone char in aqueous solutions using batch and fixed-bed processes. J. Mol. Liq. 2015, 209, 187–195. [Google Scholar] [CrossRef]
  58. Nazari, G.; Abolghasemi, H.; Esmaieli, M.; Sadeghi Pouya, E. Aqueous phase adsorption of cephalexin by walnut shell-based activated carbon: A fixed-bed column study. Appl. Surf. Sci. 2016, 375, 144–153. [Google Scholar] [CrossRef]
  59. Álvarez-Torrellas, S.; Ribeiro, R.S.; Gomes, H.T.; Ovejero, G.; García, J. Removal of antibiotic compounds by adsorption using g Lycerol-based carbon materials. Chem. Eng. J. 2016, 296, 277–288. [Google Scholar] [CrossRef] [Green Version]
  60. Mondal, S.; Aikat, K.; Halder, G. Ranitidine hydrochloride sorption onto superheated steam activated biochar derived from mung bean husk in fixed bed column. J. Environ. Chem. Eng. 2016, 4, 488–497. [Google Scholar] [CrossRef]
  61. Darweesh, T.M.; Ahmed, M.J. Adsorption of ciprofloxacin and norfloxacin from aqueous solution onto granular activated carbon in fixed bed column. Ecotoxicol. Environ. Saf. 2017, 138, 139–145. [Google Scholar] [CrossRef] [PubMed]
  62. Yaghmaeian, K.; Moussavi, G.; Alahabadi, A. Removal of amoxicillin from contaminated water using NH4Cl-activated carbon: Continuous flow fixed-bed adsorption and catalytic ozonation regeneration. Chem. Eng. J. 2014, 236, 538–544. [Google Scholar] [CrossRef]
  63. Nourmoradi, H.; Moghadam, K.F.; Jafari, A.; Kamarehie, B. Removal of acetaminophen and ibuprofen from aqueous solutions by activated carbon derived from Quercus Brantii (Oak) acorn as a low-cost biosorbent. J. Environ. Chem. Eng. 2018, 6, 6807–6815. [Google Scholar] [CrossRef]
  64. Effect of Solution pH on the Removal of Paracetamol by Activated Carbon of Dende Coconut Mesocarp. Chem. Biochem. Eng. Q. 2015, 29, 47–53. [CrossRef]
  65. Mashayekh-Salehi, A.; Moussavi, G. Removal of acetaminophen from the contaminated water using adsorption onto carbon activated with NH4Cl. Desalination Water Treat. 2016, 57, 12861–12873. [Google Scholar] [CrossRef]
  66. Streit, A.F.M.; Collazzo, G.C.; Druzian, S.P.; Verdi, R.S.; Foletto, E.L.; Oliveira, L.F.S.; Dotto, G.L. Adsorption of ibuprofen, ketoprofen, and paracetamol onto activated carbon prepared from effluent treatment plant sludge of the beverage industry. Chemosphere 2021, 262, 128322. [Google Scholar] [CrossRef]
  67. Fröhlich, A.C.; Ocampo-Pérez, R.; Diaz-Blancas, V.; Salau, N.P.G.; Dotto, G.L. Three-dimensional mass transfer modeling of ibuprofen adsorption on activated carbon prepared by sonication. Chem. Eng. J. 2018, 341, 65–74. [Google Scholar] [CrossRef]
  68. Baccar, R.; Sarrà, M.; Bouzid, J.; Feki, M.; Blánquez, P. Removal of pharmaceutical compounds by activated carbon prepared from agricultural by-product. Chem. Eng. J. 2012, 211–212, 310–317. [Google Scholar] [CrossRef]
  69. Adeola, A.O.; de Lange, J.; Forbes, P.B.C. Adsorption of antiretroviral drugs, efavirenz and nevirapine from aqueous solution by graphene wool: Kinetic, equilibrium, thermodynamic and computational studies. Appl. Surf. Sci. Adv. 2021, 6, 100157. [Google Scholar] [CrossRef]
  70. Terzopoulou, Z.; Papageorgiou, M.; Kyzas, G.Z.; Bikiaris, D.N.; Lambropoulou, D.A. Preparation of molecularly imprinted solid-phase microextraction fiber for the selective removal and extraction of the antiviral drug abacavir in environmental and biological matrices. Anal. Chim. Acta 2016, 913, 63–75. [Google Scholar]
  71. Späth, J.; Arumugam, P.; Lindberg, R.H.; Abafe, O.A.; Jansson, S.; Fick, J.; Buckley, C.A. Biochar for the removal of detected micropollutants in South African domestic wastewater: A case study from a demonstration-scale decentralised wastewater treatment system in eThekwini. WSA 2021, 47, 4. [Google Scholar]
  72. Genli, N.; Kutluay, S.; Baytar, O.; Şahin, Ö. Preparation and characterization of activated carbon from hydrochar by hydrothermal carbonization of chickpea stem: An application in methylene blue removal by RSM optimization. Int. J. Phytoremediation 2022, 24, 88–100. [Google Scholar] [PubMed]
  73. Gupta, M.; Kumar, A.; Sharma, S.; Bharti; Ghamouss, F.; Singh, P.; Chawla, V.; Kumar, A.; Kumar, Y. Study of electrochemical properties of activated carbon electrode synthesized using bio-waste for supercapacitor applications. Biomass Conv. Bioref. 2022, 1–12. [Google Scholar] [CrossRef]
  74. Elkady, M.F. Synthesis and Characterization of Nano-Activated Carbon from El Maghara Coal, Sinai, Egypt to be Utilized for Wastewater Purification. AJAC 2015, 3, 1. [Google Scholar] [CrossRef] [Green Version]
  75. Osman, Z.; Arof, A.K. FTIR studies of chitosan acetate based polymer electrolytes. Electrochim. Acta 2003, 48, 993–999. [Google Scholar] [CrossRef]
  76. Das, A.; Kothari, V.K.; Makhija, S.; Avyaya, K. Development of high-absorbent light-weight sanitary napkin. J. Appl. Polym. Sci. 2008, 107, 1466–1470. [Google Scholar] [CrossRef]
  77. Zhao, X.-Y.; Huang, S.-S.; Cao, J.-P.; Xi, S.-C.; Wei, X.-Y.; Kamamoto, J.; Takarada, T. KOH activation of a HyperCoal to develop activated carbons for electric double-layer capacitors. J. Anal. Appl. Pyrolysis 2014, 105, 116–121. [Google Scholar] [CrossRef] [Green Version]
  78. Sinha, P.; Banerjee, S.; Kar, K.K. Characteristics of Activated Carbon. In Handbook of Nanocomposite Supercapacitor Materials I; Springer: Cham, Switzerland, 2020; pp. 125–154. [Google Scholar]
  79. Sethia, G.; Sayari, A. Activated carbon with optimum pore size distribution for hydrogen storage. Carbon 2016, 99, 289–294. [Google Scholar] [CrossRef]
  80. Luo, Y.; Wang, K.; Fei, L. The effects of activation conditions on physical properties of activated carbon. BioRes 2020, 15, 7640–7647. [Google Scholar] [CrossRef]
  81. Díez, N.; Sevilla, M.; Fuertes, A.B. Synthesis strategies of templated porous carbons beyond the silica nanocasting technique. Carbon 2021, 178, 451–476. [Google Scholar] [CrossRef]
  82. Phiri, J.; Dou, J.; Vuorinen, T.; Gane, P.A.C.; Maloney, T.C. Highly Porous Willow Wood-Derived Activated Carbon for High-Performance Supercapacitor Electrodes. ACS Omega 2019, 4, 18108–18117. [Google Scholar] [CrossRef] [PubMed] [Green Version]
  83. Veerakumar, P.; Sangili, A.; Manavalan, S.; Thanasekaran, P.; Lin, K.-C. Research Progress on Porous Carbon Supported Metal/Metal Oxide Nanomaterials for Supercapacitor Electrode Applications. Ind. Eng. Chem. Res. 2020, 59, 6347–6374. [Google Scholar] [CrossRef]
  84. Tu, J.; Wang, S.; Li, S.; Wang, C.; Sun, D.; Jiao, S. The Effects of Anions Behaviors on Electrochemical Properties of Al/Graphite Rechargeable Aluminum-Ion Battery via Molten AlCl3-NaCl Liquid Electrolyte. J. Electrochem. Soc. 2017, 164, A3292–A3302. [Google Scholar] [CrossRef]
  85. Wang, Y.; Chang, Z.; Qian, M.; Zhang, Z.; Lin, J.; Huang, F. Enhanced specific capacitance by a new dual redox-active electrolyte in activated carbon-based supercapacitors. Carbon 2019, 143, 300–308. [Google Scholar] [CrossRef]
  86. Raj, A.N.P.; Adinaveen, T.; Bennie, R.B.; Joel, C.; Kengaram, S.H.; Sophie, P.L. Nanoarchitectonics and Electrochemical Behavior of Cu Doped h-MoO3 as an Electrode Material for Energy Storage Applications. J. Inorg. Organomet. Polym. 2022, 1–11. [Google Scholar] [CrossRef]
  87. Uralcan, B.; Uralcan, I.B. Origin of Enhanced Performance in Nanoporous Electrical Double Layer Capacitors: Insights on Micropore Structure and Electrolyte Composition from Molecular Simulations. ACS Appl. Mater. Interfaces 2022, 14, 16800–16808. [Google Scholar] [CrossRef]
  88. Yang, F.; Huang, H.; Zhu, J.; Dong, W.; Wu, Q.; Li, H. Effects of coal-activated carbon on structure and electrochemical properties of MoS2/C. J. Mater. Sci. Mater. Electron. 2022, 33, 14691–14701. [Google Scholar] [CrossRef]
  89. Ghosh, S.; Santhosh, R.; Jeniffer, S.; Raghavan, V.; Jacob, G.; Nanaji, K.; Kollu, P.; Jeong, S.K.; Grace, A.N. Natural biomass derived hard carbon and activated carbons as electrochemical supercapacitor electrodes. Sci. Rep. 2019, 9, 16315. [Google Scholar] [CrossRef] [PubMed] [Green Version]
  90. Barroso Bogeat, A. Understanding and Tuning the Electrical Conductivity of Activated Carbon: A State-of-the-Art Review. Crit. Rev. Solid State Mater. Sci. 2021, 46, 1–37. [Google Scholar] [CrossRef]
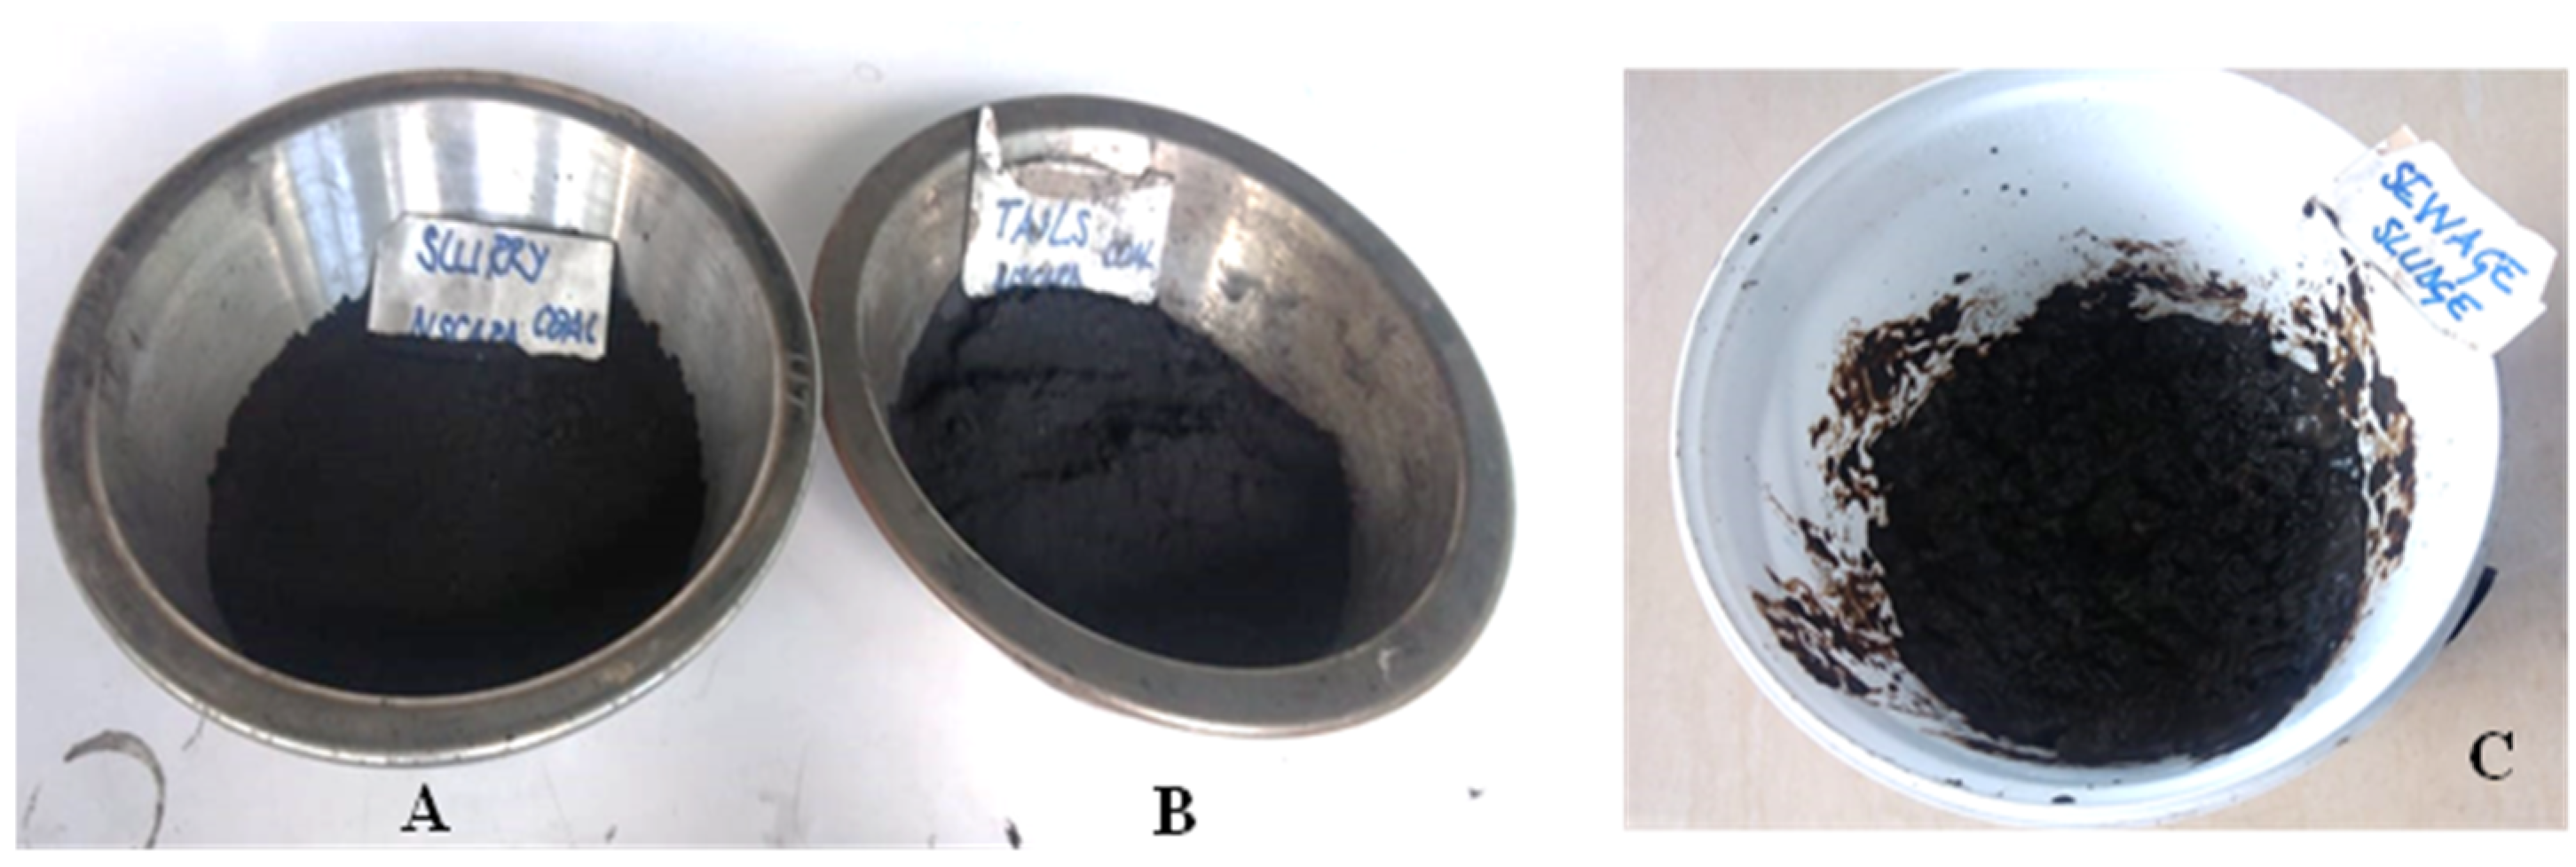
Figure 1. Collected waste CS (A), waste CT (B), and sewage sludge sample (C).
Sustainability 14 15113 g001
Figure 2. Surface plot showing the influence of temperature and pressure on the fixed carbon of hydrochar coal tailing (A) and hydrochar coal slurry (B).
Sustainability 14 15113 g002
Figure 3. Surface plot showing the influence of temperature, pressure, time, and the (CT + CS: SS) ratio on the fixed carbon of produced hydrochar.
Sustainability 14 15113 g003
Figure 4. Percentage variation of LAM and NEV into the produced hydrochars versus the concentration of adsorbent (A) and residence time (B).
Sustainability 14 15113 g004
Figure 5. Isothermal adsorption plots of raw materials produced hydrochar and spent adsorption residues.
Sustainability 14 15113 g005
Figure 6. SEM images and EDS elemental spectrums of hydrochar coal tailing (HCT) and spent residues from nevirapine (HCT–NEV) and lamivudine (HCT–LAM) absorption. (a): SEM image of HCT. (b): ESD spectrum of HCT. (c): SEM image of spent residue from the adsorption of nevirapine on HCT. (d): ESD spectrum of the spent residue from the adsorption of nevirapine on HCT. (e): SEM image of spent residue from the adsorption of Lamivudine on HCT. (f): EDS spectrum of spent residue from the adsorption of Lamivudine on HCT.
Sustainability 14 15113 g006
Figure 7. SEM images and EDS elemental spectrums of hydrochar coal slurry (HCS) and spent residues from nevirapine (HCS–NEV) and lamivudine (HCS–LAM) absorption. (a): SEM image of HCS. (b): ESD spectrum of HCS. (c): SEM image of spent residue from the adsorption of nevirapine on HCS. (d): ESD spectrum of the spent residue from the adsorption of nevirapine on HCS. (e): SEM image of spent residue from the adsorption of Lamivudine on HCS. (f): EDS spectrum of spent residue from the adsorption of Lamivudine on HCS.
Sustainability 14 15113 g007
Figure 8. SEM images and EDS elemental spectrums of coals and hydrochar sewage sludge blend (HCB) and spent residues from nevirapine (HCB–NEV) and lamivudine (HCB–AM) absorption. (a): SEM image of HCB. (b): ESD spectrum of HCB. (c): SEM image of spent residue from the adsorption of nevirapine on HCB. (d): ESD spectrum of the spent residue from the adsorption of nevirapine on HCB. (e): SEM image of spent residue from the adsorption of Lamivudine on HCB. (f): EDS spectrum of spent residue from the adsorption of Lamivudine on HCB.
Sustainability 14 15113 g008
Figure 9. Absorbance spectra of nevirapine (A) and lamivudine (B). Source: Forensic Spectral Research John Wiley & Sons, Inc. (Hoboken, NJ, USA).
Sustainability 14 15113 g009
Figure 10. Absorbance spectra of nevirapine and lamivudine on the hydrochar coal tailing (HCT).
Sustainability 14 15113 g010
Figure 11. Absorbance spectra of nevirapine and lamivudine on the hydrochar coal slurry (HCS).
Sustainability 14 15113 g011
Figure 12. Absorbance spectra of nevirapine and lamivudine on the hydrochar from the blend (HCB) of CD and sewage sludge (SS).
Sustainability 14 15113 g012
Figure 13. FTIR profile of chemically activated spent hydrochar residues from nevirapine and lamivudine adsorption tests using HCT (A) and HCS (B).
Sustainability 14 15113 g013
Figure 14. FTIR profile of chemically activated spent hydrochar residues from nevirapine and lamivudine adsorption tests using HCB.
Sustainability 14 15113 g014
Figure 15. SEM images of ACs obtained using spent hydrochar residues from nevirapine and lamivudine adsorption tests.
Sustainability 14 15113 g015
Figure 16. (a) Cyclic voltammetry curves @ 100 mV/s (b) and specific capacitance results from greatest common divisor (GCD) of ACs from spent adsorptions residues (HCT–NEV: A1, HCT–LAM: A2, HCS–NEV: B1, HCS–LAM: B2, HCB–NEV: C1 and HCT–LAM: C2).
Sustainability 14 15113 g016
Figure 17. Electrochemical impedance spectroscopy (EIS) of the ACs from spent adsorptions residues (HCT–NEV: A1, HCT–LAM: A2, HCS–NEV: B1, HCS–LAM: B2, HCB–NEV: C1 and HCT–LAM: C2).
Sustainability 14 15113 g017
Table 1. Hydrothermal carbonization and co-hydrothermal carbonization are optimum operating solutions.
NameHCTHCSHCBPOAE
Parameters
Temperature (°C)150150208.700–0.33
Pressure (bar)272722.550–0.22-
Time (Min)92.1310331.020.35–7.4
CT + CS: SS--20.02:4.981.96
Results (%) on a dried basis
Ash content38.1321.1217.430.07–1.09
Fixed Carbon40.2057.1958.880.5–1.21
Volatile Matter21.6721.6923.691.08–0.37
Mass yield96.1896.0584.671.35–2.00
HCT: Hydrochar coal tailing. HCS: Hydrochar coal slurry. HCB: hydrochar from the Co-HTC of coals and sewage sludge. SS: Sewage sludge. POE: Percentage of absolute error.
Table 2. Experimental results of NEV and LAM adsorption on the produced hydrochars.
Adsorbent (HC) Concentration and Residence Time HCT HCS HCB
NEV
(μg L−1)
STDpHLAM
(μg L−1)
STDpHNEV
(μg L−1)
STDpHLAM
(μg L−1)
STDpHNEV
(μg L−1)
STDpHLAM
(μg L−1)
STDpH
Raw solution5.53 5.584.58 5.345.53 5.584.58 5.345.53 5.584.58 5.34
HCs concentration (gL−1) for a residence time of 90 min
103.871 × 10³ 5.833.371.8 × 10³ 5.444.422.3 × 10³ 5.673.871.7 × 10³ 5.483.812.7 × 10³ 5.674.132.1 × 10³ 5.46
252.411 × 10³ 6.022.351.8 × 10³ 5.763.982.3 × 10³ 5.943.611.7 × 10³ 5.611.942.7 × 10³ 5.893.162.1 × 10³ 5.59
500.811 × 10³ 6.211.631.8 × 10³ 5.981.182.3 × 10³ 6.171.941.7 × 10³ 6.010.652.7 × 10³ 6.050.962.1 × 10³ 5.77
1000.531 × 10³ 6.380.371.8 × 10³ 6.080.332.3 × 10³ 6.420.471.7 × 10³ 6.170.152.7 × 10³ 6.10.302.1 × 10³ 5.84
3000.688.1 × 10³ 6.520.471.8 × 10³ 6.140.442.3 × 10³ 6.480.551.7 × 10³ 6.250.262.7 × 10³ 6.220.402.1 × 10³ 5.91
Time (minutes) for an HC concentration of 100 g L−1
101.578.1 × 10³ 5.922.751.8 × 10³ 5.592.602.3 × 10³ 6.082.371.7 × 10³ 5.791.272.7 × 10³ 5.671.662.1 × 10³ 5.48
300.771 × 10³ 6.120.961.8 × 10³ 5.871.352.3 × 10³ 6.240.781.7 × 10³ 6.050.622.7 × 10³ 5.880.752.1 × 10³ 5.61
900.531 × 10³ 6.380.371.8 × 10³ 6.080.332.3 × 10³ 6.420.471.7 × 10³ 6.170.152.7 × 10³ 6.110.302.1 × 10³ 5.84
1800.531 × 10³ 6.380.371.8 × 10³ 6.080.332.3 × 10³ 6.420.471.7 × 10³ 6.170.152.7 × 10³ 6.110.302.1 × 10³ 5.84
3600.531 × 10³ 6.380.371.8 × 10³ 6.080.332.3 × 10³ 6.420.471.7 × 10³ 6.170.162.7 × 10³ 6.110.302.1 × 10³ 5.84
Table 3. Organic compounds in filtrate from NEV adsorption by HCB.
Initial Solution from the Mixture (HCB + Nevirapine)Final Solution after Adsorption (HCB + Nevirapine)
PeakRetention
Time
(minutes)
Organic compound NameConc
(%)
Retention
Time
(minutes)
Organic compound NameConc
(%)
13.287Cyclotrisiloxane, hexamethyl- (CAS)4.1911.536Hexadecanoic acid (CAS)26.19
23.412Cyclotrisiloxane, hexamethyl- (CAS)21.2812.5159,12-0ctadecadienoic acid (Z, Z)–(CAS)35.02
33.557Propanoic acid, 2-hydroxy- (CAS)4.1512.615Octadecanoic acid23.82
43.655DIHYDROXYACETICACID0.9312.899Hexadecanoic acid, (3-bromoprop-2-ynyl)2.7
53.72Propanal, 3-ethoxy- (CAS)1.0113.018Hexadecanoic acid, 1-[[[(2-aminoethoxy)hydroxyphosphinyl]oxy]methyl]-2-[(1-oxotetradecyl)oxy]1.52
64.382Propanoic acid, 2-hydroxy- (CAS)19.6413.495Cis-11-Eicosenoic acid0.97
74.72trisiloxane, 1,1,1,5,5,5-hexamethyl-30.8413.596Eicosanoic acid1.89
84.765Cyclotetrasiloxane, octamethyl- (CAS)7.6113.72SII.1CONE OIL0.48
94.9481,3-Dioxane (CAS)2.1913.8099,12-0ctadecadienoyl chloride, (Z,Z)-0.67
106.0250-TRIS-TRIMEfHYLSILYI.rEPIN0.9713.94Cis-9-Hexadecenal0.98
116.098Cyclopentasiloxane, decamethyl- (CAS)4.514.34411-Cyclopropyl-4-methyl-5, ll-dihydro-6.3.76
126.873,3,5-Triethoxy-1,1,1,7,7,7-hexamethyl-50.3315.003Silane, dimethyl(dimethyl(3-methylpentyl)0.38
137.461Cyclohexasiloxane, dodecamethyl2.1817.538Docosane (CAS)0.33
148.6953-Ethoxy-1,1,1,7,7,7-hexamethyl-3,5,50.5118.814Tetratetracontane (CAS)0.68
158.861-Butylimidazole3.3920.38Tetratetracontane (CAS)0.61
168.915Emylcamate1.7
178.985N-(4-ISOPROPYLBENZVL) -N,1-DIME1.51
189.794trimethylsilyl [2,3-di(trimethylsiloxy)pher0.84
1910.035Chloro(dimethyl)phosphine0.29
2010.125Erythro-dl-0-ethylthreonine0.28
2110.734Trimethylsilyl) -{bis[methyl(trimethylsilyh0.36
2211.5723-Butoxy-1,1,1,7,7,7-hexamethyl-3,5,50.59
2311.65Histidine, 4-chloro-2-trifluoromethyl0.46
2412.1551-Methyl-l-n-tetradecyloxy-1-silacyclope0.27
2512.23Alpha-(N-methoxy-N-(2;1.;l.-trifluoroethanol0.62
2612.3381,1,1,3,5,7,7,7-0ctamethyl-3,5-bis (trime0.68
2712.83Acetamide, N-(2-cyano 4,5-dimethoxy pht0.56
2812.945Silane, l,l’-[oxybis(methylene sulfonyl-2,10.68
2912.985Carbonic acid, isohexyl 2;1.;1.-trichloroeth0.57
3013.025EICOSAMETHYLCYCLODECASILQ)0.77
3113.185Succinylacetone diethoxime, trimethylsily0.29
3213.265Pentanoic acid, butyl ester (CAS)0.29
3313.373Morpholine, 4-(2,4-dinitrophenylbenzoyl)0.63
3413.585d-Altronic acid0.32
3513.67Butyl heptanoate0.56
3613.719Heptasiloxane, hexadecamethyl1.07
3714.03N-Acetyl- alpha-aminooxy-propionic acic0.45
3814.392Benzene, (1-methoxyethenyl)0.65
3914.501Heptasiloxane, hexadecamethyl-(CAS)0.62
4015.3145-Chloro-IH-l;1.,4-triazole-3-carboxamid0.42
4115.435Benzeneacetic acid, alpha.,3,4-tris[(trike1.55
4215.855(1-methylethyl)-thiirane0.36
4315.92Ethyl 2-nitropropionatc0.62
4417.548Nonane, 5-(1-methylpropyl} -0.93
4518.824Hepladecane, 2,6,10,15-tctramcthyl- (CA2.94
4620.26D-Glucose, 6-acctamido-6-deoxy-, diethy0.61
4720.398Sulfurous acid, octadccyl 2-propyl ester2.2
4820.471-Phenazinecarboxylic acid, 6-[l-[(l-oxo)]]0.28
4922.2551,2,4-Triazolo [3,4-a] phthalazine-7-hydrn0.26
5022.318Octadccane, 5-methyl1.05
100
Conc: concentration.
Table 4. Organic compounds in filtrate from LAM adsorption by HCB.
Initial Solution from the Mixture (HCB + Lamivudine)Final Solution after Adsorption (HCB + Lamivudine)
PeakRetention
Time
(minutes)
Organic compound NameConc
(%)
Retention
Time
(minutes)
Organic compound NameConc
(%)
13.34Cyclotrisiloxane, hexamethyl- (CAS)1.543.35Cyclotrisilox ane, hexamethyl- (CAS)0.29
23.3753,4-Dimethylbenzoicacid, TBDMS deri•0.73.518Cyclotrisiloxane, hexamethyl- (CAS)0.56
33.441Cyclotetrasiloxane, octamethyl- (CAS)8.834.81Cyclotetrasiloxane, octamethyl- (CAS)0.24
44.56Cyclotetrasiloxane, octamethyl- (CAS)0.545.4671,2,3-Propanetriol (CAS)98.52
54.63BENZENE, (1,1-DIMETHYLETI YL) 2.556.28Disiloxane, l, l,3,3-tetramethyl-l,3-bis [3]0.39
64.704Tridecane (CAS)2.11
74.792Cyclotetrasiloxane, octamethyl- (CAS)7.76
85Butyric acid, 2-phenyl-, hept-2-yl ester1.06
95.364Heptane, 5-ethyl-2-methyl-(CAS)1.3
105.44Ethyl neopentyl carbonate0.47
115.612l-MEfHYL-2-PHENYLCYCLOPROPJ3.03
125.718Undecane (CAS)1.81
136.099Cyclopentasiloxane, decamethyl- (CAS)0.66
146.153Cyclopentasiloxane, decamethyl- (CAS)0.84
156.757Dodecane (CAS)2.9
166.875Carbonic acid, 2-ethoxyethyl neopentyl0.63
177.165Oxalic acid, hexyl neopentyl ester0.76
187.192-Propyl-5-oxohexanoic acid0.86
197.2341-Heptadecanamine (CAS)2.81
207.465CYCLOHEXASILOXANE, OODECM1.1
217.531Tridecane (CAS)4.51
228.011Tetradecane (CAS)1.59
238.269Hexadecane (CAS)2.32
248.335-Allyl-6-methyl-2-phenyl-5,6-dihydro-40.54
258.695(E)-2-[(tert-butyl) dimethylsily! J-2- [I’-me1.93
268.746Octadecane, l,1’- [1,3-propanediylbis (ox)0.95
278.941Pentadecane (CAS)3.08
289.1441-Bromo-3,7-dimethyloctane0.57
299.235Decanoic acid, nonyl ester0.59
309.264PENTASIWXANE, 1, l,3,3,5,5,7,7,9,9-1.6
319.42Dodecane, 1,2-dibromo- (CAS)0.51
329.583Pentadecane (CAS)2.12
3310.198Heptadecane (CAS)2.31
3410.435Tridecane, 6-propyl-1.92
3510.5753beta,17beta-Diacetoxy-17-isopregn-5-e0.45
3610.772Octadecane (CAS)1.29
3710.8759-Oxa-10-thiatricyclo [3.3.I. I (2,7) Jdecar0.63
3811.019Undecane, 6-ethyl-0.73
3911.105(−)-lsopulegol0.51
4011.161DIMETHOXYGLYCEROLDOCOSYL0.55
4111.324Tricosane (CAS)1.06
4211.843NONADECANE1.57
4312.346Tetradecane (CAS)1.07
4412.825Heptacosane (CAS)0.69
4512.91Pentasiloxane, 1,1,3,3,5,5,7,7,9,9-decam0.5
4613.011-Hcptcnc, 2,6,6-trimethyl-0.7
4714.43311-Cyclopropyl-4-methyl-5, l l--dihydro-t21.89
4815.435Benzene, 1-(1, l-dimethylcthyl) -4-(2-ethyl0.44
4918.775Pentasiloxanc, dodecamethyl- (CAS)0.55
5019.0563-Thiazolidinccarboxamidine, 2-imino-0.57
100
Conc: concentration.
Table 5. Physicochemical properties of waste precursors produced hydrochar and spent residues from NEV and LAM adsorption.
AnalysesCTHCTHCT–NEVHCT–LAMCSHCSHCS–NEVHCS–LAMSSCBHCBHCB–NEVHCB–LAM
Proximate Analysis (wt. %, adb)
Inherent Moisture4.171.071.811.043.941.731.581.268.122.711.721.761.45
Ash content38.6437.9633.1233.9623.2222.7819.7816.7836.0737.7519.5613.5619.56
Volatile Matter21.4421.0422.8624.4921.2818.3819.223.7247.0721.9220.3122.1625.26
Fixed Carbon35.7539.9442.2140.5150.9857.1159.4458.248.7537.6258.4162.5260.73
Ultimate Analysis (wt. %, adb)
Total Carbon42.8249.8055.2353.9861.8566.9070.9069.4529.745.6467.0473.8568.44
Hydrogen3.012.872.422.393.562.982.282.414.883.052.781.751.57
Nitrogen1.141.722.742.661.391.992.632.844.151.822.433.052.95
Oxygen8.795.833.94.214.782.751.913.9915.228.26.085.294.15
Total Sulfur
(wt. %, adb)
1.430.750.781.761.260.870.921.271.860.830.390.741.88
BET analysis
SBET (m2/g)6.06611.82006.3714.3500-6.1720.3500
Total pore volume (cm3/g)0.0340.071000.0480.09400-0.090.3800
CT: Coal Tailing. CS: Coal Slurry. SS: Sewage sludge. CB: Blend (CT + CS: SS). HCT: hydrochar CT. HCS: hydrochar CS. HCB: hydrochar CB, HC–NEV: residue from nevirapine’s adsorption. HC–NEV: residue from nevirapine’s adsorption. HC–LAM: residue from lamivudine’s adsorption. adb: air dried basis. Oxygen % = 100 ( Inherent   moiture + Ash + Total   Carbon + Hydrogen + Nitrogen + Total   sulfur ) . BET: Brunauer Emmet Teller. SBET: Specific surface area.
Table 6. Absorbents reported for the removal of ARVDs and other pharmaceutical products in different water matrices.
AdsorbentAdsorbate (Pharmaceutical)Adsorbent Concentration (g L−1)Contact Time
(min)
Uptake
mg g−1
Reference
Commercial carbonNalidixic acid0.083251595Patiño (2016) [54]
Carbon nanotubeNalidixic acid0.08150583
GraphiteNalidixic acid0.081062
Akaganeite-carbonDoxycycline0.02710813.4Zhang (2016) [55]
Coffee residue/Fe3O4Tetracycline0.185.9181Oladipo (2016) [56]
Bone charNaproxen0.01780.11Reynel (2015) [57]
Walnut shell carbonCephalexin0.1117.1211Nazari (2016) [58]
Peach stones carbonIbuprofen0.0142655Álvarez. (2016) [59]
Tetracycline0.011446132.6
Activated biocharRanitidine0.26312Mondal (2016) [60]
Akaganeite-carbonDoxycycline0.027-15Zhang (2016) [55]
Date stones carbonLevofloxacin0.15-2.1Darweesh (2017) [61]
Pomegranate carbonAmoxicillin0.05-5107Yaghmaeian (2014) [62]
AC from oak acornParacetamol 45.45Nourmoradi (2018) [63]
AC from Babassu coconut71.39Ferreira (2015) [64]
AC from Dende coconut70.62
NH4Cl-induced AC 233Mashayekh-Salehi and Moussavi (2016) [65]
Acid-treated beverage sludge-activated carbon145.4Streit (2021) [66]
AC from vegetableIbuprofen 115.1Frohlich (2018) [67]
AC from agricultural by-products12.6Baccar (2012) [68]
AC from oak acorn96.15Nourmoradi (2018) [63]
AC from vegetableKetoprofen 79.1Frohlich (2018) [67]
Acid-treated beverage sludge-activated carbon57.66Streit (2021) [66]
Nanofibers fabricated from Mondia whiteiARVs0.040–12075–320Kebede (2020) [12]
Graphene-based materialNevirapine0.2150048.31Adeola (2021) [69]
Graphene-based materialefavirenz0.25004.41
AC from Spent brewery grainssulfamethoxazole0.02560217Sousa (2022) [27]
trimethoprim0.02560229.35
ciprofloxacin0.02560205.7
AC from primary paper mill sludgesulfamethoxazole0.8-185.14Silva (2019) [26]
Functionalized biocharsulfamethoxazole0.01 80.79Ahmed (2017) [31]
Graphene oxidelamivudine0.112010.08Lan (2022) [32]
Molecularly imprinted polymers (MIPs)Abacavir 60167Terzopoulou (2016) [70]
Graphene woolEfavirenz 4.41
Nevirapine48.31
Alginate, polyvinylpyrrolidone and activated carbon44.4Ndilimeke. (2021) [13]
Zidovudine 42.2
Nanofibers (Mondia White roots)Nevirapine 200.5Kebede (2020) [12]
Didanosine75.9
Ritonavir86.9
Efavirenz152.1
Stavudine160
Biochar made from- oliveAbacavir Optimum value not reported, exhibited poor removal efficienciesSpäth (2021) [71]
Residues, tomato residuesAtazanavir
Rice husks, and the AfricanDarunavir
Palm tree Raphia fariniferaLamivudine
Nevirapine
Raltegravir
HCTNevirapine1009050This study
Lamivudine42
HCSNevirapine52
Lamivudine41.1
HCBNevirapine53.8
Lamivudine42.8
HCT: Hydrochar coal tailing. HCS: Hydrochar coal slurry. HCB: hydrochar from the blend of coal tailing, coal slurry, and sewage sludge. AC: Activated carbon.
Table 7. BET analysis results of the synthesized ACs using spent hydrochar residues from nevirapine and lamivudine adsorption tests.
MaterialSurface Area
(m2/g)
Total Pore Volume
(cm3/g)
Micropore Volume
(cm3/g)
Average Pore Diameter
(nm)
AC–HCT–NEV1047.51.140.9862.23
AC–HCT–LAM748.20.470.3532.55
AC–HCS–NEV618.40.3730.2892.41
AC–HCS–LAM582.80.4420.2553.04
AC–HCB–NEV436.50.420.163.85
AC–HCB–LAM603.60.4730.2623.13
BET: Brunauer Emmet Teller. AC–HC–NEV: Activated carbon from nevirapine’s adsorption spent residue. AC–HC–LAM: Activated carbon from lamivudine’s adsorption spent residue.
Publisher’s Note: MDPI stays neutral with regard to jurisdictional claims in published maps and institutional affiliations.