Article

Response and Application of Full-Space Numerical Simulation Based on Finite Element Method for Transient Electromagnetic Advanced Detection of Mine Water

1
Artificial Intelligence Research Institute, China University of Mining and Technology, Xuzhou 221116, China
2
School of Safety Engineering, China University of Mining and Technology, Xuzhou 221116, China
3
Xi’an Research Institute, China Coal Technology and Engineering Group Corp, Xi’an 710077, China
4
School of Mines, China University of Mining and Technology, Xuzhou 221116, China
5
Xuzhou Trident Information Technology Co., Ltd., Xuzhou 221116, China
6
Department of Physics, Changzhi University, Changzhi 046000, China
*
Author to whom correspondence should be addressed.
Sustainability 2022, 14(22), 15024; https://doi.org/10.3390/su142215024
Submission received: 1 October 2022 / Revised: 3 November 2022 / Accepted: 10 November 2022 / Published: 14 November 2022
(This article belongs to the Collection Mine Hazards Identification, Prevention and Control)

Abstract

:
The issue of water hazards has led to the restriction of safe and efficient coal mine production in China. The transient electromagnetic method (TEM) is one of the most effective means of detecting the hidden dangers of water hazards in coal mines. However, the current understanding of the whole-space transient electromagnetic response of mine water is only on the general law due to the late start of the forward research. Therefore, this paper established multiple sets of simulation models in the whole area in order to study the rules and factors of transient electromagnetic responses. Subsequently, these laws are used to explain the detection data of TEM in the field. According to the simulation results, the electric properties, distance, and size had the greatest influence on the transient electromagnetic response of regular anomalous geological bodies, while the electromagnetic field projection area also had an impact on irregular ones. Furthermore, field application demonstrated that the response law and TEM’s affecting factors are acceptable for directing the detection of transient electromagnetic in coal mines. This research can advance the TEM’s data processing and interpretation technology and offer a theoretical basis for detailed investigation.

1. Introduction

As the slow decrease and depletion of extractable resources in the shallow strata, the development to deep geological resources has become an inevitable strategy for many countries around the world [1,2,3]. Nevertheless, as the mining depth increases, the hydrogeological conditions become more and more complex, such as geological faults, the old cellar water accumulation and collapse columns [4,5,6]. Due to the high crustal stress, high surface temperature and high fluid pressure in the deep part of the rock body characteristics change, coupled with the stratum itself fracture fragmentation zone development and mining-induced water conductivity fragmentation zone conducts different water sources into the mine, that the mine occurs sudden water disaster [7,8]. Water disaster prevention and control are based on the detection of these water-bearing aberrant bodies [9]. The mine transient electromagnetic method (MTEM) has been employed in tunnel excavation advanced detection, working face water-rich region detection, and other fields [10,11] because of its benefits, which include being sensitive to low-resistance body, large anomaly intensity close to the target object, and convenient construction. The three-dimensional forward research of the MTEM is able to not only direct data interpretation in practical work and increase the accuracy of interpretation, but it can also provide the groundwork for three-dimensional inversion, which is still in the research stage, and play a significant role in advancing this method’s development.
TEM is a time-domain detection method based on the electromagnetic induction principle, which first emits a step pulse magnetic field, called a primary field, to the ground through an ungrounded loop. Subsequently, the time-varying variation of the induced secondary field in the underground medium is measured during the pause of the primary field. Finally, by processing, analyzing, and interpreting the generated secondary field information, detecting various geological details is achieved [12,13,14] (see Figure 1).
Transient electromagnetic forward modeling primarily includes the time domain finite difference method (FDTD), finite volume method (FVM), integral equation method (IEM) and finite element method (FEM). The full-space transient electromagnetic response of mined-out water was numerically modelled by Chang et al. [15], utilizing the three-dimensional FDTD. Sun et al. studied the Crank-Nicolson FDTD 3D forward modeling for the transient electromagnetic transition [16]. A 3D forward modeling of loop-source transient electromagnetic response in biaxial anisotropic formation is proposed through the use of the mimetic finite volume method (MFVM) [17]. Liu et al. implemented 3D forward modeling and analysis of the loop-source transient electromagnetic method based on the FVM for an arbitrarily anisotropic medium [18]. The response properties of the highway-borehole transient electromagnetic field under the circumstance of tunnel full space were studied by Chen et al., using the IEM to create a numerical model [19]. The FEM has the advantages of strong application and high precision, and it overcomes the structure-related singularity problem when compared to other methods [17]. Based on earlier research, Zhang et al. added absorption boundary conditions to quicken the three-dimensional finite element forward evolution of the transient electromagnetic technique [20]. The issues of lengthy computation times and high memory requirements have been significantly reduced in recent years due to the quick development of computer hardware, and the finite element method is now frequently used in three-dimensional numerical simulations of transient electromagnetic phenomena [21,22,23,24]. Unfortunately, as surface TEM is the main focus of current finite element research, there is little numerical simulation of mine transient electromagnetic with multiple turns and a small loop source. In particular, the study on the transient electromagnetic response characteristics of various water-bearing geological bodies widely present in mines is not ideal, such as the precise law of TEM response and the factors influencing the propagation of transient electromagnetic field. Therefore, it is of great significance to study the factors and rules of the transient electromagnetic response by the TDFEM.
Against the above background, this paper established multiple sets of various numerical models based on the TDFEM to study the transient electromagnetic response law and its influencing factors in detail. Finally, the interpretation of field data was successfully guided by these findings. The main research contents of the following paper are as follows: the second section introduces the theoretical basis of numerical simulation, the third section studies the response characteristics of different geological water-bearing anomalies, the fourth section studies the factors affecting the transient electromagnetic response, and the fifth section is the field application.

2. Method

2.1. Time-Domain Electromagnetic Field Equation

The finite element method is a numerical method for solving the approximate solution of boundary value problems of partial differential equations. The benefits of using the finite element method are that it offers great freedom in the selection of discretization, both in the elements that may be used to discretize space and the basic functions. Kuo et al. first used the two-dimensional nodal FEM to simulate the transient electromagnetic response of the low resistivity orebody under the low resistivity layer [25]. Following this, scholars have conducted a lot of research on the three-dimensional time domain finite element [26,27,28]. For the electromagnetic field problem, the control equation is primarily the Helmholtz equation.
× H = J + J s
× E = B t
· D = 0
· B = 0
where is the Hamiltonian operator, H is the magnetic field intensity, E is the electric field intensity, D is the electric displacement vector, B is the magnetic induction intensity, t is time, Js is the field source current density, J is the conduction current density excited by the field source.
The wave equation of electromagnetic field can be obtained by transformation, as follows:
2 E + k 2 E = 0
2 H + k 2 H = 0
where k is the propagation constant.

2.2. Time Discretization

The implicit Euler method, which can be regarded as a backward differentiation formula, is utilized to discretize the time domain in this study [29]. The calculation principle is as follows:
d x d t = F ( x , t )
Assuming that the value of the dependent variable xi is known at an initial value ti, then a Taylor approximation is used to relate the value of x at t = ti+1, namely x(ti+1) with h = ti+1ti. However, in contrast to the explicit Euler method, the Taylor series around the point x(ti+1) was used, that is:
x i = x ( t i + 1 ) d x d t | t i + 1 ( h ) + O ( h 2 )
Substituting the differential equation into the above equation yields:
x i = x ( t i + 1 ) F ( x i + 1 , t i + 1 ) ( h ) + O ( h 2 )
Therefore, as an approximation, an estimate for x(ti+1) can be taken as xi+1, as follows:
x ( t i + 1 ) x i + 1 = x i + F ( x i + 1 , t i + 1 ) ( h )
Using this estimate, the local truncation error is thus proportional to the square of the step size, with the constant of proportionality related to the second derivative of x, which is the first derivative of the given initial-value problem.

2.3. Solving Sparse Equation

The finite element method inevitably reverts to the solution of huge sparse equations when utilized to calculate complex electromagnetic field issues. The electromagnetic field problem is solved in this study using the MUMPS parallel solver, a package for solving linear equations in the form of Ax = b [30].

2.4. Verification of Algorithm Accuracy

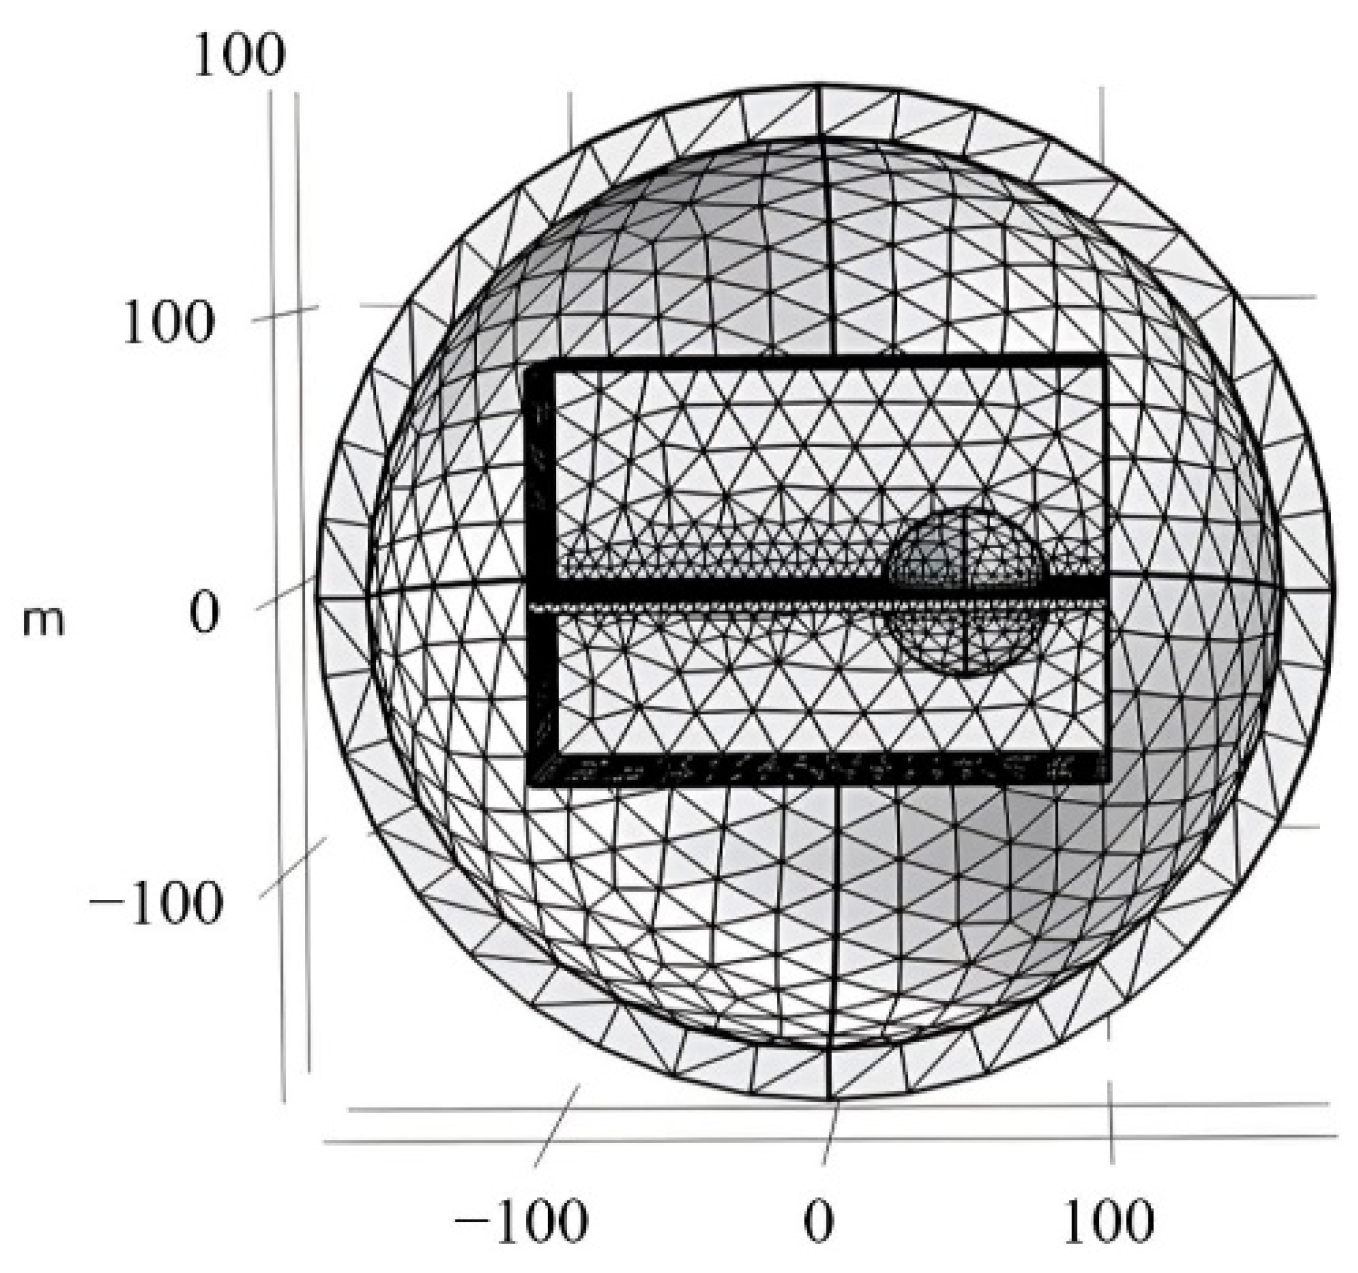
To verify the accuracy of the finite unit algorithm, the geoelectrical model proposed in this paper is based on a 3D sphere model, due to the good symmetry of a sphere. The sphere model has a radius of 180 m, and the 18 m thick spherical shell at its outermost edge is set as the infinite-element domain. The procedure is as follows: A circular coil with a radius of 1 m and a cross-sectional radius of 25 mm is placed at the center of the sphere, with a coil emission current waveform of 2 A, a shutdown time of 20 μs, a transmit backline of 60, and a receiving line of 40. Using non-uniform meshing, it is divided into 114,834 tetrahedron meshes. The analogue time starts at 0 s, and the current starts to shut down at 0.5 ms, with a shutdown time of 20 μs. The 1.5 ms analogue time ends when the current is switched off. The method of local-refinement time-step sectioning is applied, where a time step of 2 μs is used in the current shutdown process and in the range of 20 s before and after, and a time step of 20 μs is used for the rest of the dura-tion. This can also ensure the calculation accuracy and significantly improve the computational efficiency.
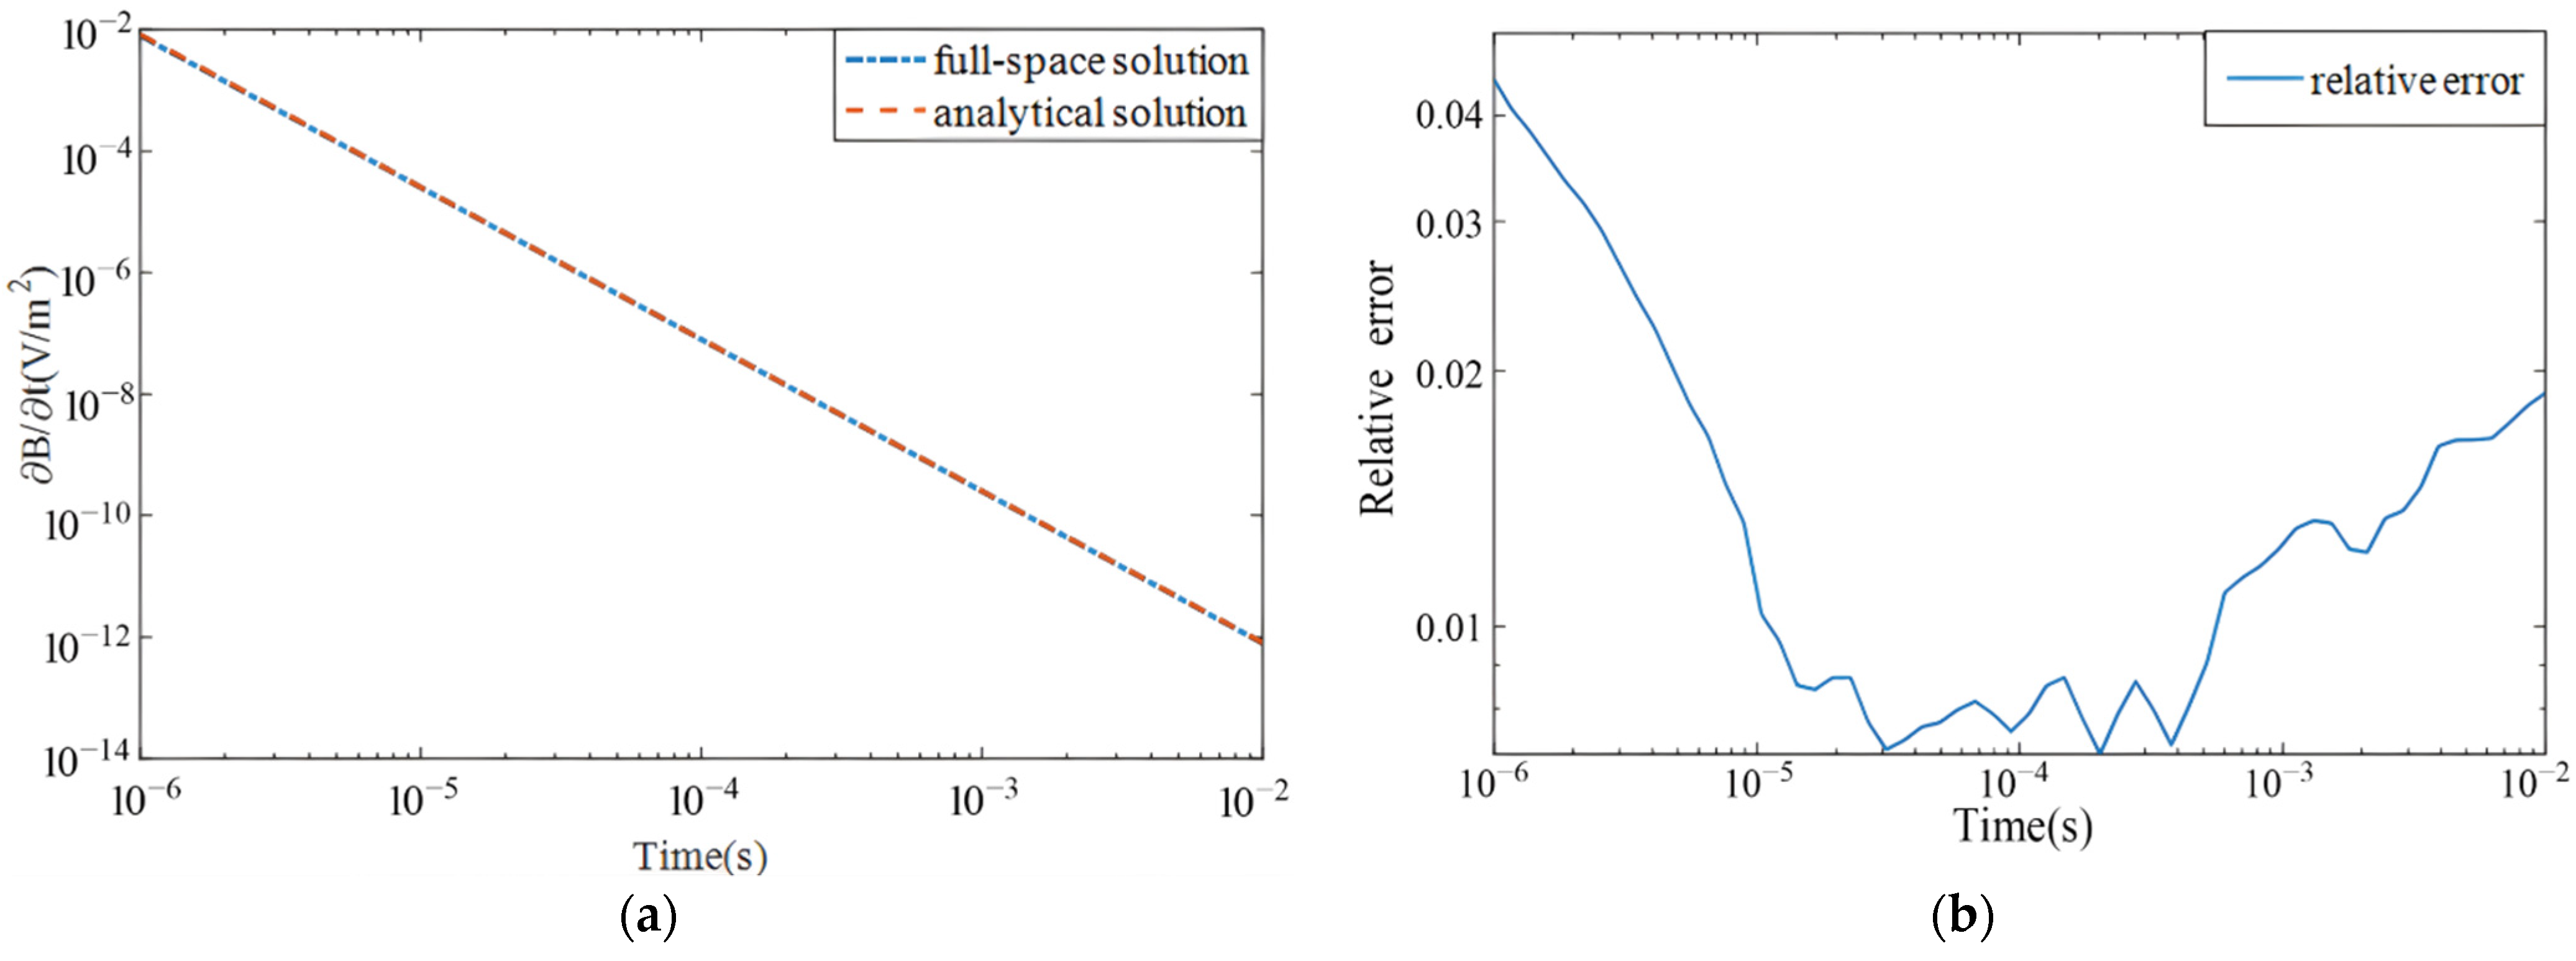
Figure 2a,b compares the numerical values obtained from the full-space model and the analytical solution. The compared parameter is the induced electromotive force at the center of the coil. The full-space numerical simulation results agree the analytical solution in each period, and the relative error in the induced electromotive force is below 4.5%.

3. Simulation of Water-Containing Bodies in Front of the Tunnel

This section develops several geoelectric models, based on the full-space model, for regular water-bearing bodies, water-bearing faults, sinking columns, and other water-bearing bodies in front of the roadway in order to study the transient electromagnetic reaction and compare the effect of the shape on its response.

3.1. Spheres, Cubes, and Cylinders

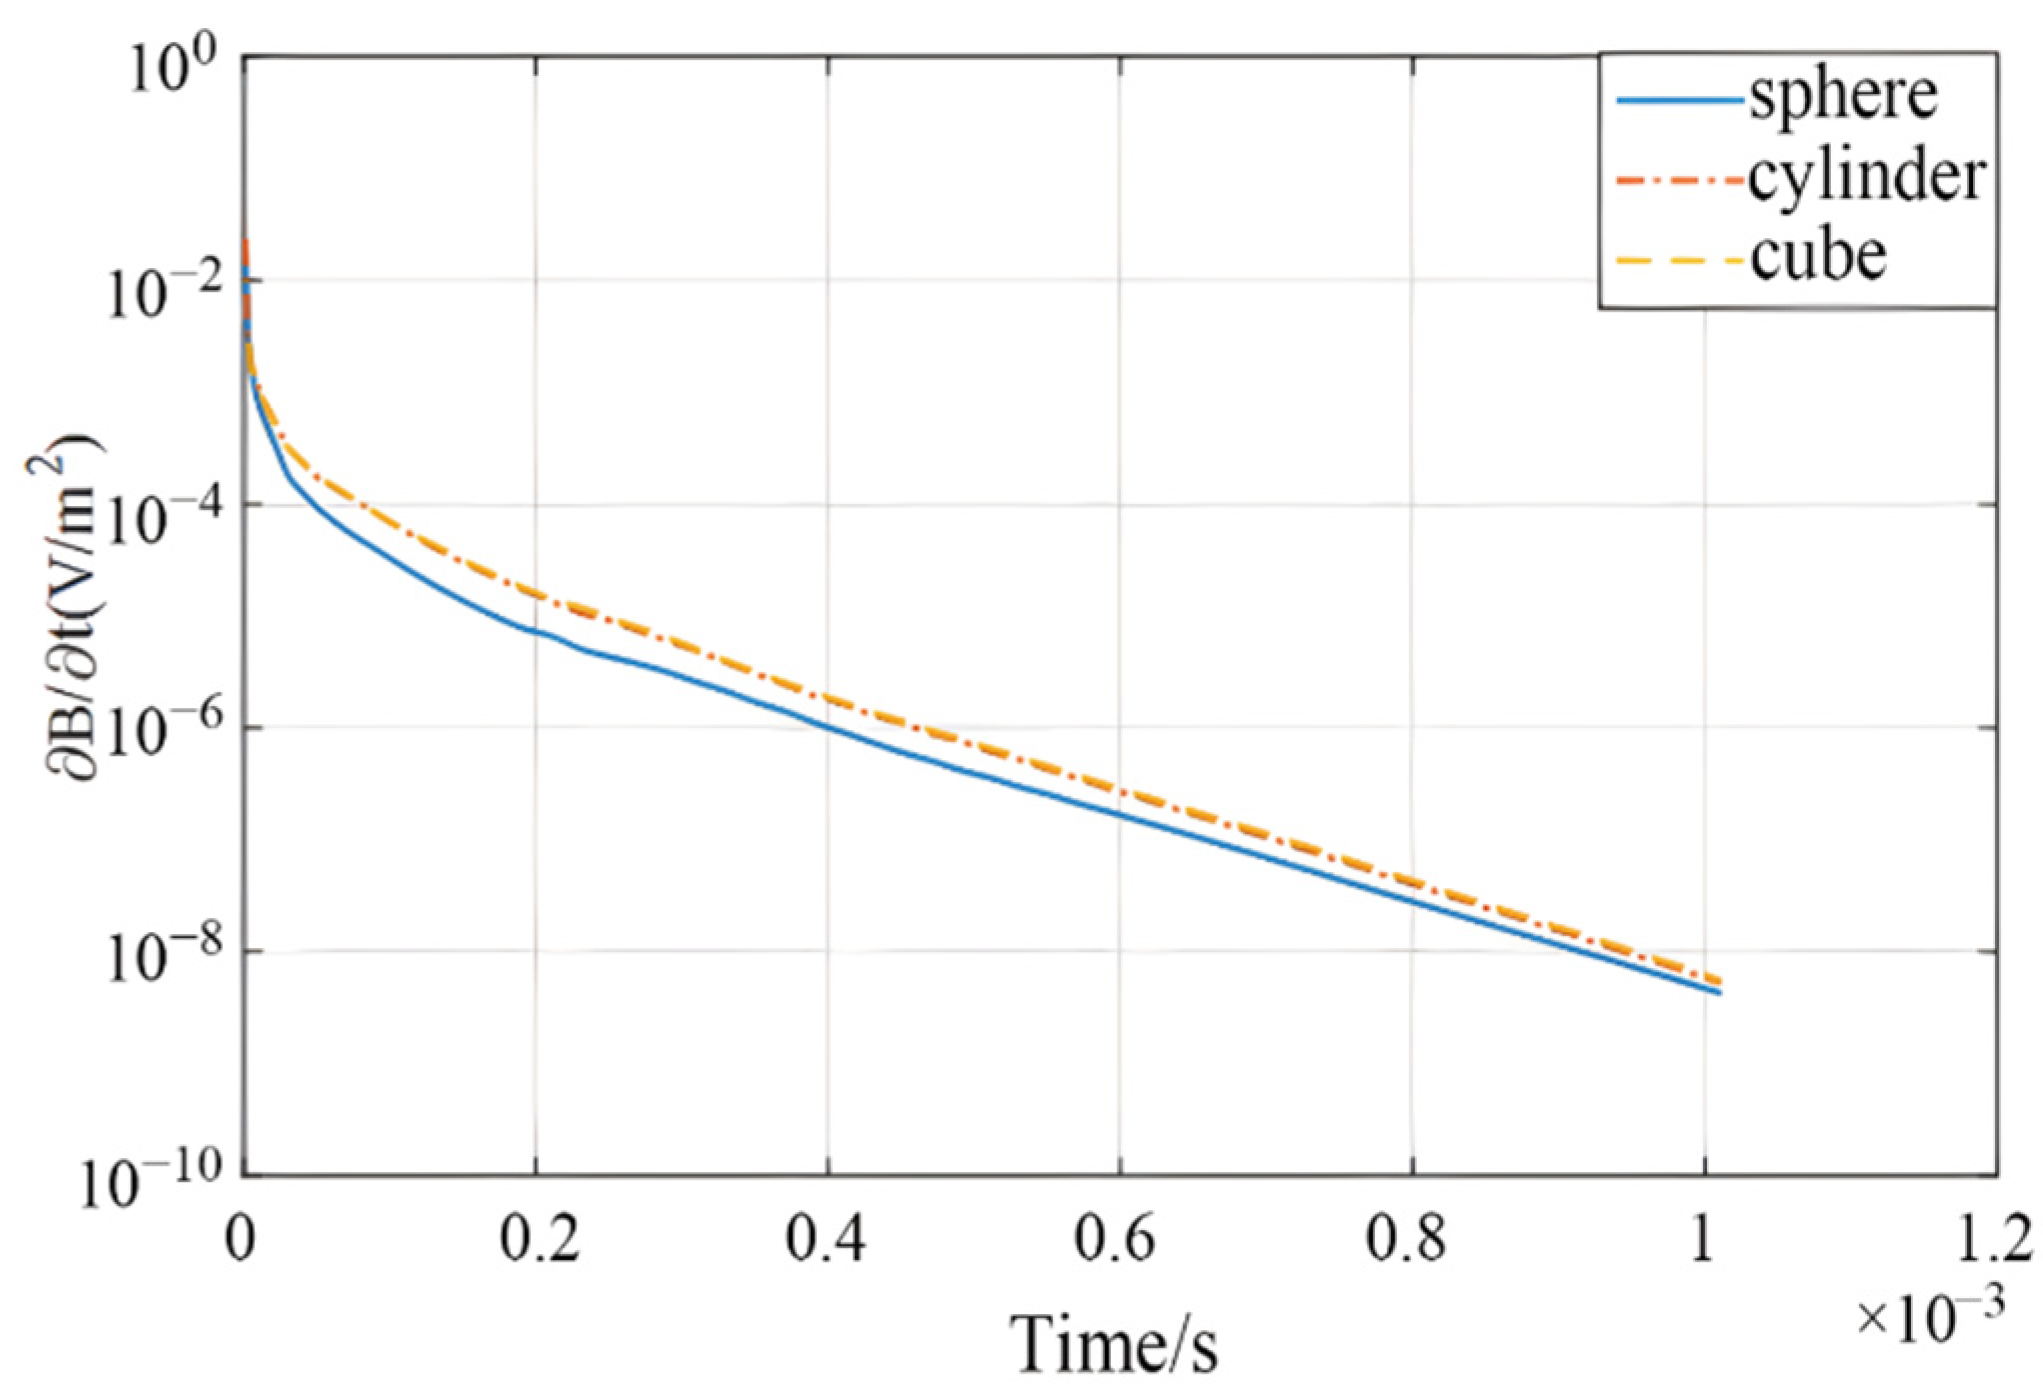
A layered geoelectrical model is established in this paper, which is divided into three layers, representing the roof, coal seam, and floor. The specific geometry and geoelectrical parameters are shown in Table 1. The tunnel’s length and cross-sectional measurements are set at 100 m and 4 m × 4 m, respectively. The interior area of the laneway is set as air, the resistivity of which is 1 × 10⁵ Ω·m. The peripheral surrounding rock resistivity of the laminated geoelectrical model is set to 100 Ω·m. A wire device serves as the excitation source, the coil is taken as a circular coil with a radius of 1 m, the emission coil is 60, the receiving coil is 40, the coil is placed on the digger head, the firing direction is in front of the digger head in order to be close to the real situation, and the coil and the digging head have a 25 mm pore. An abnormal geologic body is placed in front of the digger head, with a resistivity of 1 Ω·m; its parameters are listed in Table 2. The coil emission current is a square wave with a magnitude of 2 A, and the shutdown time is 20 s. Figure 3 shows the specific model and meshing results. Figure 4 demonstrates the electromotive attenuation law curve of three different shape models.

3.2. Aquifer Faults

To study the transient electromagnetic response of the aquifer fault in front of the digger head (see Figure 5), based on the previous location model, the abnormal object is replaced by a fault with dimensions of 10 m × 50 m × 50 m and an apparent resistivity of 1 Ω·m.
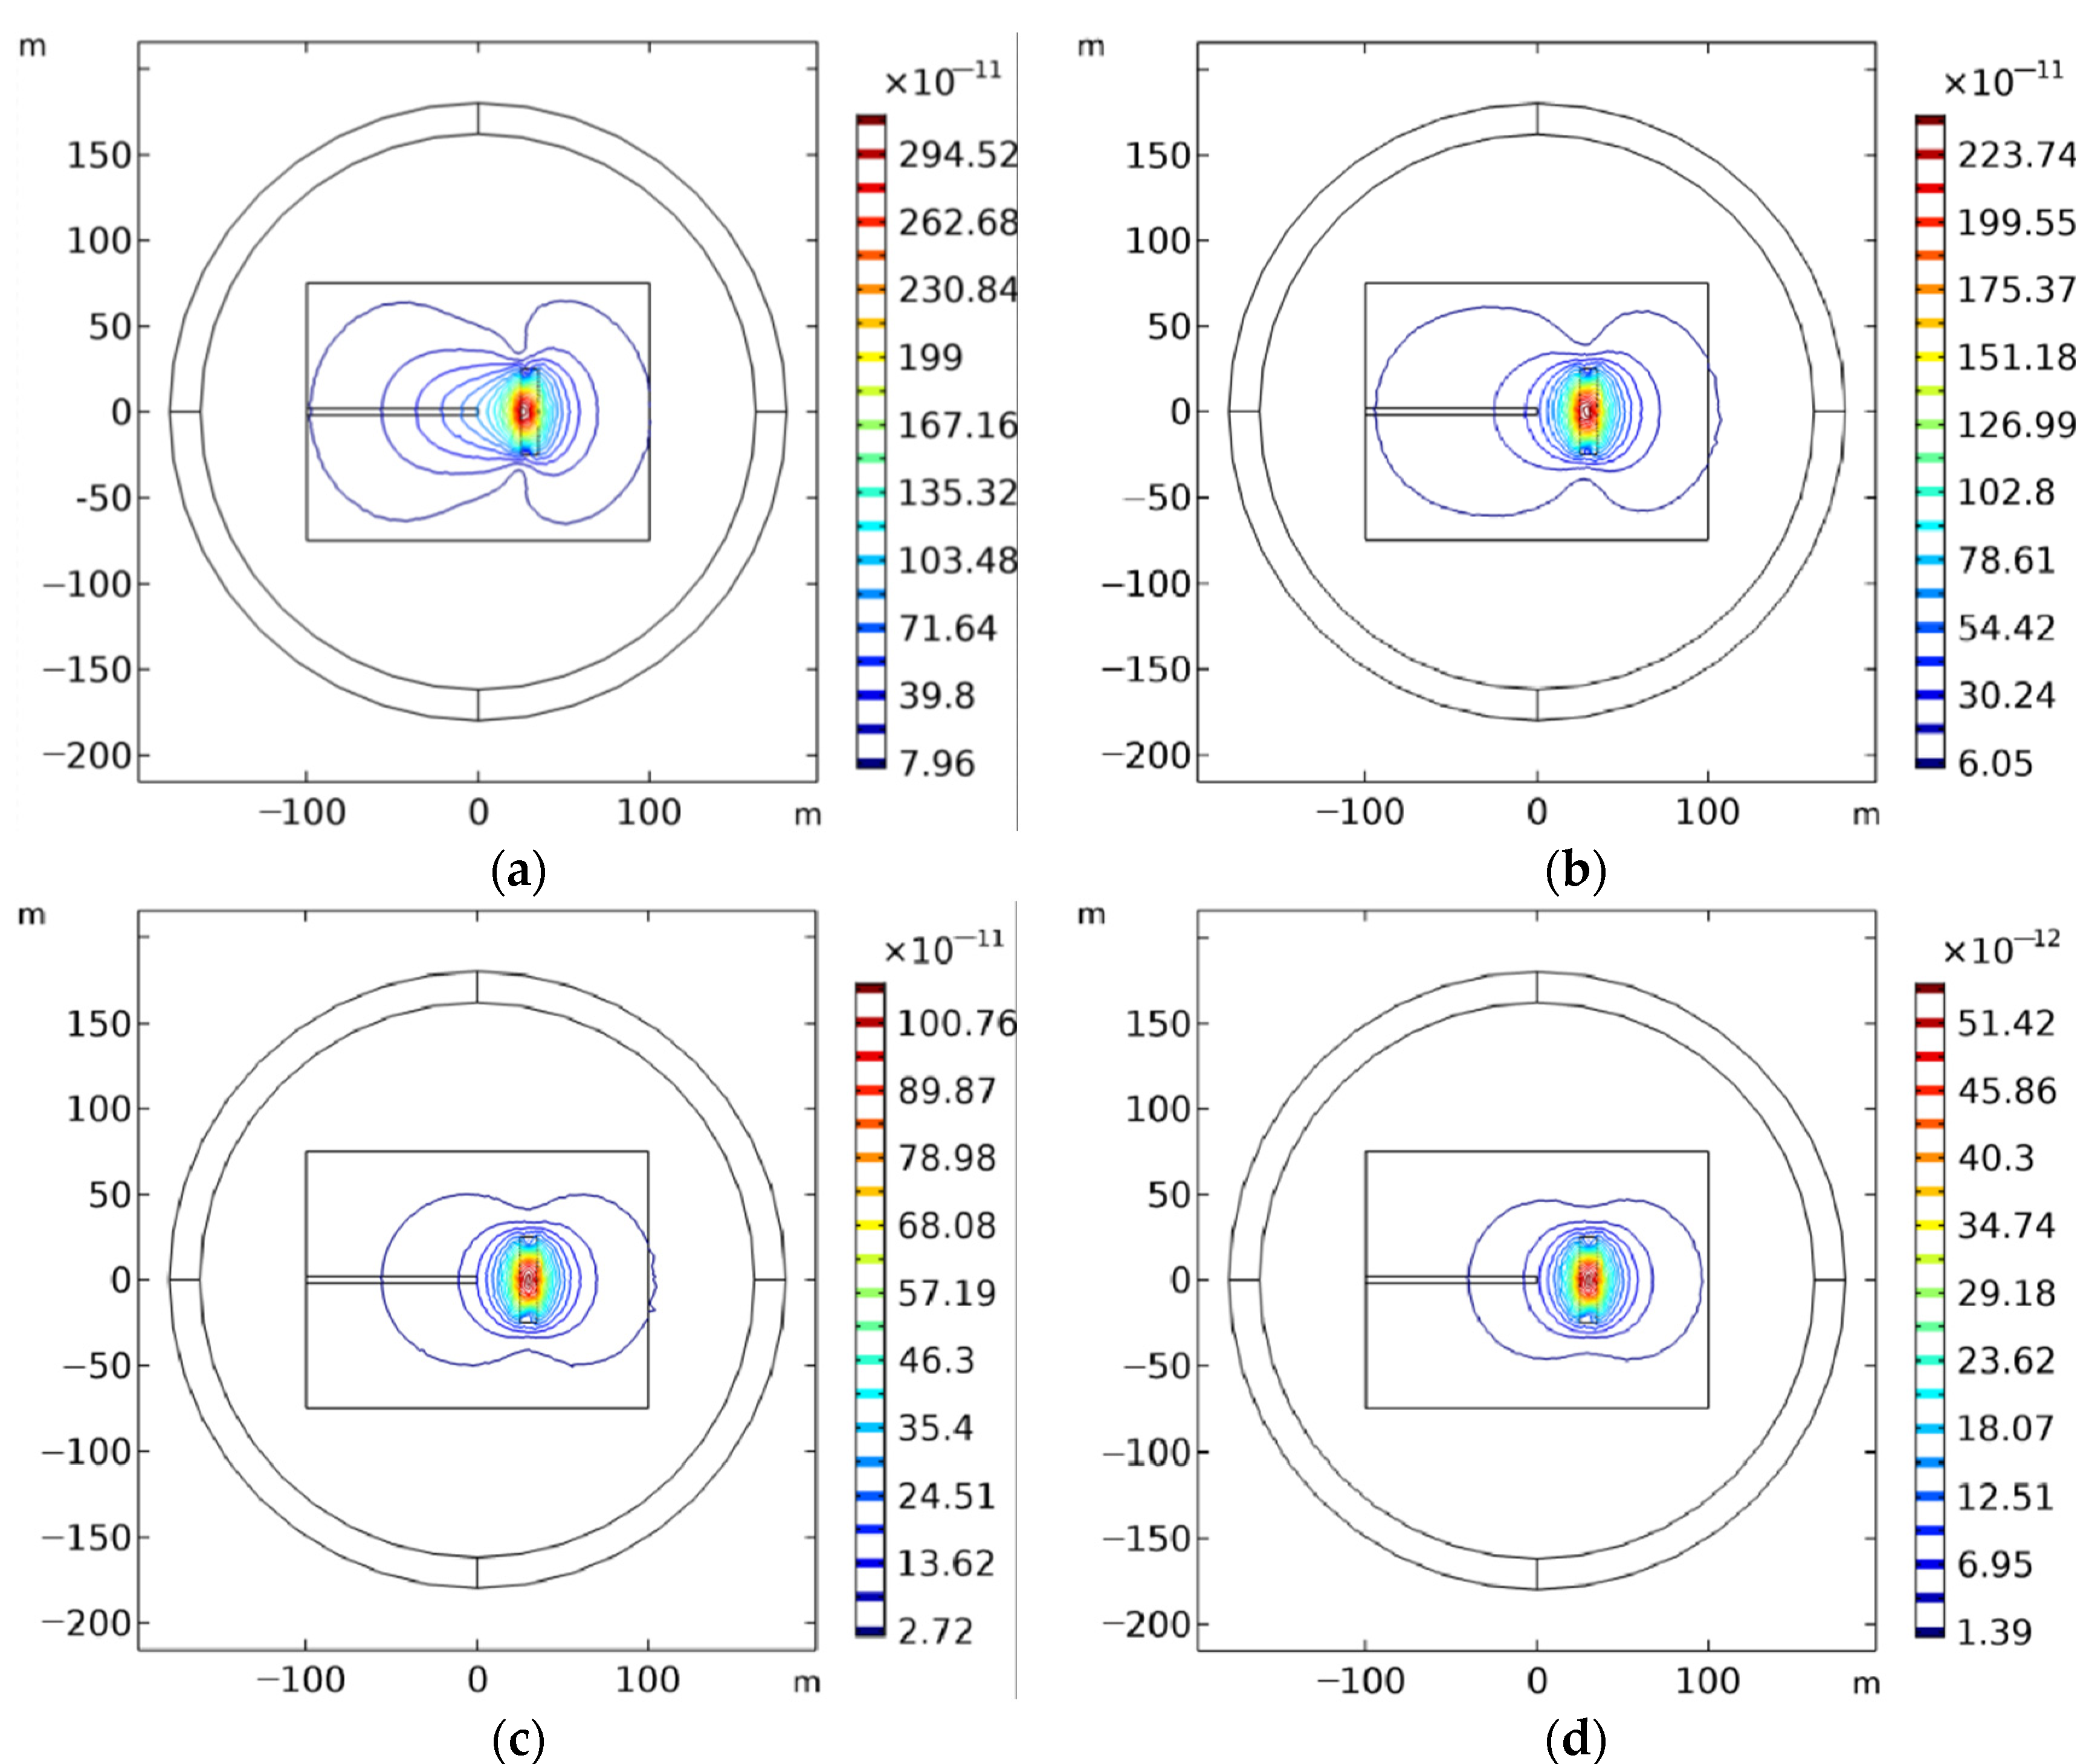
As the normal direction of the coil is toward the center of the fault, this section extracts the electromagnetic field Bx on its horizontal surface to plot the isoline for analysis, as shown in Figure 6. The induced electromagnetic field is formed in the fault when the current is shut off for 1 μs, and the peak value of Bx is close to 3 × 10⁻¹⁰ T. The Bx contours at the two short sides of the fault are dense and concave in the early stages. Over time, the electromagnetic field gradually spreads to the central area of the fault and decays continuously. The electromagnetic field becomes concentrated in the fault’s center after 50 μs, and the Bx contour map progressively becomes steady and starts to degrade.

4. Factors Affecting the Law of Transient Electromagnetic Response

The research in Section 3 demonstrates that the numerical simulation in this work complies with the fundamental rule of the transient electromagnetic field, which states that once the current is cut off, the electromagnetic field reaches a maximum value in the geological anomaly body and then progressively spreads to the center of the anomaly body, whilst constantly degrading.

4.1. Electrical Characteristics

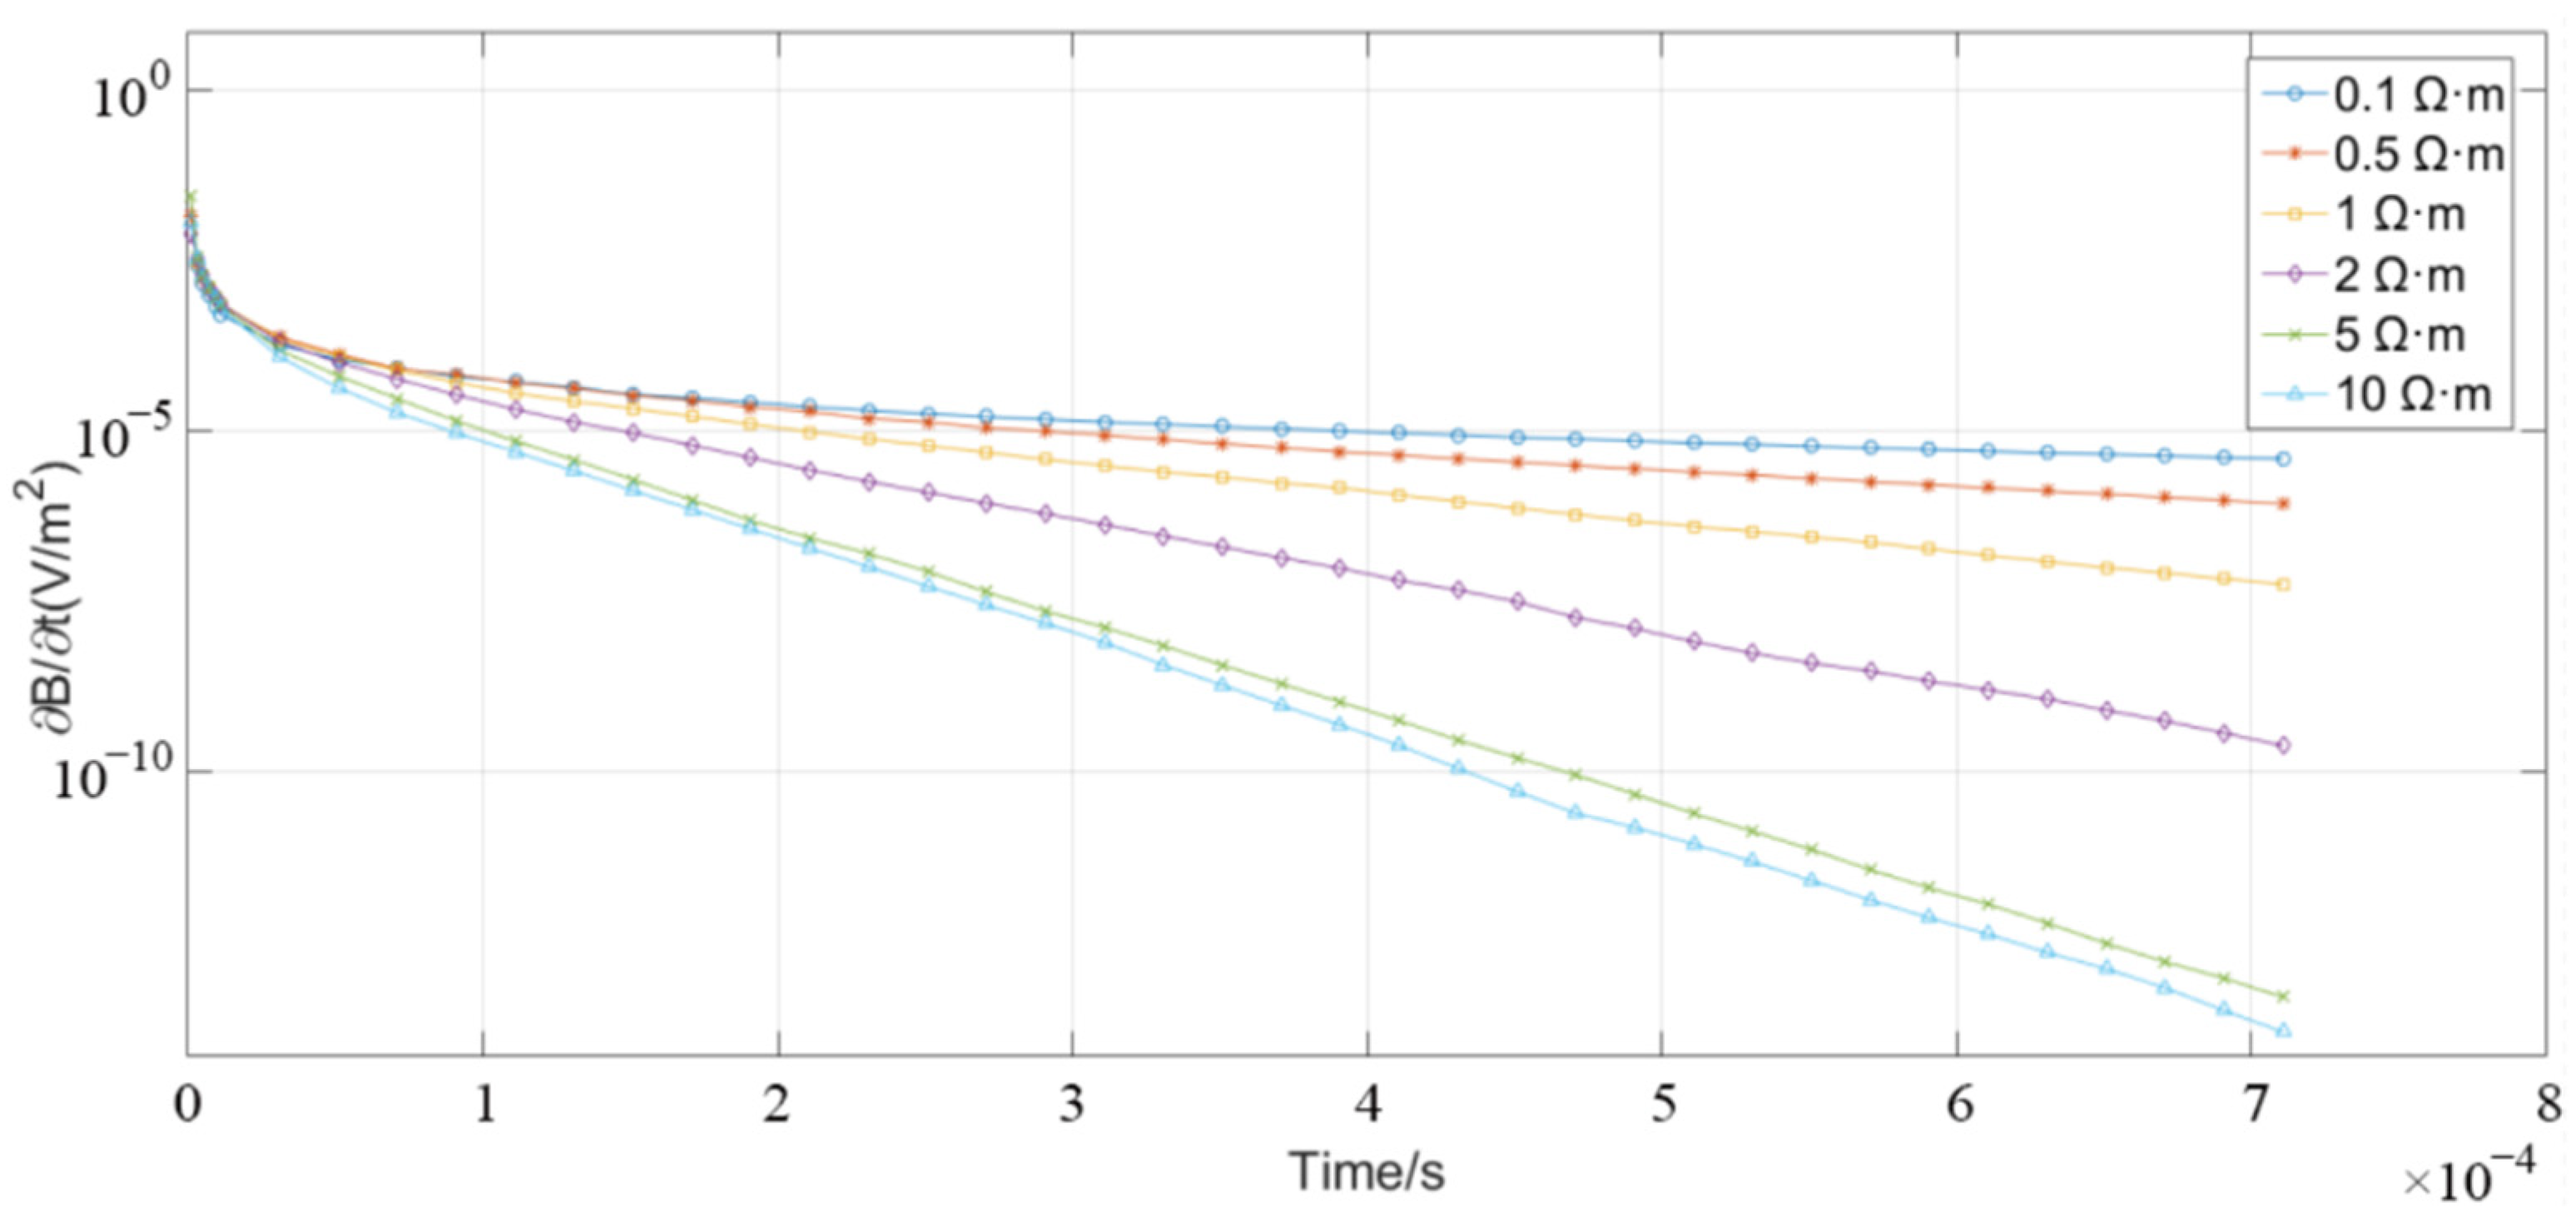
To investigate the impact of electrical characteristics on the transient electromagnetic response law, models with cylinder resistivity values of 0.1, 0.5, 1, 2, 5, and 10 Ω·m were created based on the cylinder model in Section 3.1. The computation’s findings are displayed in Figure 7. The coil picks up the response of the adjacent strata at first, therefore the curve’s attenuation speed is higher early on. After the cylinder generates the electromagnetic field and is received by the coil, the curve shows a significant difference: the attenuation rate of the 0.1 Ω·m model is the slowest, and then, from slow to fast, is 0.5, 1, 2, 5, 10 Ω·m. In particular, the 10 Ω·m model is attenuated to a less convergent stage after receiving an induced electromotive force of 1.47 × 10⁻¹⁴ V/m at the center of the coil, at 710 s, which is seven orders of magnitude lower than that of the 0.1 Ω·m model.

4.2. Distance

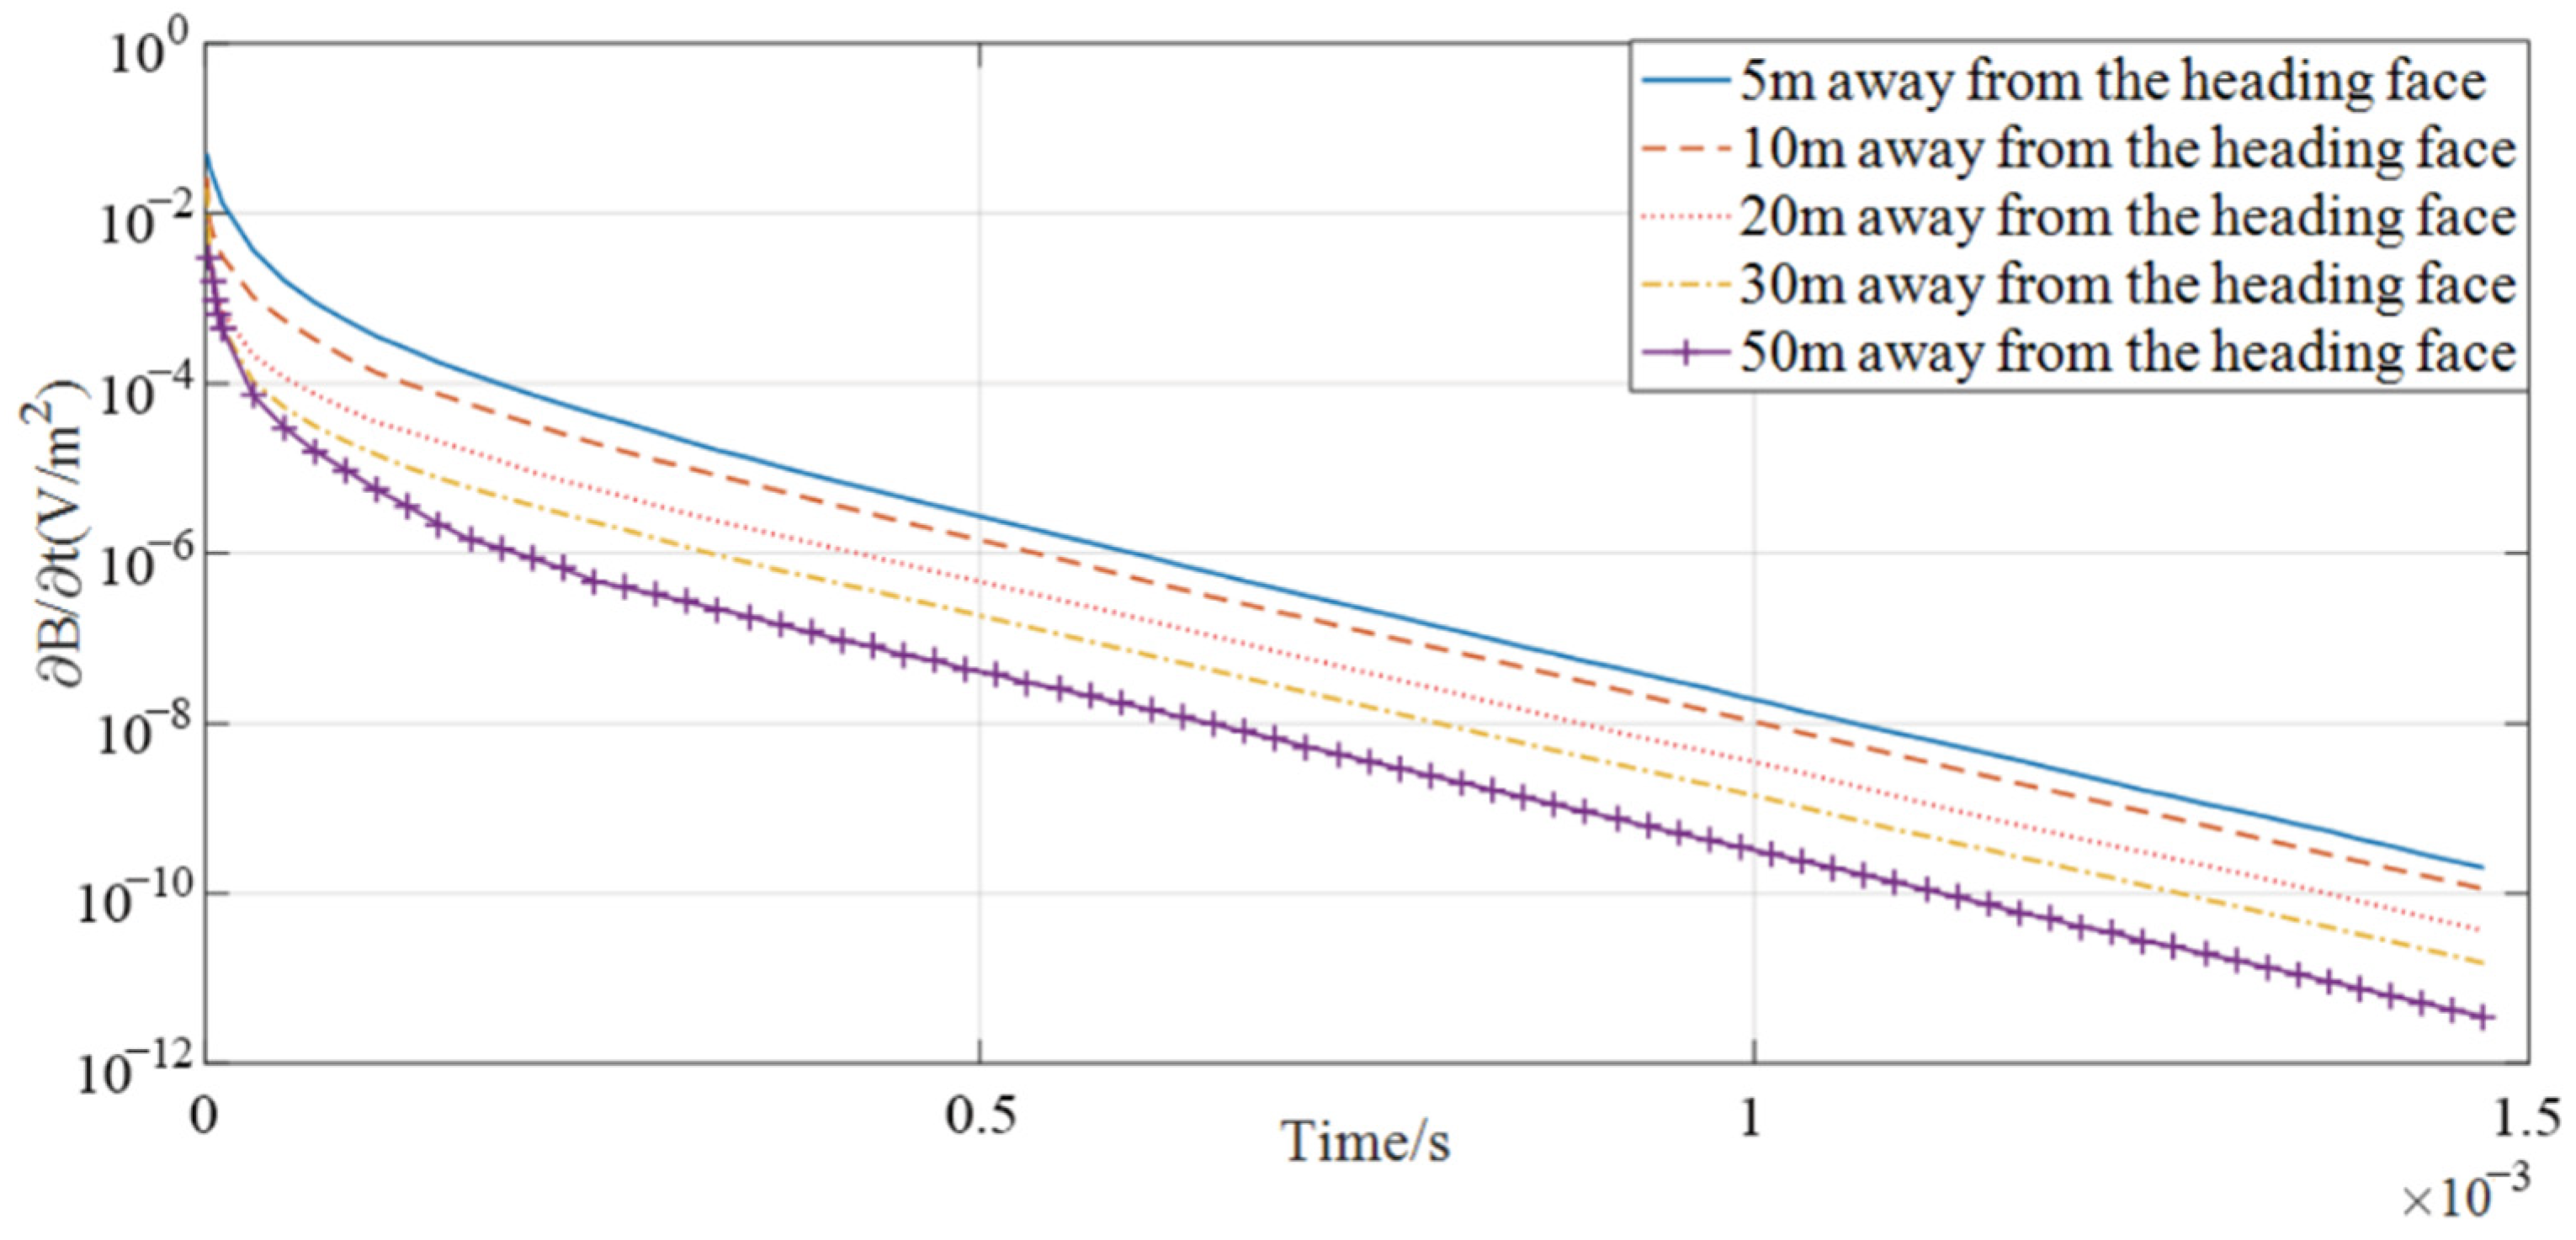
To study the effect of distance between the abnormal geologic body and the coil on the transient electromagnetic response, this paper establishes the same forward model as is presented in Section 3.1. The distances between the cylinder and the coil are set to 5, 10, 20, 30, and 50 m. Figure 8, showing the forward simulation results, indicates that the difference in the distances between the abnormal object and the multiple small return-line sources determines the difference in the intensity of the transient electromagnetic field; however, it has no effect on the attenuation law of the transient electromagnetic field.

4.3. Size

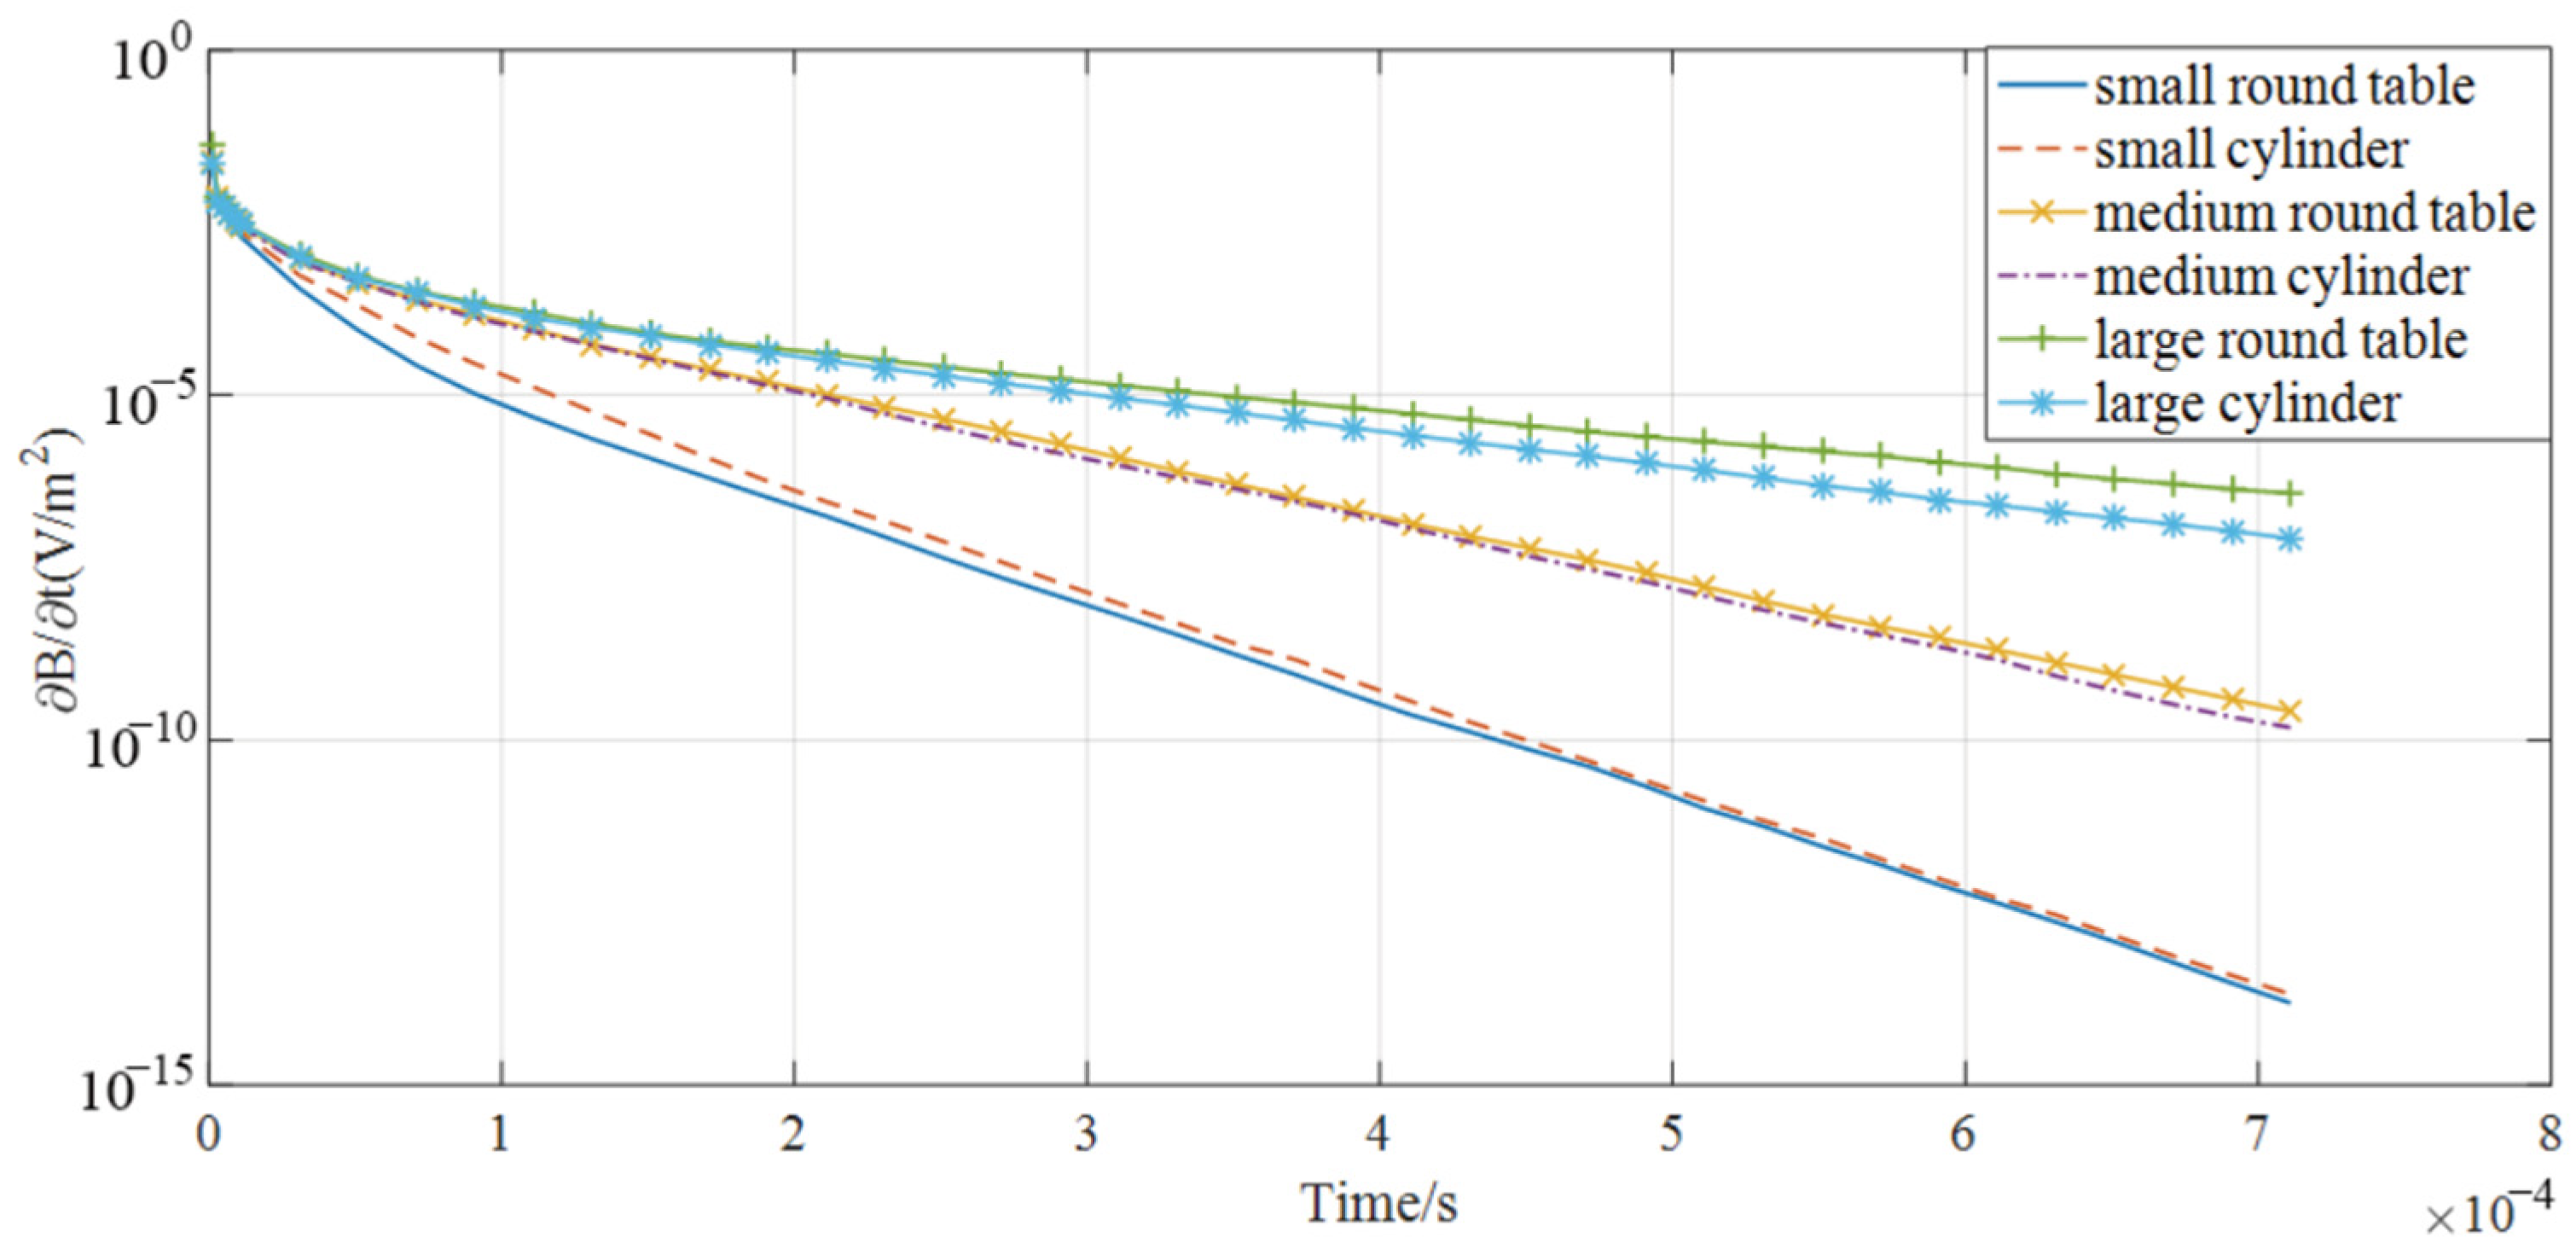
To study the influence of the abnormal geologic body size on the transient electromagnetic response at different times, six different columnar drop column models were established and divided into small, medium and large groups, according to the model size. In each set of models, the round table model has a larger volume than the cylindrical model, and in particular, the volume of the first group of small round tables is smaller than that of the small cylinder (see Table 3).
Figure 9 shows the attenuation curve of the induced electromotive force at the center of the coil in each model, after the current is switched off. The attenuation curve is consistent with the grouping law.

4.4. Projected Area

Based on the above findings, we speculated that the attenuation speed of the induced electromagnetic field is influenced by the difference between the contact surface of a low resistivity anomaly and an electromagnetic field. The concept of “electromagnetic field projection area” is formally proposed in this paper. After the current is switched off, an inductive electromagnetic field is generated in the abnormal geologic body, and the projection on the abnormal coil plane at the peak center of the inductive electromagnetic field at a certain moment is called the electromagnetic field projection area at that moment. It can also be understood as a cross-section, at which the abnormal geologic body is parallel to the coil plane. It is of great significance to use this concept to analyze the law of electromagnetic attenuation.
Based on the findings of Section 3.2, this section creates models with normal plane inclination angles of −60°, −30°, 0°, 30°, and 60° for study in order to confirm the accuracy of this supposition. The size and electrical properties of the fault are consistent with the model in Section 3.2. The model is displayed in Figure 10. The distance between the various models and coils is shown to be 0° > −30° = 30° > −60° = 60° in descending order.
Figure 11a–c shows the induced electromotive attenuation curve at the center of the coil after each model is closed. The process of inductive electromagnetic attenuation of each model can be divided into two stages: At the early stage after the shutdown, depending on the nearest distance of each model to the coil, the order of the induced electromotive force is 60° = 60° > 30° = 30° > 0°; at the later stage, as the 0° model has the largest cross-sectional area and the slowest decay rate in comparison to the other models, its induced electromotive force eventually exceeds that of the −30° and 30° models. The late-induced electromotive force from large to small follows the order: −60° = 60° > 0° −30° = 30°. Moreover, both the symmetrical −60° and 60° models and the −30° and 30° models have the same attenuation rules. Similarly, the −60° (60°) model and −30° (30°) model show a similar attenuation pattern due to the small difference in the projection area of their electromagnetic fields.
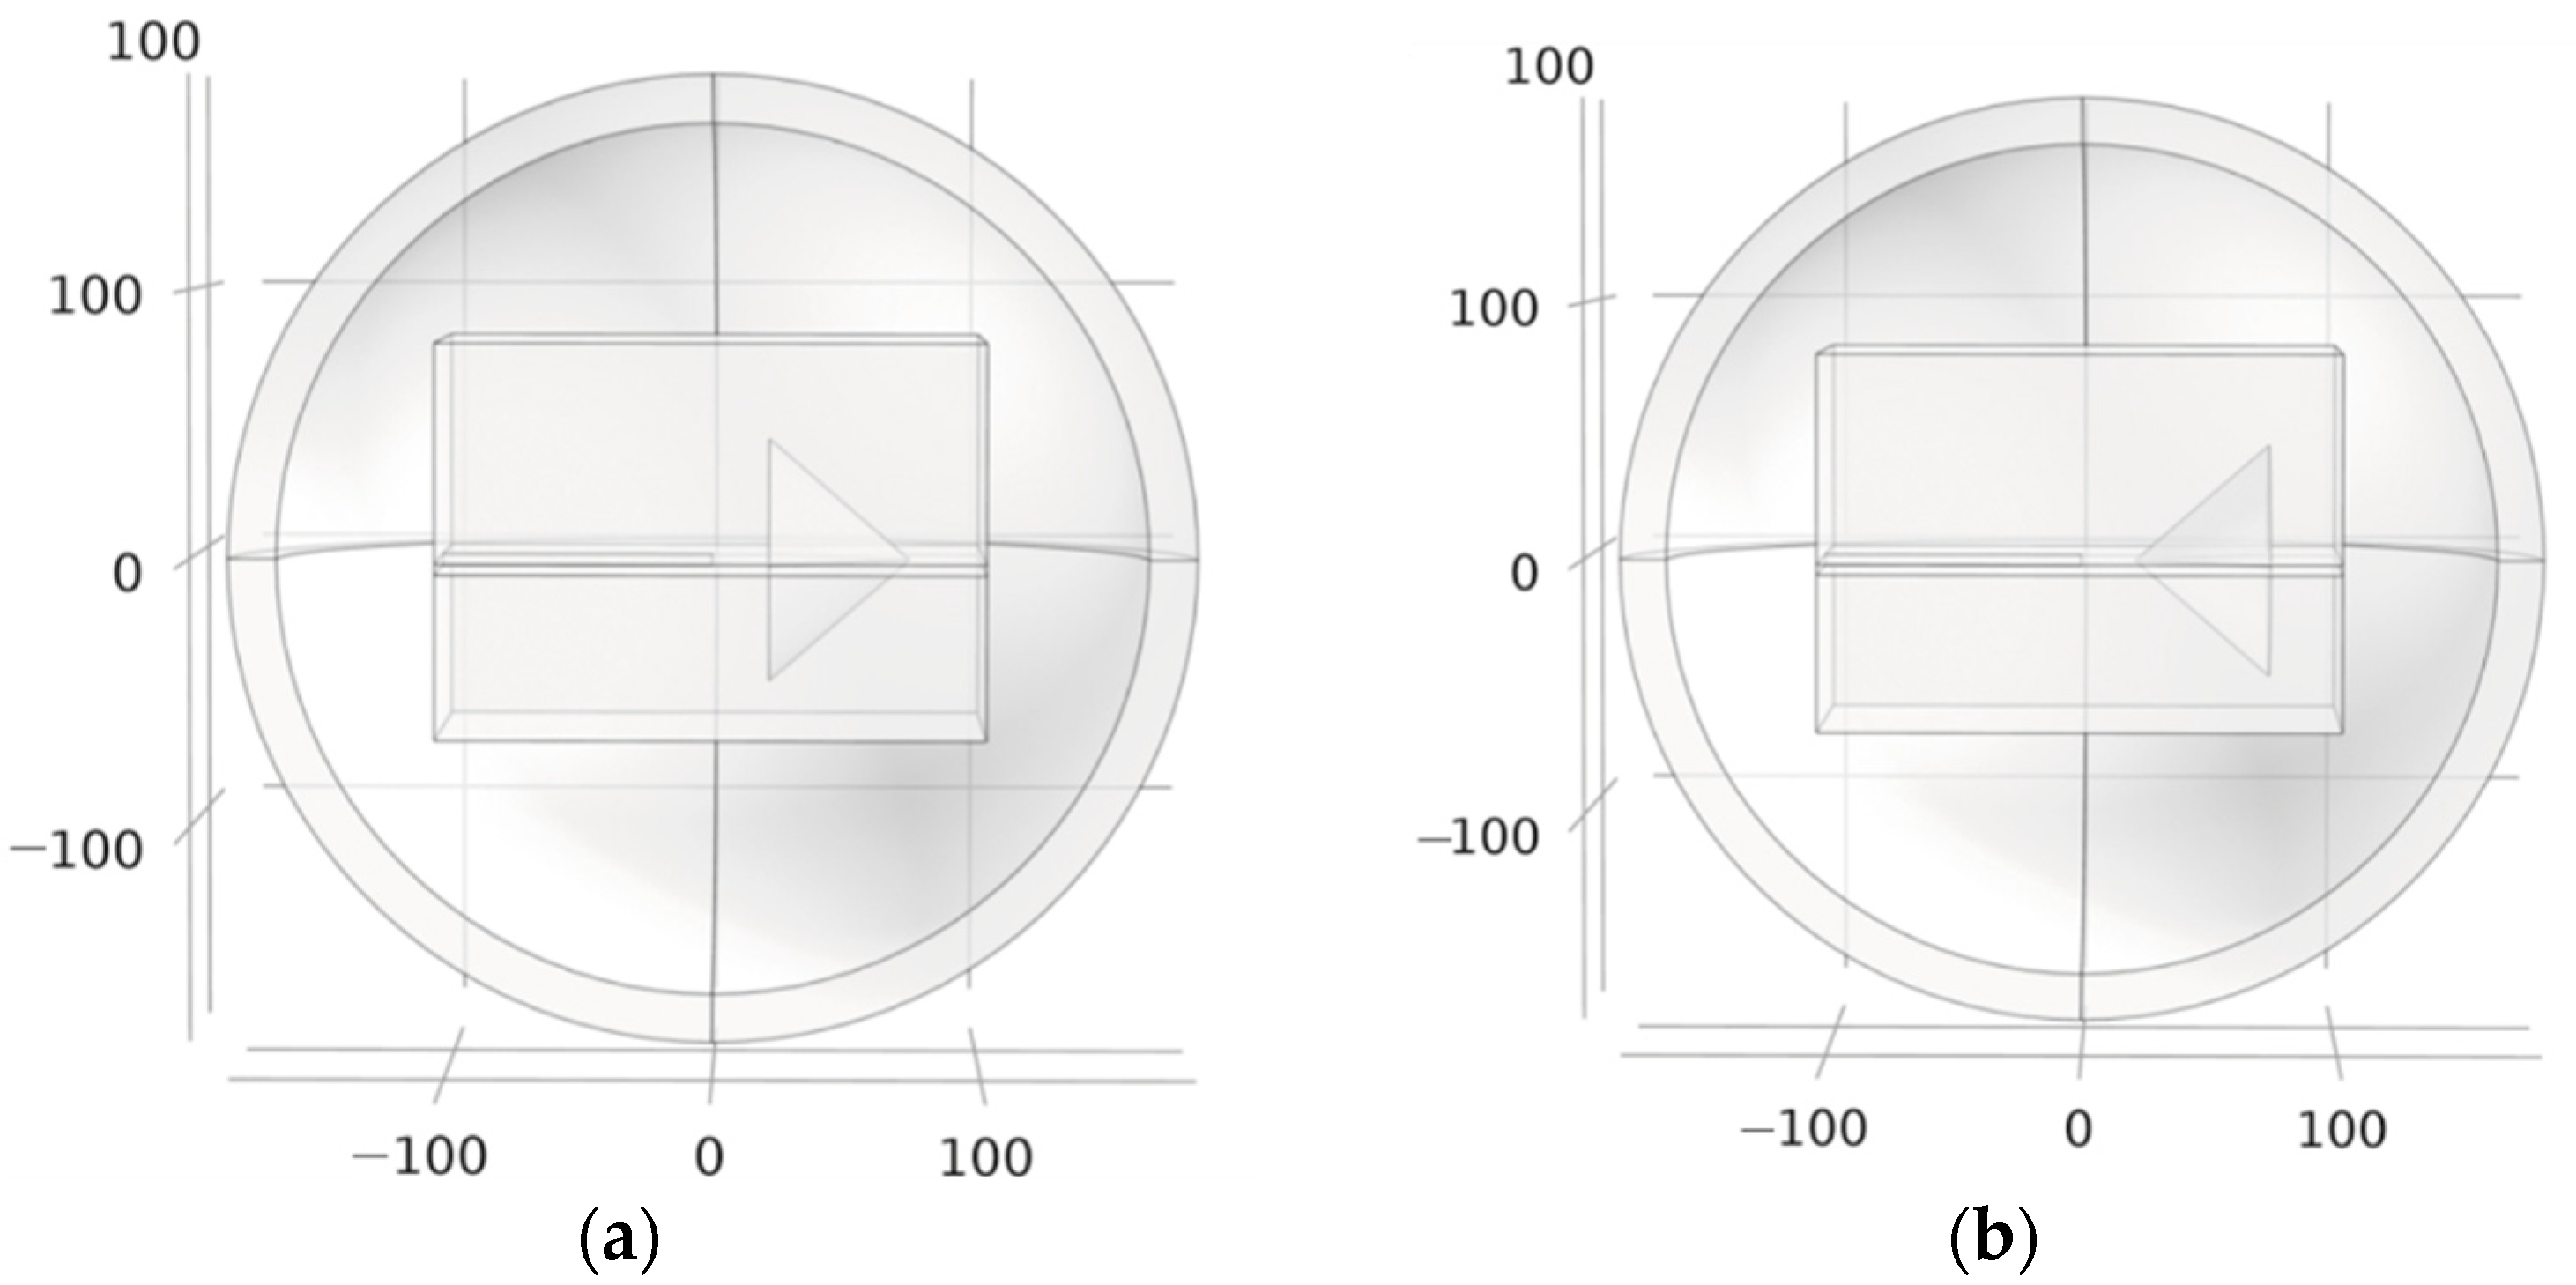
To examine the aforementioned theory further, based on the cube, sphere, and cylinder models in Section 3.1, two cone models with large differences in the projection area of the early and late electromagnetic fields are added, as shown in the following illustration. The conical inclination in Figure 12a is 90° and that in Figure 12b is −90° (see Table 4).
Figure 13a–c shows a comparison of the induced electromotive attenuation law at the center of the coil, after each model is closed, and after the current is just switched off, the coil has not received the transient electromagnetic field from the conical model; the curve attenuation law is the same. In 3 μs after shutdown, the induced electromotive force amplitude on the coil is the same because the distance between each model and the coil is also the same. Thereafter, the induced electromotive potential of each model shows a large difference in terms of the attenuation speed. The 90° conical model’s attenuation speed is lowest because it has the biggest electromagnetic field projection area at the start of the inductive electromagnetic field. Cubes and cylinders follow the same law. Early on, the sphere’s electromagnetic field projection area is modest, which causes a higher attenuation speed. Later, when its electromagnetic field projection area grows and surpasses that of the cube and cylinder models (the greatest volume), its attenuation speed lowers. The decay rate of the −90° conical model is the fastest, and the decay rate decreases with the passage of time. When the induced electromagnetic field propagates to its geometric center of gravity, the decay rate is stable and consistent with the 90° conical model.

5. Field Application

The mine, which predominantly mines the Carboniferous Permian 6th coal seam, uses the inclined shaft development method and was designed to produce 1000 Mt per year. Coarse sandstone aquifer is overlaid on top of the mine’s main coal seam’s roof, and Ordovician limestone aquifer is buried beneath it. The underlying Ordovician ash confined aquifer places pressure on the 6th coal in the area, and the Ordovician ash water level in this coal mine is +869.7 m. Limestone water may inrush to mining sites through the vertical guide water structure and weak parts of the water-barrier layer when it meets faults and collapse columns as a result of the unequal water wealth of the Ordovician limestone aquifer and strong water wealth in karst development areas. There was water flowing from the roof, around 10 m behind the digging head, when underground production was underway on the site.

5.1. Arrangement

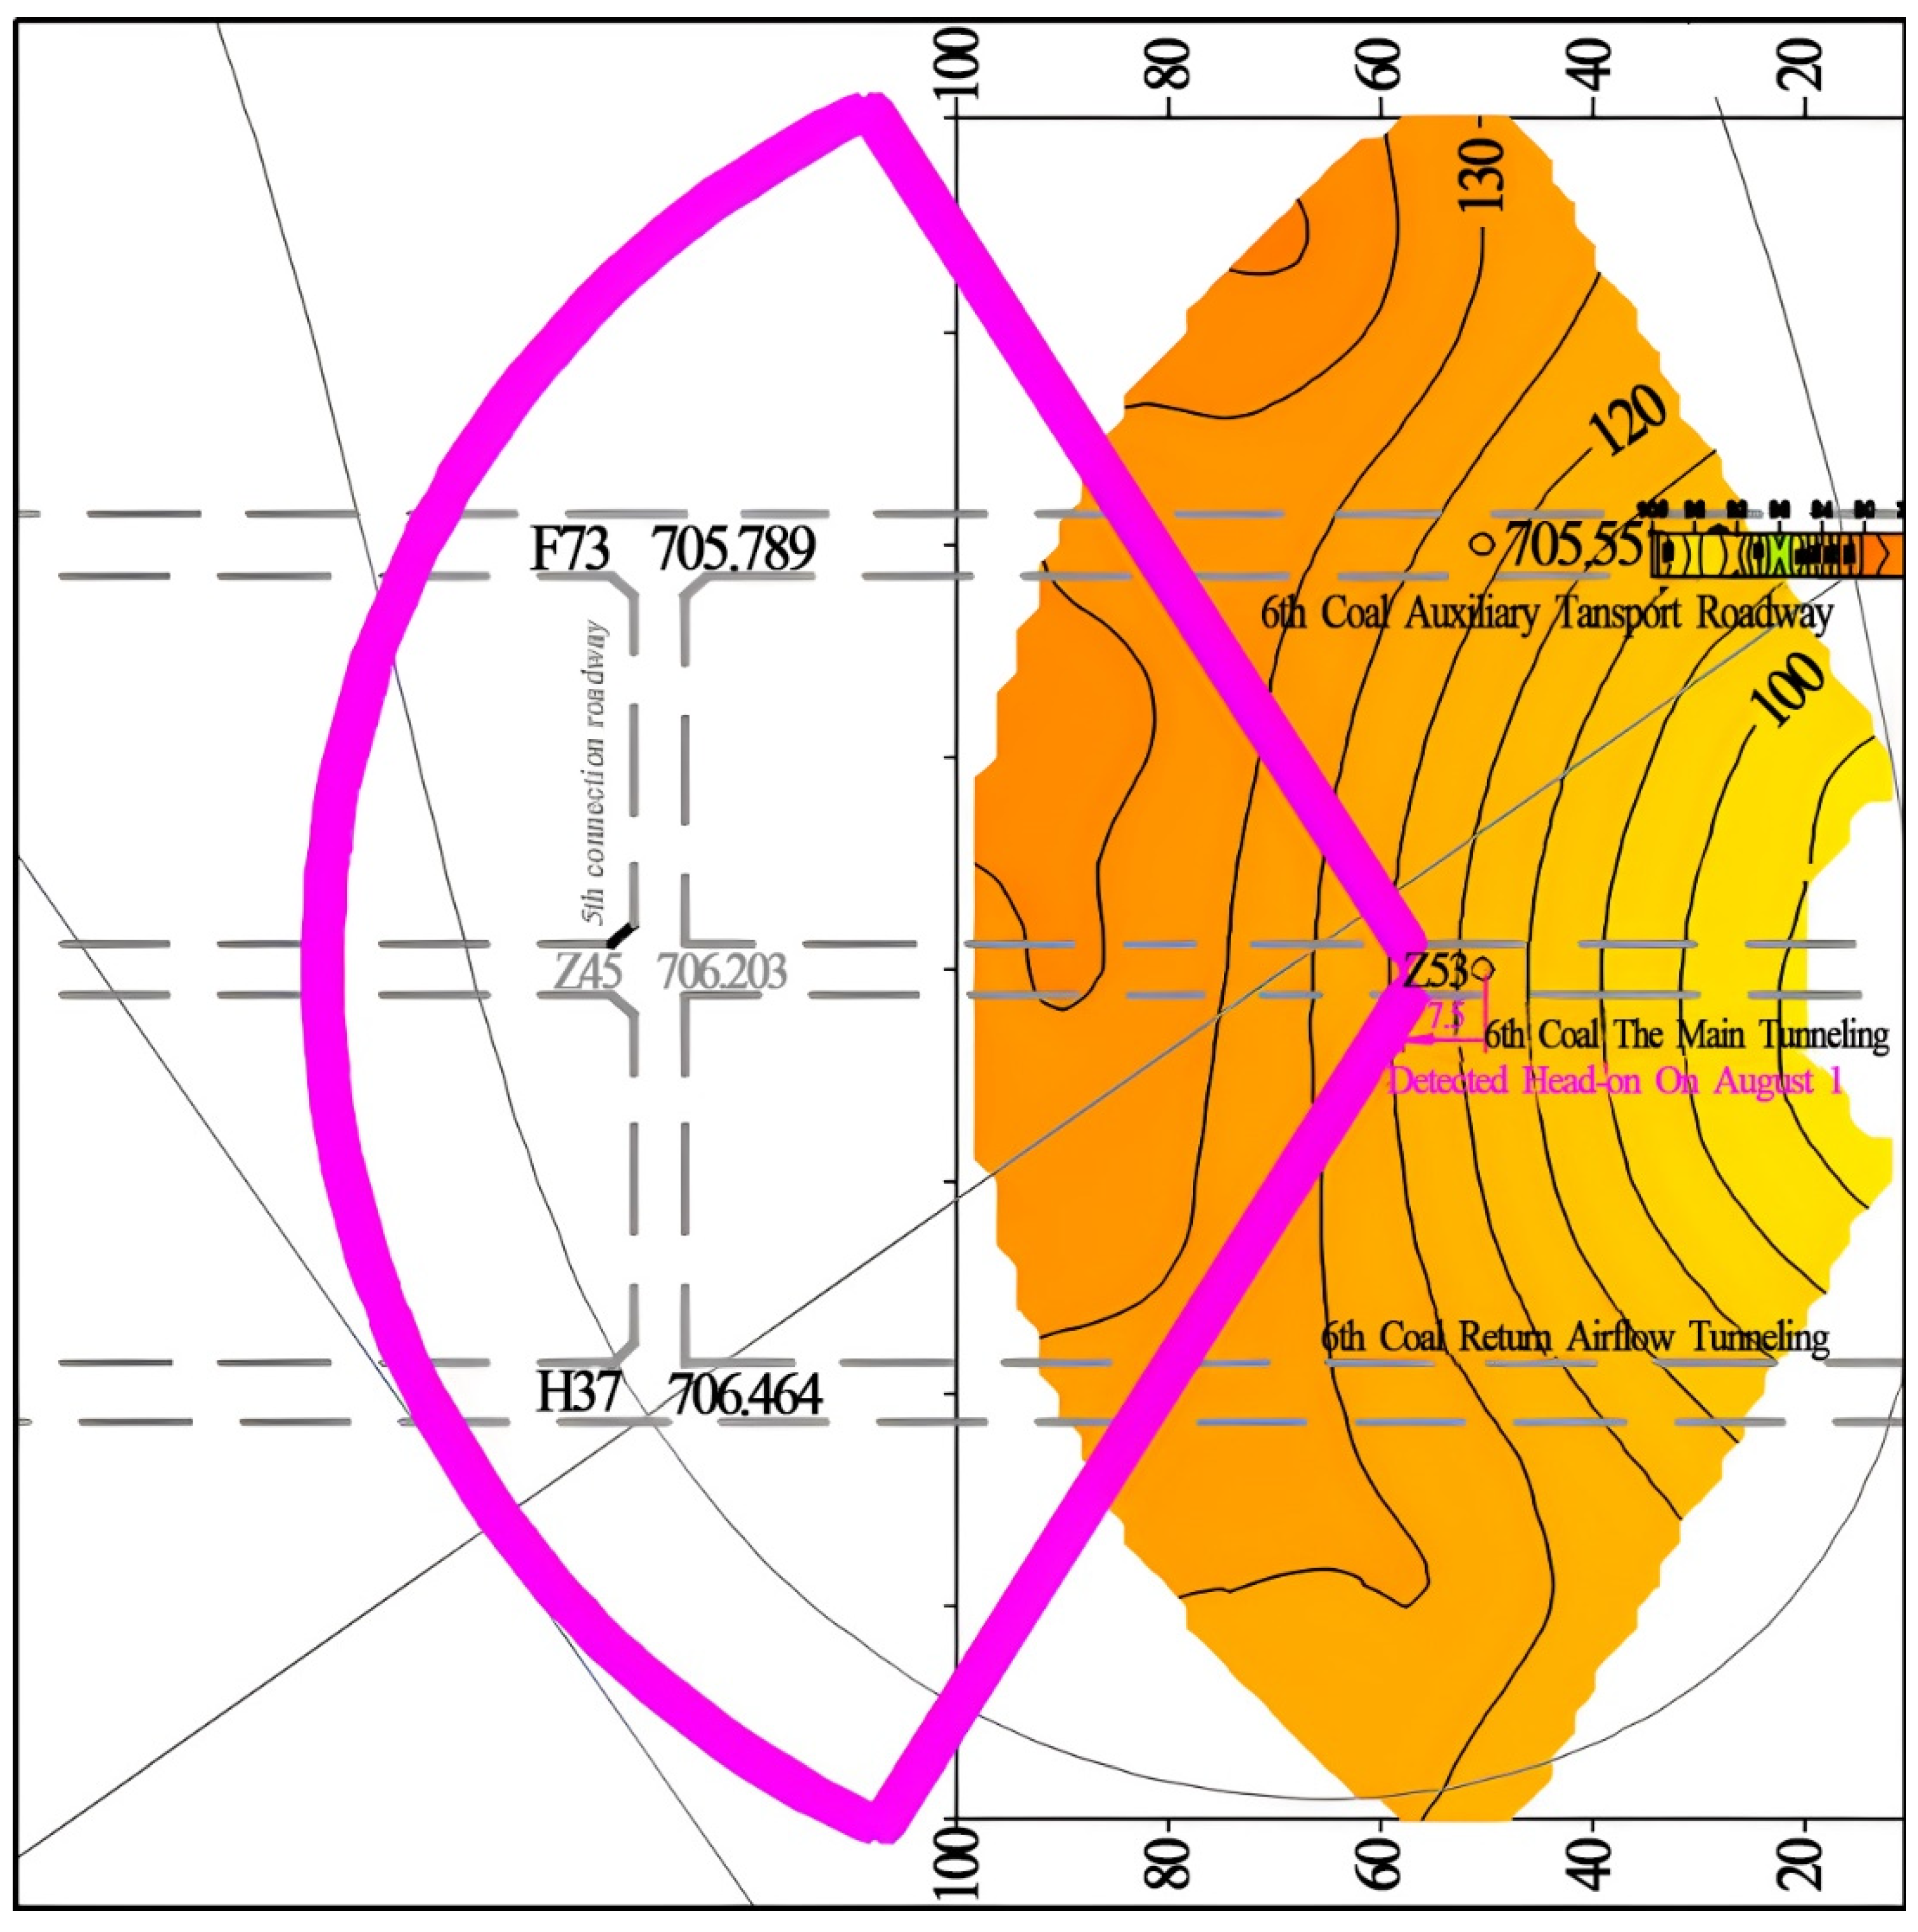
TEM is used to identify the water-rich anomalous area between 7.5 m and 107.5 m before the Z53 point at the design and construction location, which is located 7.5 m before the measurement point Z53 of the six main coal transportation lanes. The detecting region is located in the middle of the magenta section, as shown in Figure 14.
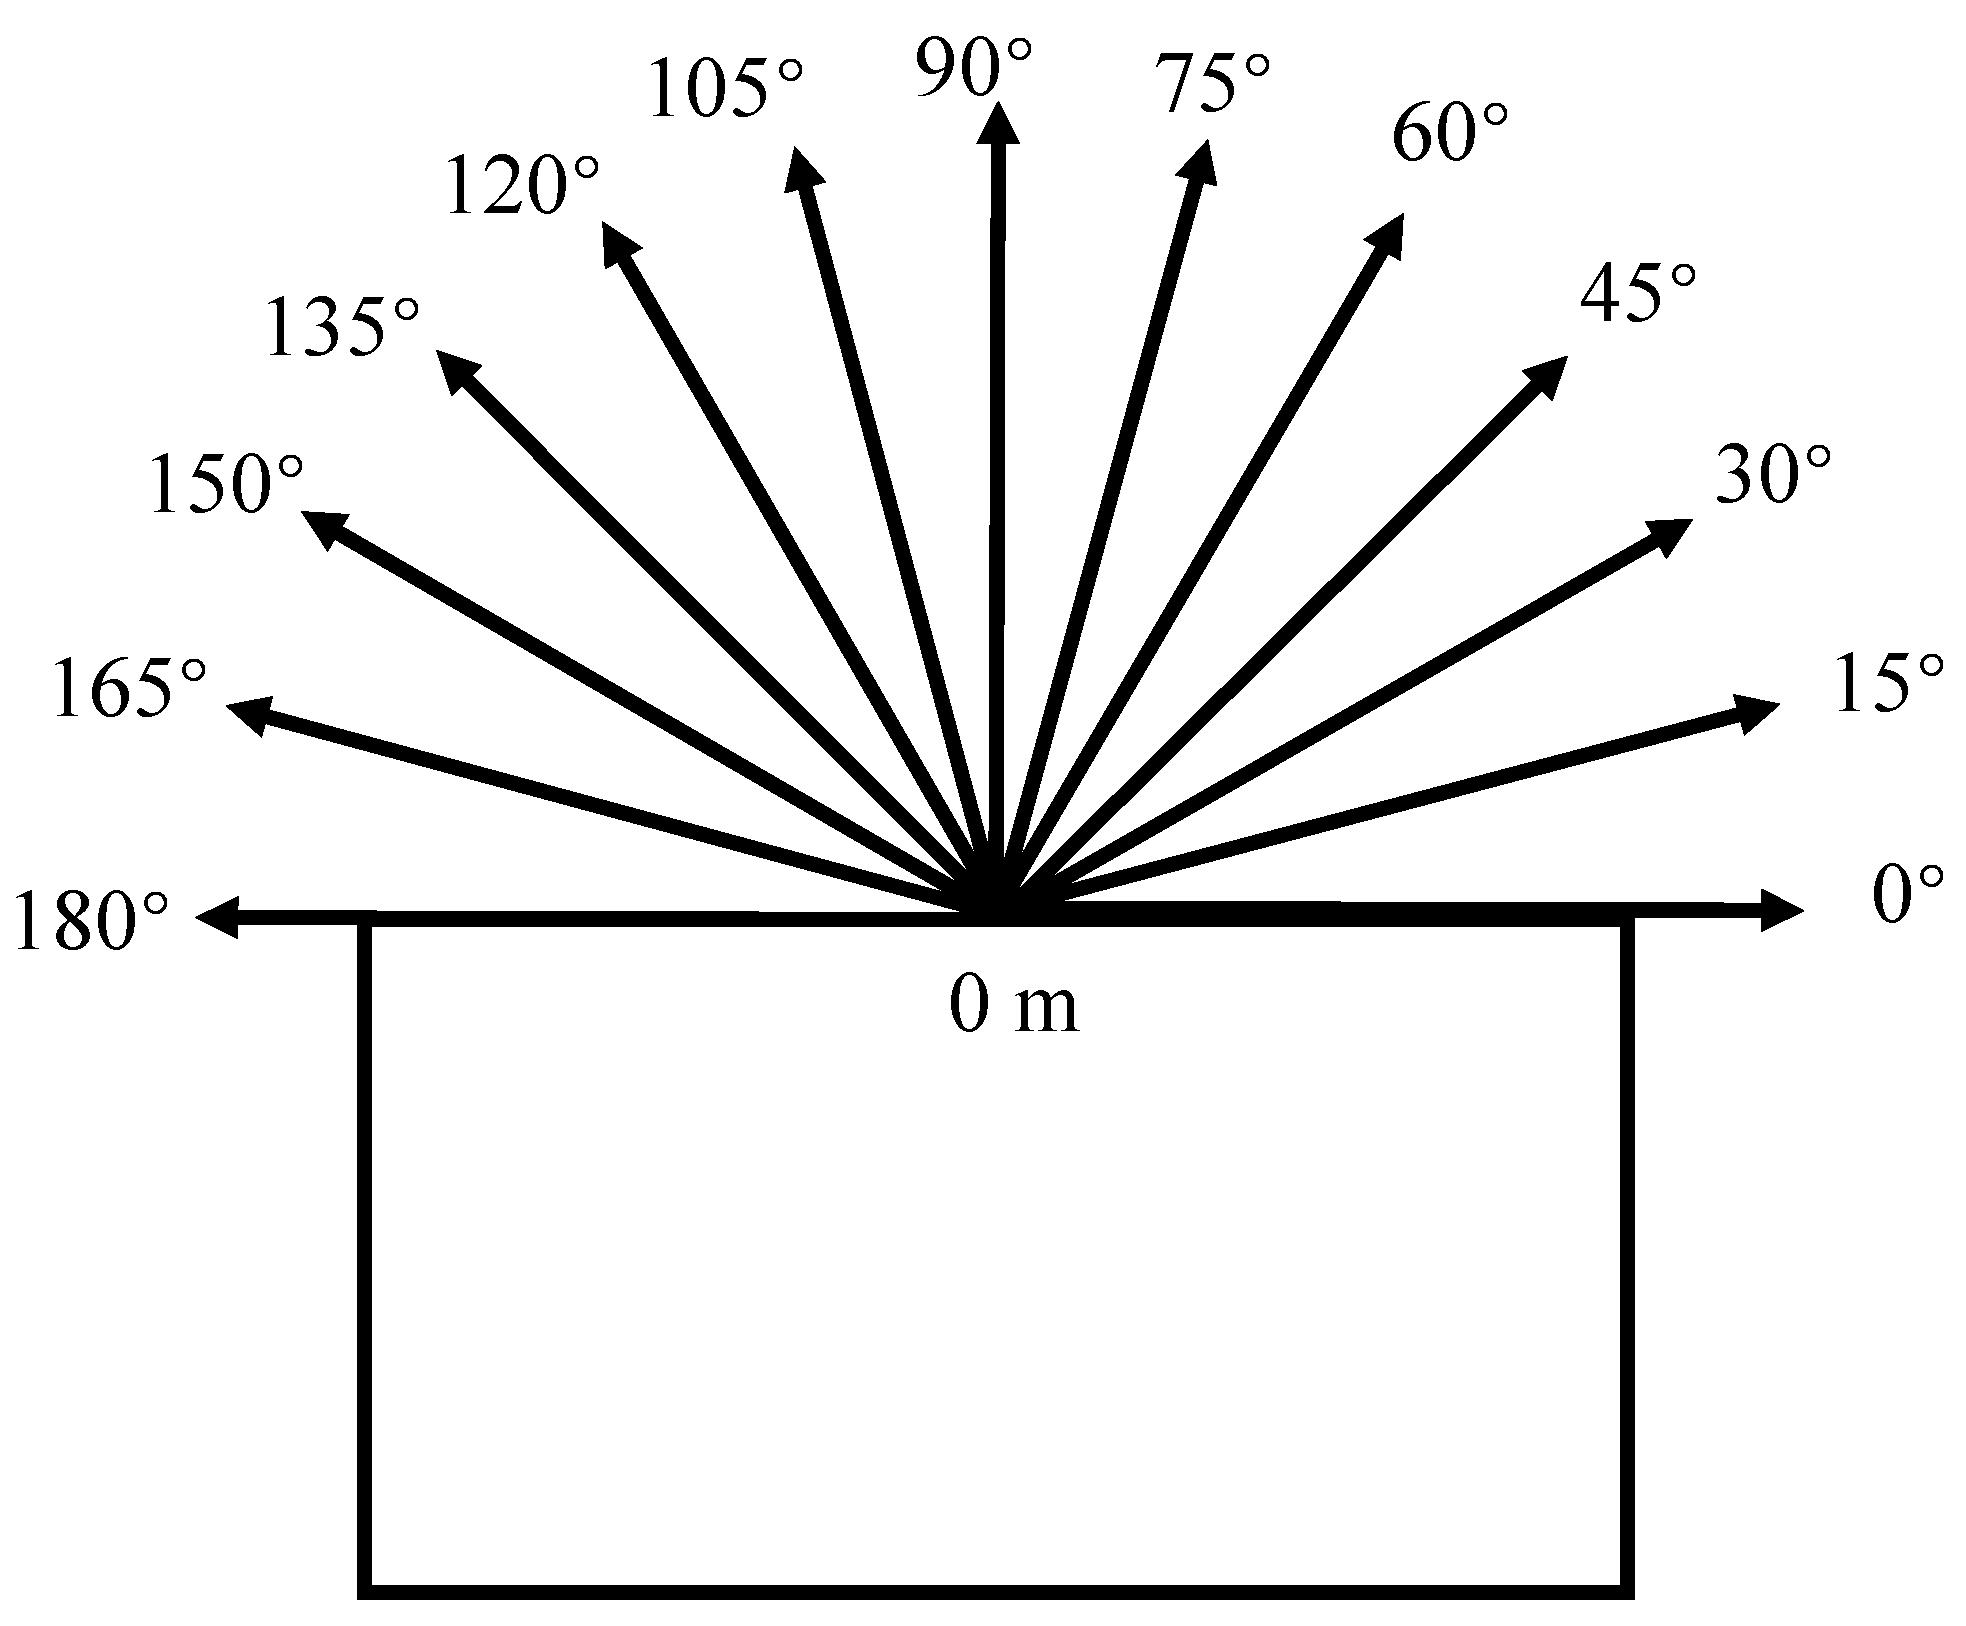
A multi-turn coil, with a side length of 2–3 m, is typically utilized for transmitting and receiving coils due to the space constraints of underground roadways. According to the results of the previous numerical simulation, the fan-shaped detection method is used to acquire all of the information regarding the front geological body, as illustrated in Figure 15. First, the measuring points are placed at the coal digging head, and the normal directions of the transmitting and receiving antennas are perpendicular to the right side of the roadway for measurement (such as vertical measurement, should be from bottom to top), next, the antenna will then be rotated at an angle (often 15°). When the antenna’s normal direction is perpendicular to the digging head, 1–3 measuring sites are placed in accordance with the width of the digging head.
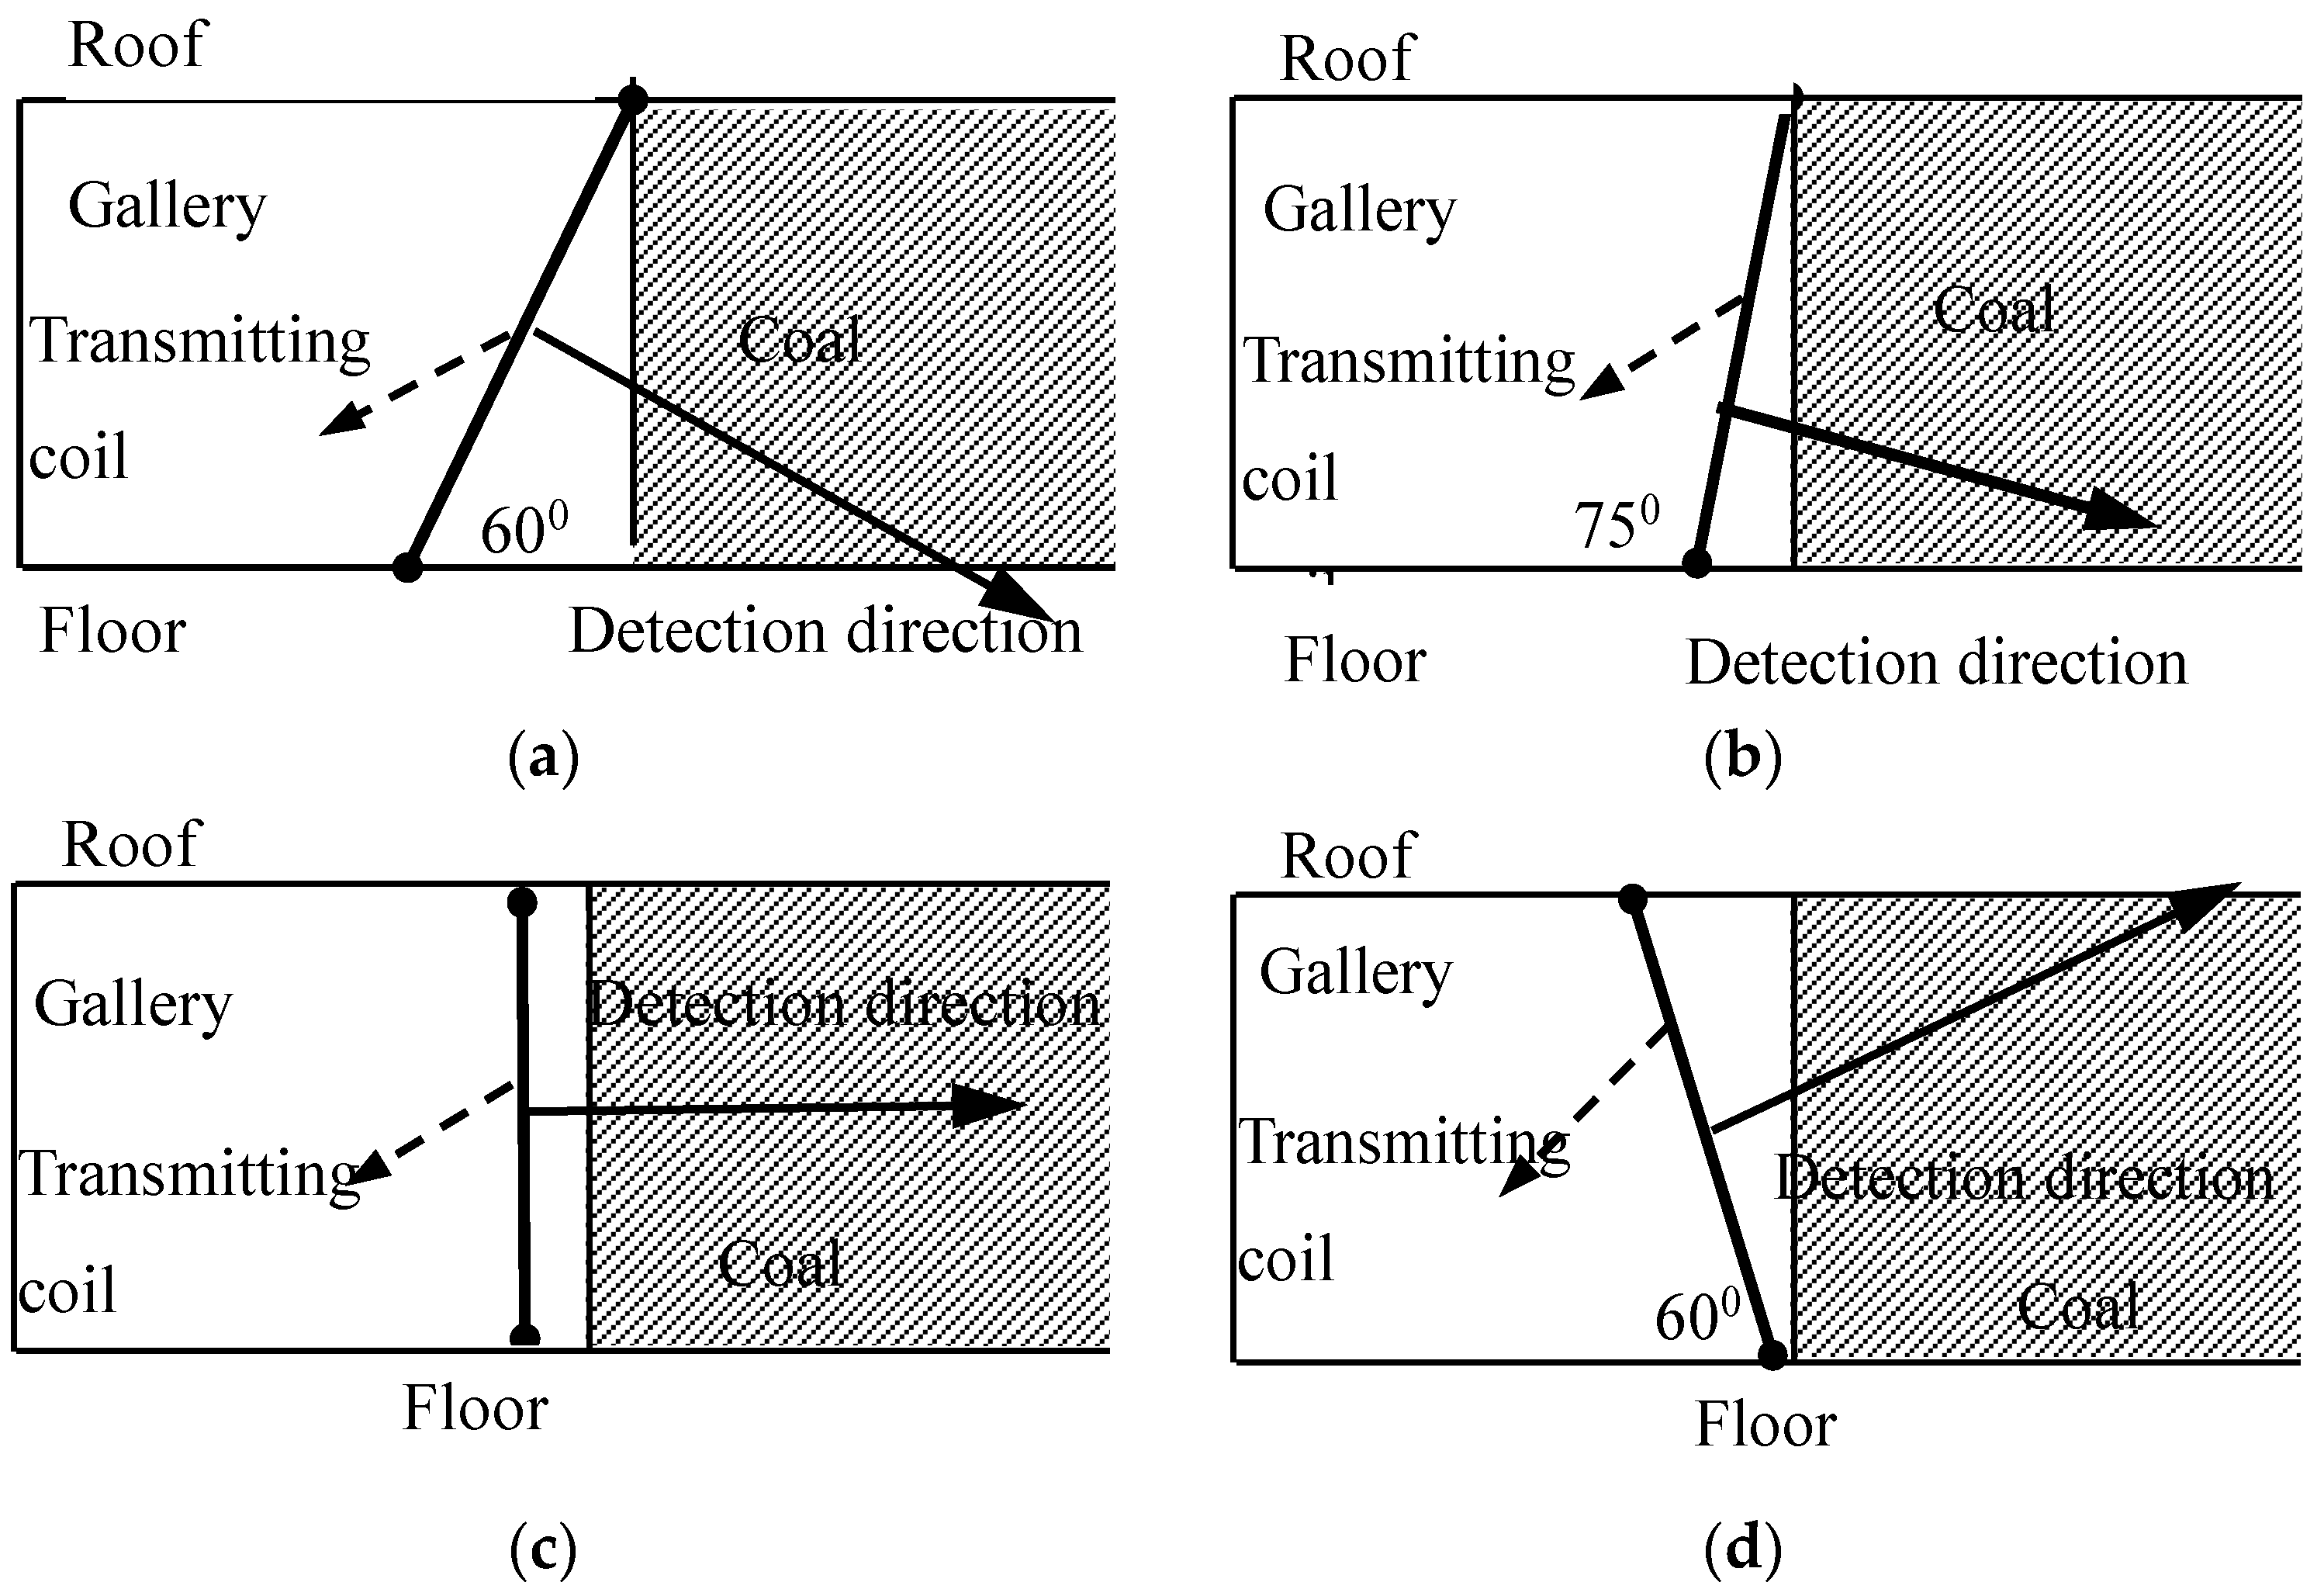
In the advanced detection of mine TEM, the normal direction of the starting ray frame is computed in accordance with the relative position relationship between coal mining and the aquifer of the roof and floor, as illustrated in Figure 16. This ensures that the rock strata to be examined are within the detection range of the instrument.

5.2. Detection Results

Three levels of δ ¯ δ n / 3 , δ ¯ δ n / 3 ~ δ ¯ + δ n / 3 , and δ ¯ + δ n / 3 —can be assigned to the apparent resistivity outlier δ , based on the electrical characteristics of this region (where δ ¯ is the arithmetic mean value of parameters and δ n is the standard deviation value of parameters); δ ¯ δ n / 3 and δ ¯ δ n are set to abnormal thresholds. Before the resulting map of advanced exploration and interpretation of the digging head is produced, the influence of the road’s roof, floor, and geological body behind it should be removed in order to conduct out roadway space correction on the data that has been acquired.
The formation’s comprehensive conductivity is better, and its water content is higher when the apparent conductivity value is lower. In the illustration, orange or colorlessness denotes a high resistivity anomaly (a weakly water-bearing or water-free area), green denotes a low resistivity anomaly (a water-rich area), and various intermediate colors denote the zone between low resistivity and high resistivity anomalies.
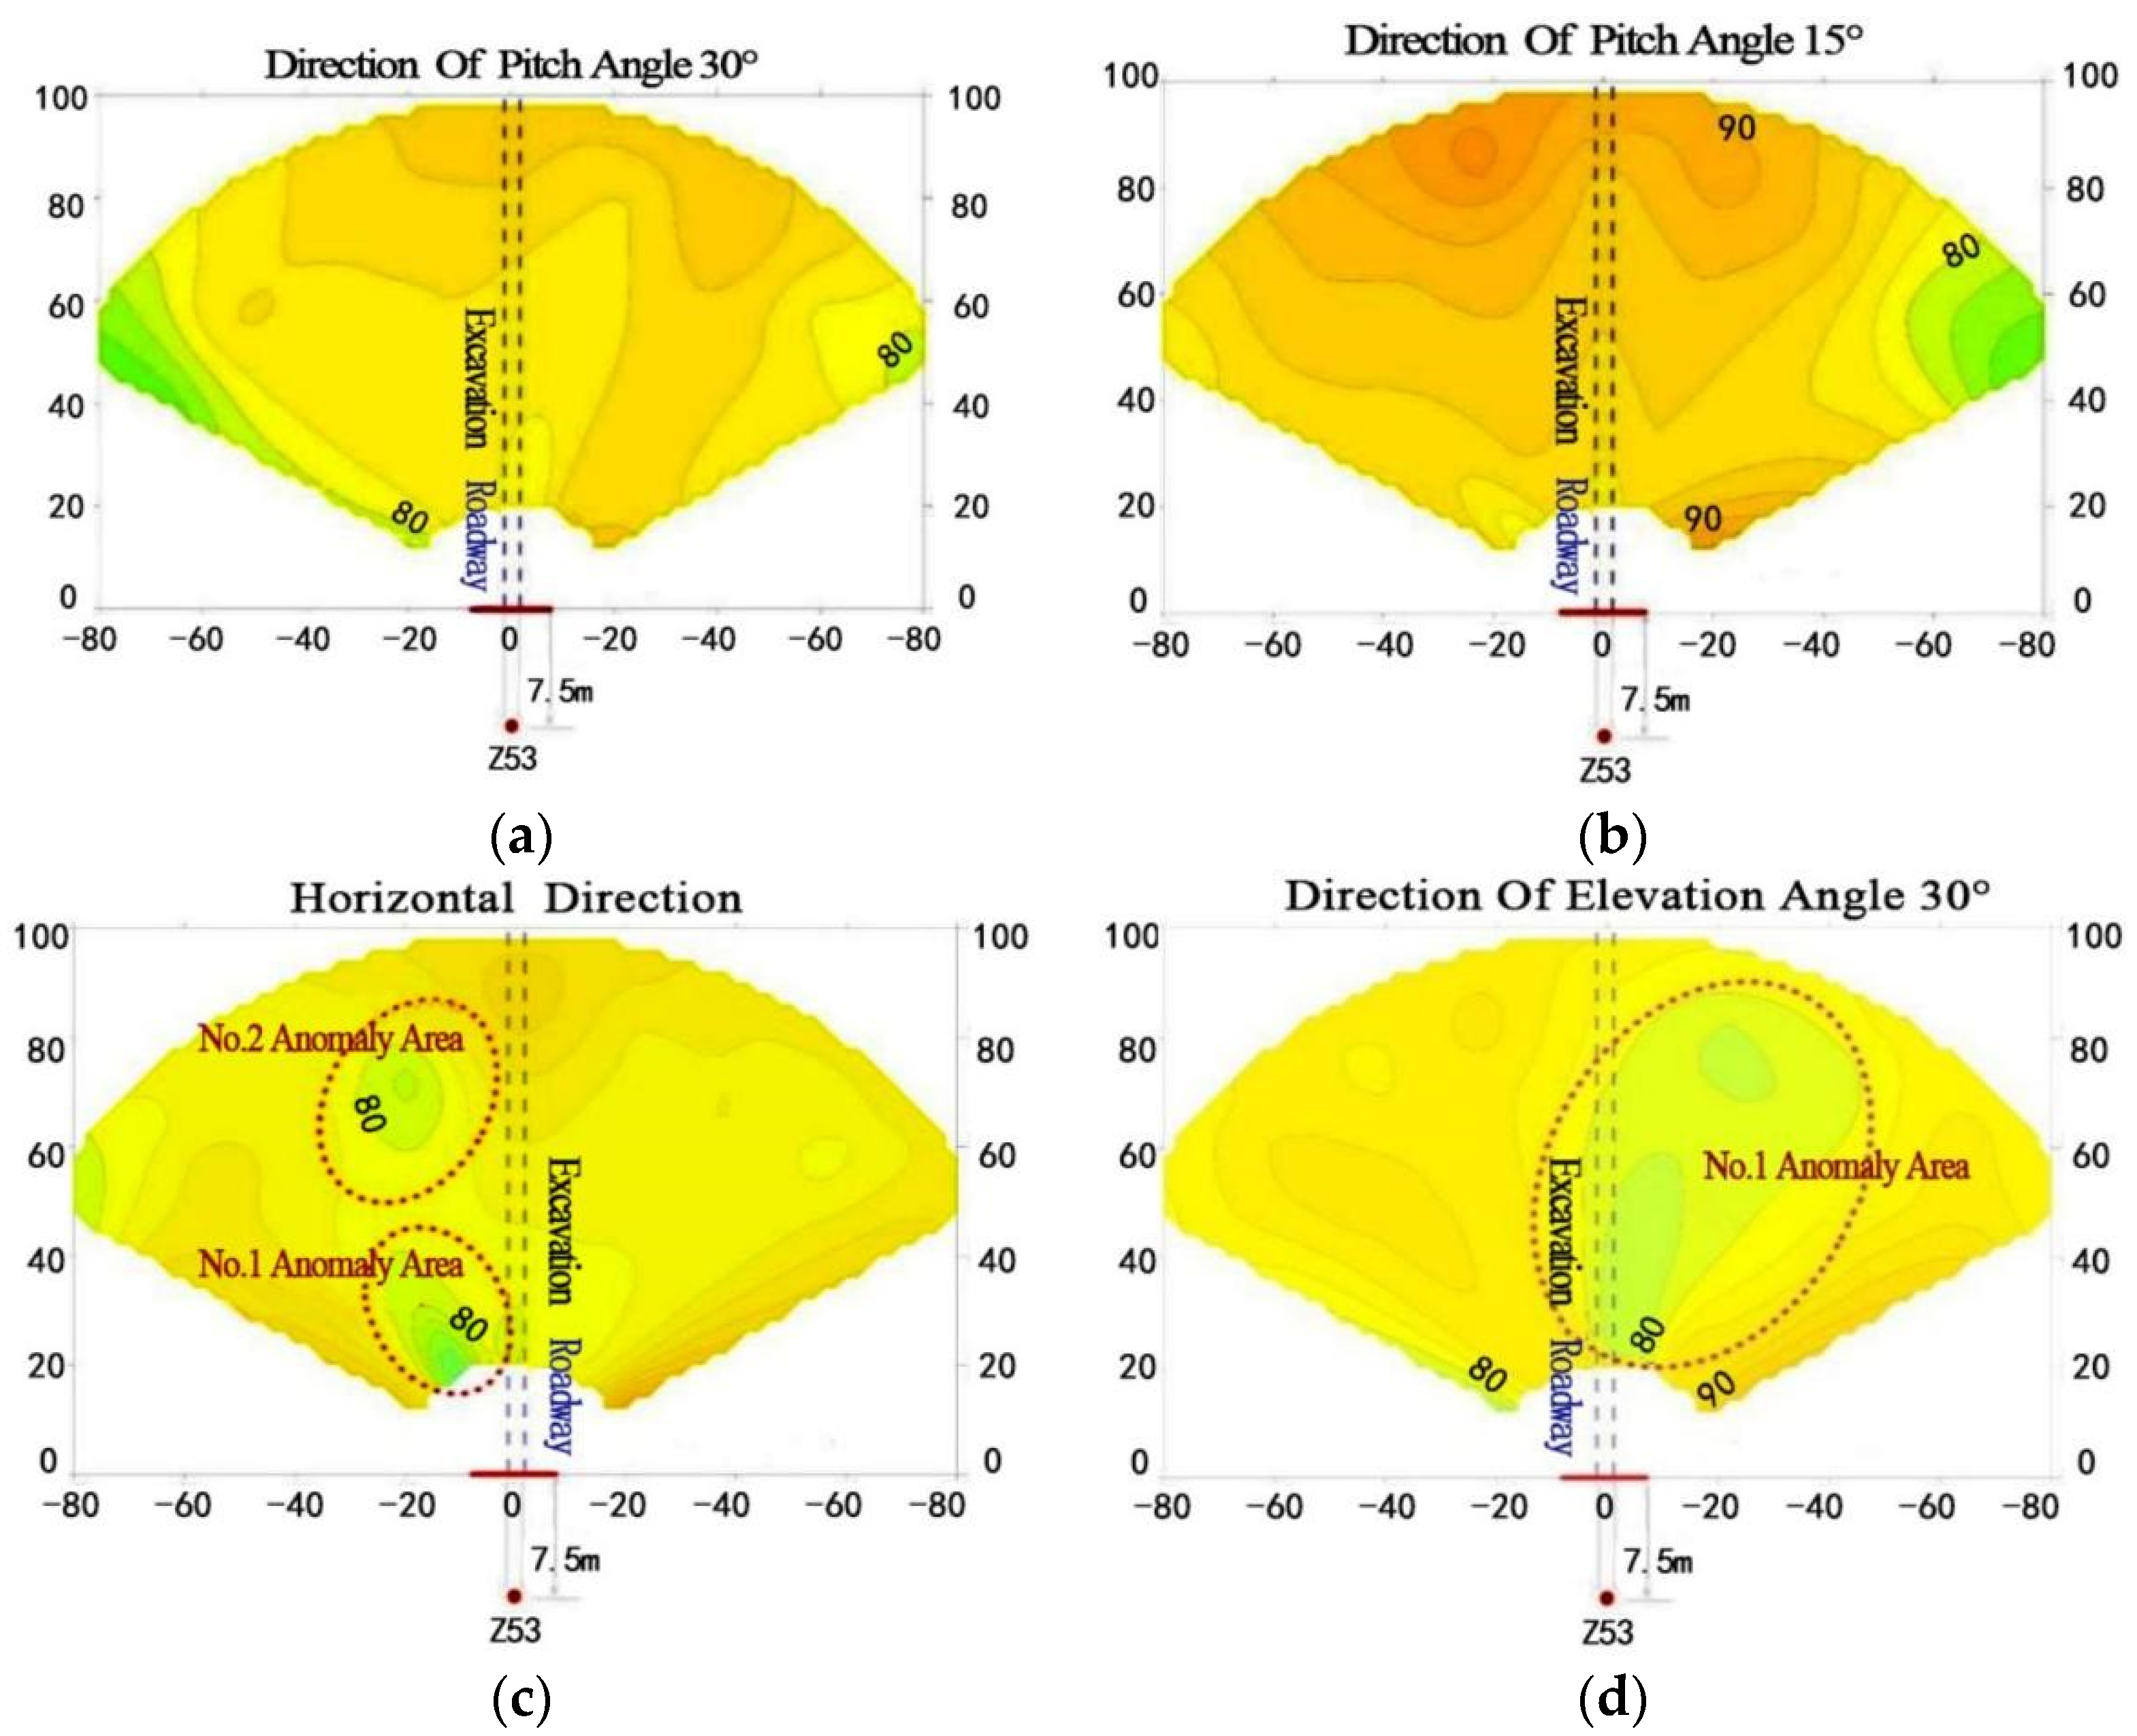
Figure 17 shows the advance detection results. The area with low apparent resistivity anomalies is represented by the blue-green region, the region with high apparent resistivity values is represented by the yellow region, and the remaining colors denote transitional regions. After processing the detection data in light of the outcomes of the numerical simulation, two clearly visible low-resistance anomaly zones are discovered within 100 m of the tunneling face. The No. 1 anomaly, which has a wide anomaly range and a moderate intensity, is primarily found in the right front of the digging head and extends to the left front of the bedding direction. The No. 2 anomaly is largely centered between 60 and 70 m, in front of the tunneling face on the left, with a modest and weak anomalous range. Additionally, there are secondary anomalies in the pitch angle direction in the detection edge area. It is assumed that the low resistance anomaly in front is the comparatively water-rich section in this area, given the occurrence of dripping from the roof and in the excavation face during detection. Combining the response law from the numerical simulation with the low-resistance anomaly geologic body’s volume effect, it is possible that the No. 2 anomaly is created by the same hydrogeological anomaly geologic body that is responsible for the No. 1 anomaly, which stretches from the roof to the coal seam. The results obtained by drilling in the later stage show that the No. 1 anomaly is a low resistivity anomaly caused by the fluctuation of coal seam, and there are water flowing fractures in the No. 2 anomaly area.

6. Discussion

Some notable phenomena and representative laws are discovered through the examination of various response results:
(1)
After the current is cut off in the third section, the electromagnetic field will peak in the bad geological body and slowly spread to the center of the fault, before continuing to degrade. This is consistent with the law of full-space transient electromagnetic response in the tunnel studied by Li et al. [31], which also provides feasibility for the subsequent exploration of the electromagnetic response law of the TEM. The cause of this phenomena is that the eddy current will start to decay as soon as the current is cut off; because the surrounding rock’s conductivity is so much worse than that of the geological anomaly, the eddy current attenuation rate will be much higher than that of the low resistance body.
(2)
The results of the different models, given in Section 4.1, indicate that the lower the apparent resistivity of the abnormal object (the higher the water content), the slower the attenuation of its inductive electromagnetic field. The results of Li and others [31] are also consistent with this claim: the higher the water content, the stronger the electromagnetic response signal and the slower the attenuation of the transient response.
(3)
The comparison of the forward results in Section 3.1 and the different distance models in Section 4.2 shows that the distance between the abnormal geologic body and the excitation source controls the intensity of the transient electromagnetic field. The strength of the transient electromagnetic field decreases with distance; nevertheless, distance has no effect on the attenuation law of the water-containing body’s transient electromagnetic field.
(4)
According to the numerical simulation results in Section 4.3, the magnetic induction intensity is the same in the early stage for each model as the distance between the anomalous body and the transmitting coil is the same. At the later stage, magnetic induction intensity is proportional to volume and is ordered from large to small for the large circular table, large cylinder, circular table, small cylinder, and small circular table.
(5)
It is clear from examining the responses in Section 4.4 that the attenuation law of the coil is significantly influenced by the electromagnetic field’s projection area on the coil at a moment. Therefore, the idea of “electromagnetic field projection area” is put forth: the larger the electromagnetic field projection area, the slower the transient electromagnetic field decays at the corresponding moment; on the other hand, the smaller the electromagnetic field projection area, the faster the transient electromagnetic field decays at the corresponding moment. Additionally, it can be observed from the results in Section 4.3 and Section 4.4 that the attenuation rate of the transient electromagnetic response of the anomalous geologic body with a regular shape has remained consistent throughout the attenuation process, as the electromagnetic field projection area reached its maximum value at the time of the occurrence of the transient electromagnetic field and did not vary in the subsequent electromagnetic field attenuation. The irregular anomalous geologic body’s electromagnetic field projection area and transient electromagnetic response attenuation speed have both changed over time.

7. Conclusions

This study built geological models under numerous full-space situations using the time-domain finite unit approach, investigated the key factors impacting the transient electromagnetic response of anomalous bodies and the associated laws. The electrical characteristics and size have the greatest influence on the transient electromagnetic response for regular anomalous geological bodies. The transient electromagnetic response for irregular anomalous bodies is additionally impacted by the projection area of the electromagnetic field because of their unequal volume distribution. Finally, the fan-shaped arrangement of field detection and the processing and interpretation of data are guided by the conclusions drawn from numerical simulation and other geological data, and it is successfully determined that two low-resistance anomalies are developed from the same low-resistance anomaly geologic body.
The findings of this study demonstrate the suitability of the TDFEM for investigating complicated geological anomalies in three dimensions. Therefore, the geological conditions in the actual field are more complex and changeable, and in future research, specific numerical models should be established based on the TDFEM for research to complete the transient electromagnetic response law under three-dimensional full-space. Moreover, the forward evolution performed in this paper, utilizing the benefits of the finite element method, is fundamental to theoretical research, and it will be important to study the inversion under full-space conditions and its specific field application in the future.

Author Contributions

Data curation, Y.C.; Formal analysis, K.Z.; Investigation, L.M.; Software, S.C.; Writing—original draft, C.G.; Writing—review & editing, T.T. All authors have read and agreed to the published version of the manuscript.

Funding

This work was supported by the Natural Science Foundation of Jiangsu Province (No. BK20221130).

Conflicts of Interest

The authors declare no conflict of interest.

References

  1. Kong, X.G.; He, D.; Liu, X.F.; Wang, E.Y.; Li, S.G.; Liu, T.; Ji, P.F.; Deng, D.Y.; Yang, S.R. Strain characteristics and energy dissipation laws of gas-bearing coal during impact fracture process. Energy 2022, 242, 12308. [Google Scholar] [CrossRef]
  2. Wang, C.; Cheng, Y. Role of coal deformation energy in coal and gas outburst: A review. Fuel 2023, 332, 126019. [Google Scholar] [CrossRef]
  3. Wang, X.; Wang, E.; Liu, X.; Zhou, X. Failure mechanism of fractured rock and associated acoustic behaviors under different loading rates. Eng. Fract. Mech. 2021, 247, 107674. [Google Scholar] [CrossRef]
  4. Hu, W.; Zhao, C. Evolution of water hazard control technology in China’s coal mines. Mine Water Environ. 2021, 40, 334–344. [Google Scholar] [CrossRef]
  5. Zhang, Y.; Li, F. Prediction of Water Inrush from Coal Seam Floors Based on the Effective Barrier Thickness. Mine Water Environ. 2022, 41, 168–175. [Google Scholar] [CrossRef]
  6. Liu, S.; Peng, G.; Yin, G. A study on the in-situ stress conditions at the Kailuan mining area in China and their influence on coal mine water inrush. Arab. J. Geosci. 2021, 14, 2057 . [Google Scholar] [CrossRef]
  7. Kong, X.G.; Wang, E.Y.; Li, S.G.; Lin, H.F.; Xiao, P.; Zhang, K.Z. Fractals and Chaos Characteristics of Acoustic Emission Energy About Gas-Bearing Coal during Loaded Failure. Fractals 2019, 27, 1950069. [Google Scholar] [CrossRef]
  8. Wang, X.; Asem, P.; Hu, C.; Labuz, J.F. Microcracking in tensile fracture of a brittle rock. Eng. Fract. Mech. 2021, 251, 107789. [Google Scholar] [CrossRef]
  9. Tan, Y.L.; Liu, X.S.; Ning, J.G.; Lu, Y.W. In Situ Investigations on Failure Evolution of Overlying Strata Induced by Mining Multiple Coal Seams. Geotech. Test. J. 2017, 40, 244–257. [Google Scholar] [CrossRef]
  10. Wang, F.T.; Tu, S.H.; Zhang, C.; Zhang, Y.W.; Bai, Q.S. Evolution mechanism of water-flowing zones and control technology for longwall mining in shallow coal seams beneath gully topography. Environ. Earth Sci. 2016, 75, 1309. [Google Scholar] [CrossRef]
  11. Xue, G.Q.; Bai, C.Y.; Yan, S.; Greenhalgh, S.; Li, M.F.; Zhou, N.N. Deep sounding TEM investigation method based on a modified fixed central-loop system. J. Appl. Geophys. 2012, 76, 23–32. [Google Scholar] [CrossRef]
  12. JiaWe, Z.; GuangDe, G. A geological interpretation method for non-uniform survey. Int. J. Environ. Sci. Technol. 2021, 19, 9047–9054. [Google Scholar] [CrossRef]
  13. Chang, J.; Yu, J.; Li, J.; Xue, G.; Malekian, R.; Su, B. Diffusion Law of Whole-Space Transient Electromagnetic Field Generated by the Underground Magnetic Source and Its Application. IEEE Access 2019, 7, 63415–63425. [Google Scholar] [CrossRef]
  14. Yan, S.; Xue, G.Q.; Qiu, W.Z.; Li, H.; Zhong, H.S. Feasibility of central loop TEM method for prospecting multilayer water-filled goaf. Appl. Geophys. 2016, 13, 587–597. [Google Scholar] [CrossRef]
  15. Chang, J.H.; Yu, J.C.; Liu, Z.X. Three-dimensional numerical modeling of full-space transient electromagnetic responses of water in goaf. Appl. Geophys. 2016, 13, 539–552. [Google Scholar] [CrossRef]
  16. Sun, H.; Liu, S.; Yang, Y. Crank-Nicolson FDTD 3D forward modeling for the transient electromagnetic field. Chin. J. Geophys. 2021, 64, 343–354. [Google Scholar]
  17. Li, J.H.; Zhu, Z.Q.; Liu, S.C.; Zeng, S.H. 3D numerical simulation for the transient electromagnetic field excited by the central loop based on the vector finite-element method. J. Geophys. Eng. 2011, 8, 560–567. [Google Scholar] [CrossRef]
  18. Liu, Y.; Hu, X.; Peng, R.; Yogeshwar, P. 3D forward modeling and analysis of the loop-source transient electromagnetic method based on the finite-volume method for an arbitrarily anisotropic medium. Chin. J. Geophys. 2019, 62, 1954–1968. [Google Scholar]
  19. Chen, D.; Cheng, J.L.; Wang, A.M. Numerical simulation of drillhole transient electromagnetic response in mine roadway whole space using integral equation method. Chin. J. Geophys. Chin. Ed. 2018, 61, 4182–4193. [Google Scholar]
  20. Zhang, Y.; Wang, G.; Li, H.; Lian, Y.; Li, W.; Qiu, H.; Mou, Y. Efficient 3D vector finite element modeling for TEM based on absorbing boundary condition. Chin. J. Geophys. 2021, 64, 1106–1118. [Google Scholar]
  21. Wang, R.; Wang, M.Y.; Di, Q.Y.; Xue, G.Q. 2D FEM modeling on the multi-channel transient electromagnetic method. Chin. J. Geophys. Chin. Ed. 2018, 61, 5084–5095. [Google Scholar]
  22. Lu, K.L.; Fan, Y.N.; Zhou, J.M.; Li, X.; Li, H.; Fan, K.R. 3D anisotropic TEM modeling with loop source using model reduction method. J. Geophys. Eng. 2022, 19, 403–417. [Google Scholar] [CrossRef]
  23. Li, X.; Hu, W.; Xue, G. 3D modeling of multi-radiation source semi-airborne transient electromagnetic response. Chin. J. Geophys. 2021, 64, 716–723. [Google Scholar]
  24. Wang, L.-Y.; Yin, C.-C.; Liu, Y.-H.; Su, Y.; Ren, X.-Y.; Hui, Z.-J.; Zhang, B.; Xiong, B. Three-dimensional forward modeling for the SBTEM method using an unstructured finite-element method. Appl. Geophys. 2021, 18, 101–116. [Google Scholar]
  25. Kuo, J.T.; Cho, D.-H. Transient time-domain electromagnetics. Geophysics 1980, 45, 271–291. [Google Scholar] [CrossRef]
  26. Velímský, J.; Martinec, Z. Time-domain, spherical harmonic-finite element approach to transient three-dimensional geomagnetic induction in a spherical heterogeneous Earth. Geophys. J. Int. 2005, 161, 81–101. [Google Scholar] [CrossRef] [Green Version]
  27. Mur, G. The finite-element modeling of three-dimensional time-domain electromagnetic fields in strongly inhomogeneous media. IEEE Trans. Magn. 1992, 28, 1130–1133. [Google Scholar] [CrossRef]
  28. Li, J.-H.; Zhu, Z.-Q.; Zeng, S.-H.; Liu, S.-C. Progress of forward computation in transient electromagnetic method. Prog. Geophys. 2012, 4, 1393–1400. [Google Scholar]
  29. Haber, E. Computational Methods in Geophysical Electromagnetics; SIAM: Philadelphia, PA, USA, 2014. [Google Scholar]
  30. Amestoy, P.R.; Guermouche, A.; L’Excellent, J.-Y.; Pralet, S. Hybrid scheduling for the parallel solution of linear systems. Parallel Comput. 2006, 32, 136–156. [Google Scholar] [CrossRef] [Green Version]
  31. Li, H.; Yu, G.; Zhang, D. Electromagnetic Response Analysis of Tunnel Full Space 3D Forward Numerical Simulation. Geotech. Geol. Eng. 2022, 40, 273–284. [Google Scholar] [CrossRef]
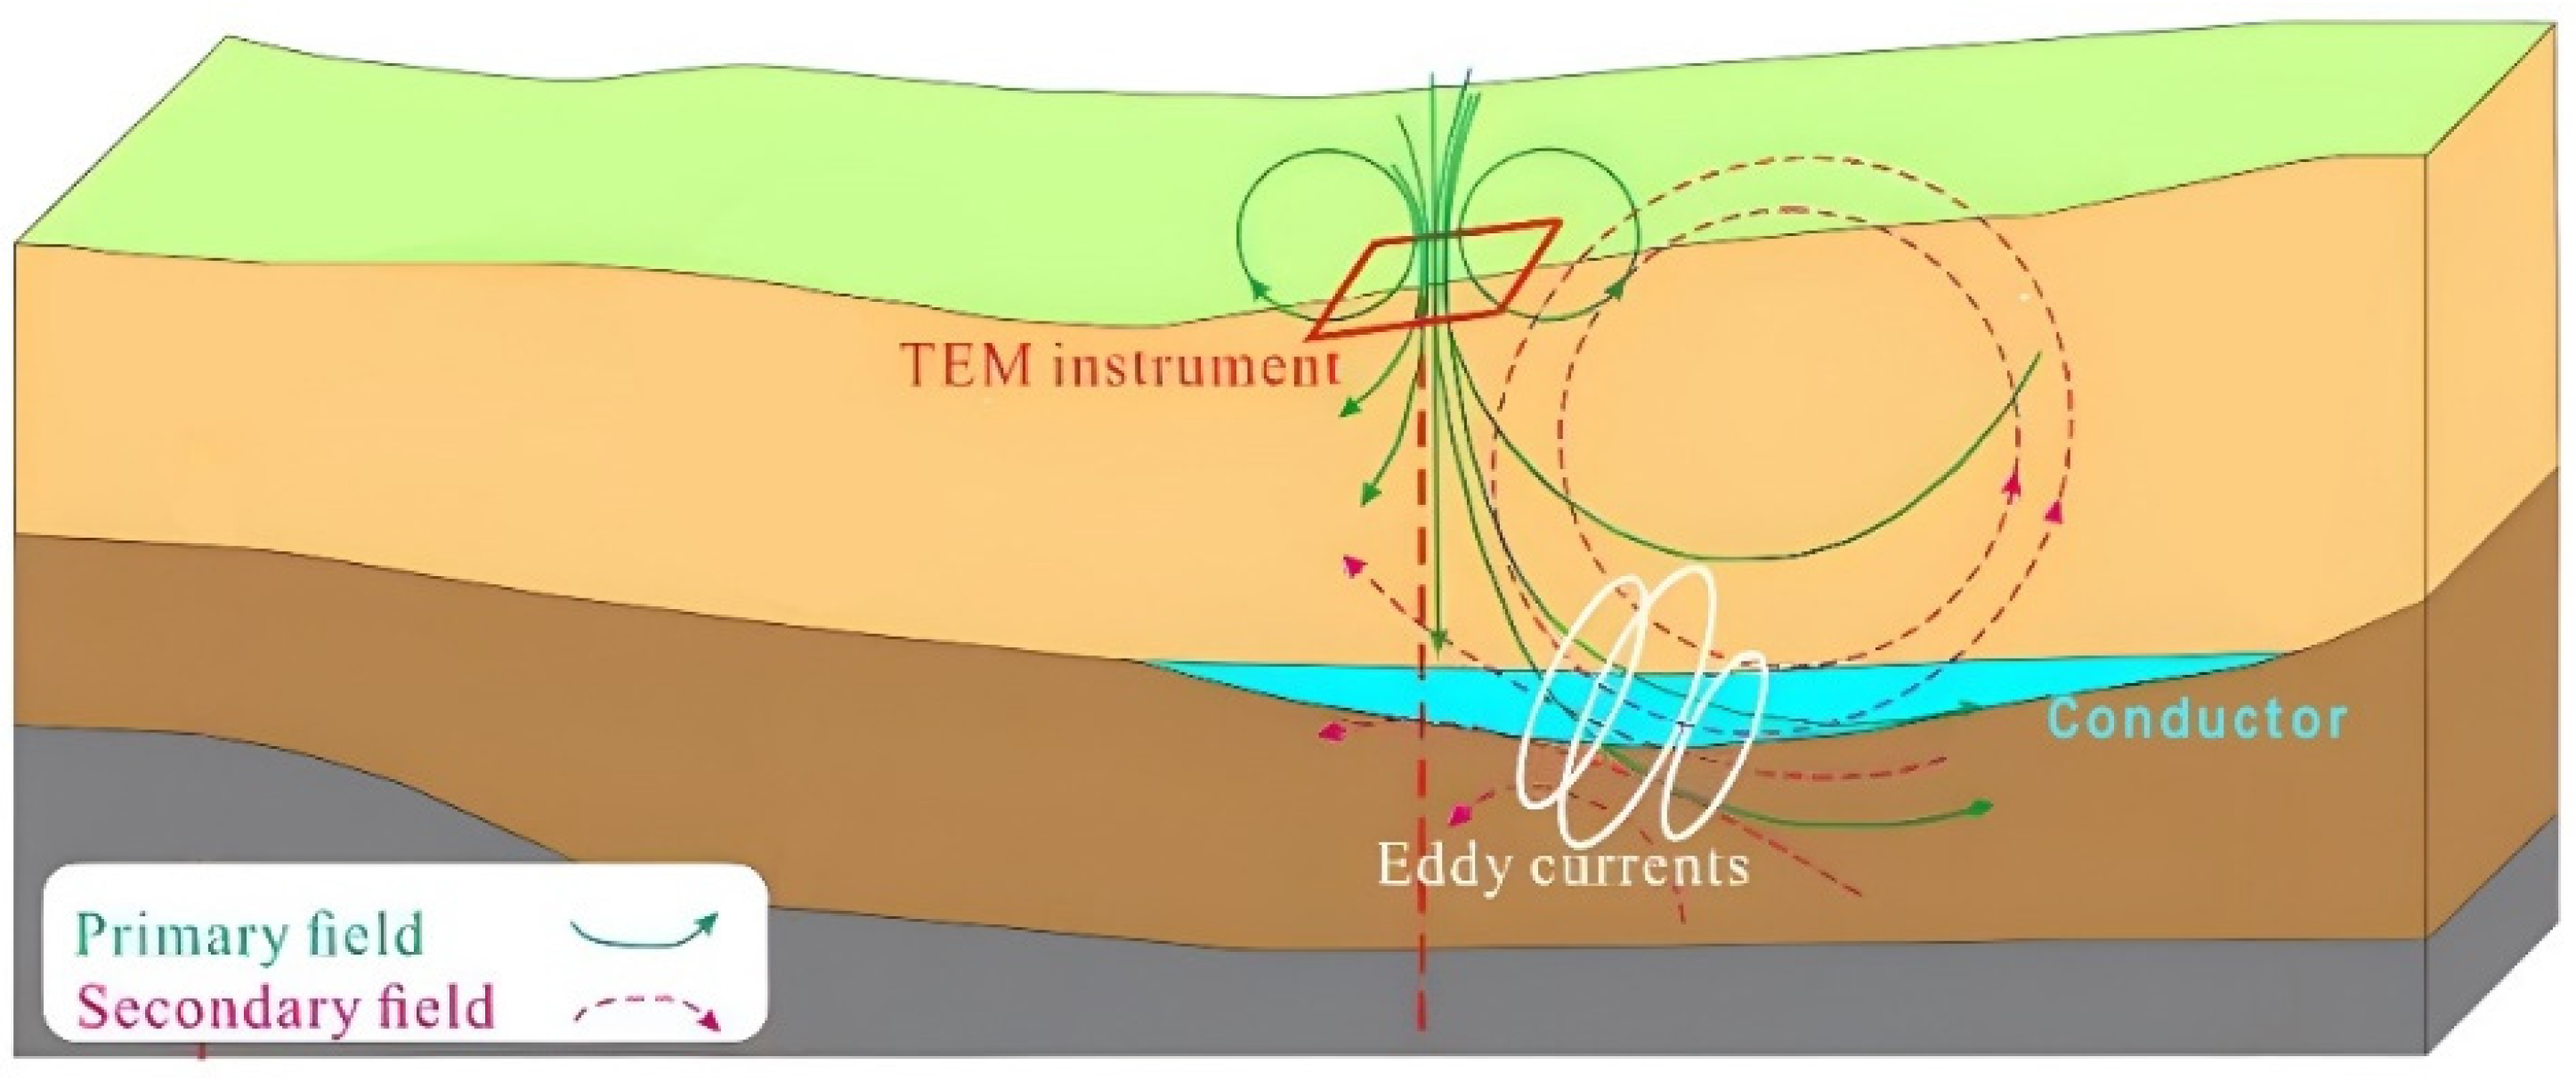
Figure 1. Working principle of TEM.
Sustainability 14 15024 g001
Figure 2. Comparison of numerical and analytical solutions. (a) Comparison of solutions. (b) Relative error.
Sustainability 14 15024 g002
Figure 3. Overall structure of the model and meshing results.
Sustainability 14 15024 g003
Figure 4. Electromotive attenuation law obtained using three full-space models.
Sustainability 14 15024 g004
Figure 5. Water-bearing fault model placed in front of the digging head.
Sustainability 14 15024 g005
Figure 6. Transient electromagnetic field distributions on the horizontal plane of the fault model after switching off the current. (a) t = 1 μs. (b) t = 10 μs. (c) t = 50 μs. (d) t = 200 μs. (e) t = 500 μs. (f) t = 1 ms.
Sustainability 14 15024 g006aSustainability 14 15024 g006b
Figure 7. The induced electromotive force of different electrical anomalies.
Sustainability 14 15024 g007
Figure 8. The induced electromotive of abnormal bodies placed at different distances.
Sustainability 14 15024 g008
Figure 9. Induced electromotive force attenuation curves for anomalies of different sizes.
Sustainability 14 15024 g009
Figure 10. Different dip fault models. (a) Deg. = 60°. (b) Deg. = −60°. (c) Deg. = 30°. (d) Deg. =−30°.
Sustainability 14 15024 g010
Figure 11. Induced electromotive force attenuation curves of different dip angle collapse columns. (a) Overall attenuation law. (b) Law of early attenuation (0–100 μs). (c) Law of late attenuation (900 μs–1 ms).
Sustainability 14 15024 g011
Figure 12. Models with cones of different angles. (a) Deg. = 90°. (b) Deg. = −90°.
Sustainability 14 15024 g012
Figure 13. Induced electromotive attenuation curves for different projection area models. (a) Overall attenuation law. (b) Law of early attenuation (0–100 μs). (c) Law of late attenuation (900 μs–1 ms).
Sustainability 14 15024 g013
Figure 14. Schematic diagram of the advance detection area.
Sustainability 14 15024 g014
Figure 15. Schematic diagram of the arrangement of advanced detection points.
Sustainability 14 15024 g015
Figure 16. Schematic diagram of advanced detection direction. (a) The angle between the detection direction and the floor is 60°; (b) The angle between the detection direction and the floor is 75°; (c) The angle between the detection direction and the floor is 90°; (d) The angle between the detection direction and the floor is 120°.
Sustainability 14 15024 g016
Figure 17. Advance detection results map. (a) The angle between the detection direction and the floor is 60°; (b) The angle between the detection direction and the floor is 75°; (c) The angle between the detection direction and the floor is 90°; (d) The angle between the detection direction and the floor is 120°.
Sustainability 14 15024 g017
Table 1. Geoelectric parameters of the model.
Toward the Length (x)/mTending Length (y)/mThickness (z)/mApparent Resistivity (Ω·m)
Clad rock20015080100
Coal seam200150450
Floor20015060100
Table 2. Geoelectric parameters of the abnormal geologic body.
Radius (Edge Length)/mHeight/mVolume/m3
Sphere30/113,097.3
Cube48/110,592
Cylinder2652110,433.3
Table 3. Size parameters of the abnormal bodies.
Exception Body NumberUpper Surface Radius (m)Lower Surface Radius (m)Height (m)Volume (m3)Shape
a510305498Small round table
b1010309424.8Small cylinder
c10205036,651Medium round table
d15155035,343Medium cylinder
e1530100164,933Large round table
f2020100125,663Large cylinder
Table 4. Geometric parameters of the four models.
Edge Length/Radius (m)Height (m)Magnetic Field Projection Area (m2)Volume (m3)
Sphere30/Minimum value113,097.3
Cylinder26522704110,433.3
Cube48/2304110,592
Cone4552Minimum value110,269.9
Publisher’s Note: MDPI stays neutral with regard to jurisdictional claims in published maps and institutional affiliations.