Article

The Impact of Environmental Tax Reform on Total Factor Productivity of Heavy-Polluting Firms Based on a Dual Perspective of Technological Innovation and Capital Allocation

1
School of Economics, Shandong University of Finance and Economics, Jinan 250014, China
2
School of Public Administration and Policy, Shandong University of Finance and Economics, Jinan 250014, China
*
Author to whom correspondence should be addressed.
Sustainability 2022, 14(22), 14946; https://doi.org/10.3390/su142214946
Submission received: 18 October 2022 / Revised: 10 November 2022 / Accepted: 10 November 2022 / Published: 11 November 2022

Abstract

:
As an essential reform of China’s environmental regulatory policy, the environmental protection tax reform achieves a smooth transition from the emission fee system to the environmental protection tax system according to the principle of tax burden leveling. With the quasi-natural experiment of the introduction of the Environmental Protection Tax Law, this paper examines the effect of environmental protection tax reform on total factor productivity of heavily polluting firms using a difference-in-difference approach based on empirical evidence of Chinese listed companies from 2015 to 2020. It is found that environmental tax reform can significantly increase the level of total factor productivity of heavily polluting firms, and the results remain robust to robustness tests using the OP method, the GMM method to re-measure the total factor productivity of heavily polluting enterprises and the use of different industry classification criteria, with the mechanism of action mainly coming from the technological innovation effect and capital allocation optimization. In addition, the effect of environmental tax reform on total factor productivity of heavily polluting firms is heterogeneous across regions and industries, with the total factor productivity of firms in heavily polluting industries in the eastern region being least affected by environmental tax policies and state-owned enterprises with heavy property rights structures being most affected by environmental tax reform.

1. Introduction

China’s extensive economic growth mode with high energy consumption and high pollution has led to increasingly serious environmental pollution problems, and environmental protection has lagged behind economic and social development. The trend of ecological deterioration has not been fundamentally reversed, and environmental pollution is a serious problem in some areas. To this end, the reports of the 18th CPC National Congress and the 19th National Congress of CPC promote ecological civilization construction and firmly implement the strategy of sustainable development. In addition, in the Fourteenth Five-Year Plan, “We plan to deepen the battle against pollution and promote the comprehensive green transformation of economic and social development”. However, different from Western developed countries, China does not have a real environmental protection tax system. We tend to replace the environmental protection tax system with a sewage charge system. In 1982, the State Council published and implemented the Interim Measures for Collecting and Discharging Fees. This law had a far-reaching impact on environmental pollution control, but the shortcomings of the modern environmental control system are also increasingly exposed [1]. On 25 December 2016, the 25th Standing Committee of the National People’s Congress of the 12th National People’s Congress published the Environmental Protection Tax Law of the People’s Republic of China (hereinafter referred to as the Environmental Protection Tax) to protect and improve the environment, reduce the emission of pollutants and promote the construction of ecological civilization, thus realizing a smooth transition of environmental tax reform. This tax law embodies the basic principle of “who votes, who pays, who treats” for the sake of internalizing the social cost of environmental pollution, which is bound to have an important impact on the production and operation activities, investment decisions, environmental information disclosure and other aspects of enterprises. In addition, total factor productivity (TFP) has become an important index to measure and evaluate the quality of economic development. Enterprises are the micro subjects of a market economy, and the improvement of enterprise TFP at the micro level has an important impact on the improvement of overall TFP [2]. Nonetheless, as the main object of an environmental protection tax, can the implementation of a policy of environmental tax reform promote the total factor productivity of heavy-polluting enterprises? It is an urgent issue to discuss at present.
Hence, taking the enactment of the Environmental Protection Tax Law as an exogenous event shock and using the panel data of Shanghai and Shenzhen A-share listed industrial enterprises from 2015 to 2020, the difference-in-difference (DID) method is used to test the impact of environmental tax reform on the total factor productivity of heavily polluting enterprises.

2. Literature Review and System Background

2.1. Literature Review

TFP, as an indicator to measure production efficiency, is rooted in the output contribution brought by technological progress, efficiency improvement and non-constant returns of scale [3]. The existing literature about TFP falls into two categories: the measurement of TFP and the influencing factors of TFP.
Regarding the calculation of TFP, the semi-parametric method, the OP method and the LP method, as proposed by Olley et al. [4] and Levinsohn et al. [5], are widely used to measure the TFP. Wang et al. [6] and Xu et al. [7] have both adopted the OP method and the LP method to measure TFP of Chinese industrial and manufacturing enterprises, respectively. In addition, some scholars have estimated TFP with the GMM method proposed by Blundell et al. [8]. The proposed method effectively addresses the endogeneity problem in the regression by adding instrumental variables. Ren et al. [9] adopted this method to comprehensively calculate TFP of Chinese listed enterprises. It is worth noting that the Malmquist productivity index is also widely used in measuring TFP. Its core idea is mainly to measure the change of TFP by constructing the Malmquist–Luenberger index [10]. The Malmquist productivity index was first proposed by Caves et al. [11] and was extended by Färe et al. [12], considering the technical inefficiency of productivity measurements in a non-parametric framework. However, this non-parametric method has the drawback of not considering the sample random factors.
On the influencing factors of TFP, the existing literature mainly focuses on technological innovation, economic growth, environmental regulation and other aspects. In terms of technological innovation, the green technology innovation can not only have an impact on energy TFP [13] through industrial structure upgrading, but also promote the improvement of enterprise TFP [14] by improving unit labor productivity. The improvement effect of green technology innovation on improving TFP has significant regional heterogeneity, especially in eastern China [15]. In terms of economic growth, studies have found that an economic recession will lead to significant reductions in TFP [16]. Some studies have also shown that the digital economy is an effective way to cope with the reduction of TFP. Despite the significant regional differences, it is confirmed that the digital economy can promote enterprise factor productivity [17]. In addition, the increased level of opening up [18] and the development of green finance [19] are also favorable factors for the improvement of enterprise factor productivity. In the field of environmental regulation, the study of TFP has always been a hot topic of academic discussion. In particular, the influence of environmental regulation on TFP can be divided into two categories: the first view holds that the environmental regulation can promote TFP. For example, the implementation of the air pollution prevention and control plan can promote the green TFP of China’s chemical industry [20]; the capacity reduction policy can promote TFP growth of coal enterprises [21]; the emission trading system [22] and the low-carbon city pilot policy [23] have both effectively and directly promote China’s TFP. The second view holds that environmental regulation has an inhibitory effect on TFP. In particular, the command-controlled environmental regulation will significantly hinder the growth of TFP of enterprises [24]. In China, the inverted “U” relationship is presented between the sewage fee system [7], environmental legal system [25] and enterprise TFP.
The introduction of an environmental tax is an important institutional reform of environmental regulation policy in China. It is unclear how Chinese corporate TFP has changed since the policy implementation. This also provides an opportunity to study and test the policy effect of China’s environmental protection tax. At present, the research on the policy effect of environmental protection tax reform mostly focuses on enterprise performance, environmental protection investment, air pollution and other aspects. In this regard, the Environmental Protection Tax Law issued in 2016 was taken as an exogenous policy impact event, and A-share listed companies in Shanghai and Shenzhen from 2015 to 2020 were used as research samples to study the impact of environmental protection tax on enterprise TFP and explore the environmental and economic effects of the environmental protection tax, thus promoting the coordinated development of economic growth and ecological protection. Compared with the existing literature, the marginal contribution of this paper is: first, it expands the research perspective of China’s environmental protection tax. Based on the two perspectives of technological innovation and capital allocation, the economic effect of environmental protection tax reform is tested. It is found that the environmental protection tax reform has a significant positive effect on the total factor productivity of heavily polluting enterprises. The internal mechanism was deeply analyzed. Secondly, the heterogeneity of the economic effect of the environmental protection tax in China was investigated to discuss the different influences of environmental protection tax reform on the total factor productivity of heavy-polluting enterprises from the regional level and property right level.

2.2. System Background

The environmental protection tax system in China has undergone 38 years of evolution (refer to Table 1 for evolution process). Before 2016, there was no real environmental protection tax system in China. Instead, the pollutant discharge fee system replaced the environmental protection tax system and played a regulatory role in environmental governance. The sewage fee system can be traced back to the Environmental Protection Law (Trial) published in September 1979. In February 1982 and July 1988, the State Council published the Interim Measures for Collecting Pollutant Discharge Fees and the Interim Measures for Paid Use of the Special Fund for Pollution Source Control, respectively, thus formally establishing the system of pollutant discharge fees. Since then, the State Council has raised the collection standard of pollutant discharge fees in 1998, 2003, 2007 and 2014, respectively, to further regulate the production behavior of enterprises and improve China’s ecological environment. The extensive economic growth with high energy consumption and high pollution, significantly impacted sustainable development of ecology and the economy. Hence, the contradiction between the ecological environment and economic development has been increasingly prominent [26]. In this regard, according to the report of the 18th CPC National Congress, China is going to give high priority to ecological progress and accelerate the formation of a spatial pattern, industrial structure, mode of production and way of life that conserve resources and protect the environment. In November 2013, the Third Plenary Session of the 18th CPC Central Committee decided to reform the environmental protection tax system. In November 2014, the Ministry of Finance, the Ministry of Environmental Protection and the State Taxation Administration submitted the Environmental Protection Tax Law of the People’s Republic of China (draft) to the State Council. The Office of Legislative Affairs of the State Council announced the draft of the Environmental Protection Tax Law of the People’s Republic of China for public comment. In August 2016, the 20th session of the 12th NPC Standing Committee of the National People’s Congress carried out the first deliberation on the Environmental Protection Tax Law of People’s Republic of China (Draft) In the same year in December, the 25th meeting of the 12th Standing Committee of the National People’s Congress approved the Environmental Protection Tax Law of People’s Republic of China. In addition, the report to the 19th National Congress of CPC stressed the need to “raise pollution emission standards and improve the system of severe punishment”. In January 2018, the Environmental Protection Tax Law of the People’s Republic of China and Enforcement Regulations of Environmental Protection Tax Law of the People’s Republic of China took effect synchronously, which marked the environmental protection tax system replacing the sewage fee system.
The Environmental Protection Tax Law, an important system designed for regulating and improving the ecological environment in a variety of ways, including administrative and economic integration in China, is the first special embodiment of a “green tax system” that vigorously promotes the construction of ecological civilization. The government changed from passive management to active management by levying environmental protection taxes on enterprises and forcing enterprises to discharge and reduce emissions, thereby curbing the spread of environmental pollution.

3. Research Design

3.1. Model Specification

The environmental protection tax, as an exogenous policy, provides a suitable quasi-natural experiment. Hence, a DID method is adopted in the present study to analyze the impact of the tax on enterprise total factor productivity. The research framework of the present paper is shown in Figure 1.
The difference-in-difference method is a critical way of assessing the effects of policies. If the implementation of a policy affects only one part of the economy but not others, it can be viewed as a sort of scientific experiment to assess whether the policy impacts different parts of the economy. The difference in the final evaluation results is the implementation effect of the policy. In this regard, this section uses the difference–indifference method to test the impact of the environmental tax on the total factor productivity of enterprises.
Since the Environmental Protection Tax Law of the People’s Republic of China was unveiled, the change of enterprise total factor productivity mainly stems from three aspects: (1) time effect, the total factor productivity of enterprises may also change with time without the introduction of the policy; (2) grouping effect, heterogeneity exists in different industries, which will have different effects on the total factor productivity of enterprises; and (3) policy treatment effect, the introduction of the environmental tax policy has caused an enterprise total factor productivity change. The difference–indifference method can be used to effectively identify the policy treatment effect (policy net effect). It also effectively controls the endogenous correlation between environmental tax policy and the change of enterprise total factor productivity. Based on the theoretical model and the existing research, the benchmark regression model constructed in this present study is:
T F P i t = β 0 + β 1 × d i d i t + γ Z i t + ω t + u i + ε i t
where d i d j t indicates the intersection term of the grouping dummy variable and the time dummy variable, which indicates whether heavily polluting industries will be hit by environmental tax policies in year t. The grouping dummy variable uses whether the industry is a heavily polluting industry (set up with a value of one) and whether the time dummy variable is used after the introduction of the policy (namely, the value was in 2017–2020 and zero in 2015–2016). The subscripts i and t denote industry and year, respectively, and denote unobserved factors associated with year; u i represents unobserved individual factors that do not change over time; Z i t represents the introduced control variable; and T F P i t represents that total factor productivity is the explained variable.

3.2. Data Source

The Environmental Protection Tax Law of the People’s Republic of China was adopted at the 25th session of the Standing Committee of the 12th Standing Committee of the National People’s Congress on 25 December 2016. From the historical evolution process, the environmental tax system is the smooth transition from the pollutant discharge fee system. Compared with the pollution fee, the system rigidity of the environmental tax is significantly increased, which requires more responsibility for pollution control and emission reduction of enterprises. The purpose of the empirical study in this part is to explore the economic effects of environmental tax reform by taking this exogenous event as a quasi-natural experiment, thus further determining the action mechanism of this shock on the total factor productivity of enterprises.
This paper selects the data of A-share listed industrial enterprises in Shanghai and Shenzhen during 2015–2020 as research samples to avoid the impact of similar policies. Enterprises affected by the environmental tax are mainly concentrated in heavily polluting industries, so the industries to which sample enterprises belong are classified. The specific steps are as follows. Detailed procedures of sample selection: (1) identify heavy polluting industries. By referring to the Listed Companies Environmental Protection Verification Industry Classification Management Catalog issued by the Ministry of Ecology and Environment, PRC in 2008, and the practice of Liu et al. [27] and Liu et al. [28], the present study analyzed the coal mining and washing industry; the oil and gas mining industry; the ferrous metal mining industry; the non-ferrous metal mining industry the textile industry the leather, fur, feathers and products and footwear industry; the papermaking and paper products industry; the manufacturing of chemical raw materials and chemical products; the manufacturing of chemical fibers; the manufacturing of rubber and plastic products; the manufacturing of non-metallic minerals; the smelting and rolling of ferrous metals; the smelting and rolling of non-ferrous metals and the production and supply of electricity and heat. (2) To ensure the stability and validity of the sample, the following enterprise data were excluded in the present study: ST and ST* enterprises (businesses suffering serial losses are referred to as ST and ST* enterprises), enterprises that have been de-listed and listed companies that issue both A and B shares. (3) The financial data of the sample enterprises selected in the present study are all from the GTA database. In addition, the continuous variables are reduced by 1% in order to alleviate the influence of outliers on the empirical results.

3.3. Variable Selection

(1)
Explained variable: Total factor productivity (TFP)
According to the research purpose and data availability, the present study adopts enterprise TFP as the explained variable. The estimation method of enterprise TFP mainly includes three methods: parametric, nonparametric and semi-parametric. In this paper, the measurement of TFP mainly involves parametric and semi-parametric methods. Since non-parametric methods do not consider sample random factors, they are not adopted in this paper to avoid inconsistency of the estimates.
Parametric method: This paper mainly estimates the parameters of the production function by using the GMM method proposed by Blundell et al. [8]. A natural instrumental variable for the estimation of the production functions is the lag value of the explained variable. As it is determined in a t-1 period, it will not be related to the current technical impact. Its basic idea is to take the residuals as a measure of total factor productivity and solve the endogenous problems in the model by adding instrumental variables.
Semi-parametric method: Different from the parametric method of the GMM method to measure TFP, the OP method and the LP method adopted in this paper belong to the semi-parametric method. The OP method was first proposed by Olley et al. [4]. Its core idea is to take the investment level of the company as the proxy variable of productivity, which solves the problem of simultaneous selection bias and sample selection deviation very well. For the problem of simultaneous selection bias, the OP method assumes that the enterprise will make investment decisions based on the current productivity status. Therefore, the simultaneous bias problem can be solved with the proxy variable representing the unobservable productivity. For the problem of sample selection bias, the OP method obtains an unbiased estimate of labor output elasticity by constructing a polynomial that contains the logarithms of enterprise investment and enterprise capital stock and then establishes an enterprise survival probability model to estimate the enterprise’s entry and exit decisions, thus effectively solving the problem of sample selection bias and obtaining a consistent estimate of capital output elasticity. However, the OP method has some limitations, that is, the need to meet the monotonous increase between investment and productivity. This means that those samples with zero investment levels will not be estimated. Levinsohn et al. [5] improved on this problem by developing a new TFP estimation method, namely, the LP method. The core ideas that instead of using the investment amount as a proxy variable, intermediate product input indicators are used. The LP method allows researchers to flexibly select proxy variables based on the available data.
Therefore, in this paper, we use the LP method in the benchmark regression, select the OP method and GMM methods to re-measure the enterprise TFP and substitute the measurement equation to check whether the regression results are robust.
(2)
Core independent variable: Dummy variable of environmental tax policy
Independent variables include group dummy variables, time dummy variables and their interaction terms. When estimating the impact of the reform of an environmental fee and tax, a dummy variable treated i t was set for whether it belongs to a heavily polluting industry, and the value was assigned to each industry, respectively. If an industry belongs to a heavily polluting industry, then treated i t = 1, otherwise treated i t = 0. When estimating the time change trend of the impact of environment on the level of the profit margin of enterprises, the dummy variable T of time effect is set. T represents the 0–1 dummy variable, and T = 1 indicates the year after the Environmental Protection Tax Law was issued for an industry. T = 0 represents the year before the Environmental Protection Tax Law. The interaction term treated i t × T i t is the core independent variable.
(3)
Control variable
TFP is affected by many factors. Hence, a series of control variables were introduced by referring to the existing studies on the determinants of enterprise total factor productivity to improve the accuracy of the regression results. Among them, the basis for the selection of control variables is as follows: the size and age of the enterprise are mainly selected to control the individual characteristics of the enterprise. The asset–liability ratio and liquidity ratio are mainly selected to control the financial and asset operation level of the enterprise, and the administration cost is mainly selected to control the internal management level of the enterprise. The main purpose of the Herfindahl index is to control the level of market competition in the region of the enterprise. The specific measurement method is enterprise size (size) which is the total assets of the enterprise calculated using the natural logarithm. The asset–liability ratio (lev) reflects the solvency of the enterprise. The enterprise debt is compared to the enterprise total assets. Enterprise age (life) reflects the life of the enterprise, using the logarithm of life. The liquidity ratio (liquid) reflects the financial security of the enterprise and the ability to resist risks. It is expressed as the ratio of the difference between total liquid assets and liquid liabilities to the total assets of the enterprise. Administration cost (manage), expressed by the logarithm of management expenses, reflects the internal management level of the enterprise. The Herfindahl index (hhi) is used to control the influence of the overall degree of urban industry competition on enterprises. Table 2 shows the descriptive statistics of each variable.

4. Empirical Analysis

4.1. Benchmark Regression

Formula (1) of the test model is used for regression analysis, and the specific results of the basic regression are shown in Table 3 to test the impact of environmental tax policy on the total factor rate of enterprises. All regressions are performed at the firm level in different industries to allow for possible serial correlation. In Column (1), only DID, the DID interaction term of environmental tax policy, is added, controlling for year fixed effects and firm fixed effects. The regression result was the estimated result without adding control variables. It is the direct effect of environmental tax policy on the total factor productivity level of enterprises in heavily polluting industries. The regression coefficient of the interaction term is positive and significant at the 1% level. It shows that the environmental tax policy significantly improves the level of total factor productivity of enterprises. In Column (2) and Column (3), the influencing factors of enterprise level (enterprise size, solvency, enterprise age, liquidity ratio, management cost) and industry level (industry competition) are further controlled separately. The coefficients of the interaction terms were significantly positive in turn. All the control variables were added in Column (4), which is the most robust result. The coefficient of the interaction term DID is still significantly positive at the 1% level, and the empirical results have been further verified.
In four columns of the benchmark regression in Table 3, the coefficients of the DID interaction term are significantly positive, ranging from 0.0739 to 0.0912. Hence, the introduction of environmental tax policy can significantly improve the level of total factor productivity of enterprises, and the direction of this effect does not change significantly with the continuous addition of co-variates, showing a certain robustness.

4.2. Robustness Test

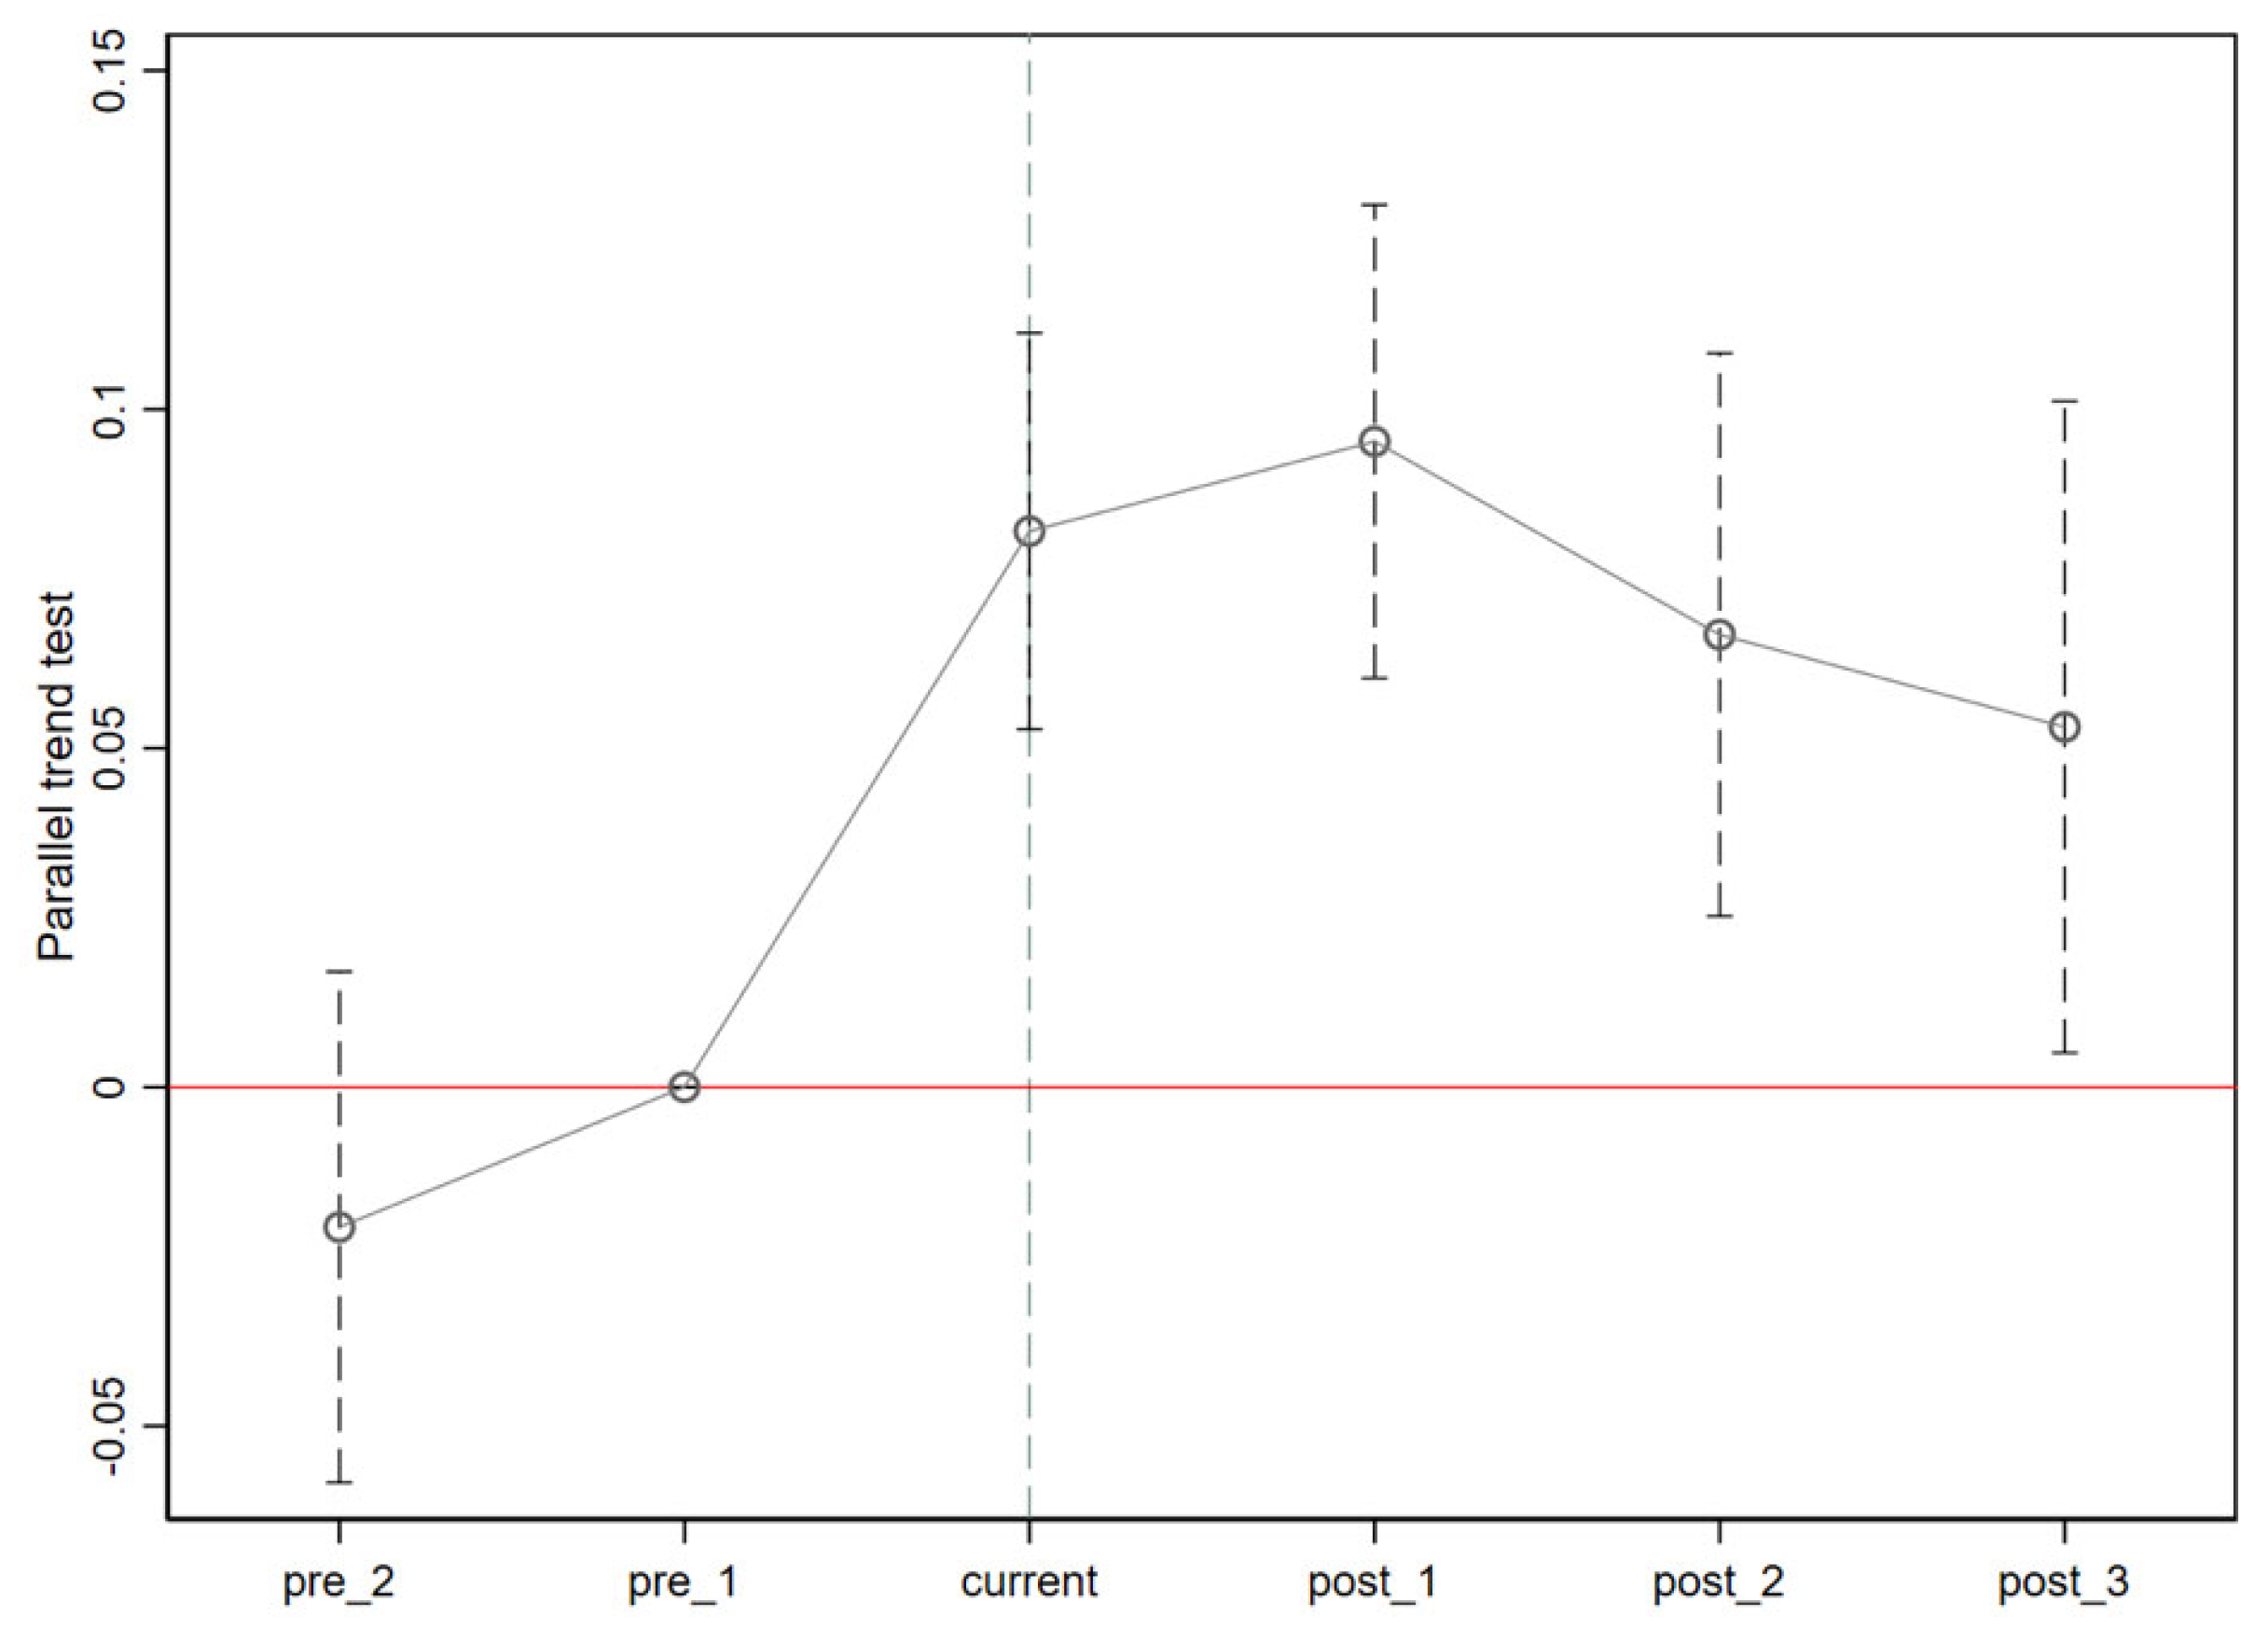
4.2.1. Parallel Trend Test

An important prerequisite of using DID for analysis is that the assumption of parallel trends between the treatment and control groups must be satisfied. In short, if the policy shock does not exist, then the time trends of the control group and the experimental group should not be systematically different and should be consistent. Therefore, in this part, different methods can be used to test the parallel trend.
Moreover, this present study draws on the idea of the Event Study Approach to further verify the dynamic effects of parallel trends and environmental tax policies on enterprise total factor productivity to avoid the subjectivity of intuitive judgment. The interaction term between the dummy year variable and the dummy variable of the treatment group was generated first, and then the interaction term was added to the model for regression. In this regard, the coefficient of the interaction term could better measure the difference between the treatment group and the control group. The equation is as follows:
Y i t = β 0 + j = M N δ j t r e a t i × y e a r j + λ i + ν t + ε i t
where M and N represent the number of periods before and after the policy respectively, and the coefficient δ j of the interaction term t r e a t e d i × y e a r j measures the difference between the treatment group and the control group in the JTH period and the benchmark group. In the event that the coefficient of the interaction term between the dummy variable and the treatment group before the policy time point is not significant, there will be no time trend of heterogeneity between the treatment group and the control group before the policy time point.
Based on the existing theory, the results of the parallel trend test (Table 4) are obtained, where Column (1) represents the parallel trend test without control variables, and Column (2) represents the parallel trend test with control variables. Figure 2 shows the significance of the regression coefficients for each year within the 95% confidence interval. Taking 2016, the first period before the policy, as the base period, it can be seen that in the two periods before the introduction of the environmental tax policy, the regression coefficients were not significantly different from 0, indicating that there was no systematic difference between the treatment group and the control group before the policy impact. The regression coefficients of the policy time point in the current period (2017) and the subsequent lagged three periods are significantly different from 0, indicating that the policy effect is obvious in the current period and after the policy impact. The parallel trend has been proved.

4.2.2. Replace Dependent Variable

The TFP measured by the previous benchmark regression is mainly based on the LP method. The OP method can solve the problem of simultaneous selection bias, sample selection bias, and the GMM method can solve the endogeneity problem in the model by adding instrumental variables. In this part, the OP method and the GMM method are used to remeasure the TFP of enterprises and substitute it into the measurement equation to check whether the regression results are robust. Results of the regression are shown in Table 5. In Table 5, Columns (1), (2) and (3) are the regression results of TFP of heavily polluted enterprises calculated based on the LP method, the OP method and the GMM method, respectively. The results show that whether the semi-parametric method or the parametric method is used to calculate TFP of heavy-polluting enterprises, the impact of environmental tax reform on TFP of heavy-polluting enterprises is significantly positive under the 1% statistical level, and the results are robust.

4.2.3. Replacement Industry Classification Standard

Most of the current literature does not have a unified and clear classification standard for the definition of heavy-polluting industries, and the classification standards of different articles will be partially different. The present study adopts the Environmental Protection Verification Industry Classification and Management Catalog of Listed Companies issued by the Ministry of Ecology and Environment, PRC in 2008 and draws on the practices of Liu et al. [27] and Liu [28]. Here, 15 heavily polluting industries were defined. In order to avoid the accidental existence of the results, two other classification criteria were selected for robustness testing: The first is based on the classification standards of heavy-polluting industries proposed by Li et al. [29], that is, heavy-polluting industries defined by the Industry Classification Standards for Listed Companies revised by China Securities Regulatory Commission in 2012 and the Listed Companies Environmental Protection Verification Industry Classification and Management Catalog issued by the Ministry of Environmental Protection. There are 18 categories in total. The second method is to match the 14 heavily polluting industries announced by the Ministry of Environmental Protection to listed companies according to the practice of Guo et al. [30]. This is the definition standard of heavy pollution industries. According to regression results in Table 6, Column (1) is the classification method of the benchmark regression in the present study, Column (2) is the classification method of Li et al. [29], and Column (3) is the classification method of Guo et al. [30]. The result shows that environmental tax policies improve the total factor productivity of heavily polluting enterprises at the significance level of 1% no matter how they are classified. The results show strong robustness.

4.3. Mechanism Analysis

Empirical research results show that environmental tax policies can promote the total factor productivity of heavily polluting enterprises. So, what is the transmission mechanism of this policy affecting the total factor productivity of heavily polluting enterprises? Based on the research ideas of Ren et al. [9], it can be understood from the essential characteristics of total factor productivity, that is, because total factor productivity is a comprehensive Solow residual value it has into two aspects: technological progress effect and capital allocation effect. Environmental tax policy may improve total factor productivity through stimulating technological innovation and optimizing resource allocation.
(1)
Technological innovation effect
To confirm whether the environmental tax policy promotes the total factor productivity of enterprises by stimulating technological innovation, in this section we verify whether this mechanism was established. The number of patent applications was selected as the proxy variable of technological innovation. Patent application is an important indicator of enterprise innovation, which can effectively reflect the output of enterprises under the input of scientific research personnel and funds. It can directly measure the independent innovation ability of enterprises. In addition, as a kind of green tax system, environment tax is more rigid than the sewage fee system. Hence, the emission standards of taxable pollutants have been raised, and higher requirements have been put forward for enterprises. In this regard, when an enterprise wants to maintain operation and reduce long-term taxable costs, it may improve the production process from the source and reduce the emission of taxable pollutants from the end. The source control undoubtedly requires the participation of clean energy and biomass energy, which requires higher requirements for general enterprises. Enterprises may choose more end management under conventional energy use, that is, to carry out green innovation to improve energy utilization efficiency [31]. Hence, in addition to the general significance of enterprise innovation, the proxy variable data of green innovation, namely the number of green patents, was screened to conduct empirical tests to investigate whether environmental tax policies force enterprises to make green transformation. The detailed results of the regression can be seen in Table 7. Column (1) shows the test result of independent innovation ability, and Column (2) is the test result of the green transition trend. The results show that when controlling for time, individual and other factors, the environmental tax policy promotes technological innovation. The theoretical hypothesis that environmental taxes affect the total factor productivity of heavily polluting enterprises through technological innovation has been effectively verified. The results in Column (2) show that the environmental tax policy has a significant incentive effect on green innovation in polluting industries whose taxable pollutant collection standards have been raised, indicating that the environmental tax policy can effectively promote the trend of green transformation of enterprises.
(2)
Capital allocation effect
The main verification is that the environmental tax policy enhances the total factor productivity of heavily polluting industries by improving the efficiency of capital allocation. Referring to the research ideas of Xu et al. [32], two variables, namely enterprise innovation output (logarithm of patent applications) and R&D investment (logarithm), were introduced as control variables and added to the econometric model equation of the benchmark regression for regression to see if the regression results are still significant for the sake of testing whether this conduction mechanism is valid. The main purpose of this research is to eliminate the technological progress effect of total factor productivity. After removing the factors of technological progress, whether the environmental tax policy will promote the total factor productivity by improving the efficiency of capital allocation should be determined. Detailed regression results can be seen in Table 7, where Column (3) is the regression result of adding the innovation output of enterprises as the control variable, and Column (4) is the regression result of adding the R&D investment as the control variable. The result showed that the two regression results are still significant, indicating that compared with the control group, the environmental tax policy significantly improves the capital allocation efficiency of enterprises in heavily polluting industries, thus improving the total factor productivity.

4.4. Analysis of Heterogeneity

Since the implementation of reform and the opening-up policy, the central government and the local governments at all levels have objectively implemented differentiated policies for enterprises. Enterprises in different regions and with different property rights directly or indirectly obtain different preferential policies, such as government subsidies, land transfers and bank loans. The same policy has different effects in each region due to the enforcement of regulations and industrial layout. In addition, state-owned enterprises have special resource advantages in China [33], with relatively stable capital sources and market occupancy rate. Nonetheless, in contrast, most state-owned enterprises are related to the national economy and people’s livelihoods. Most of them are concentrated in the heavy chemical industry, and the overall industrial structure is too heavy, which may be more affected by environmental protection tax policies. According to the above theory in terms of the protection tax policy, although enterprises in different regions and types are treated equally, enterprises in different regions and types bear different burdens of institutional costs. It is concluded that the introduction of environmental tax policies shows heterogeneous effects on the total factor productivity of heavily polluting enterprises in different regions on that score. The following shows two steps of empirical analysis
(1)
Regression analysis conducted according to different regions
All provinces are classified as eastern region, central region, western region and northeast region according to their geographical location. The regression equations in this part are consistent with the benchmark regression, and two-way fixed effects are used, but sub-sample regression is performed. According to regression results in Table 8, all regions are significantly positive at the 1% level, consistent with the baseline regression. There are some differences in the specific coefficient size. Nevertheless, the total factor production of enterprises in heavily polluting industries in the eastern region is the least affected by environmental tax policies, followed by the central region, the northeast region, and the western region. The western region was the most affected one which is consistent with the reality in Table 9 that the number of enterprises in heavy-polluting industries in the central and western regions accounts for the highest proportion.
(2)
Regression analysis conducted according to different nature of property rights
Similar to the previous article, according to the existing literature, the enterprises are divided into state-owned enterprises and non-state-owned enterprises to conduct two-way fixed-effect regression, and the control variables are consistent with the benchmark regression. Table 8 shows that state-owned enterprises with a heavy property right structure are more affected by environmental tax policies, consistent with the theoretical assumptions above.

5. Discussion

The improvement of enterprise total factor productivity is the top priority of accelerating China’s supply-side structural reform. In this regard, it is necessary to study the relationship between environmental regulation and total factor productivity of enterprises under the background of increasingly severe environmental pollution situations and increasing resource and environment constraints. Taking the implementation of the Environmental Protection Tax Law as a quasi-natural experiment, the DID method was used to test the impact and mechanism of environmental protection fee change on the total factor productivity of heavily polluting enterprises based on the data of Shanghai and Shenzhen A-share listed industrial enterprises from 2015 to 2020. In addition, out-robustness tests were conducted. The main three valuable findings are as follows:
The first main finding is that the introduction of the environmental tax reform had a significant positive impact on the total factor productivity of heavily polluting enterprises. The contradiction between economic development and environmental protection has been increasingly intense. Hence, the government has adopted a series of ways to regulate the production mode of enterprises and alleviate environmental pollution. In essence, environmental regulation provides necessary external conditions for enterprises to improve production efficiency. The intensity of environmental regulation can promote productivity growth and improve enterprise competitiveness [34]. The environmental protection tax reform has increased the intensity of the government’s environmental regulation, as well as enhanced regulation and penalties on firms, which has forced firms to make adjustments to their production to meet environmental requirements and drive up their total factor productivity, thus remaining consistent with the findings of Porter’s hypothesis [35].
The second major finding of this present study: the promotion effect of environmental tax reform on the total factor productivity of heavily polluting enterprises is mainly through improving the level of technological innovation and optimizing the capital allocation of enterprises. As a green tax system, environmental protection tax raised the emission standards of taxable pollutants, and higher requirements have been put forward for enterprises. To maintain operation and reduce long-term taxable costs, enterprises will choose to carry out green innovation to enhance energy utilization efficiency and reduce taxable pollutant emissions. Enterprises will also optimize their capital allocation by increasing innovation output and R&D investment, thus improving total factor productivity.
The third major finding of this present study is that the effect of environmental tax reform on total factor productivity of heavy-polluting enterprises is heterogeneous. At the regional level, the (TFP) of enterprises in heavily polluting industries in eastern China is least affected by environmental tax policies. As for the nature of property rights, state-owned enterprises with heavy property rights structure have been impacted by environmental protection tax policies to the maximum. There are great differences in environmental carrying capacity, economic development degree and industrial distribution among various regions in China. In this regard, the implementation of environmental protection policies produces different policy effects in different regions [36]. In addition, the nature of property rights will lead to the differentiation of R&D investment among enterprises. In the high intensity environmental regulation, some enterprises tend to passively pay the environmental protection tax, while other enterprises tend to upgrade the technology [37]. State-owned enterprises are superior to non-state-owned enterprises in management, supervision and control and technological innovation. In this case, the implementation of the environmental protection tax provides strong external conditions for state-owned enterprises to enhance total factor productivity.

6. Conclusions

In this present study, we found the environmental protection tax reform has a significant positive impact on the total factor productivity of heavy-polluting enterprises. The study found that the environmental protection tax reform has a significant positive impact on the total factor productivity of heavy-polluting enterprises, and the total factor productivity of heavy-polluting enterprises increased by 7.39% under the policy. The OP method and the GMM method were used to re-measure the total factor productivity of heavily polluting enterprises considering the endogenous problem, and different industry classification standards were used to re-test the relationship between them. The result is still robust. All environmental protection taxes increase the total factor productivity of heavily polluting enterprises at the significant level of 1%. The promotion effect of environmental protection tax reform on the total factor productivity of heavily polluting enterprises improves the level of technological innovation and optimizes the capital allocation of enterprises. In addition, the impact of environmental protection tax reform on total factor productivity of heavy-polluting enterprises shows certain heterogeneity. Regional heterogeneity analysis demonstrates that the total factor productivity of enterprises in heavily polluting industries in the eastern region was the least affected by environmental tax policies, followed by the central region, northeast China, and western China. The western region of China has been most affected. Heterogeneity of the nature of property rights showed that state-owned enterprises with heavy property rights structure have been impacted by environmental protection tax policies to the maximum. The most affected western region is 8.47% higher than the least affected eastern region; Moreover, study on the heterogeneity of property rights showed that state-owned enterprises with heavy property rights structure were the most affected by the environmental tax policy, and the influence on state-owned enterprises was 0.27% higher than that on non-state-owned enterprises.
Still, this research has some limitations. Only the effect of environmental tax reform on total factor productivity of heavy-polluting enterprises was discussed in the present study. The development of economy and society is a complex network system. The reform and promulgation of a policy will have many influences on the development of economy and society. In this case, future research can be carried out in the following directions: First, the impact of environmental tax reform on enterprises’ investment in environmental protection, energy structure, energy efficiency and employment will be investigated for the sake of exploring other effects of environmental tax reform enterprises. Second, the formulation of emission quotas is a vital system design of environmental protection tax and a crucial factor affecting the implementation effect of the policy. Future studies may consider the quota aspect in order to develop a more effective and perfect environmental protection tax system.

7. Implications

The views of the present study are of great significance to better understand the relationship between the environmental protection tax reform and the total factor productivity of heavy-polluting enterprises and to deeply understand the influence mechanism of the environmental protection tax reform on the total factor productivity of heavy-polluting enterprises. The policy recommendations of the present study are as follows: first, differentiated environmental protection tax system. Environmental protection tax has different effects on enterprises in different regions and with different natures of property rights. In order to maximize the policy effect of environmental protection tax, tax policies should also be different. According to enterprises regional location, policy support and natural differences in factor endowments, we consider their ability to bear tax burden and give consideration to both efficiency and equity. Plus, the tax system structure should be adjusted in order to fully explore the innovation ability of enterprises and stimulate their enthusiasm for innovation. Second, it is important to enhance enforcement of environmental protection taxes. Environmental administrative supervision is an important guarantee for the effective implementation of the environmental protection tax system. The government should increase the monitoring frequency and intensity of pollution sources for the sake of ensuring the accurate collection of pollutant discharge information by these enterprises, expose enterprises that do not comply with trading rules through the media and impose administrative penalties. The implementation of environmental protection taxes will be included in the performance evaluation of government officials, and local governments will be prevented from protecting polluting enterprises. The government should also optimize and improve the environmental protection tax system, formulate more reasonable standards for environmental protection tax rates, strengthen coordination between the environmental protection tax and other environmental protection systems and spark technological innovation and green transformation of enterprises through government and enterprise cooperation.

Author Contributions

The authors’ contributions are as follows: Conceptualization, X.H. and Q.-L.J.; methodology, X.H.; formal analysis, Q.-L.J.; data curation, X.H.; writing—original draft preparation, X.H. and Q.-L.J.; writing—review and editing, X.H. and Q.-L.J. All authors have read and agreed to the published version of the manuscript.

Funding

This research received no external funding.

Institutional Review Board Statement

Not applicable.

Informed Consent Statement

Not applicable.

Data Availability Statement

All data used in this paper are from China Stock Market & Accounting Research Database (CSMAR) (https://www.gtarsc.com, accessed on 20 June 2022).

Conflicts of Interest

The authors declare no conflict of interest.

References

  1. Jin, Y.L.; Gu, J.R.; Zeng, H.X. Does “Environmental Protection Fees Replaced with Environmental Protection Taxes” Affect Corporate Performance? Account. Res. 2020, 5, 117–133. [Google Scholar]
  2. Zhang, L.; Zhu, G.S.; Li, S.G.; Li, X.Y. Market environment, key industrial policy and enterprise productivity difference. J. Manag. World 2019, 3, 114–126. [Google Scholar]
  3. Solow, R.M. Technical change and the aggregate production function. Rev. Econ. Stat. 1957, 39, 312–320. [Google Scholar] [CrossRef] [Green Version]
  4. Olley, S.; Pakes, A. The Dynamics of Productivity in the Telecommunications Equipment Industry. Econometrica 1996, 64, 1263–1297. [Google Scholar] [CrossRef]
  5. Levinsohn, J.; Petrin, A. Estimating production functions using inputs to control for unobservables. Rev. Econ. Stud. 2003, 70, 317–341. [Google Scholar] [CrossRef]
  6. Wang, J.; Liu, B. Environmental Regulation and Enterprise’ TFP—An Empirical Analysis Based on China’s Industrial Enterprise Data. China Ind. Econ. 2014, 3, 44–56. [Google Scholar]
  7. Xu, B.C.; Xie, J.G. How Pollution Charges Affect the Enterprise Productivity? Evidence from the Chinese Manufacturing Industry. J. World Econ. 2016, 39, 143–168. [Google Scholar]
  8. Blundell, R.; Bond, S. Initial conditions and moment restrictions in dynamic panel data models. J. Econom. 1998, 87, 115–143. [Google Scholar] [CrossRef] [Green Version]
  9. Ren, S.G.; Zheng, J.J.; Liu, D.H.; Chen, X.H. Does Emissions Trading System Improve Firm’s Total Factor Productivity—Evidence from Chinese Listed Companies. China Ind. Econ. 2019, 5, 5–23. [Google Scholar]
  10. Xu, X.; Huang, X.; Huang, J.; Gao, X.; Chen, L. Spatial-temporal characteristics of agriculture green total factor productivity in China, 1998–2016: Based on more sophisticated calculations of carbon emissions. Int. J. Environ. Res. Public Health 2019, 16, 3932. [Google Scholar] [CrossRef] [Green Version]
  11. Caves, D.W.; Christensen, L.R.; Diewert, W.E. Multilateral comparisons of output, input, and productivity using superlative index numbers. Econ. J. 1982, 92, 73–86. [Google Scholar] [CrossRef]
  12. Färe, R.; Grosskopf, S.; Lovell, C.A.K.; Pasurka, C. Multilateral productivity comparisons when some outputs are undesirable: A nonparametric approach. Rev. Econ. Stat. 1989, 71, 90–98. [Google Scholar] [CrossRef]
  13. Wang, M.; Li, Y.; Liao, G. Research on the impact of green technology innovation on energy total factor productivity, based on provincial data of China. Front. Environ. Sci. 2021, 9, 710931. [Google Scholar] [CrossRef]
  14. Song, M.; Peng, L.; Shang, Y.; Zhao, X. Green technology progress and total factor productivity of resource-based enterprises: A perspective of technical compensation of environmental regulation. Technol. Forecast. Soc. Change 2022, 174, 121276. [Google Scholar] [CrossRef]
  15. Wang, H.; Cui, H.; Zhao, Q. Effect of green technology innovation on green total factor productivity in China: Evidence from spatial durbin model analysis. J. Clean. Prod. 2021, 288, 125624. [Google Scholar] [CrossRef]
  16. Furceri, D.; Celik, S.K.; Jalles, J.T.; Koloskova, K. Recessions and total factor productivity: Evidence from sectoral data. Econ. Model. 2021, 94, 130–138. [Google Scholar] [CrossRef]
  17. Liu, Y.; Yang, Y.; Li, H.; Zhong, K. Digital economy development, industrial structure upgrading and green total factor productivity: Empirical evidence from China’s cities. Int. J. Environ. Res. Public Health 2022, 4, 2414. [Google Scholar] [CrossRef]
  18. Yu, D.; Li, X.; Yu, J.; Li, H. The impact of the spatial agglomeration of foreign direct investment on green total factor productivity of Chinese cities. J. Environ. Manag. 2021, 290, 112666. [Google Scholar] [CrossRef]
  19. Lee, C.C.; Lee, C.C. How does green finance affect green total factor productivity? Evidence from China. Energy Econ. 2022, 107, 105863. [Google Scholar] [CrossRef]
  20. Zhang, Y.; Song, Y.; Zou, H. Transformation of pollution control and green development: Evidence from China’s chemical industry. J. Environ. Manag. 2020, 275, 111246. [Google Scholar] [CrossRef]
  21. Zhang, W.; Meng, J.; Tian, X. Does de-capacity policy enhance the total factor productivity of China’s coal companies? A regression discontinuity design. Resour. Policy 2020, 68, 101741. [Google Scholar] [CrossRef]
  22. Feng, Y.; Wang, X.; Liang, Z.; Hu, S.; Xie, Y.; Wu, G. Effects of emission trading system on green total factor productivity in China: Empirical evidence from a quasi-natural experiment. J. Clean. Prod. 2021, 294, 126262. [Google Scholar] [CrossRef]
  23. Chen, H.; Guo, W.; Feng, X.; Wei, W.; Liu, H.; Feng, Y.; Gong, W. The impact of low-carbon city pilot policy on the total factor productivity of listed enterprises in China. Resour. Conserv. Recycl. 2021, 169, 105457. [Google Scholar] [CrossRef]
  24. Tang, H.; Liu, J.; Wu, J. The impact of command-and-control environmental regulation on enterprise total factor productivity: A quasi-natural experiment based on China’s “Two Control Zone” policy. J. Clean. Prod. 2020, 254, 120011. [Google Scholar] [CrossRef]
  25. Yuan, J.; Zhang, D. Research on the Impact of Environmental Regulations on Industrial Green Total Factor Productivity: Perspectives on the Changes in the Allocation Ratio of Factors among Different Industries. Sustainability 2021, 23, 12947. [Google Scholar] [CrossRef]
  26. Cheng, B.; Xiong, T.; Yin, M.J. The Stones of those Hills, Serve to Polish Gems: Spillover Effect of Green Tax System on Firm’s Innovation. Account. Res. 2021, 6, 176–188. [Google Scholar]
  27. Liu, Y.G.; Liu, M.N. Have Smog Affected earnings management of heavily polluting enterprises?—Based on the political-cost hypothesis. Account. Res. 2015, 3, 26–33. [Google Scholar]
  28. Liu, X.H. Public Pressure, Property rights and Corporate Financing Behavior: A study based on the “PM2.5 Explosion” Event. Econ. Sci. 2016, 2, 67–80. [Google Scholar]
  29. Li, J.L.; Yang, Z.; Chen, J. Mixed Ownership Reform and Social Responsibility of State-owned Firms-Investigation Based on the Dual Perspectives of Quality and Quantity. Shanghai J. Econ. 2021, 11, 35–47. [Google Scholar]
  30. Guo, Y.; Su, C.Z.; Zhang, Y. Does disclosure of social responsibility information improve the market performance of enterprises? Syst. Eng. Theory Pract. 2019, 4, 881–892. [Google Scholar]
  31. Wang, M.; Wang, W.; Wu, L. Application of a new grey multivariate forecasting model in the forecasting of energy consumption in 7 regions of China. Energy 2022, 243, 123024. [Google Scholar] [CrossRef]
  32. Xu, S.Y.; Chen, J.; Zhao, G. How Does the Land Leasing Marketization Affect the Economic Growth. China Ind. Econ. 2018, 3, 44–61. [Google Scholar]
  33. Zhang, C.S.; Liu, G.C. The Existence and Dynamic Characteristics of Optimal Financial Structure and Its Effect on Economic Growth. J. Manag. World 2016, 1, 66–77. [Google Scholar]
  34. Xie, R.; Yuan, Y.; Huang, J. Different types of environmental regulations and heterogeneous influence on “green” productivity: Evidence from China. Ecol. Econ. 2017, 132, 104–112. [Google Scholar] [CrossRef]
  35. Porter, M.E.; Van, D.L.C. Toward a new conception of the environment-competitiveness relationship. J. Econ. Perspect. 1995, 9, 97–118. [Google Scholar] [CrossRef] [Green Version]
  36. Feng, F.; Feng, X.G.; Hou, J.C.; Huo, D.M.; Tang, R. Effectiveness of regional environmental regulation, economic growth and environmental pollution: An empirical study of the Beijing-Tianjin-Hebei region. Resour. Sci. 2020, 42, 2341–2353. [Google Scholar] [CrossRef]
  37. Zhang, P.; Zhang, P.P.; Cai, G.Q. Comparative Study on Impacts of Different Types of Environmental Regulation on Enterprise Technological Innovation. China Popul. Resour. Environ. 2016, 4, 8–13. [Google Scholar] [CrossRef]
Figure 1. Research framework.
Sustainability 14 14946 g001
Figure 2. Parallel trend test pattern. Notes: pre−2 and pre−1 are 2 and 1 years before the occurrence of the policy; current is the current period of the policy; post−3, post−2 and post−1 are 3, 2 and 1 years after the occurrence of the policy.
Sustainability 14 14946 g002
Table 1. Related developments in China’s environmental protection tax.
TimeRelated Courses
13 September 1979The 11th Session of the Standing Committee of the Fifth National People’s Congress deliberated and adopted the Environmental Protection Law (Trial Implementation)
5 February 1982The State Council issued Interim Measures of Collection of Sewage Charges
28 July 1988The State Council issued Interim Measures of Paid Use of Special Fund for Pollution Source Control
15 August 1993The State Planning Commission (SPC) and Ministry of Finance printed and distributed Notice of Collection of Sewage Charges
2 January 2003The State Council issued Management Ordinance of Collection and Use of Sewage Charges
1 September 2014National Development and Reform Commission, Ministry of Finance and Ministry of Environmental Protection printed Notice on Adjustment of the Standards for Collection of Pollutant Discharge Fees and Other Relevant Issues
13 November 2014The Ministry of Finance, the Ministry of Environmental Protection and the State Taxation Administration jointly submitted the Environmental Protection Tax Law of the People’s Republic of China (draft) to the State Council
10 June 2015Office of Legislative Affairs of the State Council issued Notice on Soliciting Public Opinions on the Environmental Protection Tax Law of the People’s Republic of China (Draft)
5 August 2015The Environmental Protection Tax Law was to the legislative plan of the Standing Committee of the 12th Standing Committee of the National People’s Congress
29 August 2016–3 September 2016The 20th Meeting of 12th Standing Committee of the National People’s Congress reviewed the Environmental Protection Tax Law of the People’s Republic of China (draft) for the first time
25 December 2016The 25th meeting of the 12th Standing Committee of the National People’s Congress approved the Environmental Protection Tax Law of the People’s Republic of China
1 January 2018The Environmental Protection Tax Law of the People’s Republic of China and Enforcement Regulations of the Environmental Protection Tax Law of the People’s Republic of China take effect synchronously
Table 2. Descriptive statistics of variables.
SignVariablesMeanStandard DeviationMinMax
TFPTotal factor productivity15.42401.02426.907819.9872
DIDInteraction item0.15270.35970.00001.0000
sizeEnterprise scale22.26061.330515.979228.6365
levAsset-liability ratio0.41640.23400.008410.4953
lifeEnterprise age3.10480.25241.79184.1589
liquidLiquidity ratio2.56092.98080.064280.6637
manageManagement cost18.85031.185315.064625.1682
hhiIndustry competitiveness0.20600.00770.20030.3054
Table 3. Basic regression results.
(1)(2)(3)(4)
DID0.0739 ***
(0.0135)
0.0910 ***
(0.0118)
0.0844 ***
(0.0138)
0.0912 ***
(0.0118)
Control variable NoYes Yes Yes
Fixed effect of the year YesYes Yes Yes
Fixed effect of enterprise Yes Yes Yes Yes
R20.18320.40490.18420.4051
Notes: *** indicate the significance levels of 1%.
Table 4. Basic regression results.
(1)(2)
2015 0.0119
(0.0231)
0.0206
(0.0192)
2017 0.0626 ***
(0.0183)
0.0820 ***
(0.0149)
2018 0.0974 ***
(0.0216)
0.0952 ***
(0.0178)
2019 0.0830 ***
(0.0246)
0.0667 ***
(0.0211)
20200.0737 **
(0.0287)
0.0531 **
(0.0245)
Control variable NoYes
Fixed effect of the year YesYes
Fixed effect of enterprise YesYes
R20.18340.4051
Notes: *** and ** indicate the significance levels of 1% and 5%, respectively.
Table 5. Fictitious policy processing items.
DIDLPOPGMM
0.0912 ***
(0.0118)
0.1222 ***
(0.0105)
0.1008 ***
(0.0152)
Control variableYesYesYes
Fixed effect of the yearYesYesYes
Fixed effect of enterpriseYesYesYes
R20.40510.12880.1011
Notes: *** indicates the significance levels of 1%.
Table 6. Replacement industry classification standard.
(1)(2)(3)
DID0.0912 ***
(0.0118)
0.0558 ***
(0.0109)
0.0687 ***
(0.0105)
Other control variablesYesYesYes
Fixed effect of the yearYesYesYes
Fixed effect of enterpriseYesYesYes
R20.40510.40400.4044
Notes: *** indicates the significance levels of 1%.
Table 7. Mechanism analysis.
Technological Innovation EffectCapital Allocation Effect
Explained variables(1)(2)(3)(4)
DID0.1661 *
(0.0914)
0.0405 **
(0.0193)
0.0506 ***
(0.0140)
0.0901 *
(0.0460)
Fixed effect of the yearYesYesYesYes
Fixed effect of enterpriseYesYesYesYes
Control variableYesYesYesYes
R20.01160.01870.47510.3069
Notes: ***, ** and * indicate the significance levels of 1%, 5% and 10%, respectively.
Table 8. Heterogeneity analysis.
Region HeterogeneityEquity Heterogeneity
Explained VariablesEastern
Region
Central
Region
Western
Region
Northeast
Region
State-Owned
Enterprise
Non-State-Owned
Enterprise
DID0.0621 ***0.1089 **0.1468 ***0.1209 *0.1236 ***0.1209 *
(0.0146)(0.0193)(0.0345)(0.0460)(0.0176)(0.0460)
Fixed effect of the yearYesYesYesYesYesYes
Fixed effect of
enterprise
YesYesYesYesYesYes
Control variableYesYesYesYesYesYes
R20.37950.37650.49360.30690.37650.3987
Notes: ***, ** and * indicate the significance levels of 1%, 5% and 10%, respectively.
Table 9. Heterogeneity analysis.
Heavy Pollution IndustryEastern
Region
Central
Region
Western
Region
Northeast
Region
Quantity2498746715171
Ratio to the total quantity18.45%30.88%31.10%23.75%
Publisher’s Note: MDPI stays neutral with regard to jurisdictional claims in published maps and institutional affiliations.

