Abstract
Based on the data regarding the rural population and cultivated land at the county level in Guangdong Province in 2000, 2010 and 2020, this paper analyzes the changes in rural population and cultivated land area at the county level and their spatio-temporal coupling characteristics based on GIS technology and model methods such as the elastic coefficient, and reveals the transformation process of the rural “man–land” relationship in Guangdong Province. The results show that the rural population of Guangdong Province shows a continuous growth trend, and the cultivated land area and per capita cultivated land area show a trend of continuous reduction. From 2000 to 2010, the rural population grew by 1.37% annually, while the cultivated land area and per capita cultivated land area decreased by 0.09% and 1.28% annually, respectively. From 2010 to 2020, the rural population grew by 0.07% annually, while the cultivated land area and per capita cultivated land area decreased by 1.09% and 1.15% annually, respectively. The overall coupling type of rural population and cultivated land change in Guangdong Province presents a trend of mainly maladjusted types and gradually changing to coordinated types. From 2000 to 2010, 70.64% of the counties displayed maladjusted development types. From 2010 to 2020, the number of counties with maladjusted development types decreased, while the proportion of coordinated types increased. The natural environment, economic development level and governmental decision-making behaviors were all driving factors of coupled development of rural population and cultivated land, and the driving mechanisms of different factors have clear spatial differences in different regions of Guangdong Province. The governments and relevant departments should stick to the red line of cultivated protection, make intensive use of cultivated land and improve the livelihoods of farmers. Moreover, the Pearl River Delta, eastern Guangdong, western Guangdong and northern Guangdong should improve the cooperation mechanism for rural revitalization. The study is conducive to providing a scientific basis for rural population and cultivated land utilization management, rural revitalization and new rural construction, and promoting urban–rural integration development under the new situation.
1. Introduction
As the basic conditions and resources for human survival and development, cultivated land is an important factor in maintaining national food security, sustainable economic and social development, social stability and ecological environment protection. Population and cultivated land are the key factors in agricultural production, and are also the research focus of the rural “man–land” relationship [1]. In September 2015, the United Nations Summit on Sustainable Development adopted the draft resolution “Transforming Our World: the 2030 Agenda for Sustainable Development” submitted by the sixty-ninth session of the United Nations General Assembly. It contains 17 Sustainable Development Goals (SDGS) and 169 targets, which fully reflect the three dimensions of sustainable development, namely economic development, environmental well-being and social progress [2]. In the face of the SDG relating to sustainable land use, China still faces many challenges in cultivated land protection [3]. On 4 January 2022, the “Opinions of the CPC Central Committee and The State Council on Comprehensively Promoting the Key Work of Rural Revitalization in 2022” proposed implementing tough measures relating to cultivated land protection, implementing the responsibilities of the Party and the government to cultivated land protection, and strictly observing the red line of 1.8 billion mu of cultivated land [4]. In the 21st century, China’s population is increasing, while the area of cultivated land is gradually decreasing. The crisis of land resources will be prominent in the cultivated land for a long period of time in the future under the special national conditions. At present, China is in a period of economic and social transformation. With rapid urbanization and industrialization, and the rapid flow and interaction of urban and rural production factors, there is a certain coupling relationship between rural population mobility and cultivated land change [5]. In particular, what is the changing trend of rural population when cultivated land decreases? Whether such changes can promote the rural “man–land” relationship to become adaptive and coordinated is an important condition for ensuring regional food security and urban–rural integrated development.
For a long time, scholars at home and abroad have attached great importance to the related research of cultivated land and rural population and achieved fruitful results, but mainly focused on the single factor research of cultivated land and the rural population. Studies on cultivated land mainly cover the spatial–temporal pattern of cultivated land change [6,7,8], the driving mechanism of cultivated land change [9,10,11], cultivated land function evolution [12,13,14], cultivated land transition [15,16,17], cultivated land intensive use [18,19,20], cultivated land simulation prediction [21,22,23], food security and ecological security [24,25,26], cultivated land protection systems and policy [27,28,29] and the marginalization of cultivated land use [30]. Studies on rural populations mainly focus on rural population change [31], rural labor migration [32], and the hollowing out of the rural population [33,34,35] and the non-agricultural population [36,37]. However, excessive attention to single factors such as population and land in the process of urbanization may lead to an inadequate response or adjustment of regional rural development issues [38], which is not conducive to scientific decision-making of rural revitalization to a certain extent. This issue has attracted the attention of rural geographers [39,40]. Some scholars have discussed the rural “man–land” production system and the correlation between factors [41,42]. Liu et al. used GIS technology and a model method to analyze the changes in cultivated land area and agricultural labor force and their spatio-temporal coupling characteristics in 1996, 2000 and 2005 in China [1]. Yang et al. conducted a comprehensive study on the spatial-temporal pattern and the rule of coupling co-evolution of non-agricultural transformation regarding population, land and industry at the county scale around the Bohai Rim in China in 1995, 2000 and 2010 by constructing an index system and using the coupling coordination model [42]. Liu et al. analyzed the sequential variation characteristics, spatial heterogeneity rules and coupling relationship types of Chinese rural land resources and population between 2007 and 2015, based on the elastic coefficient model [43]. Liu et al. explored the spatial characteristics and coupling relationship between the changes in rural residential areas and rural population in Chongqing in 2010 and 2016 by using the methods of combination characteristics analysis and spatial analysis [44]. Overall, academics have made significant progress in analyzing the spatio-temporal evolution, driving forces and effect mechanisms of cultivated land and rural population at the macro scale at present. However, there is a clear imbalance between natural conditions and the social and economic development process in China due to its vast territory and abundant resources. There are also internal differences in the changes in cultivated land and rural population. There is still a lack of research on the micro scale, and the research scale needs to be further extended to the county scale, which is more conducive to depicting the changes within the region in detail [5]. Although scholars have explored the spatial-temporal coupling characteristics between the rural population and cultivated land changes in karst trough valley areas, the comprehensive research on the analysis of rural populations and cultivated land change focusing on typical demonstration cases is still insufficient, and more attention should be paid to economically developed areas. The study of the case of the developed areas has certain reference value for the land management of other regions.
As one of the first demonstration areas for reform and opening up, Guangdong Province plays an outstanding leading role and a decisive strategic position in the overall situation of national economic construction. In recent years, Guangdong Province has consistently given priority to the development of agriculture and rural areas, actively responding to the overall deployment of rural revitalization. Thus, this paper analyzed the spatio-temporal coupling characteristics and driving factors of cultivated land and rural population change in Guangdong Province at the county level in the past 20 years based on relevant data. This paper identified the coordination of the changes in agricultural production factors in the rural regional system, and revealed the transformation process of the rural “man–land” relationship so as to provide a certain reference for the scientific decision-making of land resource management, rural revitalization and new rural construction in similar regions.
2. Study Area, Data and Methodology
2.1. Study Area
Guangdong Province (20°09′ N–25°31′ N, 109°45′ E–117°20′ E) is located in the southeastern coastal area of mainland China, bordering Fujian in the east, Jiangxi and Hunan in the north, Guangxi in the west, and the South China Sea in the south (Figure 1). The Pearl River Estuary borders the Hong Kong and Macao Special Administrative Regions in the east and west, and Leizhou Peninsula in the southwest faces Hainan Province across the Qiongzhou Strait. It is an East Asian monsoon region, with sub-tropical, sub-tropical and tropical climates, respectively, from north to south. The average annual temperature of the province is about 23 °C, and the average annual precipitation is 1777 mm. The rainy and hot periods are conducive to the growth of crops, and the area is rich in natural resources. The province is divided into the Pearl River Delta (Guangzhou, Shenzhen, Zhuhai, Foshan, Huizhou, Dongguan, Zhongshan, Jiangmen, Zhaoqing), eastern Guangdong (Shantou, Shanwei, Chaozhou, Jieyang), western Guangdong (Yangjiang, Zhanjiang, Maoming) and northern Guangdong (Shaoguan, Heyuan, Meizhou, Qingyuan, Yunfu), with 21 prefecture levels (including 2 deputy provincial city). It has 122 county-level administrative districts (65 municipal districts, 20 county-level cities, 34 counties, and 3 autonomous counties), covering a land area of 179,800 km2. By 2020, the GDP of the province was 11.08 billion yuan, among which the primary industry contributed 6.4% to the GDP growth. The permanent population is 126.24 million, of which 32.633 million are rural residents, accounting for 25.85%. The per capita disposable income of rural residents exceeds 20,000 yuan (20,143.43 yuan), and the urban–rural income ratio has fallen below 2.5:1.
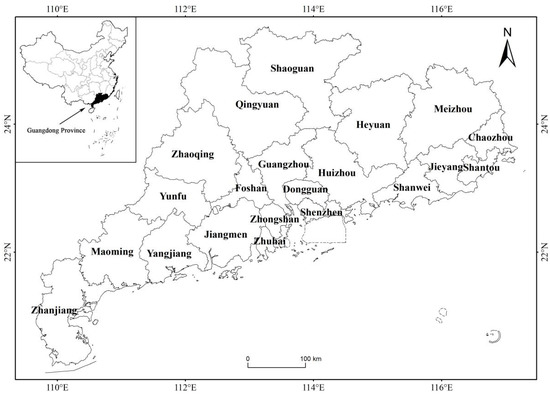
Figure 1.
Guangdong Province and its location in China.
2.2. Data Sources and Pre-Processing
Cultivated land data based on China’s development surface coverage data with a spatial resolution of 30 m from around the world were obtained from the GlobeLand30 global public geographic information platform (http://www.globallandcover.com/ accessed on 20 January 2022). Land use data for 2000, 2010 and 2020 are currently available for download on the platform. GlobeLand30 data include 10 land cover classes, namely cultivated land, forest, grassland, shrubland, wetland, water bodies, tundra, artificial surface, bare land, permanent snow and ice [45]. The total accuracy of GlobeLand30 2010 data is 83.50% and the Kappa coefficient is 0.78. The total accuracy of GlobeLand30 2020 data is 85.72% and the Kappa coefficient is 0.82, which meets the needs of cultivated land analysis. Based on the original data of 53 sub-frames in China and the ArcGIS platform, the land cover data of China region were obtained through projection transformation, stitching and clipping. The data had a 30 m resolution, and the coordinate system was Albers equal area projection. Then, according to the administrative boundary vector data of Guangdong Province, the land use and cover data in 2000, 2010 and 2020 were cropped and the cultivated land data were extracted.
Rural population data mainly come from statistical yearbooks and censuses. Rural population generally refers to the agricultural household population based on household registration or the rural resident population based on residence [43]. In view of the fact that the difference between urban and rural household registration status tends to fade [44], and in order to scientifically reflect the change process of the rural “man–land” relationship, rural population in this paper refers to the rural resident population in particular. The rural population data of Guangdong Province in 2000, 2010 and 2020 came from Guangdong Rural Statistical Almanac 2001, Guangdong Rural Statistical Almanac 2011 and Guangdong Rural Statistical Almanac 2021, and were interpolated by county (city, district). This paper took Guangdong Province as the study area. Due to the particularity of land ownership and the adjustment of administrative divisions in some regions, the relevant data such as rural resident population and cultivated land area of the central urban area in Guangzhou (Yuexiu district, Liwan district, Zhuhai, Tianhe district), Shenzhen, Jinwan district in Zhuhai, Nan’ao county in Shantou were missing, so these regions were not included in the scope of this paper. The county-level administrative units of the study area were based on the current county-level administrative division of Guangdong Province. In addition to the excluded regions, there were 109 study units in total. The rural population data of the changed administrative divisions were verified and adjusted accordingly, and the basic data such as rural population and cultivated land area of 109 study units were finally obtained. Using the spatial technology tool of ArcGIS 10.6, this paper analyzed the characteristics of rural population and cultivated land changes and their spatio-temporal coupling relationship.
2.3. Research Methods
2.3.1. Measurement of Rural Population and Cultivated Land Changes
Quantitative change analysis generally reflects the increase or decrease trend of variables by calculating the absolute change value, relative change value, annual change value or ratio [5]. In view of the long research time span and the rationality of the relative change in two variables, this paper adopted a certain period of annual change rate of rural population (Formula (1)), annual change rate of cultivated land area (Formula (2)) and annual change rate of per capita cultivated land area (Formula (3)) to measure the rural population change and cultivated land change. The formulas are as follows:
In the formula, PCRit, FCRit and PFCRit represent the annual average change rate of rural population, cultivated land area and per capita cultivated land area in the first research unit t year, respectively. P1i and P(1+t)i represent the rural population of the ith research unit at the beginning and end of the study, respectively. F1i and F(1+t)i represent cultivated land area of the ith research unit at the beginning and end of the study, respectively. PF1i and PF(1+t)i represent the per capita cultivated land area of the ith research unit at the beginning and end of the study, respectively.
2.3.2. Measurement of Coupling Relationship between Rural Population Change and Cultivated Land Changes
The elastic coefficient is used to measure the relative change in another index caused by the change in one index by calculating the ratio of the increase or decrease rate of two indexes, and to investigate the quantitative relationship, change characteristics and rules between two indexes. Based on the elasticity coefficient model of rural population and cultivated land change [5] (Formula (4)), this paper analyzed the relative trend of the two changes by referring to the labor–farmland elastic coefficient (LFEC) [1] and the elasticity coefficient of rural residential land [43,44], and reveals the spatio-temporal coupling characteristics of rural population and cultivated land change in Guangdong Province.
In the formula, ECit is the elastic coefficient of rural population and cultivated land change in the year t of the ith research unit, PCRit is the annual average change rate of rural population in the year t of the ith research unit, and FCRit is the annual average change rate of cultivated land area in the year t of the ith research unit.
Under the current level of agricultural productivity, accelerating the transfer of the rural population and promoting the moderate scale operation of cultivated land are important ways to coordinate the rural “man–land” relationship, which help to increase capita cultivated land area, improve agricultural production efficiency, increase farmers’ income and promote rural revitalization. This paper defines the positive process of rural population and cultivated land as a coordinated development type; otherwise, the situation is defined as a maladjusted development type. According to the increase or decrease in PCR, FCR, PFCR and EC indicators, the coupling relationship between the rural population and cultivated land change was divided into 8 types (Figure 2). Among them, type G and type H were both maladjusted development types with increasing rural population and decreasing cultivated land, but the absolute value of PCR in type G was smaller than that of FCR, while the absolute value of PCR in type H was larger than that of FCR. The same is true for type C and type D. To be specific: ① if the EC value is located in type A, then PCR and FCR are both positive and PCR is greater than FCR—that is, the rural population and cultivated land area both increase, but the increase rate of rural population is faster, which is a maladjusted development type with the decrease in per capita cultivated land area. ② If the EC value is located in type D, PCR decreases and FCR increases, and PCR decreases faster, which is a coordinated development type with the increase in per capita cultivated land area. ③ The same goes for the other types.
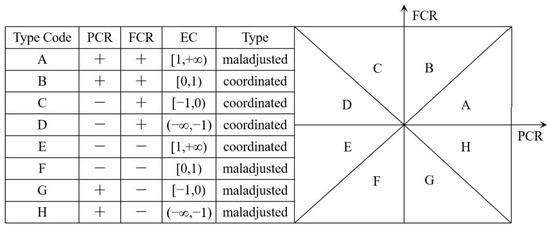
Figure 2.
Schematic diagram of coupling relationship types between rural population and cultivated land change.
2.3.3. Hotspot Analysis
A hotspot analysis (Getid-Ord Gi spatial statistics) tool in ArcGIS cluster analysis was used to identify hotspots with statistical significance. In this paper, the average annual change rate of rural population, cultivated land area and per capita cultivated land area in a given period were used as analysis variables. The spatial correlation index was calculated, and the natural breaks were used to calculate the statistics. The significant areas were divided into hot spots, sub-hot spots, sub-cold spots and cold spots.
3. Results
3.1. Spatio-Temporal Characteristics of Rural Population Change
Regarding the temporal characteristics of rural population change, it can be seen from Figure 3 that, from 2000 to 2020, the rural population of Guangdong Province showed an overall trend from rapid growth to steady growth, with a total increase of 8.628 million people, and a growth rate of 14.47%. From 2000 to 2010, the rural population increased rapidly, with an average annual increase of 818,100 people and an average annual growth rate of 1.37%. From 2010 to 2020, the rural population increased steadily, with an average annual of 44,700 people and an average annual growth rate of 0.07%.
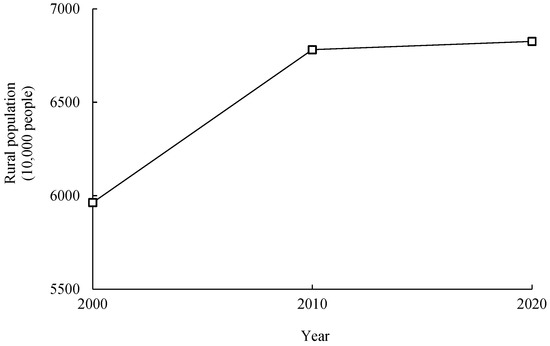
Figure 3.
Change trend of rural population in Guangdong Province between 2000 and 2020.
Regarding the spatial pattern of rural population change, it can be seen from Figure 4 that from 2000 to 2010, the rural population of all counties in Guangdong Province was mainly growth-oriented, and the high-speed growth areas were mainly distributed in strips in the central and southeastern regions, concentrated in the counties of Guangzhou, Zhuhai, Foshan, Zhongshan, Huizhou, Jiangmen, Jieyang, Shaoguan, Qingyuan and other cities, and among which Chaonan district, Nansha district, Huicheng district, Suixi county, Longhu district, Pengjiang district and Zhongshan had the fastest growth, with an average annual growth rate of more than 10%. Medium-speed and low-speed growth areas were widely distributed across the whole province. The rural population reduction areas were scattered in Zhaoqing, Jiangmen, Maoming, Meizhou, Shaoguan and Qingyuan. From 2010 to 2020, the number of rural population reduction areas and growth areas was basically the same, and there were slightly more reduction areas, mainly in the western part of the Pearl River Delta, eastern Guangdong, northern and southern Guangdong, and counties in northern Guangdong. They were basically low-speed reduction areas with an annual decrease within 1%. The rural population growth areas were mainly distributed in the central, eastern and southern counties of the Pearl River Delta, and in the central counties of western Guangdong in a strip-like distribution, which were basically low-speed growth areas with an average annual growth below 1%.
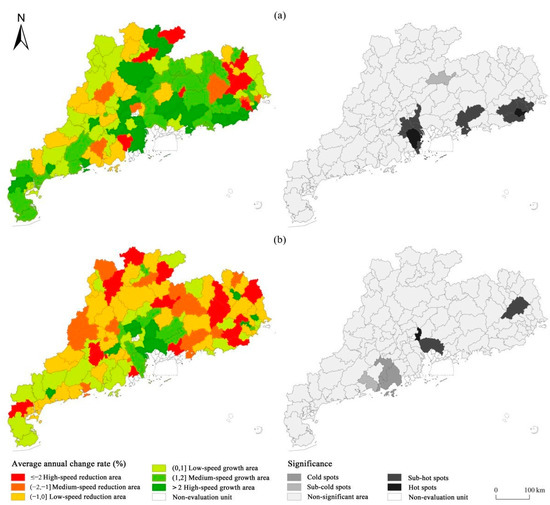
Figure 4.
(a) 2000–2010; (b) 2010–2020. Annual average change rate of rural population and the spatio-temporal pattern of hot spots in Guangdong Province between 2000 and 2020.
3.2. Spatio-Temporal Characteristics of Cultivated Land Area Change
Regarding the temporal characteristics of cultivated land area change, it can be seen from Figure 5 that from 2000 to 2020, the cultivated land area in Guangdong Province showed a trend of slow decrease at first and then rapid decrease. From 2000 to 2010, the cultivated land area decreased slowly, with an average annual decrease of 4524.17 hm2 (0.09%). From 2010 to 2020, the cultivated land area showed a rapid decrease trend, with an average annual decrease of 55,058.47 hm2 (1.09%).
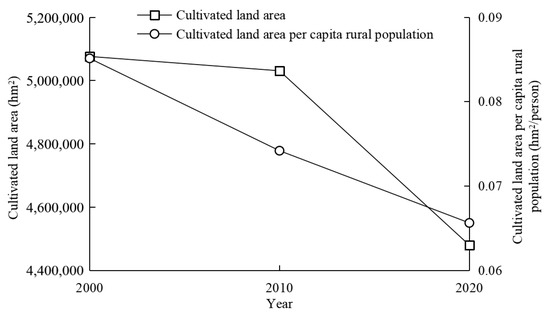
Figure 5.
Change trend of cultivated land area and cultivated land area per capita rural population in Guangdong Province between 2000 and 2020.
Regarding the spatial characteristics of cultivated land area change, it can be seen from Figure 6 that the annual average change amount of cultivated land in Guangdong Province from 2000 to 2010 has significant regional differences. The low-speed growth areas were the main areas, followed by the low-speed decrease areas, and the medium-speed and high-speed change areas were few in number. The low-speed growth areas were mainly distributed in Shantou, Shanwei, Chaozhou, Jieyang, Zhanjiang, Maoming, Meizhou, Heyuan, Shaoguan and the eastern counties of Qingyuan. The fast growth areas included Dinghu district and Duanzhou district of Zhaoqing, with annual growth rates of 3.47% and 2.88%, respectively. Reduction areas were mainly concentrated in the central county of Guangdong Province, and among them, the low-speed reduction areas mainly had a patchy distribution in Guangzhou, Huizhou, Zhaoqing, Yangjiang, Yunfu and the central counties of Qingyuan. Dongguan, Nansha district, Sihui city, Sanshui district, Nanhai district and Xinhui district were the medium-speed reduction areas, while Zhongshan, Xiangzhou district, Doumen district and Huiyang district were the high-speed reduction areas. From 2010 to 2020, 97.25% of the counties in Guangdong Province were cultivated land reduction areas, and low-speed growth areas were the most common, mainly being distributed in the east, west and north of Guangdong Province. The medium-speed reduction areas were scattered throughout the province, and the high-speed reduction areas were mainly distributed in the south of the Pearl River Delta. The rest were cultivated land growth areas, among which Dabu county and Qingxin district were low-speed growth areas, while Shunde district was a high-speed growth area.
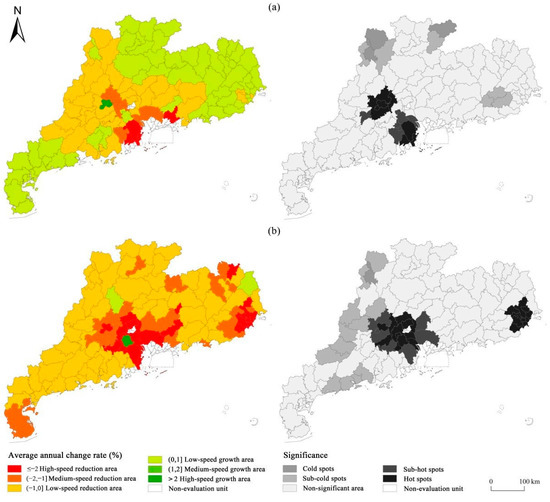
Figure 6.
(a) 2000–2010; (b) 2010–2020. The annual average change rate of cultivated land area and the spatio-temporal pattern of hot spots in Guangdong Province between 2000 and 2020.
3.3. Spatio-Temporal Characteristics of the Change in per Capita Cultivated Land Area
Regarding the temporal characteristics of the change in per capita cultivated land area, it can be seen from Figure 5 that from 2000 to 2020, the per capita cultivated land area in Guangdong Province showed a trend of continuous reduction, decreasing from 0.0851 hm2/person in 2000 to 0.0742 hm2/person in 2010, with an average annual decline of 1.28%. From 2010 to 2020, the per capita cultivated land area continued to decrease. However, it reduced from 0.0742 hm2/person in 2010 to 0.0656 hm2/person in 2020, with an annual decrease of 1.15%.
Regarding the spatial characteristics of the change in per capita cultivated land area, it can be seen from Figure 7 that the per capita cultivated land area decreased in 70.64% of counties from 2000 to 2010. The high-speed reduction areas were mainly concentrated in the eastern counties of the Pearl River Delta. The medium-speed and low-speed reduction areas were mainly scattered in some counties of Zhanjiang, Yangjiang, Qingyuan, Heyuan and Jieyang. Growth areas were mainly distributed in Jiangmen, Maoming, Meizhou and some counties of Shaoguan. From 2010 to 2020, the per capita cultivated land area decreased in 65.14% of counties. The high-speed reduction areas were mainly concentrated in the central and eastern counties of the Pearl River Delta and the Shantou and Chaozhou counties. The medium-speed and low-speed reduction areas were mainly distributed in western Guangdong, and sporadically in eastern Guangdong and northern Guangdong. The growth areas were mainly distributed in eastern Guangdong, northern Guangdong and western counties of the Pearl River Delta.
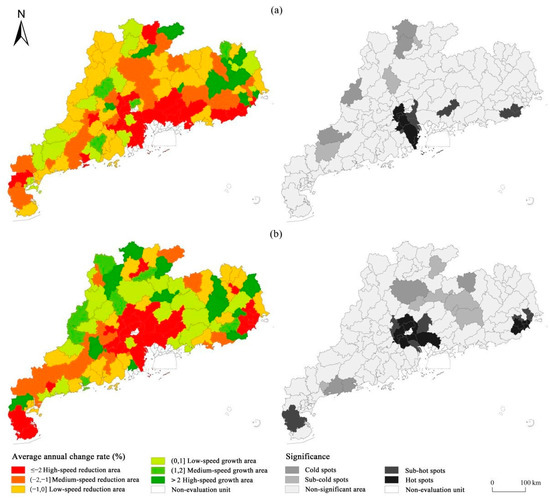
Figure 7.
(a) 2000–2010; (b) 2010–2020. Annual average change rate of per capita cultivated land area and its spatio-temporal pattern of hot spots in Guangdong Province during 2000–2020.
3.4. Coupling Relationship between Rural Population and Cultivated Land Change
Regarding the temporal coupling relationship between rural population and cultivated land change, from 2000 to 2020, the coupling types of rural population and cultivated land change in Guangdong Province were mainly maladjusted, and gradually shifted to coordinated (Table 1). From 2000 to 2010, there were 77 counties with maladjusted development, accounting for 70.64% of the total, mainly belonging to type A and type H. There were 32 counties with coordinated development, accounting for 29.36% of the total, mainly belonging to type B, type D and type E. From 2010 to 2020, the number of counties in Guangdong Province with the maladjusted coupling of rural population and cultivated land change decreased, and the maladjusted development types mainly included type F, with a decrease in both rural population and cultivated land, and type G and type H, with an increase in rural population and a decrease in cultivated land. There were 38 counties with a coordinated development type, accounting for 34.86% of the total, and the coordinated development types were dominated by type E, with a decrease in both rural population and cultivated land.

Table 1.
Classification statistics of the coupling relationship between rural population and cultivated land change in Guangdong Province between 2000 and 2020.
We performed a comparison of the spatio-temporal coupling relationship between rural population and cultivated land change. Guangdong Province can be divided into four regions: Pearl River Delta, eastern Guangdong, western Guangdong and northern Guangdong. Within the research area of this paper, there were 36 county units in Pearl River Delta, accounting for 33.03% of the total number of counties in the research area. There were 18 county units in eastern Guangdong, accounting for 16.51%, and 23 county units in western Guangdong, accounting for 21.10%. There were 32 county units in northern Guangdong, accounting for 29.36%. As can be seen in Figure 8, the development of coupling relationship between rural population and cultivated land change in each region of Guangdong Province tended to be consistent, but the proportion of each coupling type differs among the four regions. Among the counties in the Pearl River Delta, 77.78% of the rural population and cultivated land changes were coupled with the maladjusted development type H, while the coordinated development types were mainly type E and type B. From 2010 to 2020, the number of counties with maladjusted development decreased, mainly with the maladjusted development type G with an increase in rural population and a decrease in cultivated land, while the number of counties with a coordinated development type increased, accounting for 25%, mainly involving the coordinated development type E with the a decrease in both the rural population and cultivated land. In the counties of eastern Guangdong, the coupling types of rural population and cultivated land change were mainly maladjusted development types, accounting for 77.78% of the total from 2000 to 2020. The proportion of coordinated development types and maladjusted development types in the counties were basically unchanged, but the coupling types changed. From 2000 to 2010, the coupling types were mainly maladjusted development type A with an increase in both rural population and cultivated land. The coordinated development types were mainly type B, type D and type E. From 2010 to 2020, the types of maladjusted development mainly included type G, and the coordinated development types were mainly type E with a decrease in both rural population and cultivated land. In the counties of western Guangdong, the coupling types of rural population and cultivated land change were dominated by the maladjusted development types, accounting for 65.22% of the total from 2000 to 2020. The proportions of the coordinated development types and the maladjusted development types were basically unchanged. From 2000 to 2010, the maladjusted development types were dominated by type H with an increase in rural population and a decrease in cultivated land. The coordinated development types were mainly type B with an increase in both rural population and cultivated land. From 2010 to 2020, the maladjusted development types were mainly type F and type H, while the coordinated development types were mainly type E. In the counties of northern Guangdong, 62.5% of the rural population and cultivated land change coupling maladjusted development types were type A, while the coordinated development types were mainly type D. From 2010 to 2020, the proportion of the counties with coordinated development was 53.13%, and most of the counties with coordinated development were type E, while the number of the counties with maladjusted development was reduced, and most of the counties with maladjusted development were type F. By comparing the coupling relationship between rural population and cultivated land change in four regions of Guangdong Province, the coordination of “man–land” change was higher in northern Guangdong, followed by western Guangdong, and the coordination of the coupling relationship between rural population and cultivated land change in Pearl River Delta and eastern Guangdong needed to be improved.
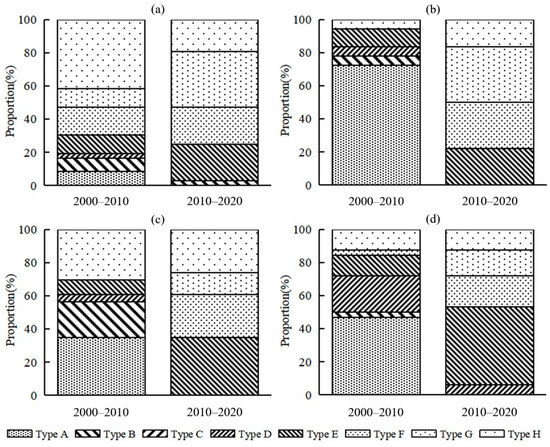
Figure 8.
(a) the Pearl River Delta; (b) Eastern Guangdong; (c) Western Guangdong; (d) Northern Guangdong. Spatio-temporal coupling comparison of rural population and cultivated land change in Guangdong Province between 2000 and 2020.
3.5. Driving Factors of the Coupling Relationship between Rural Population and Cultivated Land Change
The coupling relationship between rural population and cultivated land change in Guangdong Province is affected by the natural environment, social economy and policy.
In terms of natural factors, topography is one of the main factors restricting the macro pattern of rural population and cultivated land change. The Pearl River Delta region is dominated by plains and hills, with relatively gentle terrain fluctuations. It is also an area where human activities and land use change are relatively drastic and there are provincial capitals and special economic zones with an unbalanced “man–land” relationship, including Guangzhou and Shenzhen. In the mountainous area of northern Guangdong, due to the limitations of the terrain, there are relatively few areas with drastic land use changes, and the coupling of the rural population and cultivated land changes is more coordinated.
Regional difference in economic development is an important factor affecting the coupling relationship between rural population and cultivated land, but is not the decisive force for the imbalance of the coupling relationship [44]. With the difference in regional economic development speed and level, the reduction degree of rural population and cultivated land area gradually weakens from economically developed areas to economically underdeveloped areas. In other words, a higher level of economic development in the area does not mean that the coupling development of rural population and cultivated land is more coordinated.
In terms of policy, the regional inclination in government decision-making behavior may lead to a regional imbalance in the coupling relationship between the rural population and cultivated land to a certain extent. Furthermore, urban and rural planning involves different subjects of interest, and the processes of government departments usually involve the use of project funds or land indexes in the dominant subordinate departments, which means that the basic-level government may adopt the practice of signing “small property rights houses” and renting out agricultural land at will in order to obtain land use indexes. This relatively imbalanced resource allocation pattern between urban and rural areas has worsened the problems of unbalanced urban–rural development and rural decline to some extent [46,47,48]. On the other hand, the government constantly improves the cultivated land protection policy, strictly controls the conversion of cultivated land to non-cultivated land, and implements the compensation system of occupied cultivated land and the basic farmland protection system, which plays a positive role in coordinating the coupling relationship between rural population and cultivated land changes.
4. Discussion
4.1. Changes in Rural Population and Cultivated Land Use in Guangdong Province
The results of this study are similar to the research conclusions of Liu et al. [49] and Liu et al. [50] on cultivated land in Guangdong Province in recent years, which indicate that the rural population and cultivated land use in Guangdong Province have undergone transformation. From 2000 to 2010, the economy and population of Guangdong Province developed rapidly. Although relevant cultivated land protection policies were promulgated and implemented, the loss of cultivated land could be reduced to a certain extent, but it still could not offset the growing contradiction between the supply and demand of cultivated land and construction land, and the cultivated land in Guangdong Province was further reduced, especially in the plains area of the Pearl River Delta. From 2010 to 2020, the supervision and review mechanism of farmland protection, appropriation and compensation in Guangdong Province was continuously improved. Coupled with the deepening exploration and innovation of the “Three Old” Transformation Planning in Guangdong Province [51], the phenomenon of a large reduction in the amount of cultivated land has been greatly alleviated. Although the rural population in Guangdong Province continued to increase and the cultivated land area continued to decrease, the coupling relationship between them gradually changed from a maladjusted type to a coordinated development type.
4.2. Recommendations
According to the analysis above, the per capita cultivated land area of Guangdong Province is generally small, and the coordination between the rural population and cultivated land is insufficient at present. Different regions should explore the basic guidance of optimizing the relationship between rural population and cultivated land in the process of rapid urbanization by combining the factors such as the coupling type characteristics of rural population and cultivated land changes, natural and geographical conditions and social and economic development, and promote rural revitalization and integrated urban and rural development.
Cultivated land is the important basis for food production and the bottom line of land management. The GDP of Guangdong Province has ranked first in China for more than 30 consecutive years. The land demand for various construction projects has been in a state of vigorous growth for a long time, which inevitably occupies a certain area of cultivated land. For the regions with low coordination of the coupling relationship, the governments and relevant departments should stick to the red line of cultivated land protection, curb the illegal occupation of cultivated land and guarantee the legitimate demand for land. At the same time, governments and relevant departments should promote the reform of agricultural production modes and carry out targeted land consolidation in order to make intensive use of cultivated land.
Social and economic development and natural conditions have an important influence on the coordinated development of the rural population and cultivated land. For the regions with high coordination of the coupling relationship, the optimization and regulation of cultivated land transformation should start with improving the livelihood of farmers. Governments and relevant departments should continue to strictly protect cultivated land as well as formulate a reasonable policy of “caring for farmers and supporting rural areas”, taking into account the differences in natural geographical conditions and social and economic development.
In addition, Pearl River Delta, eastern Guangdong, western Guangdong and northern Guangdong should improve the cooperation mechanism for rural revitalization, to promote industrial co-construction, resource sharing, facility connectivity, market integration, personnel exchange, scientific and technological support and the construction of an integrated market.
4.3. Deficiencies and Prospects
This paper analyzes the spatio-temporal characteristics and coupling relationship between rural population and cultivated land change at the county level in Guangdong Province from 2000 to 2020, which enriches the empirical research on the role of the “human–land” relationship in rural areas to a certain extent. However, rural development is a complex scientific issue. There are still certain limitations in the research to be further discussed.
The coupling relationship between rural population and cultivated land change needs to be further explored. In this paper, the spatial and temporal coupling relationship between rural population and cultivated land is constructed based on the change characteristics of rural population and cultivated land. The changes in rural population’s quality of life, lifestyle, quality, function of cultivated land and other hidden aspects are worth thinking about and studying deeply, with practical significance for the improvement of rural residents’ living standards and the optimization of cultivated land quality function.
The driving factors of the coupling between rural population and farmland change need to be further explored. This paper only studies the most intuitive characteristics of the coupling relationship between rural population and cultivated land area change, and qualitatively analyzes the driving factors of the coupling relationship between them. With the deepening of the research on rural factors, we should comprehensively determine the coupling relationship and the acting process of the changes between cultivated land (as the carrier of land use) and rural population (as the subject) from a systematic perspective. In future research, we need to enrich the evaluation methods and research models. We should use different analysis methods to study and measure the coordinated development of rural elements, compare the advantages and disadvantages of different methods, and select the optimal method to make the evaluation results more scientific. On the basis of abundant physical and socio-economic data, the driving factors of the coupling relationship between rural population and farmland change and its effect on rural system development deserve further study.
5. Conclusions
In the past 20 years, the rural population at the county level in Guangdong Province showed a trend of continuous growth, while the cultivated land area and the per capita cultivated land area of rural population showed a trend of continuous decline. The rural population grew rapidly from 2000 to 2010 and steadily from 2010 to 2020. The cultivated land area decreased slowly from 2000 to 2010 and rapidly from 2010 to 2020. The per capita cultivated land area of rural population decreased from 0.0851 hm2/person in 2000 to 0.0742 hm2/person in 2010, with an average annual decrease of 1.28%. From 2010 to 2020, the per capita cultivated land area decreased to 0.0656 hm2/person, with an average annual decrease of 1.15%. The spatial changes of rural population, cultivated land area and per capita cultivated land area at the county level were clearly different in each time period.
This paper divided the coupling types through the change rate of rural population, change rate of cultivated land area, per capita cultivated land area and elasticity coefficient of rural population and cultivated land change, and then compared the counties in Guangdong Province. In the last 20 years, the coupling types of rural population and cultivated land change in Guangdong Province showed a trend of maladjusted development and gradually changed to coordinated development. From 2000 to 2010, the proportion of maladjusted development counties was 62.5%, and they mainly belonged to type A. From 2010 to 2020, counties with coordinated development accounted for 53.13% of the total, and mainly belonged to type E, while the number of maladjusted counties decreased, mainly belonging to type F. At the county scale, the coupling trend of rural population and cultivated land change was basically the same in each region of Guangdong Province, but the proportion of each coupling type in the four regions was different. The proportions of coordinated development types in northern Guangdong were higher than that in Pearl River Delta, eastern Guangdong and western Guangdong.
The coordination of the spatio-temporal coupling relationship between the rural population and cultivated land is influenced by the natural environment, social and economic development, and policy. The action mechanism of different elements is clearly different. Topography is one of the main factors restricting the macro pattern of rural population and cultivated land change. The regional economic development level and government decision-making behavior also have an important impact on the coordination of the rural “man–land” relationship.
Author Contributions
Conceptualization, P.-F.M. and D.-F.W.; methodology, P.-F.M. and D.-F.W.; software, P.-F.M. and T.L.; validation, T.L., Z.-J.W., Z.-C.L., Y.-X.L., Y.-C.Z. and H.-M.L.; formal analysis, P.-F.M.; resources, P.-F.M., T.L. and Z.-J.W.; data curation, P.-F.M., T.L., Z.-J.W., Z.-C.L., Y.-X.L., Y.-C.Z. and H.-M.L.; writing—original draft preparation, P.-F.M.; writing—review and editing, D.-F.W., T.L., Z.-J.W., Z.-C.L., Y.-X.L., Y.-C.Z. and H.-M.L.; visualization, P.-F.M.; supervision, D.-F.W.; project administration, D.-F.W. All authors have read and agreed to the published version of the manuscript.
Funding
This work was supported by Guangdong Planning Office of Philosophy and Social Science under the project called “Disciplinary Co-projects for 2020 under the Thirteenth Five-Year Plan” (No. GD20XYJ32); 2022 Guangdong Province Ordinary University characteristic innovation category Project (Humanities and Social Sciences category) (2022WTSCX087); 2022 Tertiary Education Scientific research project of Guangzhou Municipal Education Bureau (No. 202235269); The Department of Education of Guangdong Province, under the “2020 Research Project under the Thirteenth Five—Year Plan, Special Research area on the Construction of Guangdong—Hong Kong—Macao Greater Bay Area” and “The Silk Road” (No. 2020GXJK199); 2021 Curriculum Ideological and political education construction project “land use planning” of Guangdong Institute of teaching management of colleges and universities (No. x-kcsz2021158); Guangzhou University Project “On-campus research projects (research category)” (No. YJ2021007); 2022 Guangzhou Higher Education teaching quality and teaching reform project (No. 2022JXTD001).
Institutional Review Board Statement
Not applicable.
Informed Consent Statement
Not applicable.
Data Availability Statement
Not applicable.
Acknowledgments
The authors would like to acknowledge Wu Dafang, Guangzhou University, for valuable discussion and assistance in interpreting the significance of the results of this study. We also thank the editor and reviewers for their valuable comments and suggestions.
Conflicts of Interest
The authors declare no conflict of interest.
References
- Liu, Y.; Li, Y. Spatio-temporal Coupling Relationship between Cultivated Land and Agricultural Labor Changes at County Level in China. Resour. Sci. 2010, 65, 1602–1612. [Google Scholar]
- United Nations. Transforming Our World: The 2030 Agenda for Sustainable Development; United Nations: New York, NY, USA, 2015. [Google Scholar]
- Zhang, Z. Sustainable Land Use Goals, Challenges and Countermeasures in China for SDGs. China Land Sci. 2019, 33, 48–55. [Google Scholar]
- Opinions of the CPC Central Committee and the State Council on Comprehensively Promoting the Key Work of Rural Revitalization in 2002. The People’s Daily, 23 February 2022.
- Huang, J.; Li, Y.; Xu, Q.; Shu, T.; Wang, Q.; Wang, M. Spatio-temporal Coupling Relationship between Rural Population and Cultivated Land Change in Karst Trough Valley Area. Res. Soil Water Conserv. 2021, 28, 281–290. [Google Scholar]
- Zhang, G.; Liu, J.; Zhang, Z. Spatial-temporal Changes of Cropland in China for the Past 10 Years Based on Remote Sensing. Acta Geogr. Sin. 2003, 58, 323–332. [Google Scholar]
- Wu, D.; Liu, Y.; Dong, Y.; Liu, H.; Ni, S. Analysis on the Spatial-temporal Changes of Cultivated Land and Their Driving Forces in Zhuhai. Trop. Geogr. 2009, 29, 472–476, 482. [Google Scholar]
- Hu, Q.; Wu, W.; Xiang, M.; Chen, D.; Long, Y.; Song, Q.; Liu, Y.; Lu, M.; Yu, Q. Spatio-temporal Changes in Global Cultivated Land over 2000–2010. Sci. Agric. Sin. 2018, 51, 1091–1105. [Google Scholar]
- Li, X. Change of Arable Land Area in China during the Past 20 Years and its Policy Implications. J. Nat. Res. 1999, 14, 329–333. [Google Scholar]
- Wang, W.; Cao, Y.; Su, R.; Song, L.; Zhuang, Y.; Zhou, W. Driving Forces of Cultivated Land Change in China. Chin. J. Agric. Res. Reg. Plan. 2020, 41, 21–30. [Google Scholar]
- Li, D.; Zhou, J.; Zhan, D. Spatial and Temporal Changes and Driving Factors of Cultivated Land in Heilongjiang Province. Sci. Geogr. Sin. 2021, 4, 1266–1275. [Google Scholar]
- Verburg, P.; Steeg, J.; Veldkamp, A.; Willemen, L. From Land Cover Change to Land Function Dynamics: A Major Challenge to Improve Land Characterization. J. Environ. Manag. 2009, 90, 1327–1335. [Google Scholar] [CrossRef] [PubMed]
- Song, X.; Ouyang, Z. Connotation of Multifunctional Cultivated Land and its Implications for Cultivated Land Protection. Prog. Geogr. 2012, 3, 859–868. [Google Scholar]
- Wu, D.; Liu, Y.; Zhang, X.; He, Y. Analysis of Cultivated Land Function Evaluation in Guangzhou City from 1990 to 2014. Chin. J. Agric. Resour. Reg. Plan. 2019, 40, 64–72. [Google Scholar]
- Grainger, A. National Land Use Morphology: Patterns and Possibilities. Geography 1995, 80, 235–245. [Google Scholar]
- Long, H.; Li, X. Cultivated-land Transition and Land Consolidation and Reclamation in China: Research Progress and Frame. Prog. Geogr. 2006, 25, 67–76. [Google Scholar]
- Song, X.; Wu, Z.; Ouyang, Y. Route of Cultivated Land Transition Research. Geogr. Res. 2014, 33, 403–413. [Google Scholar]
- Chen, Y.; Li, X. Structural Change of Agricultural Land Use Intensity and its Regional Disparity in China. Acta Geogr. Sin. 2009, 64, 469–478. [Google Scholar] [CrossRef]
- Ma, C.; Liu, L. Cultivated Land Use Intensity in Regions with Different Economic Development Levels. Res. Sci. 2019, 41, 2296–2306. [Google Scholar] [CrossRef]
- Wang, G.; Liu, Y.; Chen, Y. Dynamic Trends and Driving Forces of Land-use Intensification in the Cultivated Land of China. Acta Geogr. Sin. 2014, 69, 907–915. [Google Scholar] [CrossRef]
- Liu, Y.; Liu, Y.; Zhang, Y. Prediction of Gross Arable Land Based on Grey-Markov Model. Geomat. Inf. Sci. Wuhan Univ. 2004, 29, 575–579, 596. [Google Scholar]
- Li, L.; Wu, D.; Wang, F.; Liu, Y.; Liu, Y.; Qian, L. Prediction and Trade-off Analysis of Ecosystem Service Value in the Rapidly Urbanizing Foshan City of China: A Case Study. Acta Ecol. Sin. 2020, 40, 9023–9036. [Google Scholar]
- Yu, H.; Zeng, S.; Wang, Q.; Dai, J.; Bian, Z.; Chen, F. Forecast on China’s Cultivated Land Protection Baseline in the New Era by Multi-scenario Simulations. Res. Sci. 2021, 43, 1222–1233. [Google Scholar]
- Zhang, Y.; Feng, Y.; Wang, F.; Chen, Z.; Li, X. Spatiotemporal Differentiation and Driving Mechanism of Cultivated Land Non- grain Conversion in Guangdong Province. Res. Sci. 2022, 4, 480–493. [Google Scholar] [CrossRef]
- Padoch, C.; Sunderland, T. Managing Landscapes for Greater Food Security and Improved Livelihoods. Unasylva 2013, 64, 3–13. [Google Scholar]
- Li, Y.; Zhao, B.; Huang, A.; Xiong, B.; Song, C. Characteristics and Driving Forces of Non-Grain Production of Cultivated Land from the Perspective of Food Security. Sustainability 2021, 13, 14047. [Google Scholar] [CrossRef]
- Cai, Y. The Mechanisms of Cropland Conservation in Chinese Rural Transformation. Sci. Geogr. Sin. 2001, 21, 1–6. [Google Scholar]
- Baylis, K.; Peplow, S.; Rausser, G.; Simon, L. Agri-environmental Policies in the EU and United States: A Comparison. Ecol. Econ. 2007, 65, 753–764. [Google Scholar] [CrossRef]
- Zhou, W.; Shen, L.; Shi, J.; Ma, P. Research on Cultivated Land Protection Compensation Based on compulsory Cultivated Land. J. Arid Land Res. Environ. 2022, 36, 1–9. [Google Scholar]
- Li, S.; Li, X. Economic Characteristics and the Mechanism of Cultivated Land Marginalization in Mountainous Area of China. Acta Geogr. Sin. 2018, 73, 803–817. [Google Scholar]
- Feng, Z.; Li, F.; Yang, Y.; Li, P. The Past, Present, and Future of Population Geographyin China: Progress, Challenges and Opportunities. J. Geogr. Sci. 2017, 27, 925–942. [Google Scholar] [CrossRef]
- Qi, X.; Zhu, Y.; Zhou, Y. A “Double-pull” Model of Rural Labor Migration and its in Situ Urbanization Effect: Cases Studies of Three Coastal Area in Southeast China. Sci. Geogr. Sin. 2012, 32, 25–30. [Google Scholar]
- Zhou, Z. The Hollow-out of China’s Rural Population and its Challenges. Popul. Res. 2008, 32, 45–52. [Google Scholar] [CrossRef]
- Liu, Y.; Liu, Y.; Zhai, R. Geographical Research and Optimizing Practice of Rural Hollowing in China. Acta Geogr. Sin. 2009, 64, 1193–1202. [Google Scholar]
- Jiang, A.; Liu, C. The Role of Rural Elites in Traditional Villages Under the Background of “over-thinning” of Rural Area: A Case Study of E Village in Shengjiaba Township, Southwest Hubei Province. J. South Cent. Univ. Natl. (Humanit. Soc. Sci. Ed.) 2019, 39, 33–37. [Google Scholar]
- Long, D.; Li, T.; Miao, Y.; Liu, C.; Li, X.; Meng, H. Spatio-temporal Characteristics and Impacting Factors of Non-agriculturalization of China’s Rural Population. Prog. Geogr. 2014, 33, 517–530. [Google Scholar]
- Chen, X.; Wu, C.; Fang, M. Coordination of Industry, Population and Land Deagriculturalization during the Rapid Process of Urbanization in Zhejiang Province. China Popul. Res. Environ. 2014, 24, 129–134. [Google Scholar]
- Chen, X.; Zhu, S.; Kong, X.; Chen, C. Dynamic and Static Characteristics of Spatiotemporal Coupling Among Rural Population, Land, and Industry in Hubei Province. Chin. J. Agric. Res. Reg. Plan. 2021, 42, 31–38. [Google Scholar]
- Liu, Y.; Zhou, Y.; Li, Y. Rural Regional System and Rural Revitalization Strategy in China. Acta Geogr. Sin. 2019, 74, 2511–2528. [Google Scholar]
- Wu, X.; Li, T. Research on Coordinated Development of Rural Population-Economy-Land Spatial Agglomeration and Coupling—Takes Henan Province as An Example. Hubei Soc. Sci. 2019, 6, 61–69. [Google Scholar]
- Li, J.; Yang, Y.; Jiang, N. County-rural Transformation Development from Viewpoint of “Population-Land-Industry” in Beijing-Tianjin-Hebei Region under the Background of Rapid Urbanization. Sustainability 2017, 9, 1637. [Google Scholar] [CrossRef]
- Yang, R.; Liu, Y.; Long, H. The Study on Non-agricultural Transformation Co-evolution Characteristics of “Population-Land-Industry”: Case Study of the Bohai Rim in China. Geogr. Res. 2015, 34, 475–486. [Google Scholar]
- Liu, J.; Liu, Y.; Li, Y.; Hu, Y. Coupling Analysis of Rural Residential Land and Rural Population in China during 2007-2015. J. Nat. Res. 2018, 33, 1861–1871. [Google Scholar]
- Liu, Y.; Yang, Q.; He, X. Coupling Relationship of Rural Settlements and Rural Resident Population Change of Chongqing. Trans. Chin. Soc. Agric. Eng. 2019, 35, 266–274. [Google Scholar]
- Cao, X.; Chen, J.; Chen, L.; Liao, A.; Sun, F.; Li, Y.; Li, L.; Lin, Z.; Pang, Z.; Chen, J.; et al. Preliminary analysis of spatiotemporal pattern of global land surface water. Sci. China Earth Sci. 2014, 57, 2330–2339. [Google Scholar] [CrossRef]
- Wu, Y.; Liu, Y.; Li, Y. Spatio-temporal Coupling of Demographic-Landscape Urbanization and its Driving Forces in China. Acta Geogr. Sin. 2018, 73, 1865–1879. [Google Scholar]
- Liu, Y.; Li, Y. Revitalize the World’s Countryside. Nature 2017, 548, 275–277. [Google Scholar] [CrossRef]
- Liu, Y.; Yang, Y.; Li, Y.; Li, J. Conversion from Rural Settlements and Arable Land Under Rapid Urbanization in Beijing during 1985-2010. J. Rural. Stud. 2017, 51, 141–150. [Google Scholar] [CrossRef]
- Liu, Z.; Liu, L.; Sun, L.; Zhao, X.; Hu, Y. Spatial-temporal Patterns and Driving Forces of Land Use Change in Guangdong Province. J. Agric. Sci. 2018, 46, 253–260. [Google Scholar]
- Liu, G.; Wang, H.; Lu, D.; Xie, Q. Impact of Rural Out-migration and Endowments Dependency on Agriculture Land Use Intensity. Chin. J. Agric. Res. Reg. Plan. 2021, 42, 58–65. [Google Scholar]
- Lu, D. Planning: Towards Transformation and Revitalization: Exploration of the “Three Old” Transformation Planning. Urban Dev. Stud. 2013, 20, 43–49. [Google Scholar]
Publisher’s Note: MDPI stays neutral with regard to jurisdictional claims in published maps and institutional affiliations. |
© 2022 by the authors. Licensee MDPI, Basel, Switzerland. This article is an open access article distributed under the terms and conditions of the Creative Commons Attribution (CC BY) license (https://creativecommons.org/licenses/by/4.0/).