Article

Investigation on Civil Engineering Application of Tyre Encased Soil Element: Laboratory Direct Shear Test and Supply Chain Analysis

1
UniSA STEM, University of South Australia, Mawson Lakes, SA 5095, Australia
2
UniSA Creative, University of South Australia, Adelaide, SA 5000, Australia
*
Author to whom correspondence should be addressed.
Sustainability 2022, 14(22), 14852; https://doi.org/10.3390/su142214852
Submission received: 16 October 2022 / Revised: 7 November 2022 / Accepted: 8 November 2022 / Published: 10 November 2022
(This article belongs to the Special Issue Recycling Materials for the Circular Economy)

Abstract

:
The reuse of end-of-life (EOL) tyres as earth reinforcement materials in civil engineering projects have been studied for decades. Entire EOL tyres infilled with compacted soil can form segmental tyre encased soil elements (TESEs) with considerable load-bearing capacity. The TESEs can be used to construct structures like low-rise buildings, railway foundations and geotechnical structures. One of the most important aspects of TESE systems, i.e., the shearing interaction between neighbouring units is not yet well understood. In this study, thirty-six laboratory tests have been conducted to investigate the response of TESEs under intercourse shear actions. This was followed by a supply chain environment and economic analysis to investigate the acceptability of the system. The results revealed that the type of encased soil had more effect on the interface interactions between courses of TESEs compared to the TESEs’ construction pattern. It was also found that the frictional coefficient could be increased by either using coarse and angular aggregates as the encased soil or reducing the amount of the encased soil to form a high portion of rubber-to-rubber contact at the composite interface. Supply chain environment and economic analysis revealed that using entire tyres as construction materials has low CO2 emission and considerable economic benefits.

1. Introduction

The number of end-of-life (EOL) tyres has been increasing rapidly in recent decades. Statistical evidence shows that approximately 50 million tyre-equivalent passenger units are generated in Australia every year [1]. Less than 46% of these tyres are effectively recycled, while the remaining are either stockpiled or illegally dumped [1]. A similar situation was found in many other countries [2,3]. There is an urgent need to explore more approaches to consuming EOL tyres. EOL tyres have inherent high strength and durability even after their service lives as parts of vehicles, making them ideal as engineering construction materials [4,5].
Utilisation of EOL tyres as construction materials in various forms (i.e., crumb, shredded, whole tyre) has been an active research area in the past decades [2,3,6,7,8,9,10,11,12,13,14]. Applying whole EOL tyres without shredding can help to reduce the carbon footprints related to processing the tyres [15,16]. Whole EOL tyres infilled with compacted soil can form segmental tyre-encased soil elements (TESEs) with a considerable compressive strength [12,15]. For example, an ordinary 175/65R14 passenger car tyre filled with sandy material can withstand a compressive load of more than 1800 kN. Sun Indraratna [12] found that the high compressive load-bearing capacity of TESEs can be theoretically explained by the increased apparent cohesion due to the additional confining forces of the encasement tyre when the TESEs are subject to compressive loadings. TESEs have been used in constructing low-rise buildings, railway foundations, reinforced slopes, retaining walls, and embankments [2,5,9,12,13,17,18,19,20,21]. Reusing EOL tyres as reinforcement materials in engineering structures is an attractive solution to reducing the volume of used tyres disposed into landfills [9], with the added potential benefit of reduced cost for reinforced earth structure construction [2].
In recent years, research studies in low-rise tyre wall houses built of TESEs have proved that tyre wall houses have excellent architectural performance [22,23,24,25]. For instance, the tyre wall houses require little to no energy to heat and cool in various climates. The indoor air temperature can be naturally regulated by the thermal flywheel effect due to the thermal mass of the tyre wall and the earth-sheltering method. The interaction and shear load transferring mechanism between the tyre courses is a key parameter which determines the behaviour of the tyre wall systems. Freney Xu [15] found that the stability of tyre walls constructed using TESEs is closely related to intercourse friction. Two past investigations on stacked TESEs reported frictional coefficients between courses of TESES ranging between 0.55 and 0.81 [26,27]. Studies on the shear performance of masonry structures and soil bag structures revealed that the material type and geometry on the interfaces would affect the intercourse friction properties, resulting in isotropic or anisotropic behaviour [28,29,30,31,32]. However, the effects of material properties and construction patterns on the interface properties of TESEs are yet to be explored. The limited amount of data restricted understanding of the interface interaction between courses of TESEs. Also, limited studies on the lifecycle cost and environmental analyses of such systems have limited its real-life application. Hence, this study aims to study the interfacial performance between courses of TESEs as well as the environmental and economic benefits of reusing entire tyres in civil engineering constructions. To address these issues and to investigate the suitability of the TESTs system, a series of laboratory direct shear tests was performed followed by a supply chain environment and economic analysis.

2. Materials and Methods

2.1. Materials

Three types of soils were used in this study to construct TESEs, which were sandy loam, recycled aggregate, and uncrushed clay. These soils were sourced from a local soil supplier near Adelaide. Any granular material could be used as the encased materials, although the stiffness of the TESEs may vary. These soils were selected because they covered a range of different soil types with different characteristics, i.e., particle size distribution and other properties, which may produce TESEs with different performances. The particle size distribution of the soils is presented in Figure 1. The physical characteristics of the soils are summarised in Table 1. According to the unified soil characterisation system (USCS) [33], the sandy loam, recycled aggregate and uncrushed clay were classified as poorly graded sand (SP), silty sand (SM) and low plasticity clay (CL), respectively.
EOL tyres with a standard size of 175/65R14 were used in this study to construct TESEs. The tyres were sourced from a national tyre recycler, Tyrecycle Pty Ltd. Simple visual observation criteria were followed when selecting the tyres: no cord damage or exposed steel radials. The function of the tyres was to provide circumferential confining stresses to the encased soil, which is like other soil reinforcement materials, such as geocell and geotextiles [12,19,34]. Hence, the tensile properties of the tyre material were important to characterize. ASTM D638-14 [35] was followed in this study to prepare the tyre tensile test samples and loading protocols. It should be noted that this method could underestimate the strength of the tyres [15]. The results of the tyre direct tensile tests are listed in Table 2.

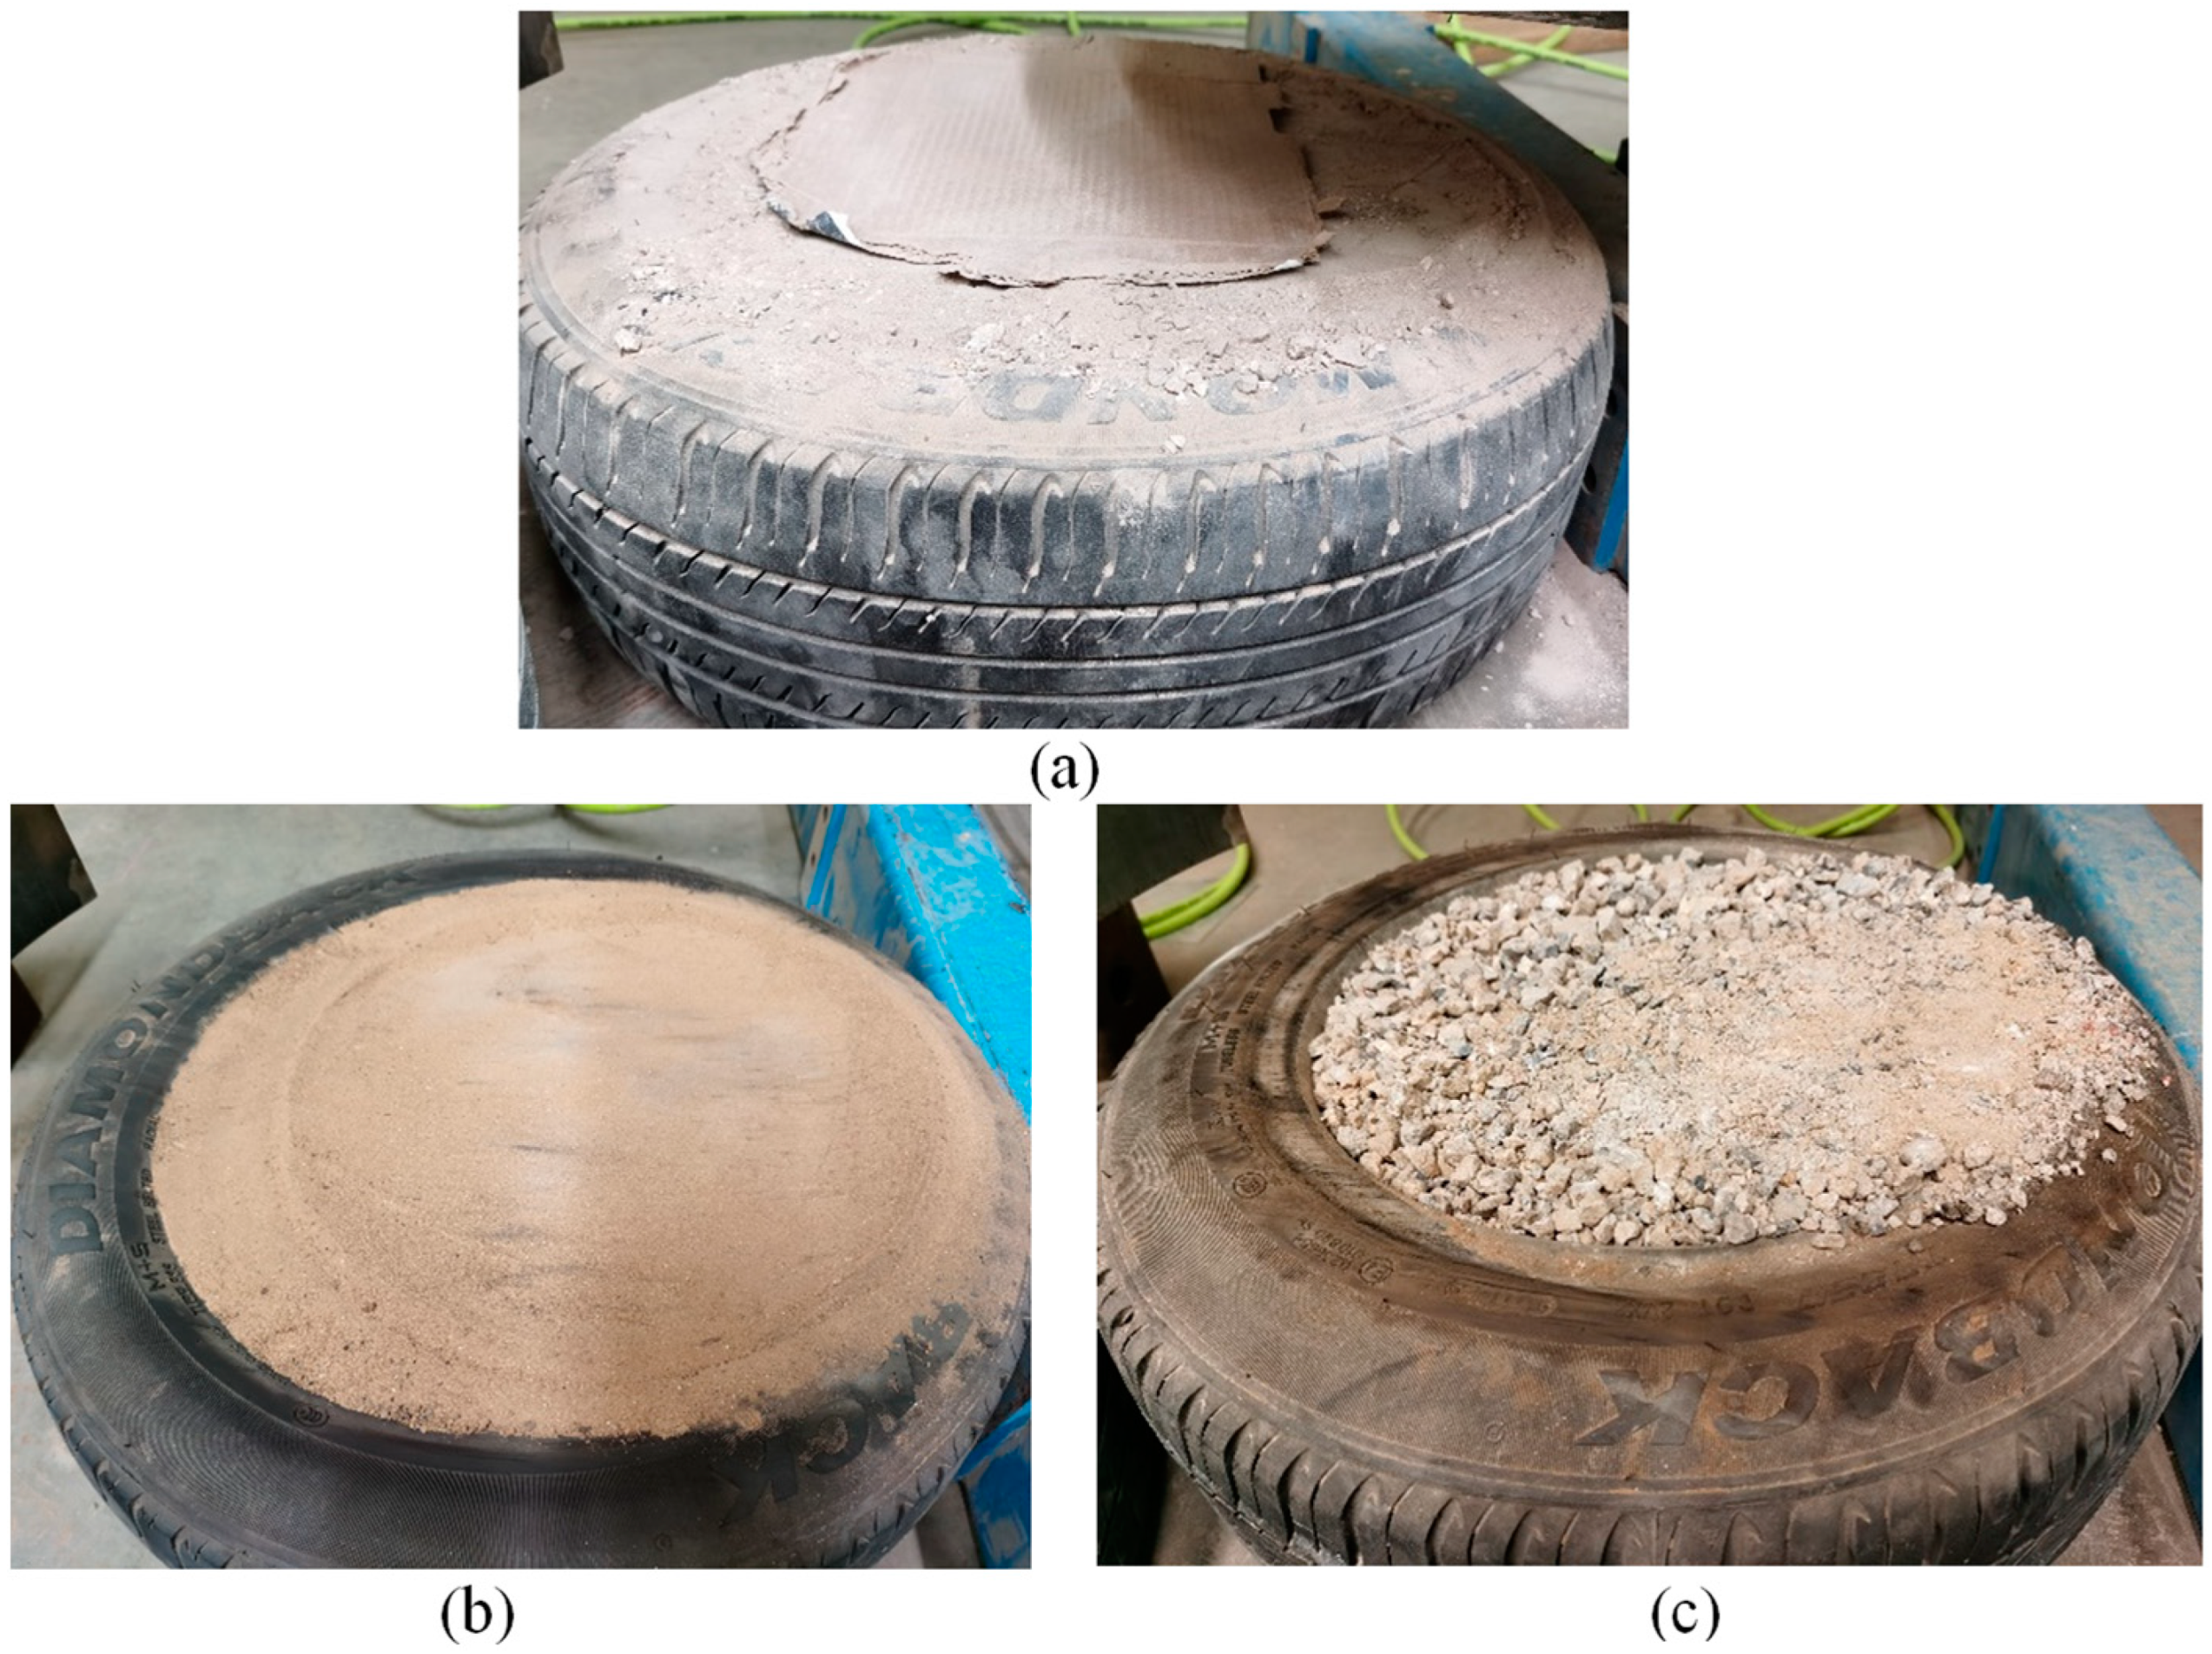
2.2. Preparation of TESEs

The TESEs were prefabricated before stacking together for the test setup. The TESE fabrication was done following the process reported in previous studies [15,41]. An empty tyre was placed on the floor. A layer of box cardboard was inserted into the tyre’s cavity to cover the bottom opening and provide a cap at the bottom of the tyre (to form a tyre container). Soil was added into the tyre container to half fill it, and then the soil was compacted with a pneumatic tamper. Then more soil was added, and the compaction process was used again until the upper side wall of the tyre was slightly swollen/bulging. The top surface of the TESEs was then levelled to ensure it was flat. While compacting the soils at their optimum moisture content could make the compaction process easier, this was not considered in this study. Instead, the used soils were oven-dried to filter out the influence of moisture content on the results when comparing the differences caused by each type of soil.

2.3. Direct Shear Test Setup and Instrumentation

The interface properties between TESEs were investigated by performing 36 direct shear tests. As mentioned earlier, three types of soils were utilised to construct the shear test samples. For each type of soil, three different construction patterns (i.e., out-of-plane, in-plane and one-on-one) were prepared to investigate the effect of construction patterns on the behaviours. The schematic drawings of the shear test setups are presented in Figure 2, Figure 3 and Figure 4. These three test configurations were considered to simulate the in-plane staggered pattern, out-of-plane staggered pattern and one-on-one stacked pattern that may be used in the constructions.
The shear test sample matrix is presented in Table 3. To understand the relationship between the shear load and the normal load, four shear tests were performed under different normal loads (5 kN, 10 kN, 15 kN and 20 kN) for each combination of TESE construction pattern and soil type. The range of the axial load represents the typical loads of a load-bearing wall for residential housing constructions [15].
The shear tests were performed using a customised test apparatus equipped with two curved 285 mm–radius shear plates (see Figure 2, Figure 3 and Figure 4). The curve shape was used to apply a uniform load to the surface of the top course TESE. The loading shear plate was connected to a horizontal hydraulic actuator that can push the top TESE to move parallel to the ground. The reaction shear plate was fixed to the strong floor.
The system used to generate the loads in the normal direction was comprised of a reaction beam, a pair of sliding rails, a vertical hydraulic actuator, a load cell, and a steel compression plate (600 mm × 600 mm × 20 mm). The vertical hydraulic actuator was connected to the top reaction beam through the pair of sliding rails. The top reaction beam and the sliding rails were not included in the three-dimensional drawings (Figure 2, Figure 3 and Figure 4). The entire normal loading system (apart from the top reaction beam) could move laterally to follow the movement of the top TESE. The normal load generated by the vertical hydraulic actuator was distributed to the top TESE through the steel compression plate. The load cells (load capacity of 100 kN) connected to the actuators were used to record the normal and shear loads. The shear displacement was recorded using a linear voltage displacement transducer (LVDT, with 200 mm travel distance) at the surface of the loading shear plate (refer to Figure 2).

3. Laboratory Direct Shear Test Results and Discussions

3.1. Failure Mode

For the one-on-one stacked pattern, the top course TESE is coaxial with the bottom course at the commencement of the test, forming two major contact interfaces, i.e., rubber-rubber and soil-cardboard interfaces. The rubber-rubber friction could be the major contribution of the interface friction as the cardboard surface was slippery. With the shear load increasing, compressive deformation was observed on the side surface of TESE, where shear loading was applied. Meanwhile, the compressive stiffness of encased soil would increase due to the additional confining stress induced by the shear load. The LVDT recorded some shear displacement due to the compressive deformation at the surface of TESE until the shear load reached the interlocking strength of the interface between two courses of TESEs. After that, relative shear sliding between two courses of TESEs was observed, and the number of contact interfaces increased from two to four, i.e., rubber-rubber, rubber-soil, rubber-cardboard, and soil-cardboard interfaces. During the period of shear sliding, the encased soil and the soil at the contact interfaces would relocate their fine particles into the voids until the shear load reached the maximum shear resistance. The tests were stopped when the recorded shear displacement reached 50 mm. Figure 5 presents the pictures of the frictional interface. The cardboard of one of the clay TESEs was torn during shear tests, but the clay was still retained inside the tyre and was relatively hard like a traditional brick. This was due to the triaxial confining pressure generated by the tyre encasement being able to hold the coarse aggregates together. In addition, the recycled aggregate did not leak out from the TESEs after manually tearing their cardboard base, whereas TESEs encased with flowable sand could be expected to leak if any tearing of the cardboard occurred. Thus, the type of soil forming a good interlocking/cohesion after compaction could be used to construct leak-proof TESEs, which is good to use when the cardboard is weak or degradable. Alternatively, the cardboard base can be replaced by high-strength and durable geo-fabrics, which can be suitable for constructing long life-span structures or infrastructures.
For the in-plane and out-of-plane staggered pattern, the shear tests started with a more complex contact condition at the interfaces of TESEs than the one-on-one stacked pattern. The staggered running bond pattern created a cantilever portion to the top TESE overhanging at the gap between the bottom two TESEs (Figure 6a). For the in-plane staggered pattern, due to the combined normal and shear loading, the resultant force attempted to push the top TESE into the TESE at the bottom course (Figure 6b and Figure 7), digging out the encased soil, and mound it up at the front. This was obvious for the sand TESE but not for the clay and recycled aggregate TESEs, because the encased clay and recycled aggregate were less flowable and resisted penetration. The same tilting behaviour of the top course of TESE was also observed in the tests with a one-on-one stacked pattern and out-of-plane staggered patterns. The tilting angle of the top TESEs was between 0.3 to 7.4 degrees for all the tests when the shear displacement reached 50 mm. Apart from a larger tilting angle that would occur when the normal load was higher, no other obvious trend regarding the tilting angle was found.
In summary, compressive deformation would first be observed on the TESEs at the shear loading locations before the shear load reached a magnitude enough to generate relative sliding between courses of TESEs. After that, the relative shear sliding would govern the failure mode for the TESEs regardless of the type of encased materials. However, during the process of shear sliding, more flowable and less penetration-resistant encased materials (i.e., comparing sandy soils with stiff aggregates) would have more significant tilting at the top-course of TESE due to the deformation of the TESEs. The coarser aggregates as encased materials would perform better than flowable sands in terms of structural integrity due to better interlocking between granular particles. Therefore, coarse aggregates could be more favourable for constructing TESEs that prevent soil leakage when the TESEs’ base (i.e., cardboard) is easily torn under the shear loads.

3.2. Normal Force-Shear Displacement Relationship

Figure 8 plots the normal force against shear displacement. The normal forces were stable at desired 5 kN, 10 kN, 15 kN and 20 kN, respectively, during the shear testing of clay and sand TESEs. But for the recycled aggregates TESEs with one-on-one stacked patterns and in-plane staggered patterns, the normal forces increased with the increasing shear displacement at a higher level of axial loads (i.e., 15 kN and 20 kN), as shown in Figure 8. The increment of the normal force was likely to be due to the deformation of the TESEs and the dilation of the encased soil at higher level of axial loads. It could be explained that the individual aggregate particles have higher stiffness, which only allowed the sliding failure at the particle-to-particle interface. For the well-compacted recycled aggregate with large particle sizes, an apparent lifting motion would occur between the neighbouring aggregates to allow a shear displacement when receiving shear stresses. However, well-compacted sand and clay with smaller particle sizes only require minimum lifting to allow shear sliding at the TESE interface and inside the tyre container. Thus, no significant dilation occurred in the cases of encased sand and clay.

3.3. Shear Force-Shear Displacement Relationship

Figure 9 presents the relationship between the shear force and the shear displacement. It shows a general trend of the normal force increasing with the increment of shear force. All the samples, regardless of the type of soil and the construction pattern, showed a basically bilinear behaviour. At the beginning of the test until a displacement 15–25 mm, the samples had a high stiffness. This is followed by a plateau or only small increases in the shear force at larger displacements.
As discussed in Section 3.1, before the shear force reaches its peak, two forms of behaviour would occur, determining the shear stiffness. The compressive deformation first occurred at the TESE’s side surface, where shear loading was applied, followed by shear sliding between the two courses of TESEs. The compressive deformation could be an indicator of the rearrangement of soil particles, where the fine particles relocated into the voids, resulting in the compaction of soil. Meanwhile, the compressive resistance of TESEs would increase.
The shear stiffness remained constant while the shear displacement was between two mm and five mm (the linear portion of the shear force-displacement curve) and started to drop after 5 to10 mm (the portion where the shear force attempted to plateau). During these two periods, the soil particles at the shear interface between the two courses of TESEs relocated and rolled until a steady state was reached.
A comparison of the initial shear stiffness (before five mm shear displacement), determined that the clay samples showed a more significant anisotropic performance than the samples of recycled aggregate and sand. However, for the ultimate shear load resistance, the clay samples with different setup configurations did not show much variance. The sand TESEs also showed less variance in the ultimate shear load resistance than the recycled aggregates. Some of the recycled aggregate samples (i.e., one-on-one and in-plane construction patterns with 15 kN and 20 kN normal load) had an increasing shear force until the end of the test due to the normal force increase (Figure 8b and Figure 9b).

3.4. Shear Stress-Normal Stress Relationship and Interfacial Properties

Figure 10 shows the relationship between the peak normal stress and the peak shear stress. The shear stress was calculated as the shear force divided by the contact area (at peak loading) at the interface between two courses of TESEs (in-plane staggered pattern ≈ 0.188 m2, out-of-plane staggered pattern ≈ 0.183 m2 and one-on-one stacked pattern ≈ 0.212 m2). The normal stress was calculated as the normal force divided by the contact area at the interface between two courses of TESEs. The figure indicated that the shear stress increased linearly with increments of normal stress. The linear relationship between the normal stress and the shear stress suggested that the “Mohr-Coulomb law” could be considered to simulate the behaviour of the interfacial properties between courses of TESEs. Based on the Mohr-Coulomb law, τ = c + σ tan δ (where, τ is the shear stress, c is the interlocking stress, σ is the normal stress, and δ is the interface friction angle), the interlocking stress was calculated as the value of the shear stress when the normal stress was zero (i.e., the intersection of the best fit line with the y-axis in Figure 10). The frictional coefficient was calculated as the slope of the best fit line ( = tan δ ). The results of the interlocking stresses and the frictional coefficient are summarised in Table 4.
The spreading clay at the contact interface, as shown in Figure 5a, resulted in a lower frictional coefficient of the clay sample with the one-on-one test setup. The remaining test results of all samples indicated that the one-on-one setup had the smallest interlocking force but the largest frictional coefficient. This is possibly due to the deformed shape of TESEs forming interlocking geometry (staggered), which ultimately induced a higher interlocking strength in the in-plane and out-of-plane samples than the one-on-one samples. For the frictional coefficient, the encased soil was deformable and flowable under the compressive load, which induced a larger rubber-to-rubber contact area in the one-on-one construction pattern (i.e., imagine the process of pressing two stacked swim rings). The contact force, in this case, was transferred through the rubber-to-rubber interface. The frictional coefficient of the rubber-to-rubber interface has been reported to be in the range of one to 1.2 [42], which was much larger than other contact interfaces (i.e., sand-to-sand: 0.58~0.84 [43,44]; sand-to-rubber: 0.54~0.58 [45]). Therefore, the large portion of rubber-to-rubber contact brought the one-on-one samples a larger frictional coefficient at the interface. Thus, there was less interlocking between the soil particles at the contact interface.
By comparing the effect of the encased soil type, it was found that the clay samples with different construction patterns have reasonably consistent results, apart from the lower frictional coefficient of the clay sample with one-on-one construction pattern (as discussed earlier). The consistency of results observed in the clay samples was because the clay TESEs were rigid, which allowed its geometry and interface contact condition to remain less altered due to the change in the construction pattern. The rigidity of clay samples was proved by the stable geometry even without the tyre container’s cardboard base (refer to Section 3.1).
The recycled aggregate TESEs had the largest frictional coefficient but the smallest interlocking force among all the samples. It was likely because the encased aggregate had the highest particle rigidity and angularity. The commencement of shear loading would directly mobilise and rearrange the position of the aggregates at the interface, resulting in a lower interlocking force than in other samples. When a new stable condition was reached, the angular recycled aggregates at the interface formed a rougher sliding face than other soils, resulting in a higher frictional coefficient than other samples. The sand TESEs had the largest interlocking stress among all the samples. It was because the TESEs made of sand had higher deformability. Under a compressive load, they formed better interlocking geometry, especially in the samples with in-plane and out-of-plane staggered patterns.
To summarise, using stiff coarse aggregates as encased materials would induce the TESE with a higher frictional coefficient at the course-by-course interface. However, the interlocking force could be reduced due to the easy repositioning of the surface aggregates when loaded. The same effect (higher frictional coefficient) could be achieved by reducing the amount of the encased soil to form a higher portion of rubber-rubber contact at the interface with respect to low compressive load-bearing capacity. Therefore, the best formula for creating a high shear resistant TESE would be using soils with higher angularity and higher stiffness. Reducing the amount of the encased soil to form a high portion of rubber-to-rubber contact at the composite interface would also increase the shear resistance. However, the low relative compaction may result in large axial deformation.

4. EOL Tyre Re-Used Supply Chain Environment and Economic Analysis

The EOL tyre reused supply chain starts at the used tyre removal entities such as tyre retailers and commercial and household removal sites. These tyres are transported to the collection entities and reused for infrastructure and low-rise building construction (Figure 11).
The reused EOL tyre supply chain in South Australia was chosen as the case study for supply chain environmental and economic analysis as the benefits of reused EOL tyres as part of the construction structure have attracted the attention of local public sectors, research organisations, and the tyre industry. In South Australia, 31,200 tonnes of EOL tyres, equivalent to 3.9 million passenger units of EOL tyres [46], are generated each year, which could be used to construct over 1600 one-story residential buildings.
The environmental benefit analysis of the EOL tyre reuse supply chain analysed the greenhouse gas (GHG) emissions of collection and transportation processes (Equation (1)).
G H G t o t a l = G H G c o l l e c t i o n + G H G t r a n s p o r t
The GHG emissions in the EOL tyre collection process ( G H G c o l l e c t i o n ) shown in Equation (2) were calculated by the collection of 31,200 tonnes ( T t y r e ) of EOL tyres, the productivity of loader collecting tyres ( P r o d l o a d e r ) of 0.016 h/tonne, the fossil fuel consumption of loader ( F u e l l o a d e r ) of 11.8 L/h, and GHG emission of each litre of fuel burn ( G H G f u e l ) of 2.3 kg CO2-eq/litre [47].
G H G c o l l e c t i o n = T t y r e × P r o d l o a d e r × F u e l l o a d e r × G H G f u e l = 13.5   t o n n e s   CO 2 eq
The GHG emissions in the transportation process are presented in Equation (3). The average distance between EOL tyre sources and collection points ( D i s t ) was estimated to be 50 km based on the measurement from South Australia maps. Similarly, the distance between collection points and construction sites ( D i s t ) was 50 km in the case study setting. The fuel consumption of a typical transportation cycle ( F u e l t r a n s p o r t ) with a whole load ( L o a d w h o l e ) of two tonnes was estimated to be 0.02 L/tonne/km [47].
G H G t r a n s p o r t = T t y r e ÷ L o a d w h o l e × F u e l t r a n s p o r t × D i s t + D i s t × G H G f u e l = 717.6   t o n n e s   CO 2 eq
The economic analysis calculated the total cost of the EOL reused tyre supply chain in the collection and transportation processes (Equation (4)). The unit collection and transportation cost ( C o s t u n i t ) of each tyre was reported as an average of AU$1 [46], and the number of equivalent passenger units of EOL tyres ( N t y r e ) in South Australia was estimated to be 3.9 million tyres. As indicated in Table 5, the processing cost of EOL tyres can largely impact the total cost of the supply chain, and the supply chain total cost of different end uses of EOL tyres can be different. Reusing EOL tyres less costs less than other ways of recycling EOL tyres as construction materials in South Australia, which is AU$ 3.9 million. The EOL reuse tyres supply chain can reduce 15%, 75%, and 79% of the supply chain total cost compared with the EOL tyres recycling supply chain due to saving the EOL tyre processing cost. In certain circumstances, i.e., cheap labour, the constructions using TESEs can be more economically viable than using other construction materials.
C o s t t o t a l = C o s t c o l l e c t i o n + C o s t t r a n s p o r t = C o s t u n i t × N t y r e = 3.9   million   AUD

5. Conclusions

In this study, a total of 36 laboratory direct shear tests were performed to investigate the interfacial behaviour of TESEs. Three types of infilled materials were used to construct the TESE samples to understand the effect of the type of encased materials on the TESE interfacial performance. Three test setup scenarios were implemented to investigate the influence of the construction pattern and TESEs layout. A supply chain environment and economic analysis were also performed to estimate the environmental and economic benefits of reusing entire tyres in civil engineering applications. The key findings from this research are summarised as follows:
  • The shear failure was governed by an intercourse shear sliding and a small tilting of the top course TESE. No soil leakage was observed on the tested TESEs. The types of soils that can form good particle-particle interlocking after compaction (e.g., coarse aggregates) are recommended for constructing leak-proof TESEs.
  • Using well-compacted coarse aggregates with a large particle size as the encased material may result in obvious dilation, which is not the case when using loose small-grain soils as the encased material. Due to the dilation effect, the lateral shear pressure may induce a vertically uplifting force to the above-supported structures.
  • Using stiff coarse aggregates as encased materials would induce the TESE with a high frictional coefficient at the course-course interface. The same effect (high frictional coefficient) could be achieved by reducing the amount of the encased soil to form a higher portion of rubber-to-rubber contact at the interface at the expense of a lower compressive load-bearing capacity.
  • The supply chain environment and economic analysis revealed that using entire tyres to construct TESEs has lower carbon-dioxide emissions and more economic benefits than the traditional way of recycling waste tyres.
This study provided scientific data to prove the feasibility and sustainability of using TESEs as construction materials. It is expected that the results of this paper will provide built environment professionals with further assurance and evidence to widely adopt TESEs in civil engineering projects. More widespread use of TESEs would bring more environmental and economic benefits.

6. Limitations and Recommendations

Thirty-six laboratory shear tests were conducted in this study as a kick-start in the studied area to investigate the general shear performance at the interface between two courses of TESEs. The data and analysis provided in this paper could be a base for researchers and engineers to explore further regarding design and research contexts. In order to ascertain the viability of the practical usage of TESEs, like the practical application of all other engineering construction materials, it requires extensive work to carry out countless laboratory experiments, in-situ tests and computational modellings to provide scientific data and assurance on many aspects, including but not limited to safety, economics, viability, and sustainability. Therefore, it is recommended that future studies perform additional research to enrich the database and gain a better understanding of the effect of materials, assembly configurations, and loading conditions on structural systems constructed of TESEs.
Moreover, this study investigated the effects of types of encased materials on the interfacial properties between courses of TESEs. The moisture content of the soils was consistent at zero to better compare the variances from different soil types. But in-situ applications of TESEs would not oven-dry the soil for construction efficiency. It is recommended that researchers in the future investigate the impact of moisture content of the encased soil on the interfacial properties between courses of TESEs. Future research could further evaluate the interfacial interaction parameters (such as interlocking strength and frictional coefficient) at all interfaces (such as soil-rubber, soil-cardboard, cardboard-rubber and rubber-rubber), to provide the basic information required to develop analytical and/or computational models for estimation of the quality at composite contacting interfaces.
The experimental shear tests on TESEs presented in this article form part of a sequential study regarding the viability of the usage of TESEs to construct tyre walls for low-rise building constructions. The design for the out-of-plane load capacity of tyre walls subject to different failure scenarios has been detailed and discussed by Xu andFreney [15], which will not be repeated here. It should be noted that TESEs could not only be used for low-rise building construction but also in geotechnical infrastructures and many other engineering areas if they can be properly designed and arranged.

Author Contributions

Data curation, Y.X.; Formal analysis, Y.X. and L.L.; Funding acquisition, M.F.; Investigation, Y.X.; Methodology, Y.X.; Project administration, Y.Z.; Supervision, Y.Z., M.M.R., M.R.K., R.H. and M.F.; Writing—original draft, Y.X. and L.L.; Writing—review & editing, Y.Z., M.M.R., M.R.K., R.H., L.L. and M.F. All authors have read and agreed to the published version of the manuscript.

Funding

This research was funded by Tyre Stewardship Australia grant number 250517.

Institutional Review Board Statement

Not applicable.

Informed Consent Statement

Not applicable.

Data Availability Statement

The test results data are stored on premise and can be provided on request.

Acknowledgments

The authors acknowledge the contributions of Tim Golding, Henry Senko, Rohan Muscher, Gregory ONeil and Ian Whitehead for technical assistance when preparing and testing the TESEs. The authors also thank the University of South Australia (UniSA) and the industry partners Tyre Stewardship Australia and Tyrecycle Pty. Ltd. for the research scholarship funding and the donation of tyre materials. The authors would like to acknowledge Dassault Systems for providing licenses for the engineering design software, i.e., SolidWorks, as part of the strategic collaboration plan with UniSA, which provided the authors with outstanding accessibility in planning and presenting this research study.

Conflicts of Interest

The authors declare that they have no known competing financial interests or personal relationships that could have appeared to influence the work reported in this paper. Martin Freney operates a company that provides architectural services for the design of Earthship homes.

References

  1. Gilson, Tyre Stewardship Australia Annual Report; Tyre Stewardship: Collingwood, Australia, 2017.
  2. Garga, V.K.; O’Shaughnessy, V. Tire-reinforced earthfill. Part 1: Construction of a test fill, performance, and retaining wall design. Can. Geotech. J. 2000, 37, 75–96. [Google Scholar] [CrossRef]
  3. Li, L.; Shi, A.; Zhang, L.; Xiao, H.; Jiang, M. Experimental investigations on the mechanically stabilised earth wall under static load conditions. Eur. J. Environ. Civ. Eng. 2018, 25, 575–598. [Google Scholar] [CrossRef]
  4. Ab-Malek, K.; Stevenson, A. The effect of 42 year immersion in sea-water on natural rubber. J. Mater. Sci. 1986, 21, 147–154. [Google Scholar] [CrossRef]
  5. Long, N.T.; Audeoud, B.; Bailly, J.C.; Jean, P.A.; Lareal, P.; Ursat, P.; Valeux, J.C. Etudes et Recherches des Laboratoires des Ponts et Chaussees-Serie Geotechnique; Laboratoire Central des Ponts et Chausees (LCPC): Paris, France, 1990. [Google Scholar]
  6. Huat, B.B.K.; Aziz, A.A.; Chuan, L.W. Application of scrap tires as earth reinforcement for repair of tropical residual soil slope. Electron. J. Geotech. Eng. 2009, 13, 1–9. [Google Scholar]
  7. Li, L.; Xiao, H.-l.; Zheng, J.-j.; Chen, L.; Sun, M.-j.; Sun, L.; Yang, C. The model test of waste tire reinforced slope. Gongcheng Lixue Eng. Mech. 2015, 32, 79–85. [Google Scholar] [CrossRef]
  8. Li, L.; Xiao, H.; Ferreira, P.; Cui, X. Study of a small scale tyre-reinforced embankment. Geotext. Geomembr. 2016, 44, 201–208. [Google Scholar] [CrossRef]
  9. O’Shaughnessy, V.; Garga, V.K. Tire-reinforced earthfill. Part 2: Pull-out behaviour and reinforced slope design. Can. Geotech. J. 2000, 37, 97–116. [Google Scholar] [CrossRef]
  10. Long, N.-T. Utilization of used tyres in civil engineering-The Pneusol’Tyresoil. In Environmental Geotechnics; Laboratoire Central des Ponts et Chausees (LCPC): Paris, France, 1996; pp. 809–814. [Google Scholar]
  11. Yoon, Y.W.; Heo, S.B.; Kim, K.S. Geotechnical performance of waste tires for soil reinforcement from chamber tests. Geotext. Geomembr. 2008, 26, 100–107. [Google Scholar] [CrossRef]
  12. Indraratna, B.; Sun, Q.D.; Grant, J. Behaviour of subballast reinforced with used tyre and potential application in rail tracks. Transp. Geotech. 2017, 12, 26–36. [Google Scholar] [CrossRef] [Green Version]
  13. Sun, Q.; Indraratna, B.; Heitor, A. Behaviour of a capping layer reinforced with recycled tyres. Proc. Inst. Civ. Eng. —Ground Improv. 2019, 172, 127–137. [Google Scholar] [CrossRef]
  14. Mistry, M.K.; Shukla, S.J.; Solanki, C.H. Reuse of waste tyre products as a soil reinforcing material: A critical review. Environ. Sci. Pollut. Res. 2021, 28, 24940–24971. [Google Scholar] [CrossRef] [PubMed]
  15. Xu, Y.; Freney, M.; Hassanli, R.; Zhuge, Y.; Rahman, M.; Karim, R. Experimental study on the structural performance of full-scale tyre wall for residential housing applications. Eng. Struct. 2022, 259, 114181. [Google Scholar] [CrossRef]
  16. Awan, A.; Shaikh, F. Experimental and numerical study on structural behaviour of tyre-bale sandwich wall under different loading conditions. Aust. J. Struct. Eng. 2021, 22, 299–316. [Google Scholar] [CrossRef]
  17. Esbelin, G.; Long, N.; Ursat, P. Pneusol at the Bussang pass. In Proceedings of the Third International Conference on Case Histories in Geotechnical Engineering, St. Louis, MO, USA, 1–4 June 1993. [Google Scholar]
  18. O’Shaughnessy, V. Reinforcement of Earth Structures Using Scrap Tires; University of Ottawa: Ottawa, ON, Canada, 1997. [Google Scholar]
  19. Indraratna, B.; Sun, Q.; Heitor, A.; Grant, J. Performance of rubber tire-confined capping layer under cyclic loading for railroad conditions. J. Mater. Civ. Eng. 2018, 30, 06017021. [Google Scholar] [CrossRef]
  20. Sun, Q.; Indraratna, B.; Grant, J. Numerical Simulation of the Dynamic Response of Ballasted Track Overlying a Tire-Reinforced Capping Layer. Front. Built Environ. 2020, 6, 115. [Google Scholar] [CrossRef]
  21. Anburuvel, A. Utilizing Scrap Tyre in Unbound Pavement Layers: A State-of-the-Art Review. Int. J. Pavement Res. Technol. 2022, 1–18. [Google Scholar] [CrossRef]
  22. Freney, M.; Soebarto, V.; Williamson, T. Thermal comfort of global model earthship in various European climates. In Proceedings of the Building Simulation 2013: 13th International Conference of the International Building Performance Simulation Association, Chambéry, France, 26–28 August 2013; pp. 1625–1632. [Google Scholar]
  23. Freney, M.; Soebarto, V.; Williamson, T. Earthship monitoring and thermal simulation. Archit. Sci. Rev. 2013, 56, 208–219. [Google Scholar] [CrossRef]
  24. Freney, M. Earthship architecture: Post occupancy evaluation, thermal performance & life cycle assessment. In School of Architecture and Built Environment; The University of Adelaide: Adelaide, Australia, 2014. [Google Scholar]
  25. Grindley, P.C.; Hutchinson, M. The thermal behaviours of an earthshi Renew. Energy 1996, 8, 154–159. [Google Scholar]
  26. Griepentrog, T.E. Engineering Evaluation of Earth-Filled Tire Construction, Dennis Weaver Residence, Ridgway, Colorado; Buckhorn Geotech: Montrose, CO, USA, 1990. [Google Scholar]
  27. Zimmerman, A.; Burger, E.; Nolan, J. Testing and analysis of modified rammed earth tyre walls. In E90 Project; Swarthmore College: Swarthmore, PA, USA, 2011. [Google Scholar]
  28. Fan, K.; Liu, S.H.; Cheng, Y.; Liao, J. Effect of infilled materials and arrangements on shear characteristics of stacked soilbags. Geosynth. Int. 2020, 27, 662–670. [Google Scholar] [CrossRef]
  29. Ahmed, G.H.; Aziz, O.Q. Shear behavior of dry and epoxied joints in precast concrete segmental box girder bridges under direct shear loading. Eng. Struct. 2019, 182, 89–100. [Google Scholar] [CrossRef]
  30. Casapulla, C.; Argiento, L.U. In-plane frictional resistances in dry block masonry walls and rocking-sliding failure modes revisited and experimentally validated. Compos. Part B: Eng. 2018, 132, 197–213. [Google Scholar] [CrossRef]
  31. Bu, Z.-Y.; Zhang, X.; Ye, H.-H.; Xi, K.; Wu, W.-Y. Interface shear transfer of precast concrete dry joints in segmental columns. Eng. Struct. 2018, 175, 257–272. [Google Scholar] [CrossRef]
  32. Beconcini, M.L.; Croce, P.; Formichi, P.; Landi, F.; Puccini, B. Experimental Evaluation of Shear Behavior of Stone Masonry Wall. Materials 2021, 14, 2313. [Google Scholar] [CrossRef] [PubMed]
  33. ASTM D2487-11; Standard Practice for Classification of Soils for Engineering Purposes (Unified Soil Classification System). ASTM International: West Conshohocken, PA, USA, 2011.
  34. Li, L.; Cui, F.; Xiao, H.; Ma, Q.; Qin, L. Shear Performance of Waste Tires, Geogrid and Geocell Reinforced Soils; Springer: Singapore, 2018; pp. 463–472. [Google Scholar]
  35. ASTM D638-14; Standard Test Method for Tensile Properties of Plastics. ASTM International: West Conshohocken, PA, USA, 2014.
  36. AS 1289.3.6.1-2009; Methods of Testing Soils for Engineering Purposes—Soil Classification Tests—Determination of the Particle Size Distribution of a Soil—Standard Method of Analysis by Sieving. Standards Australia Limited: Sydney, Australia, 2009.
  37. AS 1289.5.1.1; Methods of Testing Soils for Engineering Purposes—Soil Compaction and Density Tests—Determination of the Dry Density/Moisture Content Relation of a Soil using Standard Compactive Effort. Standards Australia Limited: Sydney, Australia, 2017.
  38. AS 1289.3.1.1-2009; Methods of Testing Soils for Engineering Purposes—Soil Classification Tests—Determination of the Liquid Limit of a Soil—Four Point Casagrande Method. Standards Australia Limited: Sydney, Australia, 2009.
  39. AS 1289.3.2.1-2009; Methods of Testing Soils for Engineering Purposes—Soil Classification Tests—Determination of the Plastic Limit of a Soil—Standard Method. Standards Australia Limited: Sydney, Australia, 2009.
  40. AS 1289.3.3.1-2009; Methods of Testing Soils for Engineering Purposes-Soil Classification Tests—Calculation of the Plasticity Index of a Soil. Standards Australia Limited: Sydney, Australia, 2009.
  41. Reynolds, M. Earthship Volume 1: How to Build Your Own; Solar Survival Pr.: Taos, NM, USA, 1990. [Google Scholar]
  42. Bowden, F.P.; Bowden, F.P.; Tabor, D. The Friction and Lubrication of Solids; Oxford University Press: Oxford, UK, 2001; Volume 1. [Google Scholar]
  43. AUSTROADS. ‘92 Austroads Bridge Design Code; Austroads: Sydney, Australia, 1992. [Google Scholar]
  44. SN 670 010b; Characteristic Coefficients of Soils, Association of Swiss Road and Traffic Engineers Swiss Standard, in Characteristic Coefficients of soils. Association of Swiss Road and Traffic Engineers: Zürich, Switzerland, 1997.
  45. Neal, M.S. Friction and adhesion between soil and rubber. J. Agric. Eng. Res. 1966, 11, 108–112. [Google Scholar] [CrossRef]
  46. Randell, P.; Baker, B.; O’Farrell, K. Used Tyres supply Chain and Fate Analysis; Randell Environmental Consulting: Castlemaine, VA, USA, 2020. [Google Scholar]
  47. Liu, Y.; Zhuge, Y.; Chow, C.W.; Keegan, A.; Li, D.; Pham, P.N.; Li, L. Compressive behaviour and environmental evaluation of sludge-derived masonry walls. Case Stud. Constr. Mater. 2021, 15, e00736. [Google Scholar] [CrossRef]
  48. Tyre Stewardship Australia. Used Tyres Supply Chain and Fate Analysis Report; Tyre Stewardship: Collingwood, Australia, 2020. [Google Scholar]
Figure 1. Particle size distribution of the encased soils.
Sustainability 14 14852 g001
Figure 2. Shear test setup with out-of-plane staggered construction pattern.
Sustainability 14 14852 g002
Figure 3. Shear test setup with in-plane staggered construction pattern.
Sustainability 14 14852 g003
Figure 4. Shear test setup with one-on-one stacked construction pattern.
Sustainability 14 14852 g004
Figure 5. Surfaces of the bottom TESEs after testing: (a) clay TESE; (b) sand TESE; (c) recycled aggregate TESE.
Sustainability 14 14852 g005
Figure 6. In-plane shear testing of Sand TESEs: (a) overlapping arrangement; (b) soil mound due to a resultant force.
Sustainability 14 14852 g006
Figure 7. Tilting angle of the sand TESEs with the out-of-plane test setup.
Sustainability 14 14852 g007
Figure 8. Normal force-shear displacement relationship of recycled aggregate TESEs: (a) sandy loam; (b) recycle aggregated; (c) clay.
Sustainability 14 14852 g008
Figure 9. Shear force-shear displacement relationship: (a) clay; (b) recycled aggregate; (c) sand.
Sustainability 14 14852 g009
Figure 10. Shear stress-normal stress relationship: (a) clay; (b) recycled aggregate; (c) sand.
Sustainability 14 14852 g010
Figure 11. Overview of EOL tyre supply chain.
Sustainability 14 14852 g011
Table 1. Physical properties and technical specifications of the soils.
PropertiesSandy LoamRecycled AggregateUncrushed ClayStandards
Maximum grain size, D max (mm)4.753255 *AS 1289.3.6.1 [36]
Minimum grain size, D min (μm)0.50.40.3 *AS 1289.3.6.1 [36]
Coefficient of uniformity, C u 2.257.019.7 *ASTM D2487 [33]
Coefficient of curvature, C c 1.00.30.3 *ASTM D2487 [33]
Maximum dry density, γ dmax (t/m3)1.691.811.79AS 1218.5.1.1 [37]
Optimum moisture content, OMC (%)12.315.08.6AS 1218.5.1.1 [37]
Liquid limit, LL (%)252633.6AS 1289.3.1.1 [38]
Plastic limit, PL (%)202423.5AS 1289.3.2.1 [39]
Plastic index, PI (%)5210.1AS 1289.3.3.1 [40]
USCS classificationSPSMCLASTM D2487 [33]
* Represents the lump sizes in the used uncrushed clay, not real particle size.
Table 2. Physical properties and technical specifications of the EOL tyres.
PropertiesValuesStandards
Standard size175/65R14-
Outside diameter (mm)584-
Rim diameter (mm)355.6-
Tread height (mm)175-
Average thickness (mm)12-
Average tensile stress at 2% strain (MPa)2.1ASTM D638-14 [35]
Average tensile stress at 5% strain (MPa)5.2ASTM D638-14 [35]
Average ultimate strain (%)13.1ASTM D638-14 [35]
Average ultimate tensile strength (MPa)14.1ASTM D638-14 [35]
Table 3. Shear test sample matrix.
Out-of-Plane
Figure 2
In-Plane
Figure 3
One-on-One
Figure 4
Sandy loam
Recycled aggregate
Uncrushed clay
√ indicates that the material-setup combination was examined by a group of four direct shear tests, with normal loads of 5, 10, 15, and 20 kN.
Table 4. Shear test results.
Encased MaterialTest SetupInterlocking Stress (kPa)Frictional Coefficient
ClayIn-plane5.570.50
One-on-one4.890.43
Out-of-plane5.170.51
Recycled aggregateIn-plane2.920.62
One-on-one0.190.58
Out-of-plane1.860.55
SandIn-plane7.240.38
One-on-one2.270.52
Out-of-plane7.550.42
Table 5. Summary of cost of applying EOL tyres.
FateTotal Cost
(Million AU$)
References
Re-useLow-rise residential construction3.9
RecyclingShredded tyre4.6Tyre Stewardship Australia [48]
Granule (2–15 mm)15.6Tyre Stewardship Australia [48]
Buffings (<2 mm)15.6Tyre Stewardship Australia [48]
Crumb rubber (power)18.7Tyre Stewardship Australia [48]
Publisher’s Note: MDPI stays neutral with regard to jurisdictional claims in published maps and institutional affiliations.

