Article

Effects of Public Transport Accessibility and Property Attributes on Housing Prices in Polycentric Beijing

1
State Key Laboratory of Earth Surface Processes and Resource Ecology, School of Natural Resources, Faculty of Geographical Science, Beijing Normal University, Beijing 100875, China
2
Department of Social Sciences, Education University of Hong Kong, Hong Kong, China
3
China Academy of Urban Planning and Design (CAUPD), Beijing 100044, China
*
Author to whom correspondence should be addressed.
Sustainability 2022, 14(22), 14743; https://doi.org/10.3390/su142214743
Submission received: 8 September 2022 / Revised: 4 November 2022 / Accepted: 4 November 2022 / Published: 9 November 2022
(This article belongs to the Section Sustainable Urban and Rural Development)

Abstract

:
The public transit system is often developed in tandem with urban growth, bringing improved accessibility and raising housing prices around stations. The impact of public transport accessibility on housing prices demand in-depth empirical studies to understand the underlying factors. The confounding influence of polycentric cities, contrasting with monocentric ones, deserves more attention. We studied the effects of metro and bus accessibility on housing prices along metro lines 6, 7, 9 and 14 in Beijing under the polycentric scenario. Other property attributes, including building features, location characteristics and neighborhood amenities, served as explanatory variables. Ordinary least squares (OLS) and geographically weighted regression (GWR) were used to build the global (whole-study area) and local hedonic price models, respectively. The results indicated that GWR performed better than OLS in predicting the effects of public transport accessibility on housing prices. Residential properties with access to more metro lines and stations and bus stops were associated with higher housing prices, with metro stations exerting more effects. The premiums of monocentric and polycentric models showed similar spatial patterns. In polycentric Beijing, the premiums of metro accessibility were higher in the eastern part, and the effect of bus accessibility showed circular distribution. Beijing could be regarded as a monocentric city on a global scale, but the influence of subcenters should be considered in a local polycentric regression model. The findings can inform urban planning concerning land use and public transport provision in Beijing and selecting research models in cognate studies.

1. Introduction

With continual urban development and population expansion, housing prices have increased rapidly in many metropolises, especially in developing economies. High property value affects the disposable income, quality of life, choice of accommodation location and transport needs of urban residents. Many factors, such as building features, location, development density, landscape quality, neighborhood characteristics and public transit accessibility, can influence housing prices [1,2,3,4]. For example, Cui et al. considered the effects of age, size, number of bedrooms and other intrinsic building features of Beijing’s housing [5], and Tan et al. included the floor level and orientation of residential units [6]. However, studies of gated communities as a whole would focus more on extrinsic features such as green ratio, floor area ratio and management fees [7]. Property location in the city also influences housing price. The closer to the CBD and employment centers, the higher is the price [5]. In addition, schools and urban green spaces such as nearby parks provide a better quality of life for the residents to impart a premium effect on housing prices [8,9,10].
The basket of factors often brings different results in different regions [11]. A well-developed public transport system can usually enhance regional accessibility [12] and provide more employment opportunities for the residents [13] to raise property values around stations. Many scholars have focused on the critical impact of public transit accessibility on housing prices, including large and complex metropolises like Beijing. In 2019, Beijing’s population reached 21.54 million [14]. The inordinately high property value and sizeable population have notably affected the disposable income, quality of life and employment choice of residents, which could raise the risk of a financial crisis [15]. Meanwhile, Beijing has a well-developed public transport system, comprising mainly the metro rail system and extensive bus routes. By 2020, it had established over 20 metro lines and over 1000 bus lines. Studying the effect of public transit accessibility on housing prices can in Beijing could offer insights on urban planning and improving the well-being of residents.
Public transit accessibility refers to the convenience of residents using the traffic system, but it can be defined in various ways. It can be measured as the distance or walking time to the nearest public transport stop [4,16] or the number of stops within circular catchment areas [2], which should be determined in relation to study-area characteristics and the public transport type. For example, Yang et al. [10] indicated that the number of bus stops within a 500 m radius of a residential building could indicate accessibility to the bus system in Xiamen. Xu et al. [11] defined the accessibility of Wuhan’s bus stops based on a 10-min walking time, using 800 m as the catchment radius.
The choice of other factors of housing prices also influences the accuracy of the findings, especially the often ignored effect of urban spatial structures such as subcenters [17]. This omission may constitute an important research gap. Urban development, driven by various factors such as accessibility, policy and economy, often generates subcenters. Thus, monocentric cities could experience gradual spatial structure transformations to become polycentric [18]. Employment opportunities are more concentrated in the subcenters than nearby areas [18,19], and the surrounding land-price distribution satisfies the land rent curve similar to the patterns in the monocentric center [20]. Ottensman et al. [21] found that a model considering residents’ accessibility to subcenters had better explanatory power for housing prices in Marion County, FL, USA. Qin and Han [17] also verified the impact of multiple employment subcenters on housing prices in Beijing. Some large cities in China have also planned subcenters in order to solve the economic, environmental and social problems caused by excessively compact structures to foster sustainable urban development [22]. Therefore, urban polycentricity should be considered in studying the impact of accessibility on housing prices.
Model development is an important way to analyze the impact of public transit accessibility on housing prices. Global models are frequently applied in recent cognate studies, including the ordinary least squares (OLS)-based hedonic pricing model (HPM), spatial lag model (SLM), and spatial error model (SEM) [13], using data from all sample sites to construct one model reflecting the average condition. The HPM, which can reflect the influence of commodity attributes on its price, is the most widely used [23]. HPM employs the traditional linear regression based on ordinary least squares (OLS) [7,16,24,25,26]. The OLS model can exclude other factors like surrounding schools when estimating the impact of public transit accessibility on housing prices.
However, the research problems of inherent spatial dependence and spatial heterogeneity of housing prices should be considered in data analysis. Thus some researchers used special techniques such as the SLM, SEM and geographically weighted regression (GWR) model. For example, Sisman and Aydinoglu [23] used SLM, SEM and GWR to remove the effects of spatial dependence to evaluate variables affecting housing prices in Istanbul, Turkey. These alternative models usually yield better results than the traditional OLS model [13,27].
Moreover, the impact of public transit accessibility on housing prices varies spatially. For example, Nie et al. [28] found the premium effect within 100 m of a Shenzhen subway station was higher than in the surrounding areas. Feng et al. [29] found the effect on residential prices was not significant after 2 km from the transport facility in Beijing. Yang et al. [30] found a difference in premium effects between suburban and urban areas. Due to the city’s uneven distribution of public transport provision and the differences in urban development, cultural background and other factors, the trade-offs between the positive impact and the negative externalities of public accessibility vary within districts and cities [1,6,7,12,16]. Therefore, the global models cannot elicit the essential spatial differences. On the other hand, the GWR model can calculate the regression coefficients of each sample site to show the local differences. After mapping the spatial differences and changing trends, the influence of public transit accessibility on housing prices can be elucidated [12,16]
Studies on the impact of Beijing’s rather mature public transport system on housing prices focused on the subway’s effect on price appreciation [13,16,29]. Some studies found notably higher property prices around Beijing’s Bus Rapid Transit (BRT) stations [31] and compared the BRT effect on premiums with rail transit [32]. There are also studies analyzing the spatially heterogeneous impact of public transit accessibility on housing prices in Beijing. For example, some researchers found that the suburban metro had a greater value-added effect along the Beijing Batong line [16,33]. However, the above studies used global models such as the traditional HPM and divided the city into artificial parts to calculate their regression coefficients. The critical effect of spatial variations and trends vis-a-vis administrative precincts remained unclear. These studies also treated Beijing as a monocenter city without considering the increasingly complex spatial structure. Conversely, some studies adopted a reverse approach using the city’s spatial patterns of housing prices to test its urban polycentricity [22].
Overall, the spatial differences in the effect of public transport accessibility on housing prices and the context of polycentricity have received little attention. This study intends to analyze the impact of public transit accessibility on housing prices in Beijing under the polycentric scenario. We selected the areas around several metro lines with similar opening times. We adopted the OLS regression and GWR methods to construct the monocentric and polycentric models. We then assessed and chose a model to match Beijing’s present transport system as the analytic tool. This project could offer methodological support for studying the relationship between public transit accessibility and housing prices in the context of China’s urban polycentrism. It could improve understanding of the underlying factors and make projections on housing price trends in large cities. The findings could also inform the design of public transport infrastructures to align with Beijing’s local conditions and development policies.
This paper is structured as follows: Section 2 explains the study area, data source and models used in this study. Section 3 presents the results of HPM and GWR models constructed under monocentric and polycentric assumptions, respectively. Then we compared the spatial distribution of the premium effect of public transport accessibility. In Section 4, we compared the model results and provided recommendations on public transit planning in Beijing.

2. Materials and Methods

2.1. Study Area

The metro has significantly shaped residents’ housing choices [13,14]. This study mainly considered the influences of the metro and bus accessibility on housing prices in Beijing. The metro lines’ opening year may bring different influences on housing prices. Therefore, we selected as study areas metro lines 6, 7, 9 and 14, which opened in a small time window in 2011–2014. Running from east to west, these lines extend from the city center to the suburbs, covering most areas within the sixth ring road. The transport stations are dense in the city center, getting progressively sparse in suburban areas.
A monocentric model and a polycentric one were developed. Their regression results were evaluated to choose one to suit Beijing’s current development pattern. Then, the critical effects of public transit accessibility on housing prices were analyzed (see Figure 1).

2.2. Data Sources

In building the models, the whole residence was selected as a sample unit, and the dependent variable was the average housing price. The main explanatory (independent) variables were divided into four residence factor sets [1,2,34,35] (Table 1): public transport accessibility, building features, location characteristics and neighborhood amenities. The first variable set, public transport accessibility, included bus accessibility, metro accessibility and distance to the nearest metro station (Table 1). The walking speed is about 80 m/min, and the bus accessibility was expressed as the number of bus stops within an 800 m radius around the residence [23]. The Planning and Design Standards for Urban Residential Areas of China stipulates that most public facilities, including public transport stations, should be provided within a 15-min walking distance from the urban residence [2]. Therefore, the metro accessibility was expressed as the number of metro stations within a 1200 m radius. The second variable set was the building features, including building age, property management fee, greening cover and plot ratio. The third set was the location characteristics. If Beijing was assumed as a monocenter city, the distance from the residence to Tiananmen Square (the city center) was measured. If Beijing was reckoned as a polycentric city, the distance from the residence to the nearest subcenter was measured. The monocentric model applied the distance to Tiananmen Square as an independent variable, while the polycentric model used distance to the nearest subcenter. The last variable set was the neighborhood amenities, including the distance to the nearest public primary or secondary school, non-profit polyclinic hospital, market and park.
The data needed for this study were mainly obtained with the help of the Python Web Crawler [34]. Housing prices of residences and data on building features along metro 6, 7, 9 and 14 lines were obtained from the Beijing Anjuke website [35]. Finally, the data of 1474 residences (gated communities with multi-storied apartment blocks) were captured. The locations of the residences and employment subcenters and the distances from residences to schools, hospitals, markets and parks were measured on Baidu maps [36]. The distances from the residences to Tiananmen Square and the employment subcenters were calculated using ArcGIS 10.6. The assembled data were used to build the OLS and GWR regression models to quantify the contributions of the explanatory variables to housing prices [37].

2.3. Data Analysis

2.3.1. Ordinary Least Squares (OLS) Regression

The OLS models used in this article were constructed as follows:
p i = α 0 + α 1 · T i + α 2 · C i + α 3 · L i + α 4 · N i + ε i
where:
  • p i : the average housing price of ith residence;
  • α 0 : the constant estimated for the model;
  • α 1 , α 2 , α 3 , α 4 : the coefficients of public transport accessibility, building features, location characteristics and neighborhood amenities.
  • T i : the public transport accessibility variable of ith residence;
  • C i : the building features variable of ith residence;
  • L i : the location characteristics variable of ith residence;
  • N i : the neighborhood amenities variable of ith residence
  • ε i : random error.
Before using the OLS tool to construct the regression models, the stepwise regression analysis in SPSS 16.0 was used to eliminate the variables with no significant contribution to the housing price variable, setting the rejection probability at 0.05 and 0.1. To reduce the effect of heteroscedasticity and unify the variables’ orders of magnitude, we log-transformed housing price and other variables (except the number of traffic stations) to construct the following equation. The variables kept in building the log-transformed monocentric model included (Table 2): bus accessibility, metro accessibility, property management fee, plot ratio, building age, park accessibility and city center accessibility. For the polycentric model, distance to the city center was replaced by distance to the nearest subcenter, and the distances to the school and hospital were added.

2.3.2. Geographically Weighted Regression (GWR)

The GWR model was constructed as follows [1]:
p i = α 0 ( u i , v i ) + k = 1 n α k ( u i , v i ) · x i k + ε i ,   i = 1 , 2 , ,   n
where,
  • u i , v i : the coordinates of ith residence;
  • p i : the average housing price of ith residence;
  • α 0 ( u i , v i ) : the constant;
  • x i k : the kth explanatory variable of ith residence;
  • α k ( u i , v i ) : the coefficients of x i k ;
  • ε i : the random error;
  • n: sample number.
After building the correct OLS model, it was necessary to ensure enough sample points (units) and select the variables for the GWR model. We used data from all sample sites to construct a global OLS model. The regression models were built for each of the sample sites. The local coefficients α k ( u i , v i ) were usually estimated using a weighted least square:
α ^ ( u i , v i ) = [ X T W i X ] 1 X T W i P
where,
  • α ^ ( u i , v i ) : the estimated value of the regression coefficient column vector (p × 1) at ( u i , v i ) ;
  • X : the explanatory variable for the sample point (n × p);
  • W i : the spatial weight matrix (n × n) based on the principle of distance attenuation;
  • P : the housing prices column vector (n × 1) for the sample point.
The spatial weight matrix can exert a notable influence on the GWR model. Therefore, an appropriate spatial weight matrix is usually constructed using the bandwidth selected by the Akaike information criterion (AIC) [12]. In this study, the R2 and AICc (corrected AIC) were used to evaluate the model construction and select the optimal model. Better results would be simulated with a smaller value of AICc [38].

3. Results

3.1. Performance of Monocentric and Polycentric OLS Models at the Global Scale

The regression coefficients from the OLS model are shown in Table 2. All the selected variables were significant at p < 0.05. The adjusted R2 and AICc of the monocentric and polycentric models were 0.43 and 92.77 and 0.29 and 425.54, respectively. The monocentric model, with a larger adjusted R2 and a smaller AICc l, was more effective in assessing the impact of public transport accessibility on housing prices. The VIFs of the selected variables in both models were much smaller than 10, indicating no obvious multicollinearity among the explanatory variables at the global scale. We also tested the magnitude of the spatial autocorrelation of the residuals by Moran’s I. The results showed that OLS models could not deal with the spatial autocorrelation problem.
The standardized coefficients of the two OLS models indicated that public transport accessibility contributed to raising the housing prices at the global scale (Table 2). Both models’ standardized coefficients of metro accessibility and bus accessibility were significantly positive. The standardized metro accessibility coefficients were larger than bus accessibility in both models. The coefficients of bus and metro accessibility in the monocentric model and the polycentric model were 0.06, 0.09 and 0.05 and 0.21. The magnitude of transport accessibility coefficients showed a descending sequence: polycentric metro > monocentric metro > monocentric bus > polycentric bus. Thus, residences with more metro stations and bus stops nearby had higher housing prices under both assumptions. Metro accessibility had a stronger influence on housing prices than bus accessibility. In addition, housing prices tended to increase as the residences got closer to schools, hospitals, parks and urban centers. The standardized coefficients for distance to schools and parks were −0.10 and −0.15 in the polycentric model. The coefficients for distance to park accessibility were negative in both models, while the market accessibility was eliminated. Hence, parks have the most stable ability to boost housing prices among all the amenities. Moreover, the standardized coefficients showed the distance to the city center had a larger premium effect than subcenters. Thus from a global viewpoint, Beijing should still be considered a monocentric city.

3.2. Performance of Monocentric and Polycentric GWR Models

The GWR model was also constructed under monocentric and polycentric assumptions. The local regression coefficients of the two GWR models are shown in Table 3 and Table 4, respectively. For the metro accessibility coefficients, except for the negative minimum value, the maximum, mean and quartile values were all positive in both models. The mean coefficient was 2066.63 in monocentric models and 1553.1 in polycentric models. Thus, increasing a metro station near residences can raise the average housing price. The average coefficient of bus accessibility was 169.30 in monocentric models and −268.40 in polycentric models. Compared with metro accessibility, the maximum and upper quartile of bus accessibility were much lower (Table 3 and Table 4), indicating that the residents’ demand for metro stations was higher than that for bus stops in some parts of the study area. However, the average coefficients of both variables were similarly close to zero, indicating great spatial difference of the effects of public transit. The role of the building features on housing prices was more consistent with our expectations: residences with a higher property management fee and a lower plot ratio tended to have higher housing prices. The mean coefficients of the amenity factors also showed relatively stable premiums. For example, in the monocentric model, the coefficient of distance to a park had a negative mean value of −0.012, meaning residences near a park would command higher prices. In the polycentric models, the average coefficients of distances to school, hospital and park were all negative, namely −0.003, −0.008 and −0.010.
The monocentric GWR model’s adjusted R2 and AICc were 0.805 and −1021.558; the polycentric GWR model’s adjusted R2 and AICc were 0.805 and −876.125. The Moran’s I indicators were close to 0, indicating nearly no spatial autocorrelation compared with the OLS model. Thus, the GWR models could explain the housing price changes better than the OLS models. In addition, the performance of the two GWR models was basically the same. Although the monocenter model had a smaller AICc, the two models were consistent in adjusted R2. The effect of the polycentric model was also better in terms of local R2.

3.3. Spatial Patterns of the Premiums of Public Transit Accessibility

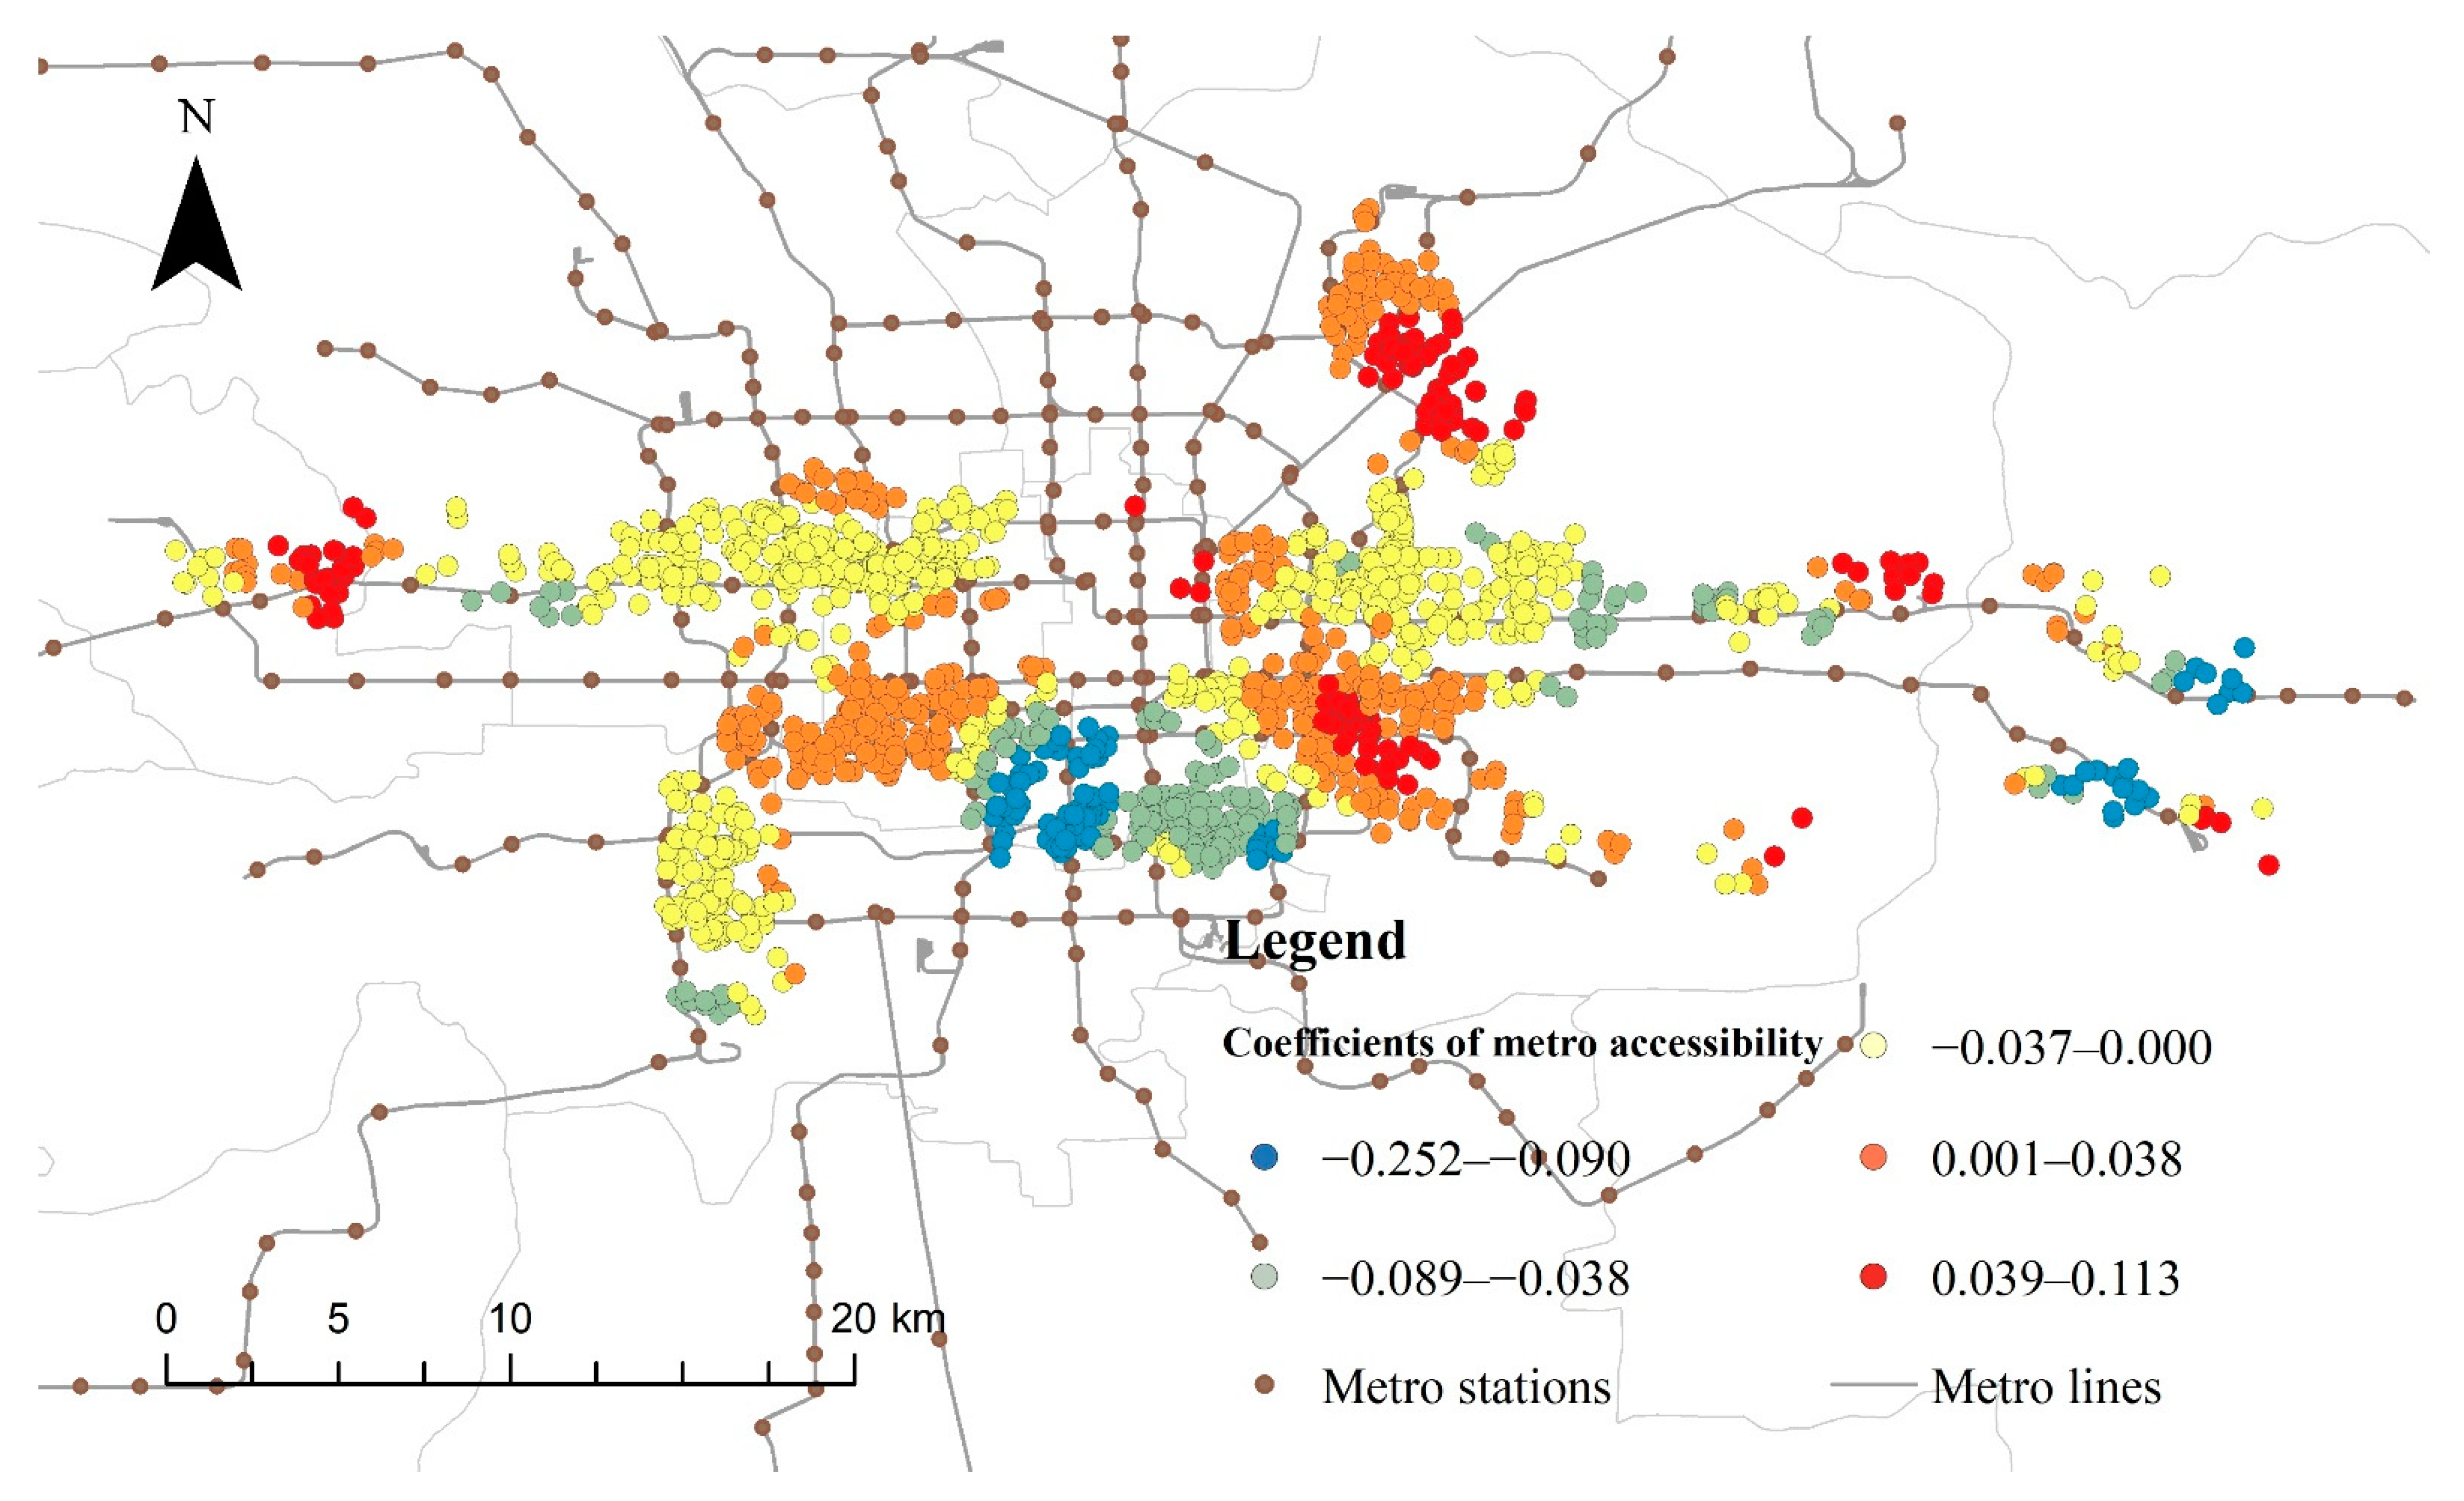
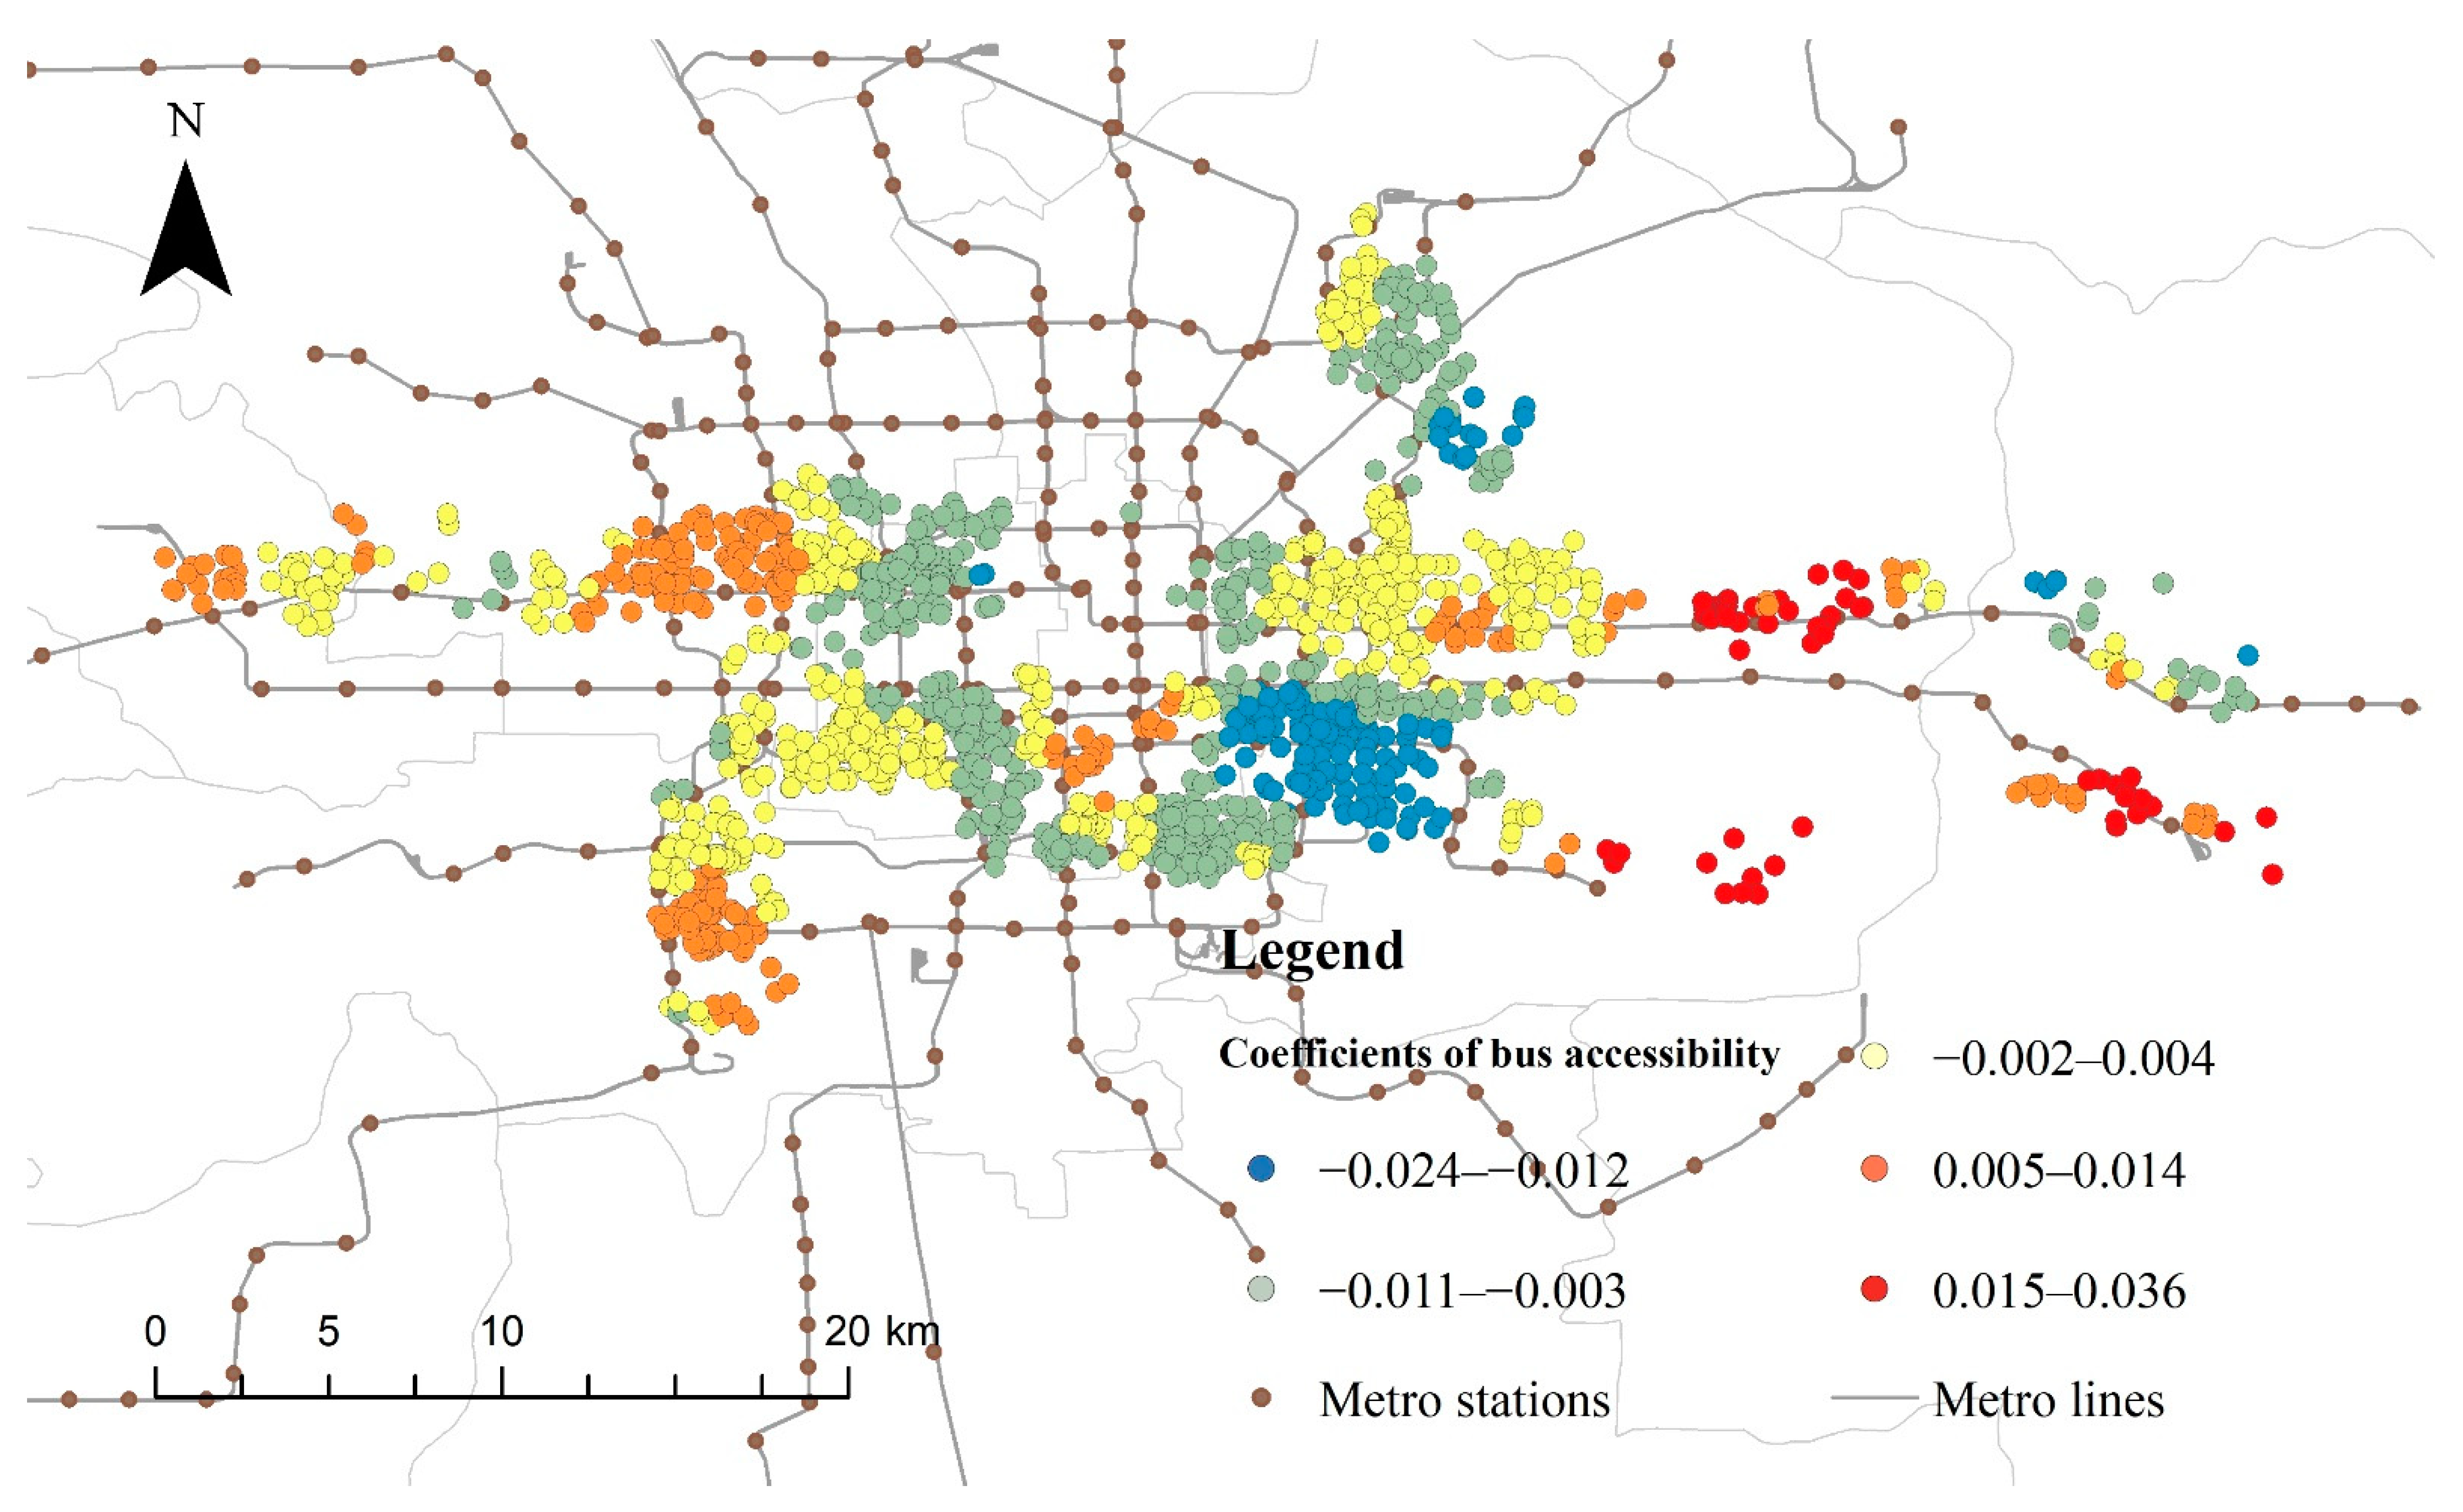
The spatial pattern of the premiums of public transit accessibility was different in monocentric and polycentric models, mainly related to metro accessibility coefficients. Figure 2 and Figure 3 show the spatial difference in the monocentric models’ housing price premiums for metro and bus accessibility. Most sample sites’ metro accessibility coefficients were positive under the monocentric assumption. They were relatively higher in the northeast and central-east of Beijing than in other places. The coefficients of bus accessibility showed a different spatial pattern, the west part had somewhat higher coefficients, but the hot spot was in the east along lines 6 and 7. It also showed a circular distribution of the bus accessibility coefficient around the city center. The coefficients of areas far from the city center were generally larger than 0.
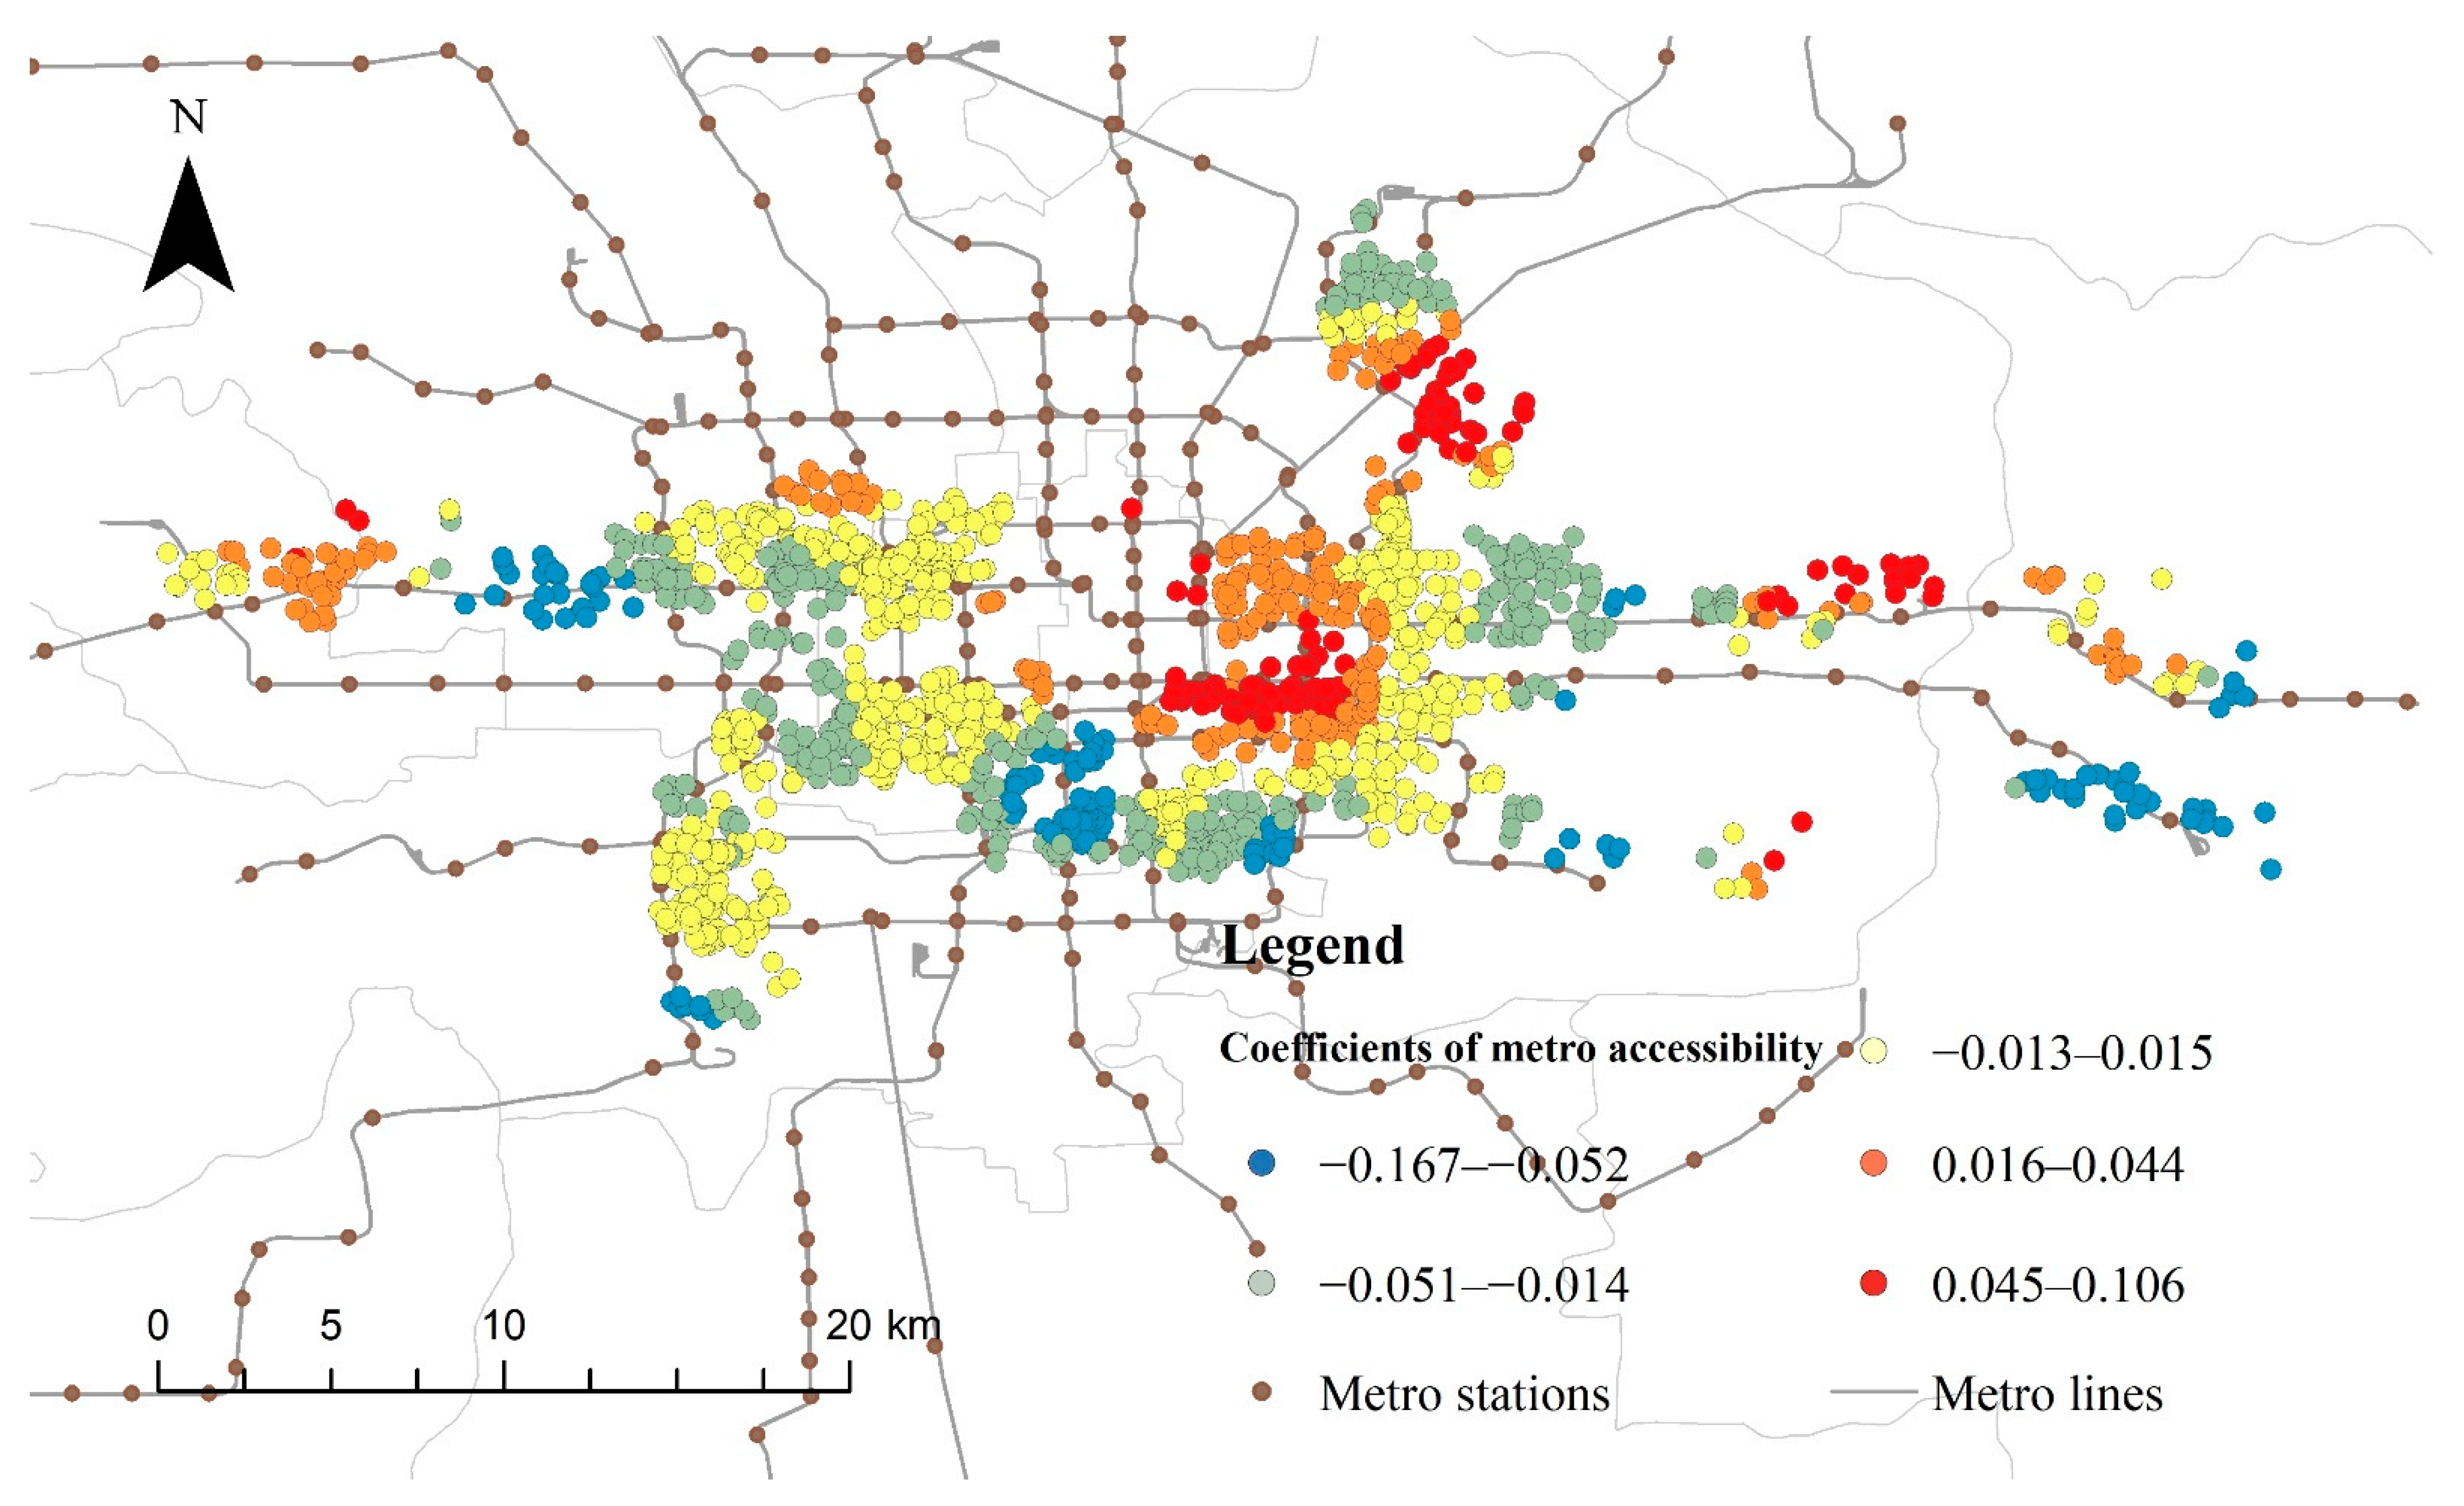
Figure 4 shows that most sample sites’ metro accessibility coefficients were positive under the polycentric assumption. The bus accessibility coefficients also exhibited a circular distribution (Figure 5). The coefficient was generally smaller, close to the city center, and smaller than that of metro accessibility. Thus, metro accessibility increased housing prices to a greater extent. Overall, the metro accessibility coefficients tended to be higher in the east and lower in the west, and the high values were mainly concentrated in the Dongcheng and Chaoyang Districts. The metro to the east of the city center and northeast suburbs demonstrated the largest value-added effect on housing prices (Figure 4). The bus accessibility coefficients indicated the circular pattern, with high coefficients occurring in the east and Tongzhou districts. Figure 4 showed evident spatial trends: the metro accessibility coefficients of line 6 gradually increased from urban to suburban areas. Thus, in the suburb, both metro and buses have stronger effects on increasing housing prices.

4. Discussion

4.1. Comparison of OLS and GWR Regression Models

In this study, we identified the areas around Beijing’s metro lines 6, 7, 9 and 14 as the study area. We constructed OLS and GWR regression models based on the hedonic pricing theory to discuss the impact of public transit accessibility on housing prices in the context of urban polycentricity and to demonstrate the intra-city spatial heterogeneity of the effects. The results showed that public transport accessibility had premium effects on neighborhood housing prices at the global scale, and the impact of metro accessibility was significantly stronger than bus accessibility. In addition, the results of all models showed that residences with a higher property management fee, lower plot ratio, and accessibility to city centers, parks and schools tended to have higher housing prices. Accessibility to shopping malls did not bring significantly increase housing prices.
Comparing the OLS and GWR model coefficients, the GWR model had better fitting results in monocentric and polycentric contexts (Table 3 and Table 4), mainly due to its ability to address the spatial non-stationarity of the premium effect [39]. GWR could also reduce the effect of spatial autocorrelation and the associated violation of OLS assumptions [40]. The OLS model used data from all sample sites to build one single model, which ignored the spatial variations in the impact of various factors at different locations. On the other hand, the GWR model fully used spatial information and could build a suitable model for each sample site, thus better explaining the housing prices.
The GWR model results were more complex. For model coefficients, it had better fitting results under the monocentric assumption. In both models’ results, the coefficients of bus accessibility were higher on the periphery of the city center. The premium effect of bus accessibility was more significant in the Tongzhou district (an eastern suburb of Beijing). In addition, the spatial distribution of the metro accessibility’s premium effect was similar in the two GWR models, and the hotspots were both in the east (Figure 2 and Figure 4). In the monocentric model, the hotspot of the metro accessibility’s premium effect occurred in the area east of the city center and the northeastern part. In the polycentric model, the coefficient was slightly lower. It can be assumed that the premium effect of the metro on housing prices was more significant in this part of Beijing.
The GWR model was constructed in the monocentric scenario to assess the factors on the housing prices in Beijing. The spatial pattern of the metro premium effect was consistent with the previous study [41]. However, there has been no study to confirm the polycentric GWR model. Therefore, our findings could inform the development of public transportation facilities and residents’ traveling modes in different parts of Beijing.
According to the 2018 Big Data Urban Activity Report of Beijing, the radiation circle of the eastern metro stations in Beijing is larger and more developed [42]. The east metro stations selected in the study have larger passenger flows [43], implying that more residents in the east rely on the metro for travel. Thus, they may attach more importance to properties with better metro accessibility. It is consistent with the GWR model. Meanwhile, the vicinity of metro stations can attract more retail and restaurant services [44], improving the surrounding residential amenities and boosting housing prices.
In addition to the significant east–west differences, our results also indicated the premium of public transit accessibility on housing prices between urban and suburban areas. Compared to urban areas, suburban areas have fewer metro lines and bus stations, and the increase in subway lines around residences has a greater effect on local accessibility, bringing a more significant increase in housing prices. Residential prices in western Beijing are more influenced by bus accessibility under the polycentric assumption, possibly due to the more developed bus lines [41] and residents’ greater reliance on buses. These findings are consistent with the results of past studies [6,12]. Combining the spatial distribution of public transit stations and the patterns found in past studies, it is suggested that the spatial pattern of the polycentric model may be more consistent with the actual situation in Beijing. In addition, the effects of building features and location factors suited the reality better in the polycentric model. There were also more amenity factors in the polycentric GWR model that contributed to housing price premiums, including parks, schools and hospitals. At the same time, market accessibility did not elevate the housing prices significantly, consistent with previous studies [16].
Therefore, when evaluating the influence of factors on housing prices at a large spatial scale, Beijing can still be treated as a monocentric city. However, subcenters’ impact needs to be considered when using GWR for analysis, though it has not yet shown a significant impact. This observation may be due to the weaker influence of employment subcenters in Beijing compared to the central CBD and the less pronounced polycentricity when analyzed at the city-wide scale. However, the impact of subcenters on housing prices may be more dominant than the CBD in specific areas, such as suburban areas close to subcenters.

4.2. Differences in Premium Effects of Public Transit Accessibility

There was a significant difference between the premium effects of metro and bus accessibility on housing prices. First, according to the OLS model, public transportation accessibility enhanced the surrounding housing prices, but the metro effect was significantly stronger than the bus. However, the specific effect needs to be verified by other models in future studies, such as SEM and SLM [45]. The GWR model results indicated the unstable effect of bus accessibility at different locations. The premium effect was not evident in some areas, such as Dongcheng and Chaoyang (Figure 3 and Figure 5). This pattern may be due to the difference in service capacity between the two transit systems. The metro has a higher operating speed and can take more passengers. It is also safer, more comfortable and more preferred by residents in commuting and daily travel. In addition, metro routes are rigid, whereas bus routes can be flexibly adjusted, which has a greater impact on the desire to live in the surrounding neighborhoods [46]. Moreover, subway stations have a more notable impact on neighborhood amenities. Subway stations can attract retail shops and restaurants [44] and improve the amenities of the surrounding residential areas. If transit-oriented development (TOD) is planned around a station, it can notably increase the property price [47].
The spatial heterogeneity of the premium effects of different public transit facilities can serve as a basis for development and planning in different areas. Real estate developers can focus on future public transportation developments in suburban areas. They can invest near planned metro and bus lines to take full advantage of the premium effects of public transportation, especially metro stations that raise residential prices. On the one hand, the existing urban areas have little land available for new buildings, while the suburbs can accommodate new developments. In addition, the premium effect of the metro is more significant in the suburbs, so they can focus on the areas around the subcenters of the city, where more developed public transit is usually planned.
From the perspective of urban planning, the primary focus is the public transportation facilities in the suburbs. Suburban public transportation facilities are less dense and dominated by buses. There, more low-income groups rely on public transportation. For areas with relatively high population density, rail transit coverage is needed to reduce social inequality to enhance residents’ well-being [48,49]. In addition to the number of stations, the quality of the public transportation service needs to be improved at the planning stage, such as increasing the number of interchange routes and reducing waiting time, both of which can help improve the price of surrounding residential properties [13].
Moreover, there is a need to enhance attractive amenities around the metro stations and plan the land use around the transportation nodes. The development of TOD can provide more wholesale, retail, restaurant and cultural services [44]. Such developments will improve the residents’ living standards [50], increase their willingness to live in the surrounding areas and, thus, increase property prices [51]. On the other hand, it is also necessary to set a realistic limit on real estate investment around public transportation stations. This planning control can avoid an excessive increase in housing overshooting the supporting facilities, which may degrade the quality of the living environment and transport services, as illustrated by Beijing’s Line 13 [52].

5. Conclusions

This study analyzed and compared the impact of public transport accessibility on housing prices in Beijing under the global and local scenarios using OLS and GWR models. The results indicated that globally both models verified public transport accessibility has value-added effects on housing prices. The bus can be considered a complement to the metro, which usually has less impact on housing prices than the metro and brings more intra-city variations [48]. Locally, housing prices were mainly affected by metro accessibility and bus services, resulting in spatial differences between urban and suburban areas.
According to the adjusted R2, ALCc, Moran’s I and related spatial distribution information, we concluded that the GWR models were superior to the OLS models in understanding the influence of public transport accessibility on housing prices at the more refined local scale [12]. So the GWR model can be used instead of the partial global model in studying public transportation in the future. On the other hand, the better fit of the monocentric model among the two OLS models indicates that housing prices were more strongly influenced by the main center of Beijing than by the employment subcenters when considered at a larger spatial scale. Beijing can still be regarded as a monocentric city in this context. However, this observation deserves further verification with the continual evolution of Beijing’s urban structure. Furthermore, the impact of Beijing’s polycentricity needs to be considered in conducting transport and other local studies.
However, the current polycentric model and the measure of accessibility in the study are still too simple. We only used the Euclidean distance between gated communities and the nearest traffic station or the cumulative number of stations to characterize accessibility. These metrics ignored the difference between the actual trips and the distribution of stations within the buffer. Therefore, other metrics and methods can be used to calculate public transit accessibility in the future. For example, we can use network distance instead of Euclidean distance [53] and the gravity model to assess the distance decay effect [54]. Yang et al. measured accessibility in another way by considering the ease of residents reaching destinations by public transportation. The time to travel to the city centers by bus and frequency of departures as accessibility metrics were evaluated in the research [55]. In future studies, more powerful and accurate methods could be developed to improve understanding.
In addition, a broader spectrum of factors that may affect housing prices could be considered, such as the public transit services, the quality of public and private schools, the provision of large-scale modern shopping malls and the proximity to indoor and outdoor recreational venues. In addition, this study considered the effects of metro and bus accessibility separately and did not consider the synergy of coupled public transportation systems. The innovative urban bus rapid transit (BRT) and other fast non-metro public transport services’ contributions to housing prices deserve to be investigated [31,55,56]. Future studies can distinguish the effects of BRT from conventional bus lines.

Author Contributions

Conceptualization, Y.T.; Funding acquisition, Y.T. and C.Y.J.; Investigation, Y.Z., X.L., J.L. and M.Y.; Methodology, Y.Z., C.Y.J., X.L. and J.L.; Project administration, Y.T. and C.Y.J.; Writing—original draft, Y.Z.; Writing—review & editing, Y.T. and C.Y.J. All authors have read and agreed to the published version of the manuscript.

Funding

The research is supported by the Major Science and Technology Project of High Resolution Earth Observation System (06-Y30F04-9001-20/22) and Project Supported by State Key Laboratory of Earth Surface Processes and Resource Ecology (2022-ZD-02).

Conflicts of Interest

The authors declare no conflict of interest.

References

  1. Gadzinski, J.; Radzimski, A. The first rapid tram line in Poland: How has it affected travel behaviours, housing choices and satisfaction, and apartment prices? J. Transp. Geogr. 2016, 54, 451–463. [Google Scholar] [CrossRef]
  2. Lan, F.; Wu, Q.; Zhou, T.; Da, H. Spatial Effects of Public Service Facilities Accessibility on Housing Prices: A Case Study of Xi’an, China. Sustainability 2018, 10, 4503. [Google Scholar] [CrossRef] [Green Version]
  3. Liebelt, V.; Bartke, S.; Schwarz, N. Urban Green Spaces and Housing Prices: An Alternative Perspective. Sustainability 2019, 11, 3707. [Google Scholar] [CrossRef] [Green Version]
  4. Yu, D. A Spatial Analysis of Real Estate Prices and Public Transportation in the Greater Los Angeles Area; University of Southern California: Los Angeles, CA, USA, 2014. [Google Scholar]
  5. Cui, N.N.; Gu, H.Y.; Shen, T.Y.; Feng, C.C. The Impact of Micro-Level Influencing Factors on Home Value: A Housing Price-Rent Comparison. Sustainability 2018, 10, 4343. [Google Scholar] [CrossRef] [Green Version]
  6. Tan, R.H.; He, Q.S.; Zhou, K.H.; Xie, P. The effect of new metro stations on local land use and housing prices: The case of Wuhan, China. J. Transp. Geogr. 2019, 79, 102488. [Google Scholar] [CrossRef]
  7. Zhang, D.; Jiao, J. How does urban rail transit influence residential property values? Evidence from an emerging Chinese megacity. Sustainability 2019, 11, 534. [Google Scholar] [CrossRef] [Green Version]
  8. Wen, H.Z.; Zhang, Y.; Zhang, L. Do educational facilities affect housing price? An empirical study in Hangzhou, China. Habitat Int. 2014, 42, 155–163. [Google Scholar] [CrossRef]
  9. Wu, C.; Ye, X.Y.; Du, Q.Y.; Luo, P. Spatial effects of accessibility to parks on housing prices in Shenzhen, China. Habitat Int. 2017, 63, 45–54. [Google Scholar] [CrossRef]
  10. Jim, C.Y.; Chen, W.Y. Impacts of urban environmental elements on residential housing prices in Guangzhou (China). Landsc. Urban Plan. 2006, 78, 422–434. [Google Scholar] [CrossRef]
  11. Zietz, J.; Zietz, E.N.; Sirmans, G.S. Determinants of House Prices: A Quantile Regression Approach. J. Real Estate Financ. Econ. 2008, 37, 317–333. [Google Scholar] [CrossRef]
  12. Dziauddin, M.; Powe, N.; Alvanides, S. Estimating the effects of Light Rail Transit (LRT) System on residential property values using Geographically Weighted Regression (GWR). Appl. Spat. Anal. Policy 2015, 8, 1–25. [Google Scholar] [CrossRef] [Green Version]
  13. Li, S.; Chen, L.; Zhao, P.J. The impact of metro services on housing prices: A case study from Beijing. Transportation 2019, 46, 1291–1317. [Google Scholar] [CrossRef]
  14. Beijing Municipal Bureau of Statistics. Beijing Statistical Yearbook 2020; Beijing Municipal Bureau of Statistics: Beijing, China, 2020.
  15. Tan, Z.; Chen, M. International empirical evidence on house price volatility and financial crises: Collateral or deviation effects. J. World Econ. 2012, 35, 146–159. [Google Scholar]
  16. Dai, X.Z.; Bai, X.; Xu, M. The influence of Beijing rail transfer stations on surrounding housing prices. Habitat Int. 2016, 55, 79–88. [Google Scholar] [CrossRef]
  17. Zhang, X.Q.; Zheng, Y.Q.; Sun, L.; Dai, Q.W. Urban Structure, Subway System and Housing Price: Evidence from Beijing and Hangzhou, China. Sustainability 2019, 11, 669. [Google Scholar] [CrossRef] [Green Version]
  18. Dadashpoor, H.; Malekzadeh, N. Driving factors of formation, development, and change of spatial structure in metropolitan areas: A systematic review. J. Urban Manag. 2020, 9, 286–297. [Google Scholar] [CrossRef]
  19. Huang, D.Q.; Liu, Z.; Zhao, X.S.; Zhao, P.J. Emerging polycentric megacity in China: An examination of employment subcenters and their influence on population distribution in Beijing. Cities 2017, 69, 36–45. [Google Scholar] [CrossRef]
  20. Zou, Y.H.; Mason, R.; Zhong, R.J. Modeling the polycentric evolution of post-Olympic Beijing: An empirical analysis of land prices and development intensity. Urban Geogr. 2015, 36, 735–756. [Google Scholar] [CrossRef]
  21. Ottensmann, J.; Payton, S.; Man, J. Urban location and housing prices within a hedonic model. J. Reg. Anal. Policy 2008, 38, 19–35. [Google Scholar]
  22. Liu, Z.; Liu, S.H. Polycentric Development and the Role of Urban Polycentric Planning in China’s Mega Cities: An Examination of Beijing’s Metropolitan Area. Sustainability 2018, 10, 1588. [Google Scholar] [CrossRef] [Green Version]
  23. Xu, T.; Zhang, M.; Aditjandra, P.T. The impact of urban rail transit on commercial property value: New evidence from Wuhan, China. Transp. Res. Part A Policy Pract. 2016, 91, 223–235. [Google Scholar] [CrossRef] [Green Version]
  24. Henneberry, J. Transport investment and house prices. J. Prop. Valuat. Invest. 1998, 16, 144–158. [Google Scholar] [CrossRef]
  25. Bajic, V. The Effects of a New Subway Line on Housing Prices in Metropolitan Toronto. Urban Stud. 1983, 20, 147–158. [Google Scholar] [CrossRef]
  26. Bowes, D.R.; Ihlanfeldt, K.R. Identifying the impacts of rail transit stations on residential property values. J. Urban Econ. 2001, 50, 1–25. [Google Scholar] [CrossRef]
  27. Haider, M.; Miller, E.J. Effects of transportation infrastructure and location on residential real estate values—Application of spatial autoregressive techniques. Transp. Res. Rec. 2000, 1722, 1–8. [Google Scholar] [CrossRef]
  28. Nie, C.; Wen, H.; Fan, X. The spatial and temporal effect on property value increment with the development of urban rapid rail transit: An empirical research. Geogr. Res. 2010, 29, 801–810. [Google Scholar]
  29. Feng, C.; Li, W.; Zhao, F. Influence of rail transit on nearby commodity housing prices: A case study of Beijing subway line five. Acta Geogr. Sin. 2011, 66, 1055–1062. [Google Scholar]
  30. Yang, L.; Chen, Y.; Xu, N.; Zhao, R.; Chau, K.W.; Hong, S. Place-varying impacts of urban rail transit on property prices in Shenzhen, China: Insights for value capture. Sustain. Cities Soc. 2020, 58, 102140. [Google Scholar] [CrossRef]
  31. Deng, T.; Nelson, J. The impact of bus rapid transit on land development: A case study of Beijing, China. World Acad. Sci. Eng. Technol. 2010, 66, 1196–1206. [Google Scholar]
  32. Zhang, M.; Meng, X.; Wang, L.; Xu, T. Transit development shaping urbanization: Evidence from the housing market in Beijing. Habitat Int. 2014, 44, 545–554. [Google Scholar] [CrossRef]
  33. Gu, Y.; Guo, R. The impacts of the rail transit on property values: Empirical study in Batong line of Beijing. Econ. Geogr. 2008, 28, 411–414. [Google Scholar]
  34. Available online: https://www.python.org/ (accessed on 15 January 2021).
  35. Available online: https://beijing.anjuke.com/ (accessed on 1 February 2021).
  36. Available online: https://map.baidu.com/ (accessed on 20 February 2021).
  37. Oshan, T.M.; Li, Z.; Kang, W.; Wolf, L.J.; Fotheringham, A.S. MGWR: A Python Implementation of Multiscale Geographically Weighted Regression for Investigating Process Spatial Heterogeneity and Scale. ISPRS Int. J. Geo-Inf. 2019, 8, 269. [Google Scholar] [CrossRef] [Green Version]
  38. Esri. ArcGIS Help 10.1.; Esri: Redlands, CA, USA, 2013. [Google Scholar]
  39. Brunsdon, C.; Fotheringham, S.; Charlton, M. Geographically weighted regression-modelling spatial non-stationarity. J. R. Stat. Soc. D-Sta. 1998, 47, 431–443. [Google Scholar]
  40. Wang, Q.; Ni, J.; Tenhunen, J. Application of a geographically-weighted regression analysis to estimate net primary production of Chinese forest ecosystems. Glob. Ecol. Biogeogr. 2005, 14, 379–393. [Google Scholar] [CrossRef]
  41. Wu, R. A Research on Spatial Heterogeneity and Affecting Factors of Second-Hand Real Estate Prices in Beijing Based on GWR Model; University of International Business and Economics: Beijing, China, 2018. [Google Scholar]
  42. The 2018 Big Data Urban Activity Report of Beijing. 2022. Available online: https://www.cbndata.com/report/1081/detail?isReading=report&page=7/ (accessed on 20 March 2020).
  43. Zhou, Y.; Zheng, S.; Hu, Z.; Chen, Y. Metro station risk classification based on smart card data: A case study in Beijing. Phys. A Stat. Mech. Its Appl. 2022, 594, 127019. [Google Scholar] [CrossRef]
  44. Lyu, G.; Bertolini, L.; Pfeffer, K. Is labour productivity higher in transit oriented development areas? A study of Beijing. Tijdschr. Voor Econ. En Soc. Geogr. 2020, 111, 652–670. [Google Scholar] [CrossRef]
  45. Sisman, S.; Aydinoglu, A.C. A modelling approach with geographically weighted regression methods for determining geographic variation and influencing factors in housing price: A case in Istanbul. Land Use Policy 2022, 119, 106183. [Google Scholar] [CrossRef]
  46. Eliasson, J.; Kopsch, F.; Mandell, S.; Wilhelmsson, M. Transport Mode and the Value of Accessibility—A Potential Input for Sustainable Investment Analysis. Sustainability 2020, 12, 2143. [Google Scholar] [CrossRef] [Green Version]
  47. Duncan, M. The Impact of Transit-Oriented Development on Housing Prices in San Diego, CA. Urban Stud. 2011, 48, 101–127. [Google Scholar] [CrossRef]
  48. Gu, Y.; Zheng, S. The impacts of rail transit on property values and land development intensity: The case of no. 13 line in Beijing. Acta Geogr. Sin. 2010, 65, 213–223. [Google Scholar]
  49. Huang, D.Q.; Yang, X.Q.; Liu, Z.; Zhao, X.S.; Kong, F.H. The Dynamic Impacts of Employment Subcenters on Residential Land Price in Transitional China: An Examination of the Beijing Metropolitan Area. Sustainability 2018, 10, 1016. [Google Scholar] [CrossRef] [Green Version]
  50. Su, S.; Zhang, J.; He, S.; Zhang, H.; Hu, L.; Kang, M. Unraveling the impact of TOD on housing rental prices and implications on spatial planning: A comparative analysis of five Chinese megacities. Habitat Int. 2021, 107, 102309. [Google Scholar] [CrossRef]
  51. Shen, Q.; Xu, S.M.; Lin, J. Effects of bus transit-oriented development (BTOD) on single-family property value in Seattle metropolitan area. Urban Stud. 2018, 55, 2960–2979. [Google Scholar] [CrossRef]
  52. Zhang, M. Chinese edition of transit-oriented development. Transp. Res. Rec. 2007, 2038, 120–127. [Google Scholar] [CrossRef]
  53. Bhat, C.; Handy, S.; Kockelman, K.; Mahmassani, H.; Chen, Q.; Weston, L. Urban Accessibility Index: Literature Review; U.S. Department of Transportation: Washington, DC, USA, 2000.
  54. Martinez, L.M.; Viegas, J.M. Effects of Transportation Accessibility on Residential Property Values Hedonic Price Model in the Lisbon, Portugal, Metropolitan Area. Transp. Res. Rec. 2009, 2115, 127–137. [Google Scholar] [CrossRef]
  55. Yang, L.C.; Chau, K.W.; Szeto, W.Y.; Cui, X.; Wang, X. Accessibility to transit, by transit, and property prices: Spatially varying relationships. Transp. Res. Part D Transp. Environ. 2020, 85, 102387. [Google Scholar] [CrossRef]
  56. Mulley, C.; Tsai, C. Impact of bus rapid transit on housing price and accessibility changes in Sydney: A repeat sales approach. Int. J. Sustain. Transp. 2017, 11, 3–10. [Google Scholar] [CrossRef]
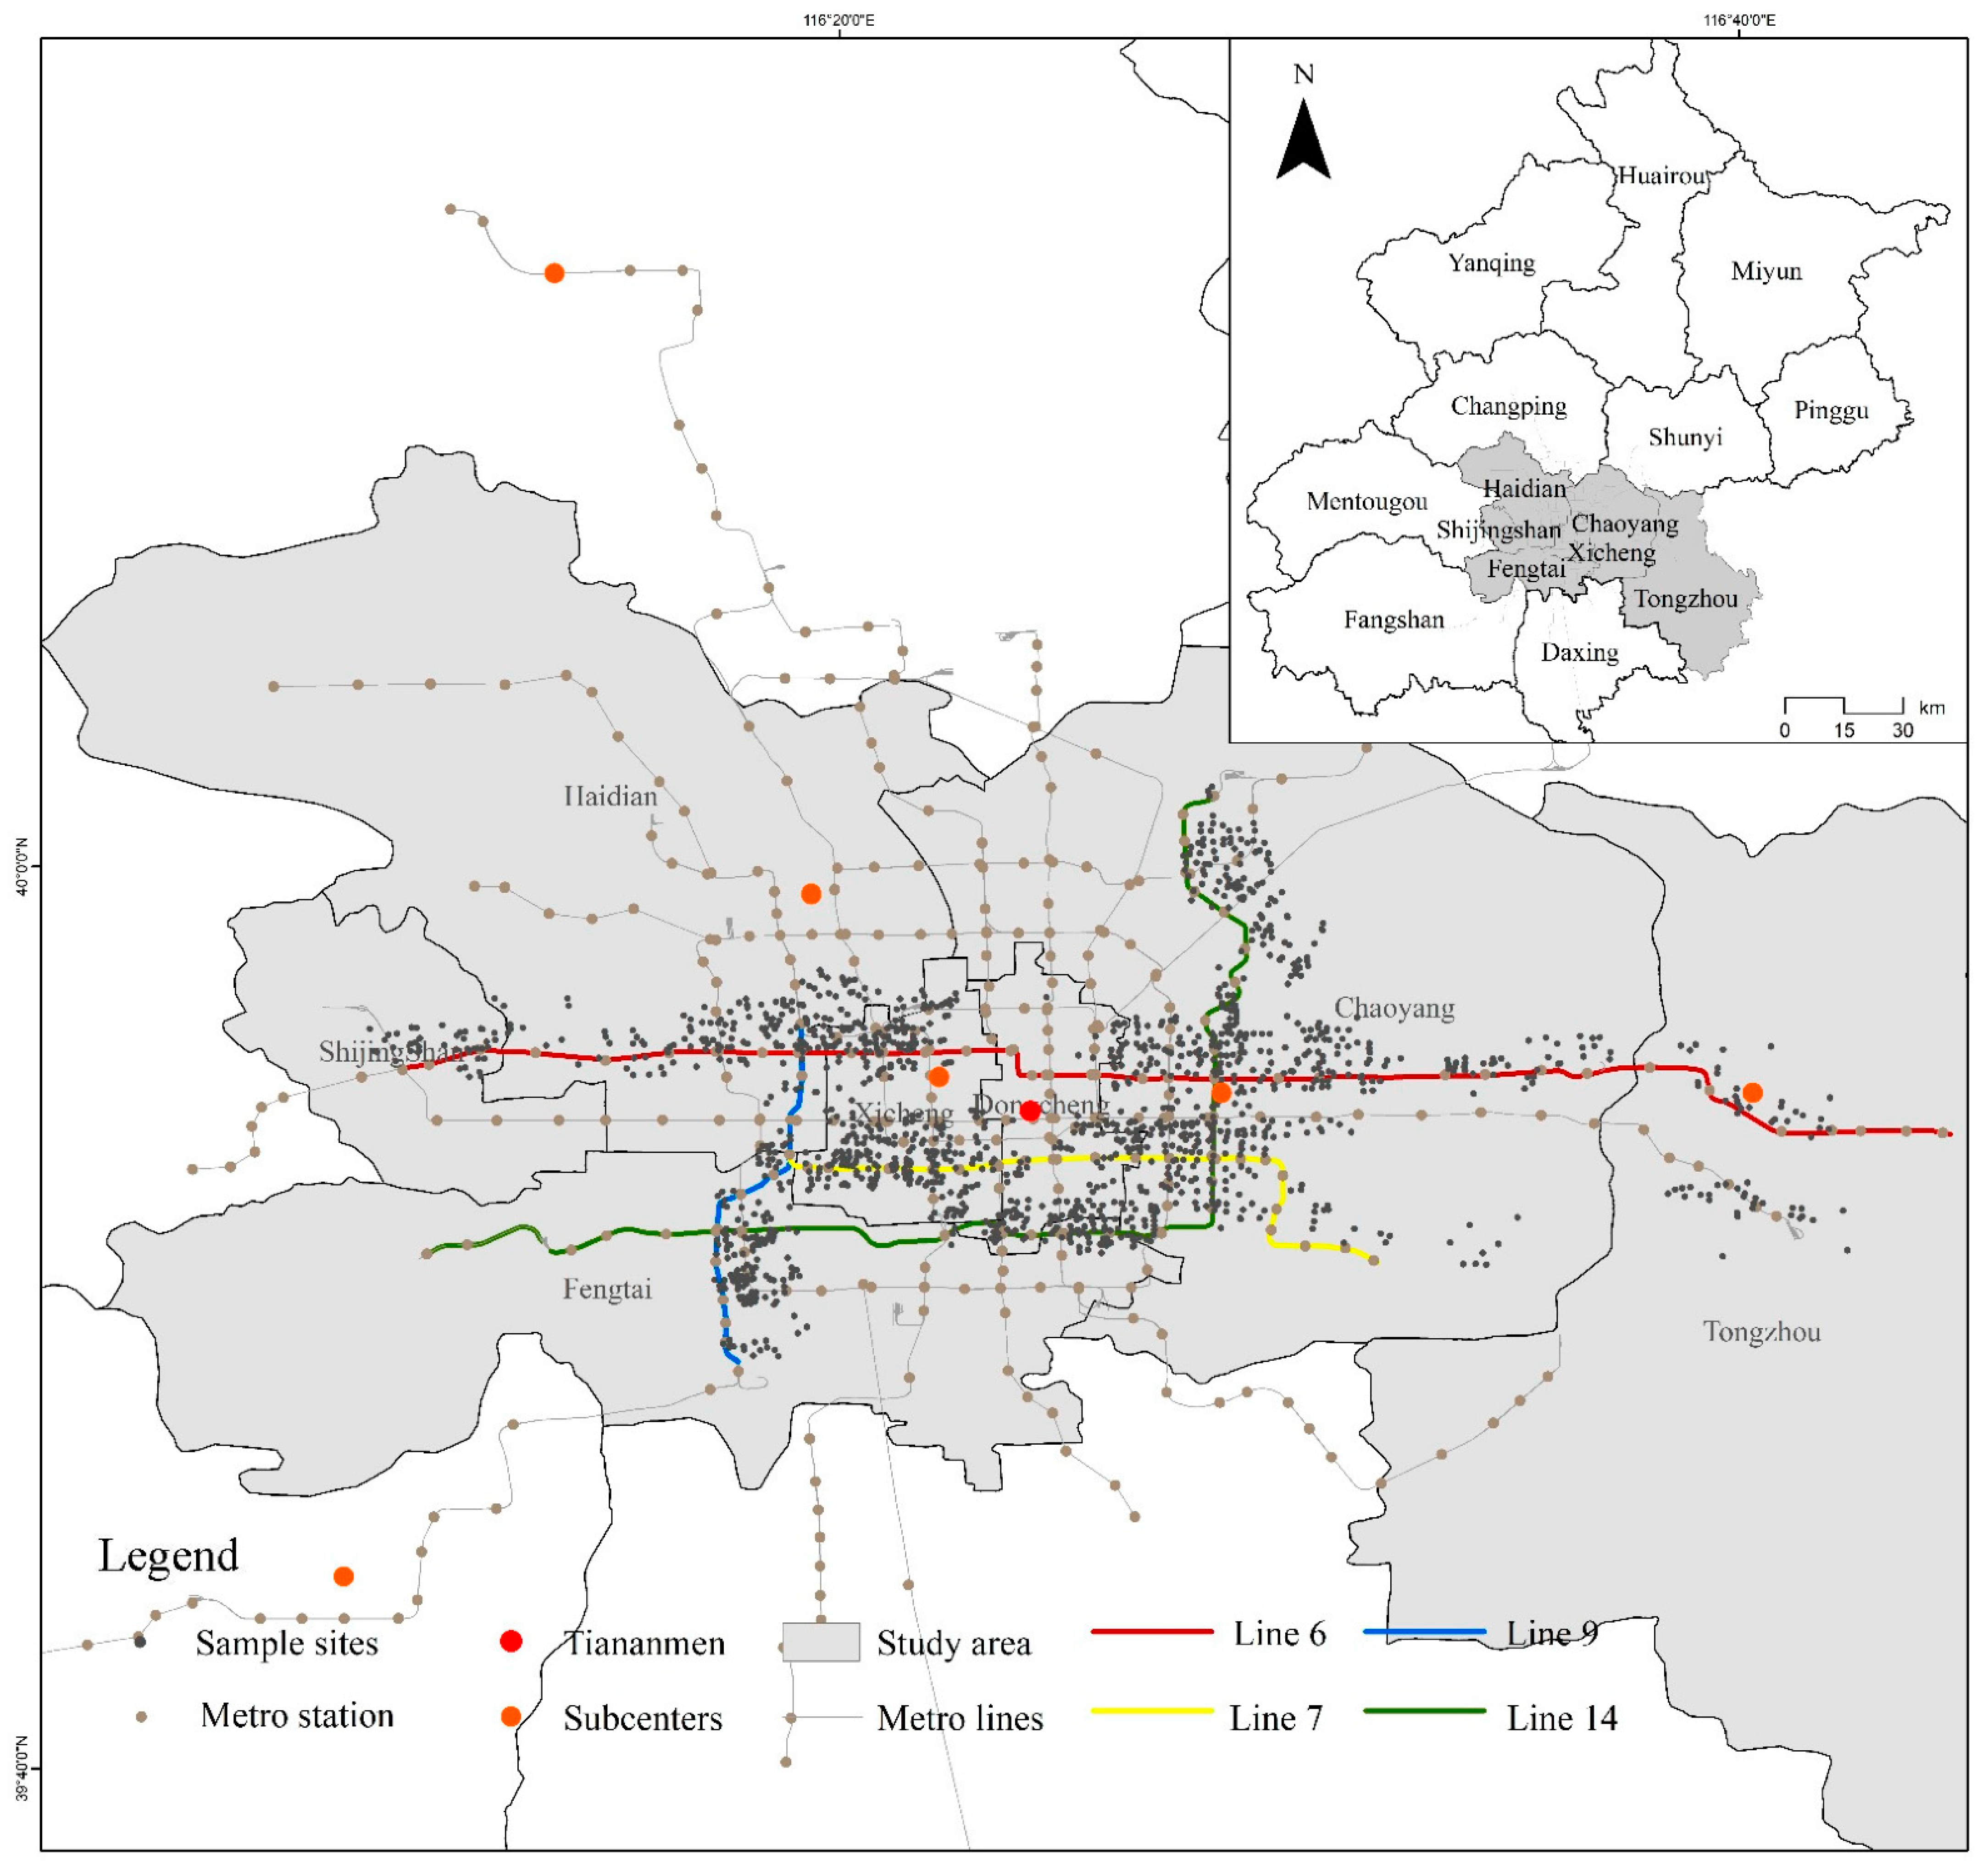
Figure 1. The study area in central Beijing showing the sample site locations, metro stations and lines and urban subcenters. The inset indicates the position of the study area in relation to the whole Beijing metropolis.
Sustainability 14 14743 g001
Figure 2. Spatial distribution of local coefficients of metro accessibility based on the monocentric GWR model.
Sustainability 14 14743 g002
Figure 3. Spatial distribution of local coefficients of bus accessibility based on the monocentric GWR model.
Sustainability 14 14743 g003
Figure 4. Spatial distribution of local coefficients of metro accessibility based on the polycentric GWR model.
Sustainability 14 14743 g004
Figure 5. Spatial distribution of local coefficients of bus accessibility based on the polycentric GWR model.
Sustainability 14 14743 g005
Table 1. The independent variables with potential influence on housing prices.
Variable TypeResidence Factor SetVariable NameExplanationAssumed Effect a
Dependent Housing priceHousing priceHousing price per square meter (Yuan) b
Independent Public transport accessibilityBus accessibilityNumber of bus stops within an 800 m radius+
Metro accessibilityNumber of metro stations within a 1200 m radius+
Distance to metro stationDistance to the nearest metro station (m)-
Building featuresBuilding ageBuilding age by 2022 (year)-
Property management feeResidence property management fee (Yuan)+
Green coverRatio of green space to total site area (%)+
Plot ratioRatio of total above-ground floor area to total site area (%)-
Location characteristicsDistance to monocenterDistance to Tiananmen Square (m)-
Distance to subcenterDistance to the nearest subcenter (m)-
Neighborhood amenitiesDistance to schoolDistance to the nearest public school (m) c-
Distance to hospitalDistance to the nearest non-profit hospital (m)-
Distance to marketDistance to the nearest market (m) -
Distance to parkDistance to the nearest park (m)-
a “+” means positive correlation; “-” means negative correlation; b The Chinese currency Renminbi, with an exchange rate on 1 January 2022, at US$1.00 = 6.27 Yuan; c Including both primary and secondary schools.
Table 2. Global coefficients of monocenter and polycenter models based on ordinary least square (OLS) regression analysis.
VariableMonocentric ModelPolycentric Model
Coefficient a,bStandardized CoefficientsVIF b,cCoefficient a,bStandardized
Coefficients
VIF b,c
Bus accessibility0.01 *** 0.06 *** 1.05 0.00 ***0.05 **1.08
Metro accessibility0.03 *** 0.09 *** 1.19 0.07 ***0.21 ***1.11
Distance to metro station######
Building age−0.05 *** −0.07 *** 1.17 −0.04 ***−0.06 ***1.19
Property management fee0.11 *** 0.24 ***1.29 0.11 ***0.25 ***1.08
Green cover#### #
Plot ratio−0.09 ***−0.12 ***1.17 −0.06 ***−0.08 ***1.17
Distance to monocenter−0.34 *** −0.55 ***1.27 # #
Distance to polycenter###−0.14 ***−0.26***1.16
Distance to school###−0.05 ***−0.10 ***1.09
Distance to hospital###−0.07 ***−0.15 ***1.08
Distance to market######
Distance to park−0.05 *** −0.09 ***1.04 −0.07 ***−0.14 ***1.04
 Constant14.62 *** ##13.54 ***##
 Adjusted R20.43 0.29
 AICc d92.77 425.54
Moran’s I for residuals e0.579 0.628
a Significance level: *** p ≤ 0.01 and ** 0.01 < p ≤ 0.05; b “#” indicates that the variable is excluded or the corresponding coefficient does not exist; c VIF denotes variance inflation factor, which measures the severity of multicollinearity in the ordinary least square regression analysis. VIF < 3 is considered a low correlation amongst variables; d AICc denotes the revised Akaike Information Criterion used to identify the optimal model; e Moran’s I for residuals tests the spatial autocorrelation of the regression residuals.
Table 3. Descriptive statistics of local regression coefficients in the monocentric geographically weighted regression (GWR) model.
VariableMeanMaximumMinimumStandard DeviationLower QuartileMedianUpper Quartile
Metro accessibility−0.011 0.113 −0.252 0.044 −0.028 −0.007 0.014
Bus accessibility−0.001 0.037 −0.025 0.008 −0.006 −0.002 0.003
Property management fee−0.069 0.178 −0.366 0.064 0.052 0.079 0.119
Plot ratio0.084 0.279 −0.049 0.050 −0.109 −0.065 −0.031
Building Age−0.073 0.119 −0.370 0.066 −0.110 −0.073 −0.021
Accessibility to park−0.012 0.152 −0.411 0.063 −0.038 −0.010 0.020
Accessibility to monocenter−0.410 1.065 −3.583 0.329 −0.582 −0.380 −0.285
Intercept15.227 49.809 2.472 3.131 14.020 15.006 16.590
Local R20.616 0.977 0.299 0.124 0.539 0.604 0.694
Adjusted R20.805
AICc−1021.558
Moran’s I for Residual0.041
Table 4. Descriptive statistics of local regression coefficients in the polycentric geographically weighted regression (GWR) model.
VariableMeanMaximumMinimumStandard DeviationLower QuartileMedianUpper Quartile
Metro accessibility−0.004 0.106 −0.167 0.035 −0.022 −0.002 0.014
Bus accessibility−0.002 0.036 −0.024 0.008 −0.006 −0.002 0.002
Property management fee0.082 0.237 −0.048 0.051 0.048 0.074 0.120
Plot ratio−0.071 0.189 −0.427 0.064 −0.107 −0.072 −0.033
Building Age−0.073 0.075 −0.401 0.065 −0.114 −0.074 −0.021
Accessibility to school−0.003 0.100 −0.102 0.037 −0.027 −0.005 0.014
Accessibility to hospital−0.008 0.137 −0.187 0.049 −0.043 −0.012 0.021
Accessibility to park−0.010 0.131 −0.422 0.064 −0.034 −0.004 0.018
Accessibility to subcenter−0.249 0.165 −0.886 0.239 −0.430 −0.196 −0.050
Intercept13.793 20.367 9.002 1.965 12.387 13.450 15.113
Local R20.638 0.982 0.330 0.118 0.568 0.631 0.710
Adjusted R20.805
AICc−876.125
Moran’s I of Residual0.047
Publisher’s Note: MDPI stays neutral with regard to jurisdictional claims in published maps and institutional affiliations.