Article

Effect of Dimpled Rib with Arc Pattern on Hydrothermal Characteristics of Al2O3-H2O Nanofluid Flow in a Square Duct

1
Mechanical Engineering Department, UPES, Dehradun 248007, India
2
Yogananda School of AI, Computers and Data Sciences, Shoolini University, Solan 173229, India
3
Nanofluids Research Laboratory, Department of Mechanical and Aeronautical Engineering, University of Pretoria, Pretoria 0002, South Africa
4
Department of Medical Research, China Medical University Hospital, China Medical University, Taichung 404, Taiwan
5
CSIR-Central Building Research Institute, Roorkee 247667, India
6
Mechanical Engineering Department, Institute of Engineering & Technology, GLA University, Mathura 281406, India
7
Center of Research, Faculty of Engineering, Future University in Egypt, New Cairo 11835, Egypt
*
Authors to whom correspondence should be addressed.
Sustainability 2022, 14(22), 14675; https://doi.org/10.3390/su142214675
Submission received: 14 October 2022 / Revised: 3 November 2022 / Accepted: 4 November 2022 / Published: 8 November 2022

Abstract

:
The present work is concerned with the experimental analysis of the thermal and hydraulic performance of A l 2 O 3 H 2 O nanofluid flow in dimpled rib with arc pattern in a square duct. The Alumina nanofluid consists of nanoparticles having a size of 30 nm. Reynolds number R e n u m studied in the square duct range from 5000 to 26,000. The nanoparticle volume fraction ( ϕ n p ) ranges from 1.5% to 4.5%, the ratio of dimpled-arc-rib-height to print-diameter H A D / P d ranges from 0.533 to 1.133, the ratio of the dimpled-rib-pitch to rib height P A D / H A D range from 3.71 to 6.71 and dimpled arc angle ( α A D ) range from 35° to 65°. The A l 2 O 3 H 2 O -based nanofluid flow values of Nusselt number N u r s and friction factor f r s are higher in comparison to pure water. The dimpled ribs in the arc pattern significantly improved the thermal-hydraulic performance of the investigated test section. The nanoparticle concentration of 4.5%, the ratio of dimpled arc rib height to print diameter of 0.933, the relative dimpled arc rib height of 4.64 and the dimpled arc angle of 55° deliver the maximum magnitude of the heat transfer rate. The maximum value of the thermal-hydraulic performance parameters was found to be 1.23 for A l 2 O 3 H 2 O -based nanofluid flow in a dimpled rib with arc pattern square duct for the range of parameters investigated. Correlations of N u r s ,   f r s   and   η r s have been developed for the selected range of operating and geometric parameters.

1. Introduction

Heat transfer (HT) is a thermal engineering subject that deals with thermal energy generation, transformation, and transfer [1]. Overall performance can be improved by using various methodologies and techniques, like either increasing the surface of the heat-transferring body or the heat transfer coefficient between the fluid and the surface that allows high heat transfer in a slight capacity [2]. Aside from the solicitation in heat transfer, hybrid nanofluids can also be blended for exceptional electrical, magnetic, chemical, and biological applications [3,4,5,6,7,8]. The great perspective of hybrid nanofluids for the augmentation of thermal energy in various applications leads to the development of effective and compact heat-transferring engineering equipment [9]. Ding et al. conducted several experiments to improve the thermal performance of heat transfer fluids and concluded that in many industrial sectors like power generation and chemical production, traditional heat transfer fluids play an important role. Naseema et al. [10] and Karthikeyan et al. [11] examined the function of thermal conductivity of heat fluid transfer in the development of energy-efficient heat transfer equipment. Their analysis showed that the nonmetallic liquid thermal conductivity is much lesser as compared to the metallic liquids. Dormohammad et al. [12] and Shehzad et al. [13] have shown that natural convection and forced convection are two methods on the basis of which N u and f can be classified, and that is necessary to improve the characteristics of HT so that the energy-saving efficiency in industries is increased. In the experiment, they used solid particles for heat transfer because they possess good conductivity characteristics. Tang et al. [14] investigated the possibility of increasing thermal conductivity by replacing the pure liquid with nanofluid, as nanofluids have better performance in comparison to pure water. Sharifpur et al. [15] and some others [16,17,18,19] concluded that under natural convection, the nanoparticle concentration is a significant factor in the enhancement of HT. Mansoury et al. [20] and Mayeli et al. [21] conducted a parametric investigation to assess HT increase in various heat exchangers containing A l 2 O 3 H 2 O nanofluid and found that by cumulative the solid volume fraction of the   A l 2 O 3 nanoparticles, the average heat transfer increases. Chun et al. [22] observed that a low particle concentration of nanofluids could boost heat conductivity by more than 20%; they also concluded that due to the high concentration of nanoparticles, there is an increase in the average   N u . Ghosh and Mukhopadhyay [23] observed that nanofluid thermo-physical properties are better as compared to conventional heat transfer fluids. Yang et al. [24] reported that as compared to alumina-zirconia/water nanofluid, alumina-water nanofluid has higher N u and lower   f .
Aliabadi and Hormozi [25] concluded that using C u O H 2 O nanofluid instead of the base fluid, N u , as well as f , are both plain and perforated channels have increased. When both heat transfer enhancement approaches discussed in this article are used simultaneously, a significant thermal performance factor of 1.34 is attained. Xuan and Li [26] measured the average N u of A l 2 O 3 H 2 O nanofluid and reported 35% enhancement at 2 vol% of   A l 2 O 3 H 2 O nanofluid. Their analysis showed that the f for the dilute nanofluids consisting of H 2 O and C u nanoparticles is approximately the same as that of H 2 O. Xia et al. [27] investigated A l 2 O 3 and T i O 2 nanofluids in a different microchannel for studying N u and f . It is found that the performance of A l 2 O 3 is better than T i O 2 for 1.0% of the volume fraction. Raei et al. [28] conducted a number of experiments on nanofluids and concluded that the thermal conductivity, as well as the heat transfer coefficient of the base fluid, can be enhanced by using porous metal. Ekiciler and Çetinkaya [29] analyzed the turbulent flow of water-based monotype nanofluid and hybrid nanofluid having a constant 1.0% nanoparticle volume fraction in a duct with rib. Heat transfer, pressure drop, temperature contour, and turbulence intensity were among the parameters studied and evaluated; they discovered that, while the increase in Nusselt number with monotype nanofluid is approximately 18.0%, the increase in Nusselt number with hybrid nanofluid is about 32.0%.
Pourpasha et al. [30] carried out optimization of the parameters affecting the HT coefficient of nanofluids ( A l 2 O 3 / H 2 O , CuO / H 2 O , and Cu / H 2 O ). According to their findings, the optimized parameters increased Nu by 82% for A l 2 O 3 / H 2 O nanofluids. Çobanoglu et al. [31] investigated the result of water-ethylene glycol mixture-based F e 2 O 3 nanofluids (0.01, 0.05, and 0.1 vol.%) on the annular flow propagation and heat transfer in the annuli of a double pipe heat exchanger at the low-pressure side of the refrigeration cycle; they noticed that the highest concentration has the most excellent transferred heat (13.6% increase in performance over the base fluid), the nanofluids with the most negligible concentration have the lowest pressure drop value (25% decrease over the working fluids), and the highest performance evaluation criteria with a tiny increase in exergy destruction (1.45% over the working fluids). Vinoth et al. [32] carried out an experiment with deionized water, A l 2 O 3 / H 2 O nanofluid, and a hybrid nanofluid   A l 2 O 3 / C u O / H 2 O at varying mass flow rates in a curved channel. Findings revealed that the rate of HT curved channel was improved by 11.98% compared to the straight channel. Additionally, the utilization of A l 2 O 3 / C u O / H 2 O hybrid nanofluid increased the rate of heat transfer by 3.5% and 2.1%, respectively, in comparison to water and A l 2 O 3 / H 2 O nanofluid. Fujimoto et al. [33] examined the turbulent HT capability of graphene nanofluids in a horizontal circular tube experimentally and numerically. According to their findings, the N u of graphene nanofluid had an increase of 33% compared to water. Ho et al. [34] experimentally investigated the laminar and forced convection heat transfer by using A l 2 O 3 /PCM nanofluids in a concentric double-tube duct. Heat transfer, pressure drop, thermal and hydraulic performance, and flow parameters were all analyzed and evaluated. According to their findings, a high total flow rate combined with a high concurrent flow ratio can effectively increase heat transfer efficacy. Jalili et al. [35] studied HT convection in a countercurrent double-tube heat exchanger with varied fins and A l 2 O 3 / H 2 O and T i O 2 / H 2 O nanofluids (0.4%, 2%, 4%, 6%). Results revealed that A l 2 O 3 / H 2 O nanofluid has a more excellent convection HT coefficient than T i O 2 / H 2 O and   H 2 O . In addition, increasing nanofluid concentration from 0.4% to 6% increased convection HT by 12%. Huihui Zhang et al. [36] experimentally investigated the pressure-drop, and nanoparticle deposition physiognomies of multiple twisted tapes with partitions in turbulent duct fluid flows using air as working fluid. Penetration tests for nano-sized particles and pressure loss measurements were carried out in the empty duct, and the construction process was fitted with twisted tapes and zones operating at the same pumping power; they revealed that the penetration efficiency of nanoparticles enhanced with nanomaterials diameter and mass flow rate. Omri et al. [37] investigated a novel heat exchanger configuration using CNT-nanofluid and jet impingement with a uniform wall temperature profile. The volume fraction of the selected nanoparticles ranges from 0 to 5%, along with the varying fin’s height. It was concluded that the use of CNT nanofluid significantly enhances the heat transfer rate.
From the literature review, no research has been carried out on square duct heat exchangers using dimpled ribs with arc patterns of roughness on the heat-transferring surface. Thus, utilizing nanofluid and dimpled rib with arc pattern turbulence promotor can significantly improve the thermal performance of the heat exchanger. Hence, the present study aims to analyze the heat transfer experimentally, and friction factor characteristics of a ribbed square duct having a dimpled rib with an arc pattern on the heated wall roughened duct with   A l 2 O 3 H 2 O nanofluid flow. This research fills the lack of experimental research for A l 2 O 3 H 2 O nanofluid flow in a ribbed square duct with dimpled rib with arc pattern.
The primary goals of the current experimental analysis are:
  • To investigate the effect of arc rib pitch, arc flow attack angle, dimpled arc rib, and volume fraction on N u and f with A l 2 O 3 H 2 O nanofluid flow in a ribbed square duct.
  • To determine the prolific dimpled rib with arc pattern and flow parameters for A l 2 O 3 H 2 O nanofluid flow in a ribbed square duct by considering the thermal-hydraulic performance.

2. Rib Parameters

The measurements can describe the rib roughness of arc rib height ( H A D ), the Print diameter of arc rib ( P d ) and the pitch between arcs ( P A D ). Dimensionless roughness parameters have been used to express these parameters, viz., relative arc rib height ( H A D / P d ) , relative rib pitch ( P A D / H A D ) and arc angle ( α A D ). Figure 1 represents the geometry of the dimpled rib arc pattern. Table 1 demonstrates the ranges of dimpled arc rib and flow parameters that are selected in the present investigation for enhancing the thermal performance of the duct.

3. Experimental Setup

The components of the experimental setup are designed following the ASHRAE standards [38], which are discussed in this section, and the experimental test rig is shown in Figure 2. A submersible pump is employed for circulating the fluid through the test section integrated with a flow meter with a changeable area for measurement and controlling the fluid flow in the loop and the test division. The pressure drop during fluid circulation was measured with a differential pressure manometer connected at the inlet and outlet of the test section. The heat was supplied to the test section with an electric heater built of nichrome wire wrapped around a mica sheet. The auto-transformer was incorporated to manage the power supply, and the magnitude of current and voltage were determined by a multi-meter. The temperature of the examination unit was measured at various locations with the help of calibrated T-type thermocouples, and a digital micro voltmeter (DVM) was utilized to display the temperature. The drop in the pressure across the test section during experimentation was recorded by a digital micro-manometer having the least count of 1 Pa. A number of experiments were performed for varying geometric parameter sets of dimpled arcs rib roughness on the heated surface at different flow rates of fluid in the duct to accumulate the experimental data viz. plate temperature, inlet and outlet temperature of nanofluids and pressure drop across the channel test section. All measurements were made under steady-state circumstances. Further, the data reduction has been performed by utilizing the raw data to obtain the heat flow and friction in dimensionless form as a purpose of a system and operating parameters. A condenser is installed after the test section to bring down the temperature of the nanofluid at the ambient level as the nanofluid is circulated in the closed loop.

4. Nanofluid Preparation and Its Thermo-Physical Properties

The A l 2 O 3 H 2 O nanofluid has been prepared for four different volume concentrations of 1.5%, 2.5%, 3.5% and 4.5% by mixing the A l 2 O 3 nanoparticles of 99.9% purity in distilled water. As a surfactant, sodium dodecyl benzene sulphonate was utilized to make A l 2 O 3 / H 2 O more soluble and stable nanofluid with a surfactant to nanofluid proportions of 10:1. Sodium dodecyl benzene sulphonate is a high-content anionic surfactant having good emulsility and dispersity properties as compared to other surfactants. The significance pH for improving the stability of A l 2 O 3 -based nanofluid was attained at 5.0. Better dispersing of nanoparticles in distilled water is required to obtain a homogeneous fluid. The homogenization and sonication of all solutions were carried out in an ultrasonic homogenizer, shown in Figure 3, for three days to reduce particle aggregation and nanofluid sedimentation. The stability of the nanofluid is checked by using a UV-vis spectrometer (Evolution 201). To check the visual stability of nanofluid, Figure 3 shows the photograph of nanofluid taken immediately after preparation as well as after two and then after four days of nanofluid preparation.
Nanoparticles and base fluid properties are used to calculate the thermo-physical parameters of nanofluids. The nanofluid density is calculated using the following relationship [39]
ρ n f = 1 φ ρ b f + φ ρ n p
To compute the nanofluid’s specific heat following equation is obtained [39]:
ρ C p n f = 1 φ ρ C p b f + φ ρ C p n p
The following correlations are used to affect the nanofluid’s thermal conductivity [40,41]:
k e f f = k s t a t i c + k B r o w n i a n
k s t a t i c = k b f k n p + 2 k b f 2 φ k b f k n p k n p + 2 k b f + φ k b f k n p
k B r o w n i a n = 5 × 10 4 β φ ρ b f C p , b f K T 2 ρ n p R n p f T , φ
where   K B o l t z m a n n   c o n s t a n t = 1.3807 × 10 23   J / K ,   T is the temperature, and β is the portion of the liquid volume that travels with particles. The value of β = 8.4407 100 φ 1.07304 for A l 2 O 3 particles.
Modeling,
f T , φ = 2.8217 × 10 2 φ + 3.917 × 10 3 T T o + 3.0669 × 10 2 φ 3.91123 × 10 3
For 1 % φ 4 % and   300   K < T < 325   K ,   T 0 = 293   K .
The following empirical relation is used to calculate dynamic viscosity [42]:
μ e f f = μ b f × 1 1 34.87 ( d n p / d f ) 0.3 × φ 1.03
d f = 6 M N π ρ b f 1 / 3
where M is the base fluid’s molecular weight, N = 6.022 × 10 23   mol 1 is the Avogadro number, and ρ b f is the base fluid’s mass density at   T 0 = 293   K .

5. Validation of Experimental Setup

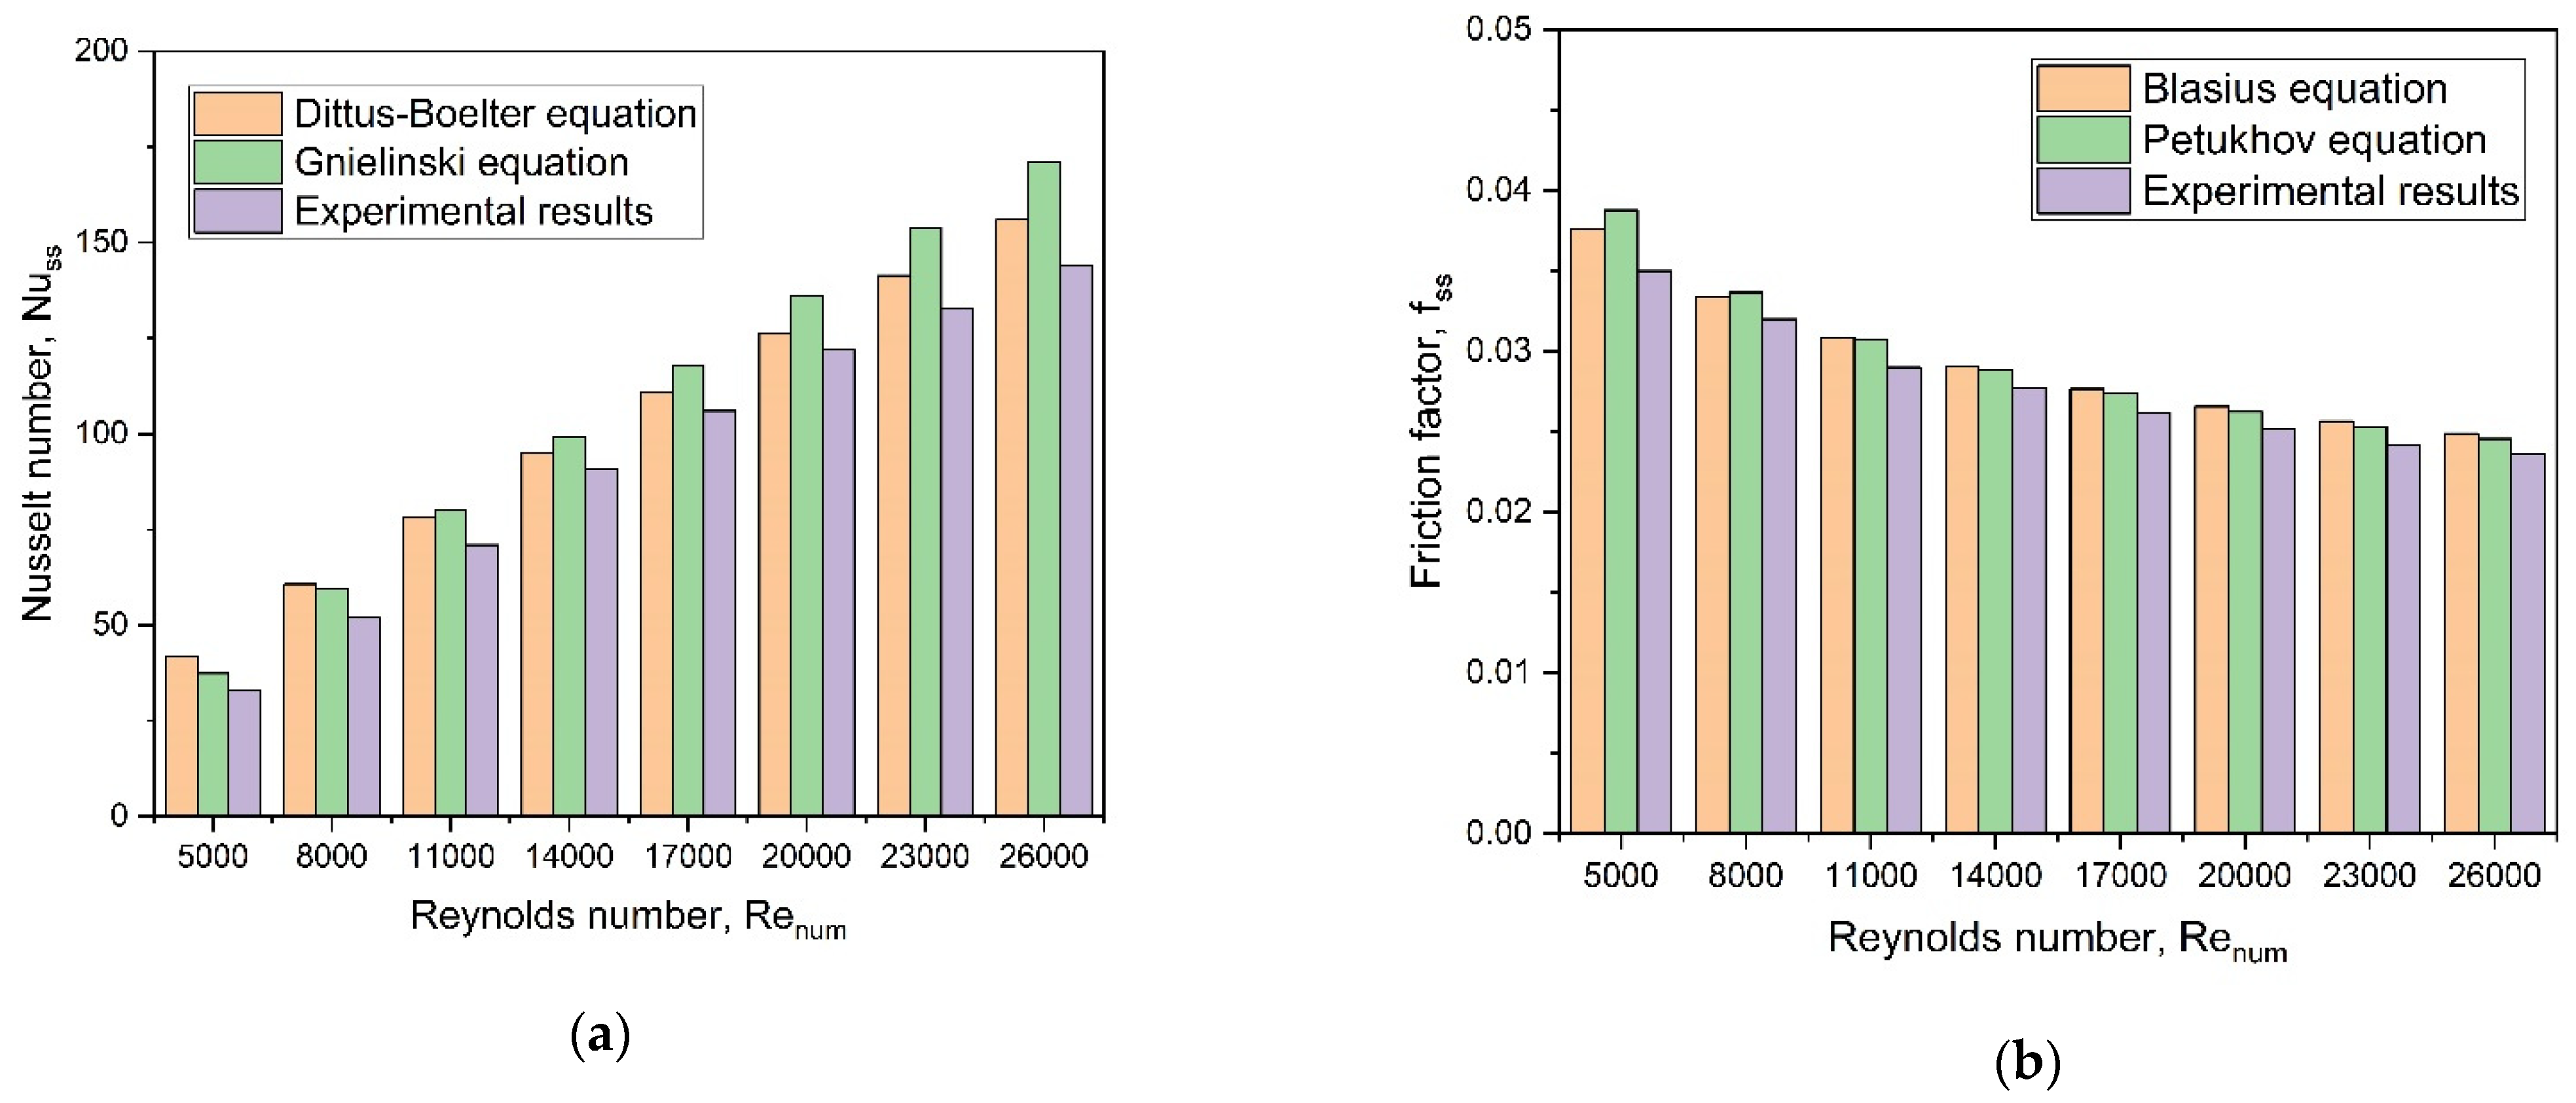
The obtained experimental results were compared with the literature data in terms of   N u s s and f s s in the situation of a smooth surface square channel, as shown in Figure 4a,b. The values of   N u s s and f s s of a smooth surface square duct under each R e n u m value are compared with available standard correlation results under similar experimental conditions.
Dittus–Boelter equation [43] (Equation (8)) and Gnielinski equation [44] (Equation (9)) of   N u s s for the smooth surface wall are given as:
  N u s s = 0.023 R e n u m 0.8 P r n u m 0.4
N u s s = f s s / 8 R e n u m 1000 P r n u m 1 + 12.7 f s s / 8 1 / 2 P r n u m 2 / 3 1   f o r   3000 < R e n u m < 10,000
Blasius equation [44] and Petukhov equation [44] of   f s s for the smooth surface wall are given as:
f s s = 0.316 R e n u m 0.25
f s s = 0.79 l n R e n u m 1.64 2
The result of these comparisons is shown in Figure 4a,b. The figure indicates that there was extremely strong agreement between the current analysis conclusions and those predicted by the Dittus–Boelter equation and Gnielinski equation of, N u s s and Blasius equation, and Petukhov equation of   f s s for a smooth surface.
Figure 4a,b clearly illustrated that the average deviation of N u s s and   f s s was approximately 3.37% and 3.09%, respectively, which is an acceptable range.

6. Data Reduction

The calculation procedure of   R e n u m ,   N u r s , f r s and η p e r are presented in the present section. The data reduction is carried out by fetching the experimental data at the steady state condition and using the energy balance equation. The data in the form of temperature and pressure drop across the test channel is reduced in the non-dimensional form of the Nusselt number and the friction factor. The heater power supply is calculated by the equation [42].
Q i n = I × V
The energy absorbed by the fluid in the duct is computed using the formula
Q o u t = m ˙ c p T o T i
The h between the fluid and the heated surface is calculated as
h = Q o u t A p T p w T f
The value of R e n u m is determined by
R e n u m = ρ n f u m D h μ n f
The equation to determine the N u r s is
N u r s = h   D h k n f
and the f r s is calculated from
f r s = 2 D h Δ p d ρ n f L u m 2

7. Uncertainty Analysis

The uncertainty of dimensionless numbers, such as N u r s and f r s , was calculated with the method proposed by Kline [45]. The uncertainty in a measurement of y when the major experimental parameters are computed by using specific measured quantities:
δ y y δ y y = δ y δ x 1 δ x 1 2 + δ y δ x 2 δ x 2 2 + δ y δ x 3 δ x 3 2 + + δ y δ x n δ x n 2 0.5
where, δ x 1 ,   δ x 2 ,   δ x 3 , … δ x n are the possible error in the measurement of x 1 ,   x 2 , x 3 , … x n .
δ y is absolute uncertainty, and δ y y the relative uncertainty. The main uncertainty analysis equations are given below:
  • Uncertainty in N u r s
    δ N u r s N u r s = δ D h D h 2 + δ h t h t 2 + δ k n f k n f 2 0.5
  • Uncertainty in f r s
    δ f r s f r s = δ D h D h 2 + δ u m u m 2 + δ L t L t 2 + δ ρ n f ρ n f 2 + δ Δ p Δ p 2 0.5
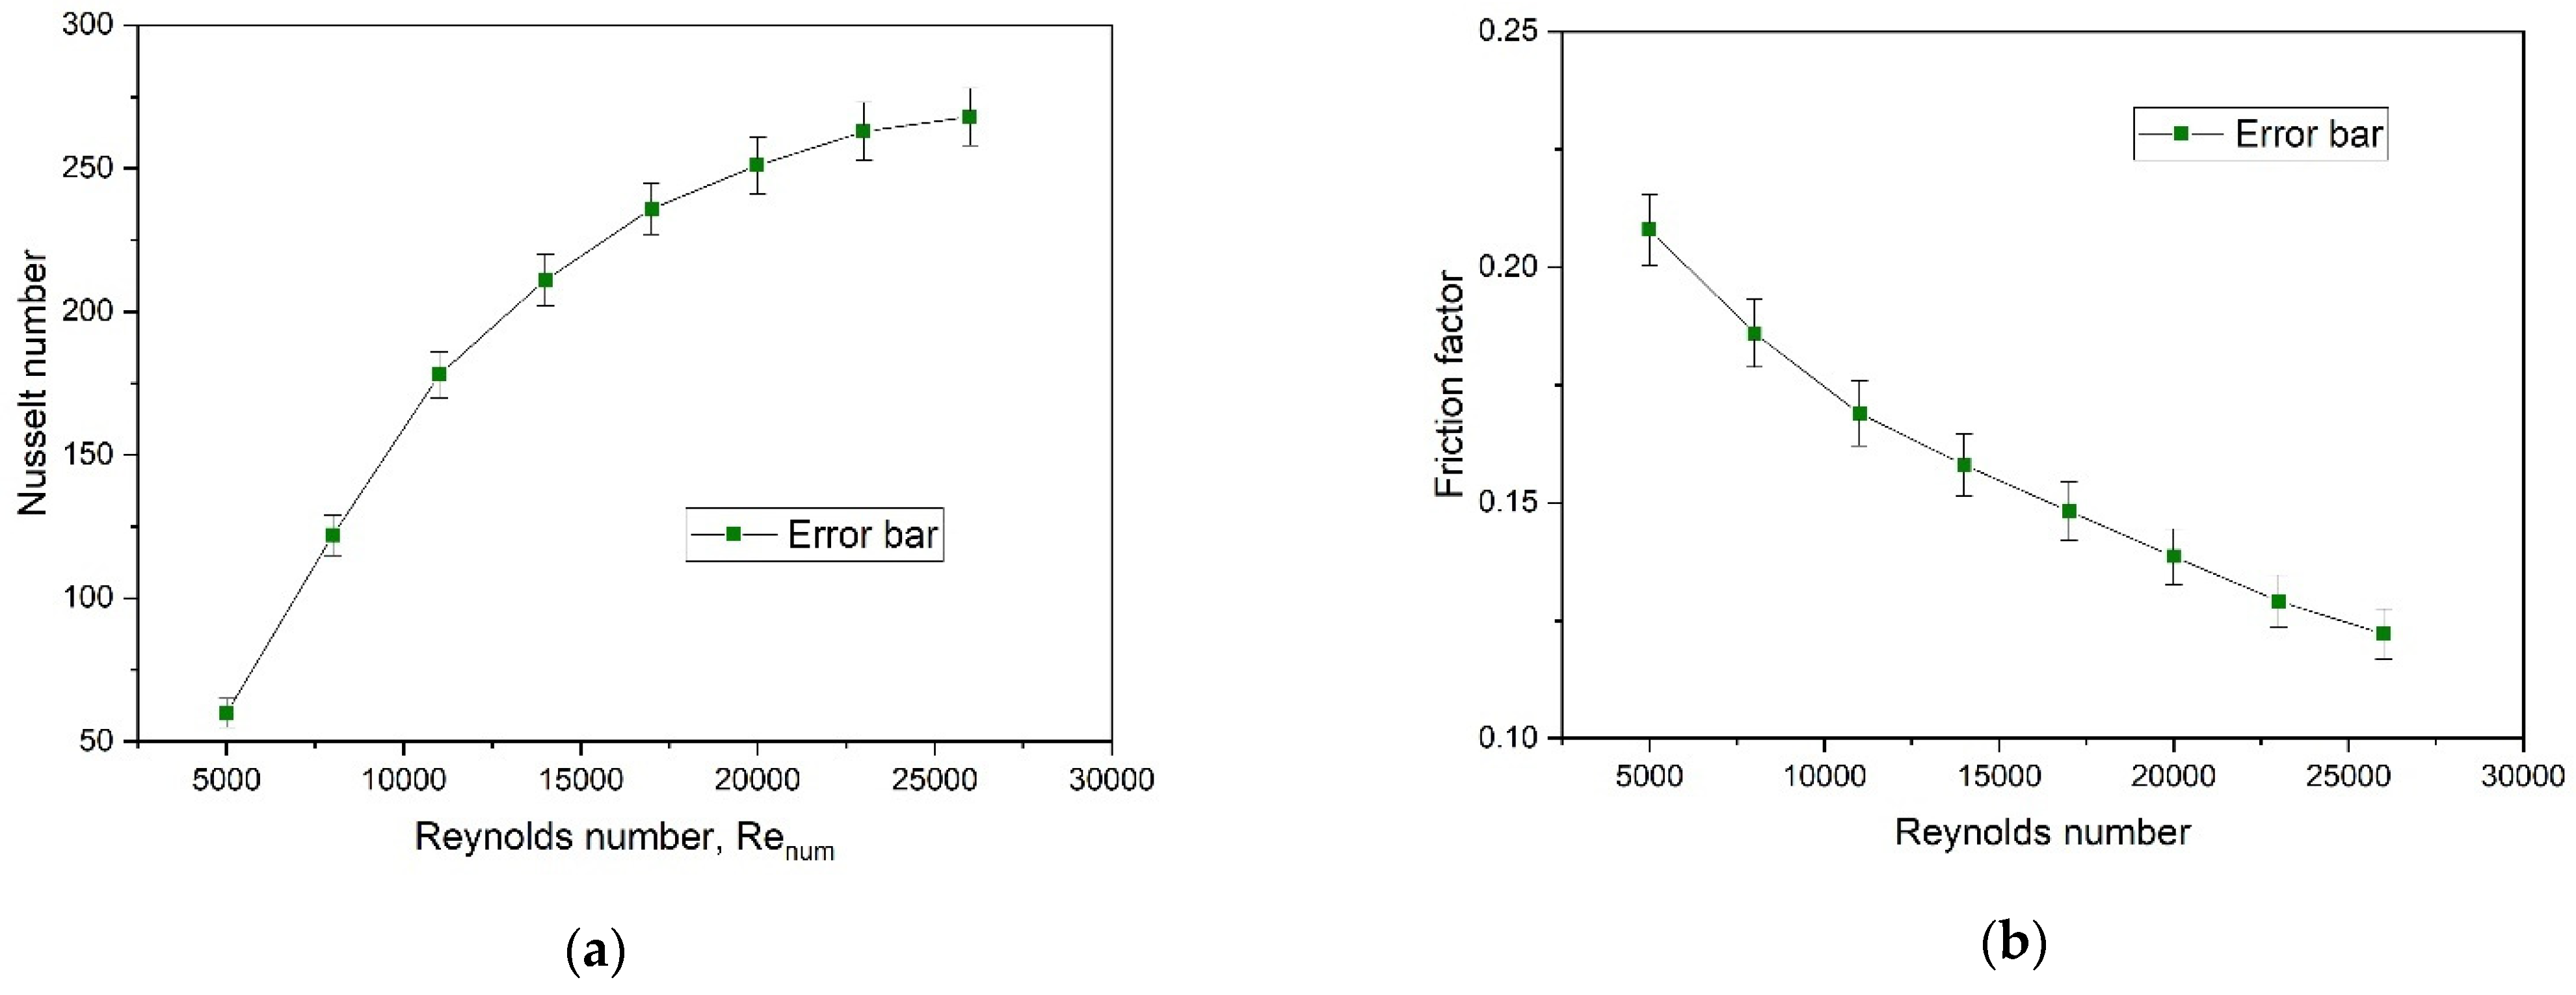
The uncertainty for key parameters determined, N u r s and f r s of the existing experimental examination is found to be ±4.41% and ±5.95%, respectively. To show the variation of N u r s and f r s as a function of R e n u m , the error bars are shown in Figure 5a,b, respectively.

8. Results and Discussion

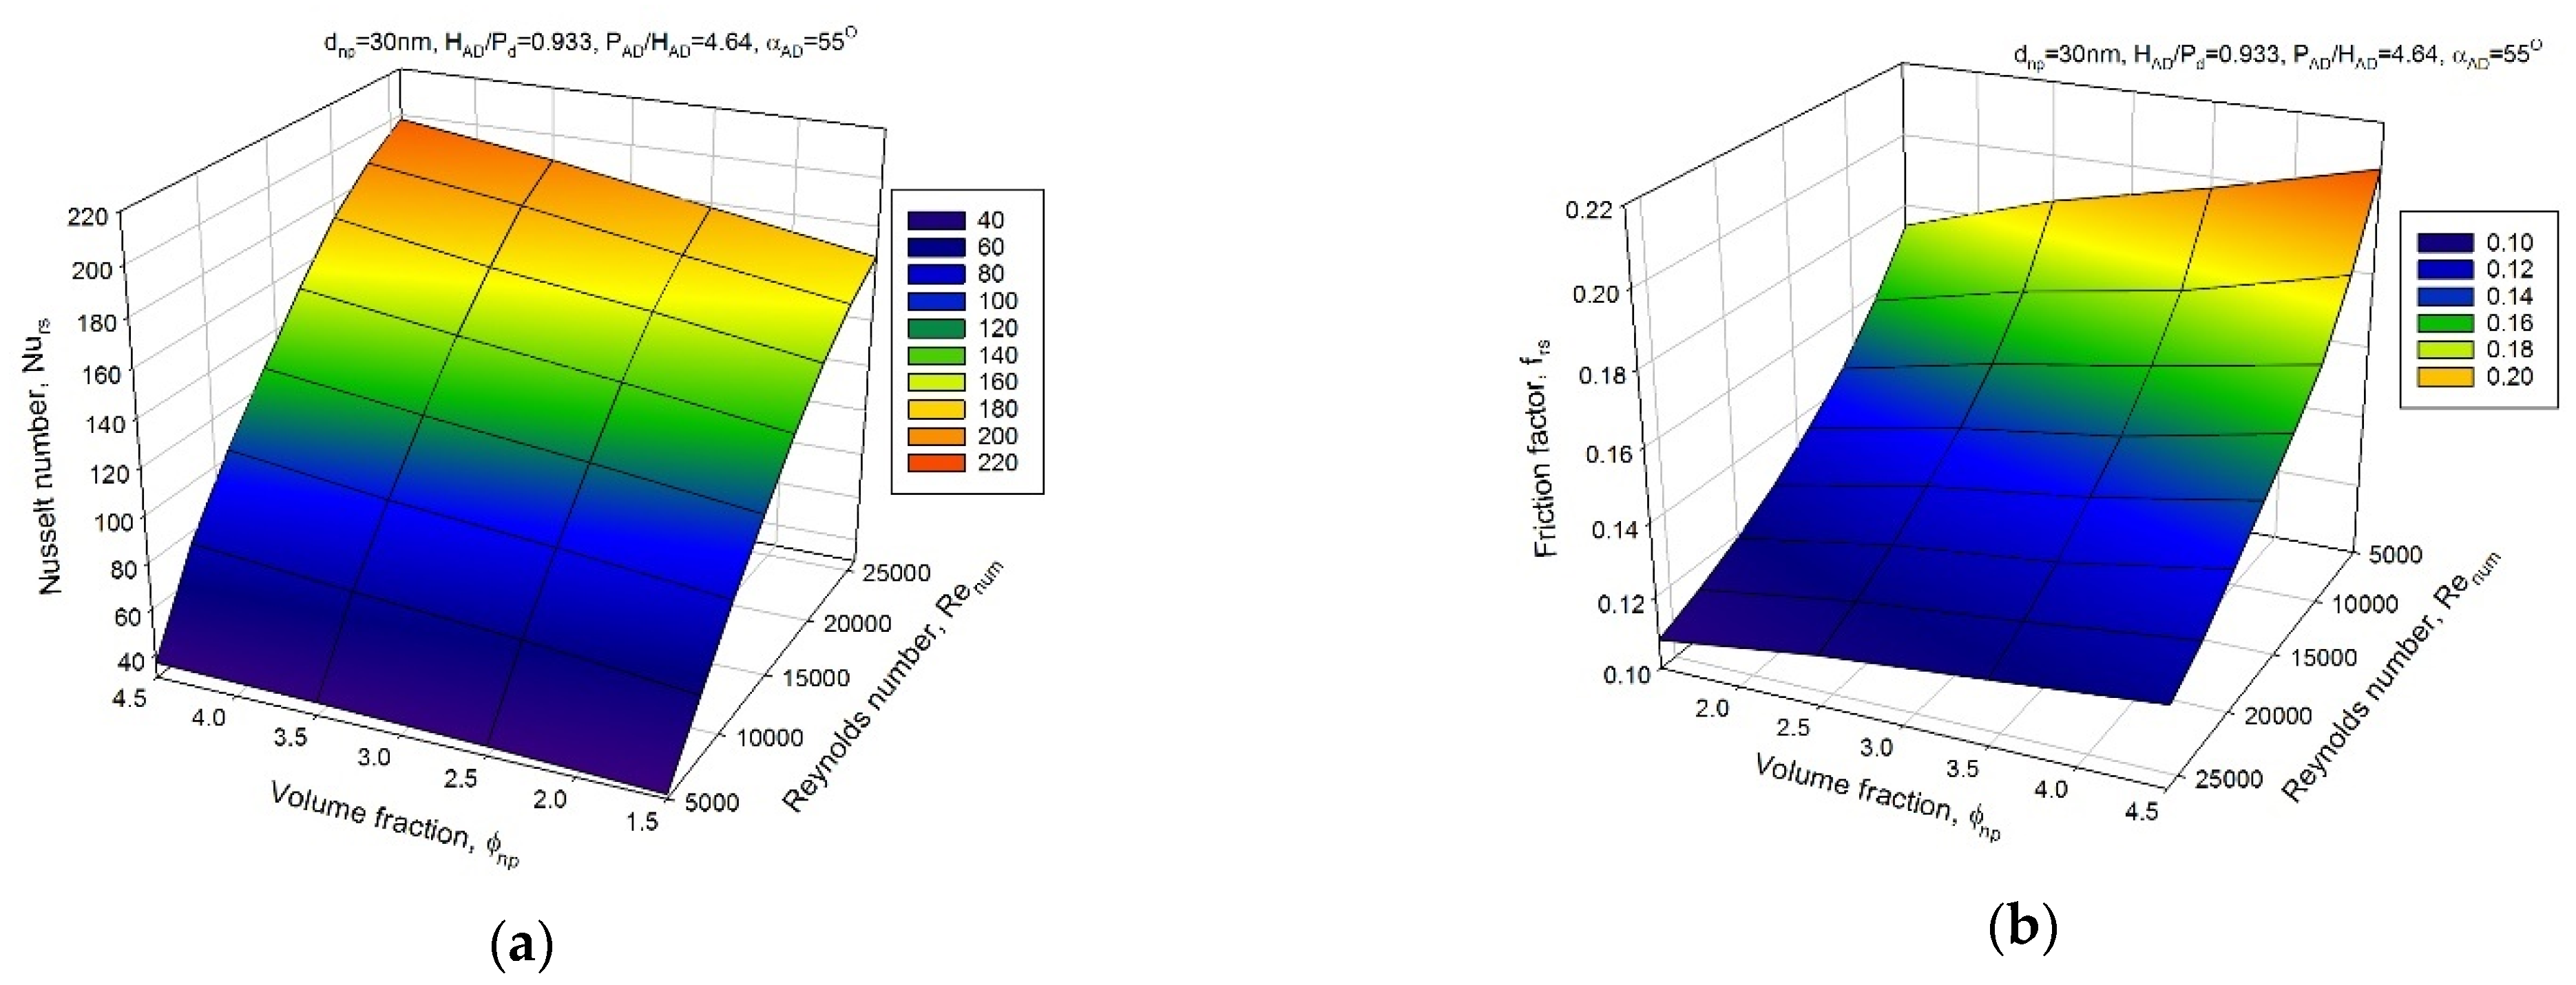
Experimental results are reported in terms of   N u r s , f r s and η p e r as a function of   R e n u m , ranging from 5000 to 26,000, ϕ n p from 1.5% to 4.5% at constant d n p of 30 nm, H A D / P d from 0.533 to 1.133, P A D / H A D from 3.71 to 6.71 and α A D range from 35° to 65°. The effects of nanoparticle volume fraction variation and artificially rib-roughened square duct on heat transfer are studied. Figure 6 shows the variation of   N u r s and f r s with R e n u m at different   ϕ n p of A l 2 O 3 nanoparticle ranging from 1.5% to 4.5% of the entire test surface with the rib-roughened wall, which is performed at d n p of 30 nm, H A D / P d = 0.933 , P A D / H A D = 4.64 , and α A D = 55°. Figure 6a illustrates that as R e n u m increased, N u r s also increased, and it also shows an enhancement in average heat transfer by 2.06%, 7.02% and 10.74% at   ϕ n p = 2.5 % ,   3.5 % and 4.5%, respectively, when compared to   ϕ n p = 1.5 % . This enhancement is due to the nanofluid’s thermal conductivity and Brownian motion increment. Whereas Figure 6b illustrates that f r s decreased as Re num increased, and when the concentration of nanoparticles increased average friction factor increased. Furthermore, the friction factor is augmented around 5.55%, 9.25% and 13.15% at   ϕ n p = 2.5 %   ,   3.5 % and 4.5%, respectively, in comparison to   ϕ n p = 1.5 % .
The maximum heat transfer rate and flow friction are observed at   ϕ n p = 4.5 % for all values of   R e n u m . Figure 7 shows the variation of   N u r s and f r s with R e n u m at H A D / P d ranging from 0.533 to 1.133 executed at fixed parameters d n p of 30 nm,   ϕ n p = 4.5 % , P A D / H A D = 4.64 , and α A D = 55°. Figure 7a shows an enhancement in average heat transfer of 7.69%, 14.52% and 29.9% at H A D / P d = 0.733 ,   0.933 and 1.133, respectively when compared to   H A D / P d = 0.533 . The general trends of heat transfer enhancement for the different values of relative arc rib height first immediately increased for   H A D / P d = 0.533 to 0.933 and then decreased for   H A D / P d = 1.133 for all values of   R e n u m due to the effect of stronger rotational momentum of secondary flow along the ribs, it may line the main flow to speed up it, providing a more heat transfer. The maximum heat transfer enhancement is found at H A D / P d = 0.933 . Whereas Figure 7b demonstrated that f r s decreases as R e n u m increased as well as it is minimum at   H A D / P d = 0.533 and maximum at   H A D / P d = 1.133 for all values of   R e n u m . From the same figure, it is also concluded that the friction factor is augmented around 9.98%, 21.95% and 33.03% at H A D P d = 0.733 ,   0.933 and 1.133, respectively, in comparison to   H A D / P d = 0.533 .
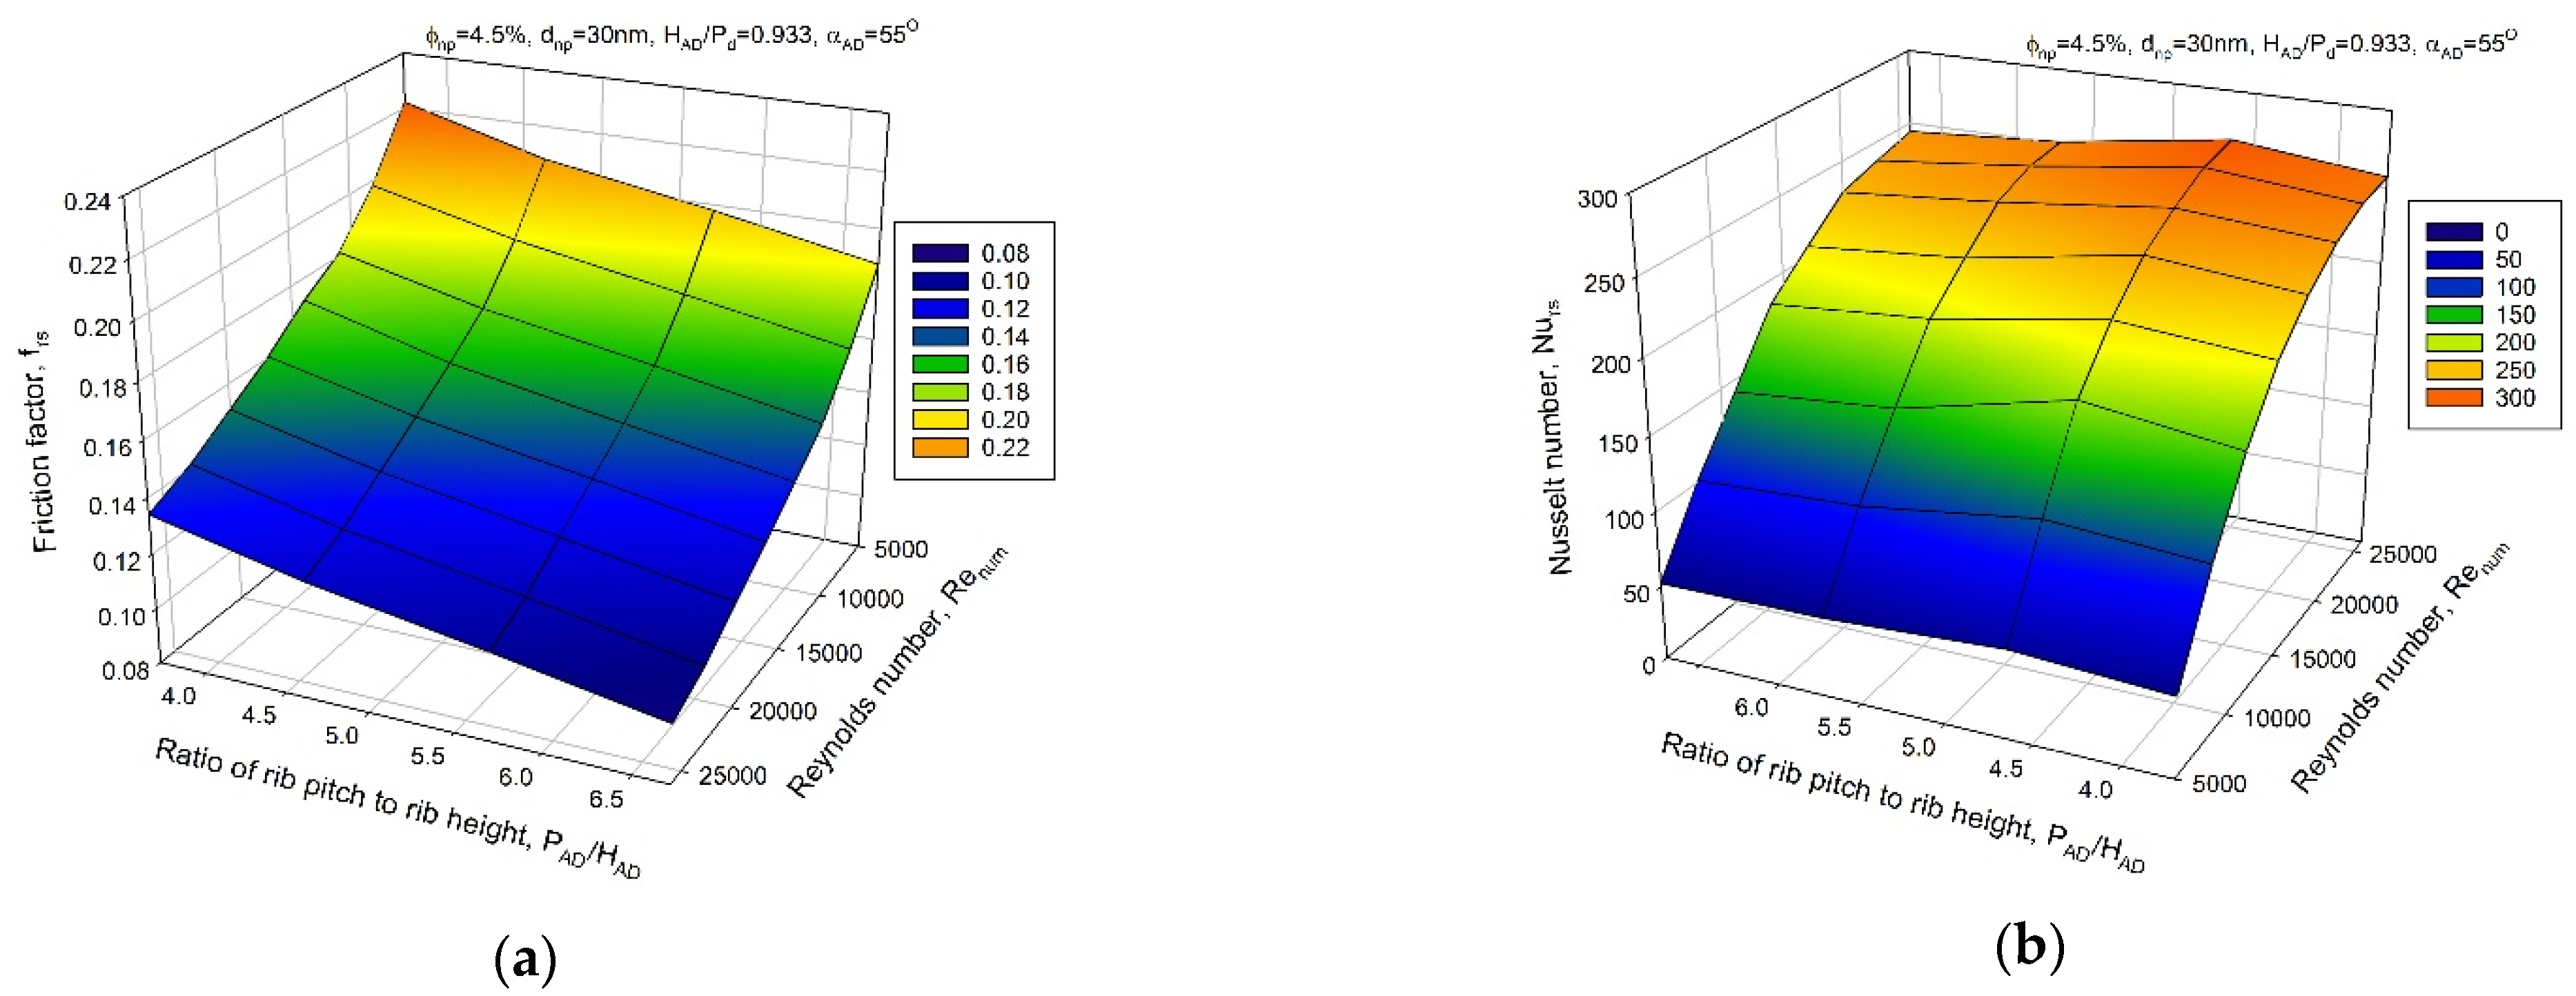
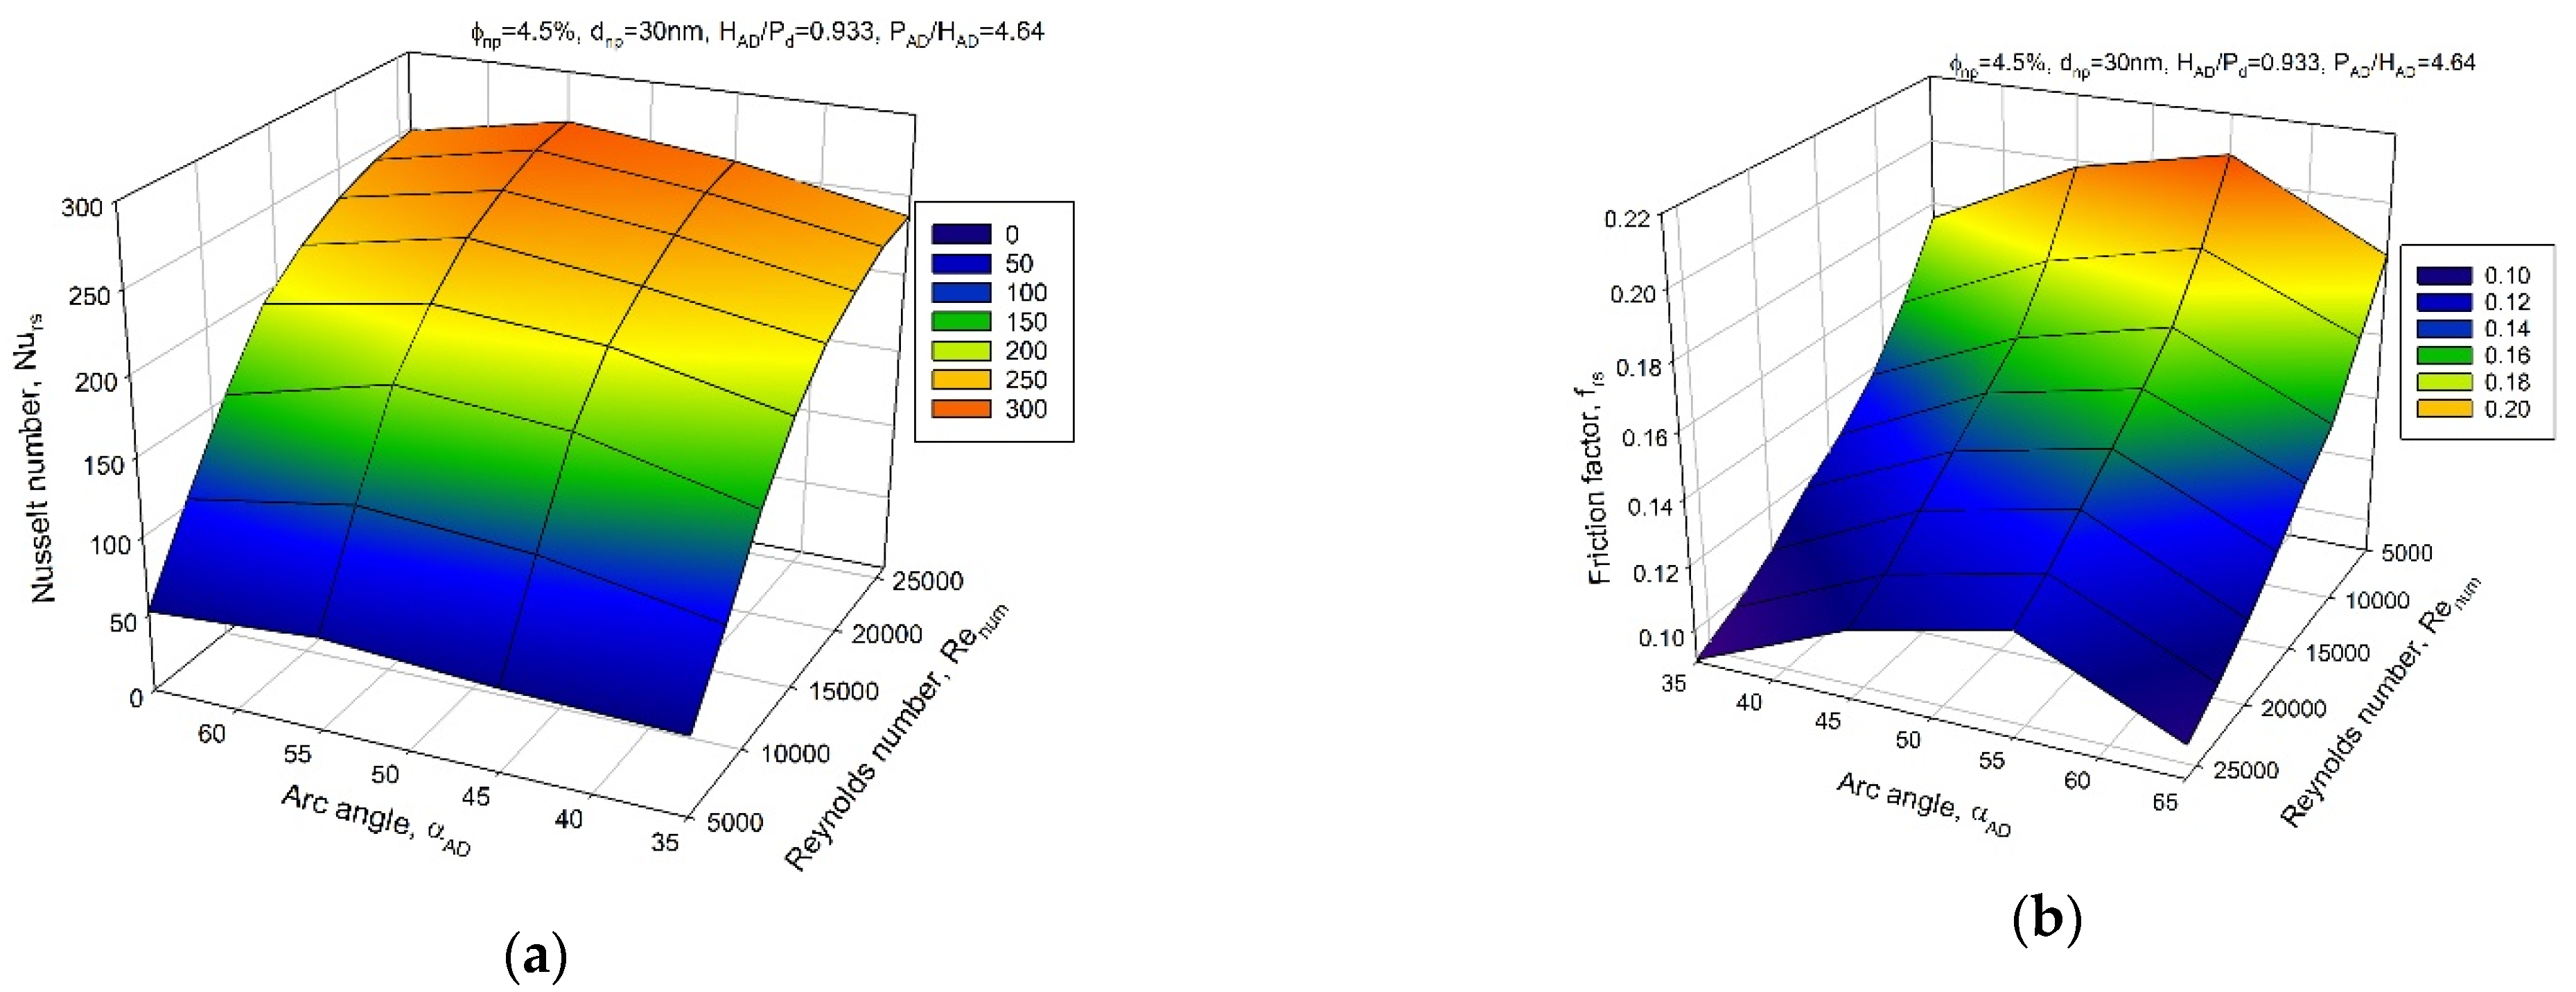
The effect of P A D / H A D on   N u r s and f r s with R e n u m is illustrated in Figure 8, where P A D / H A D ranging from 3.71 to 6.71 and other parameters, d n p = 30 nm,   ϕ n p = 4.5 % ,   H A D / P d = 0.933 and α A D = 55° were fixed. Figure 8a clearly indicates that   N u r s increased as R e n u m increased, and it is maximum when P A D / H A D = 4.64, minimum at   P A D / H A D = 6.71 Figure 8a also indicated an enhancement of 5.32%, 9.83% and 2.87% in average heat transfer at P A D / H A D = 3.71 ,   4.64 and 5.71, respectively, as compared to   P A D / H A D = 6.71 . The heat transfer coefficient raised when the value of relative rib pitch increased from 3.71 to 4.64, and then it decreased with a further increase in the value of relative rib pitch for all values of   R e n u m . Figure 8b clearly confirms that f r s is minimum at   P A D / H A D = 6.71 and maximum at   P A D / H A D = 3.71 . It is also witnessed that friction factor is improved around 32.34%, 20.51% and 10.25% at P A D / H A D = 3.71 ,   4.64 and 5.71, respectively, concerning   P A D / H A D = 6.71 . The details of fluid flow for the cases of arc angle and arc-shaped ribs are shown in Figure 9. It displayed the variation of   N u r s and f r s with R e n u m at α A D ranging from 35° to 65° when other operating parameters are kept constant as d n p of 30 nm,   ϕ n p = 4.5 % ,   H A D / P d = 0.933 and   P A D / H A D = 4.64 .
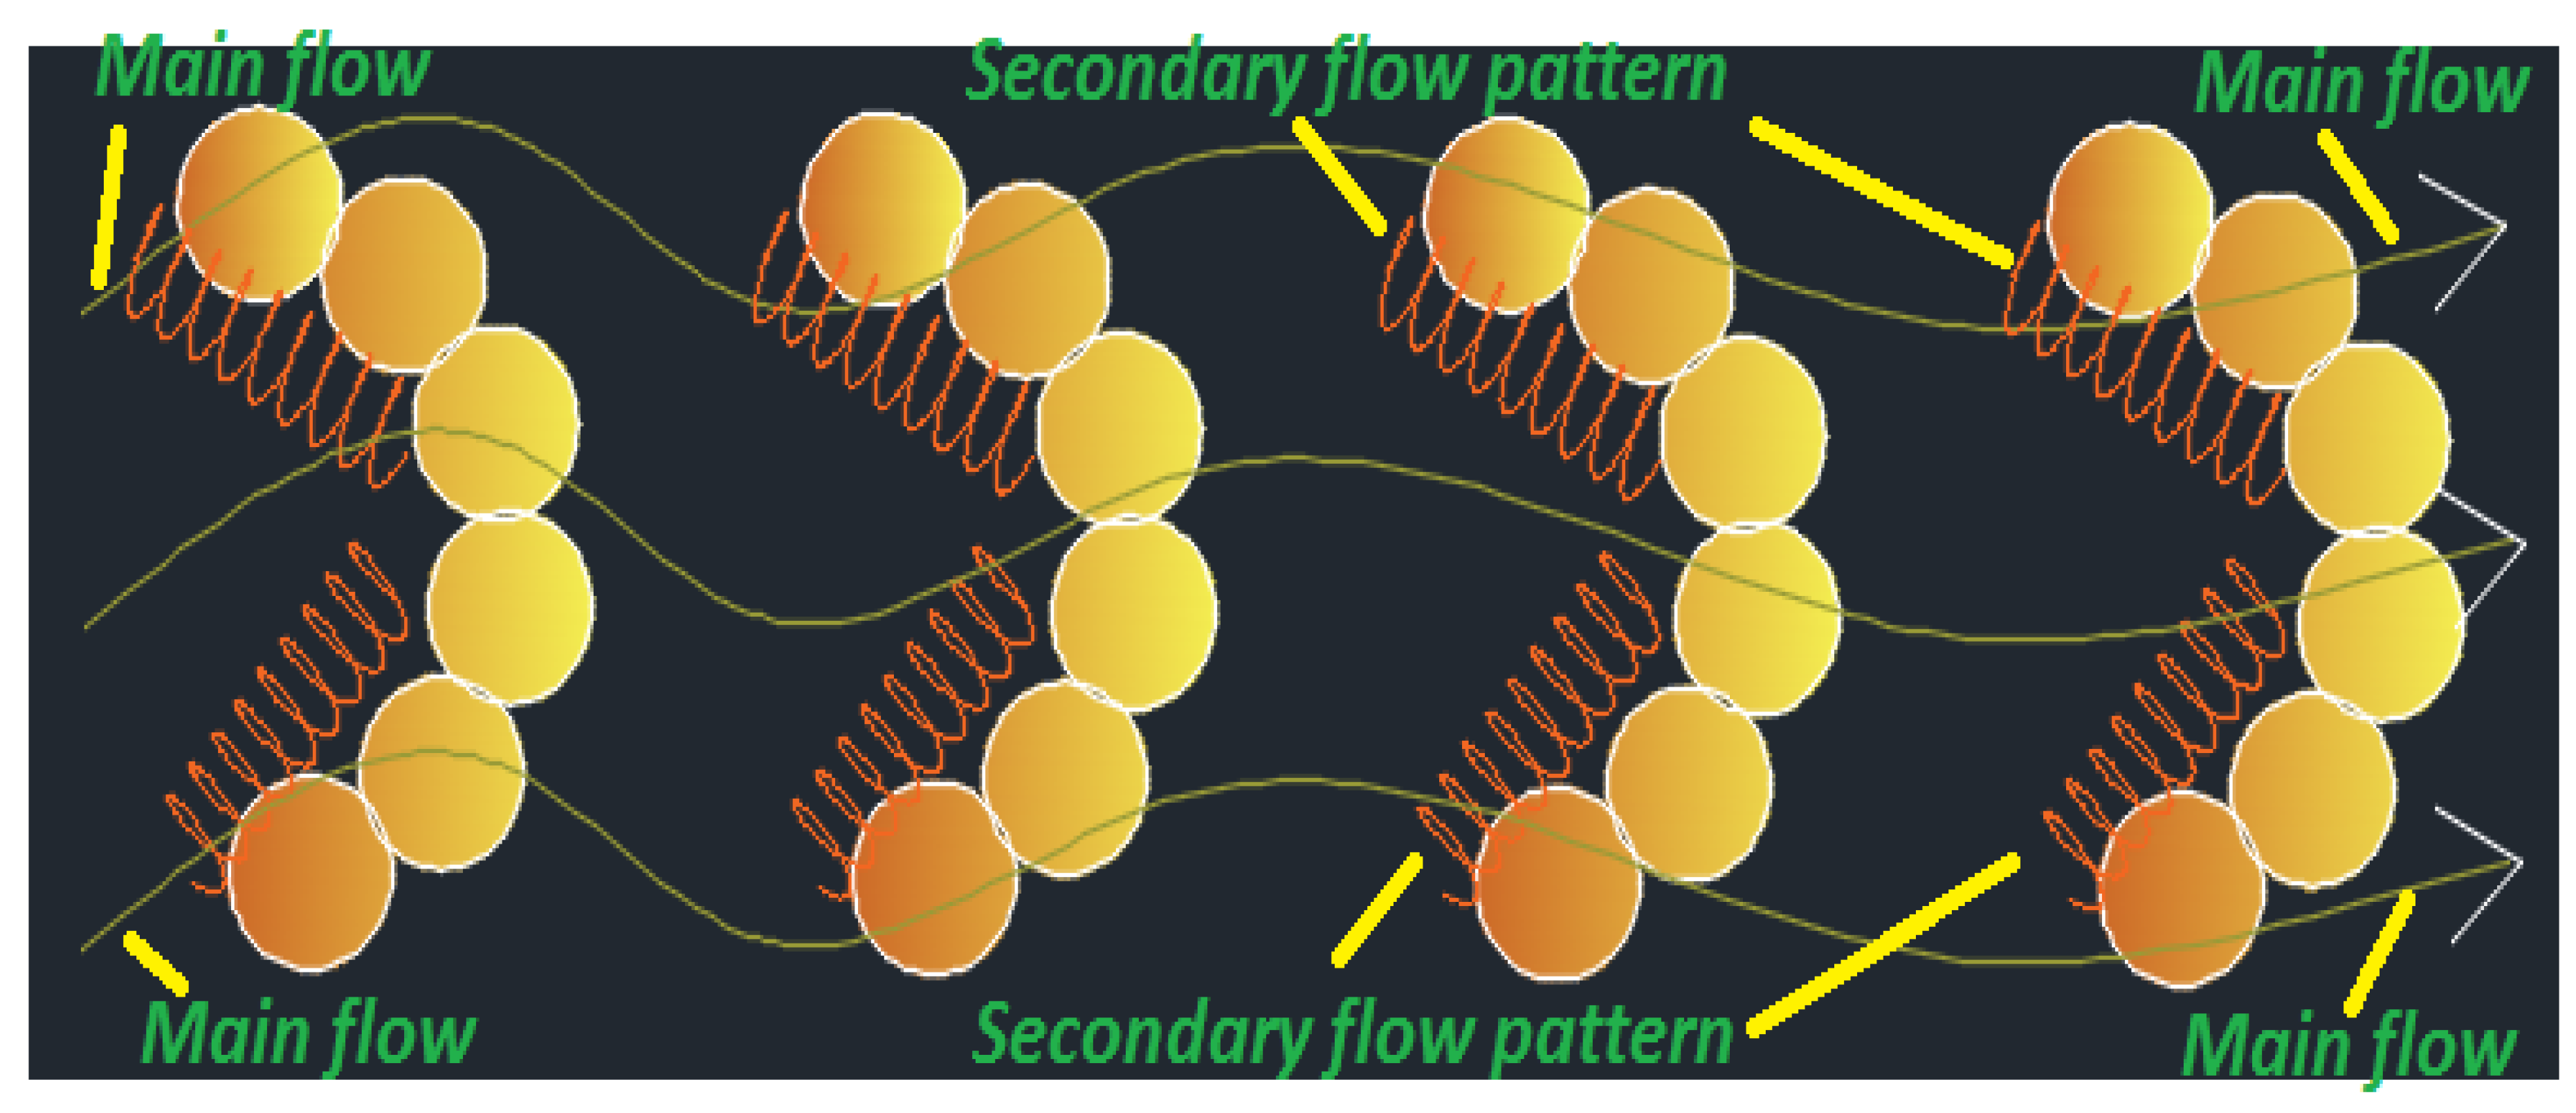
Figure 9a shows an enhancement in average heat transfer of 8.43%, 13.08% and 4.64% at α A D = 45°, 55° and 65° respectively, when compared to   α A D = 35°. It is also observed that the heat transfer coefficient enhanced when the arc angle increased from 35° to 55°, and then it decreased with a further increase in arc angle. Moreover, a higher heat transfer rate is found at   α A D = 55° due to the strong secondary flow-induced arc angle of dimpled ribs inside the flow channel, and   α A D = 35° provides the low heat transfer rate for all values of   R e n u m . Figure 9b indicates that f r s increases when the arc angle increases from 35° to 55°, and then it decreases with a further increase in arc angle. An enhancement of 22.46%, 34.58% and 10.35% is found in friction factor at α A D = 45°, 55° and 65° respectively, when compared to   α A D = 35°. Furthermore, from all these cases investigated, it is observed that the maximum heat transfer rate is found at   ϕ n p = 4.5 % ,   H A D / P d = 0.933 , P A D / H A D = 4.64 and α A D = 55° for all values of   R e n u m . The results reveal a stronger rotational momentum of secondary flow along the dimpled arc pattern ribs shown in Figure 10. It is seen from the flow pattern that the main flow is guided over the dimpled rib with an arc pattern, which tends to increase the turbulence intensity. On the other side, the secondary flow is developed in the vicinity of the dimpled rib, which tends to boost the intensity of turbulence of the fluid, thus enhancing the rate of heat transfer. Furthermore, it is evident from this discussion that the ratio of rib height to print, the ratio of rib pitch to rib height, and the arc angle should be maintained to increase the velocity of the fluid moving through the duct to induce local turbulence.
The thermal-hydraulic performance   η p e r of three different dimpled with combined arc-shaped ribbed square ducts is described in Figure 11. The thermal-hydraulic performance was expressed as   η p e r = N u r s N u s s / f r s f s s 1 / 3 [46]. The greater the value of this parameter, the better the performance of the heat exchanger. Figure 11a shows the effect of the ratio of rib height to print H A D / P d range from 0.533 to 1.133 on thermal hydraulic performance for selected values of   R e n u m , where it can be experiential that the value of   η p e r is increased when the value of H A D / P d increases from 0.533 to 0.933, and then it decreases with a further increase in the value of H A D / P d . It is evident from this figure that there is an enhancement of 2.02%, 13.84% and 19.79% in overall thermal performance at H A D / P d = 0.533 ,   0.733 and 0.933, respectively, when compared to   H A D / P d = 1.133 and maximum value of   η p e r is found at H A D / P d = 0.933 for   R e n u m = 11,000 . Figure 11b represents the thermal-hydraulic performance as a function of the ratio of rib pitch to rib height P A D / H A D , ranging from 3.71 to 6.71 for the particular values of   R e n u m . From the figure, it can be clearly seen that the value of   η p e r is increases when the value of   P A D / H A D increases from 3.71 to 4.64 and then it starts decreasing with a further increase in the value of   P A D / H A D from 4.64 to 1.133. There is an enhancement of 8.73%, 20.03% and 3.98% in overall thermal performance at P A D / H A D = 3.71 ,   4.64 and 5.71, respectively, with respect to   P A D / H A D = 6.71 . The highest value of the thermal-hydraulic performance is observed at   P A D / H A D = 4.64 and lowest at   P A D / H A D = 6.71 for   R e n u m = 11,000 . Figure 11c represents the thermal-hydraulic performance as a function of arc angle in dimpled rib ( α A D ) equal to 35°, 45°, 55° and 65° for the particular values of   R e n u m . Here it can be clearly recognized that the value of   η p e r is increases when the value of α A D increases from 35° to 55° and then it starts decreasing with a further increase in the value of α A D . The thermal-hydraulic performance is significantly high, about 13.01%, 16.36% and 3.85%at α A D = 45°, 55° and 65° respectively, when compared to   α A D = 35°. The highest value of the thermal-hydraulic performance is observed at   α A D = 55° and lowest at   α A D = 35° for   R e n u m = 11,000 .

9. Correlations for Nusselt Number and Friction Factor

The discussion of results reveals that the selected parameters for investigation are a strong function in determining the N u r s ,   f r s   and   η r s values. The yielded experimental data of N u r s ,   f r s   and   η r s is utilized in the development of the correlations that will be valid for the selected range of R e . The functional relationship for N u r s ,   f r s   and   η r s for selected operating and geometric parameters is given as:
N u r s = f R e , ϕ n p ,   H A D / P d , P A D / H A D ,   α A D
f r s = f R e , ϕ n p ,   H A D / P d , P A D / H A D ,   α A D
η r s = f R e ,   H A D / P d , P A D / H A D ,   α A D
The experimental values are subjected to regression analysis in order to determine statistical correlations between N u r s ,   f r s   and   η r s for the selected geometrical and flow parameters.
The values result in the following correlation for N u r s .
N u r s = 0.019 × R e 0.91   ϕ n p 0.07   H A D / P d 0.011 P A D / H A D 0.17 α A D 0.14
Likewise, a statistical correlation for f T T   and   η T T can be written as
f r s = 1.56 × R e 0.33   ϕ n p 0.11   H A D P d 0.25 P A D H A D 0.33 α A D 0.3
η r s = 0.85 × R e 0.015   H A D P d 0.002 P A D H A D 0.05 α A D 0.029
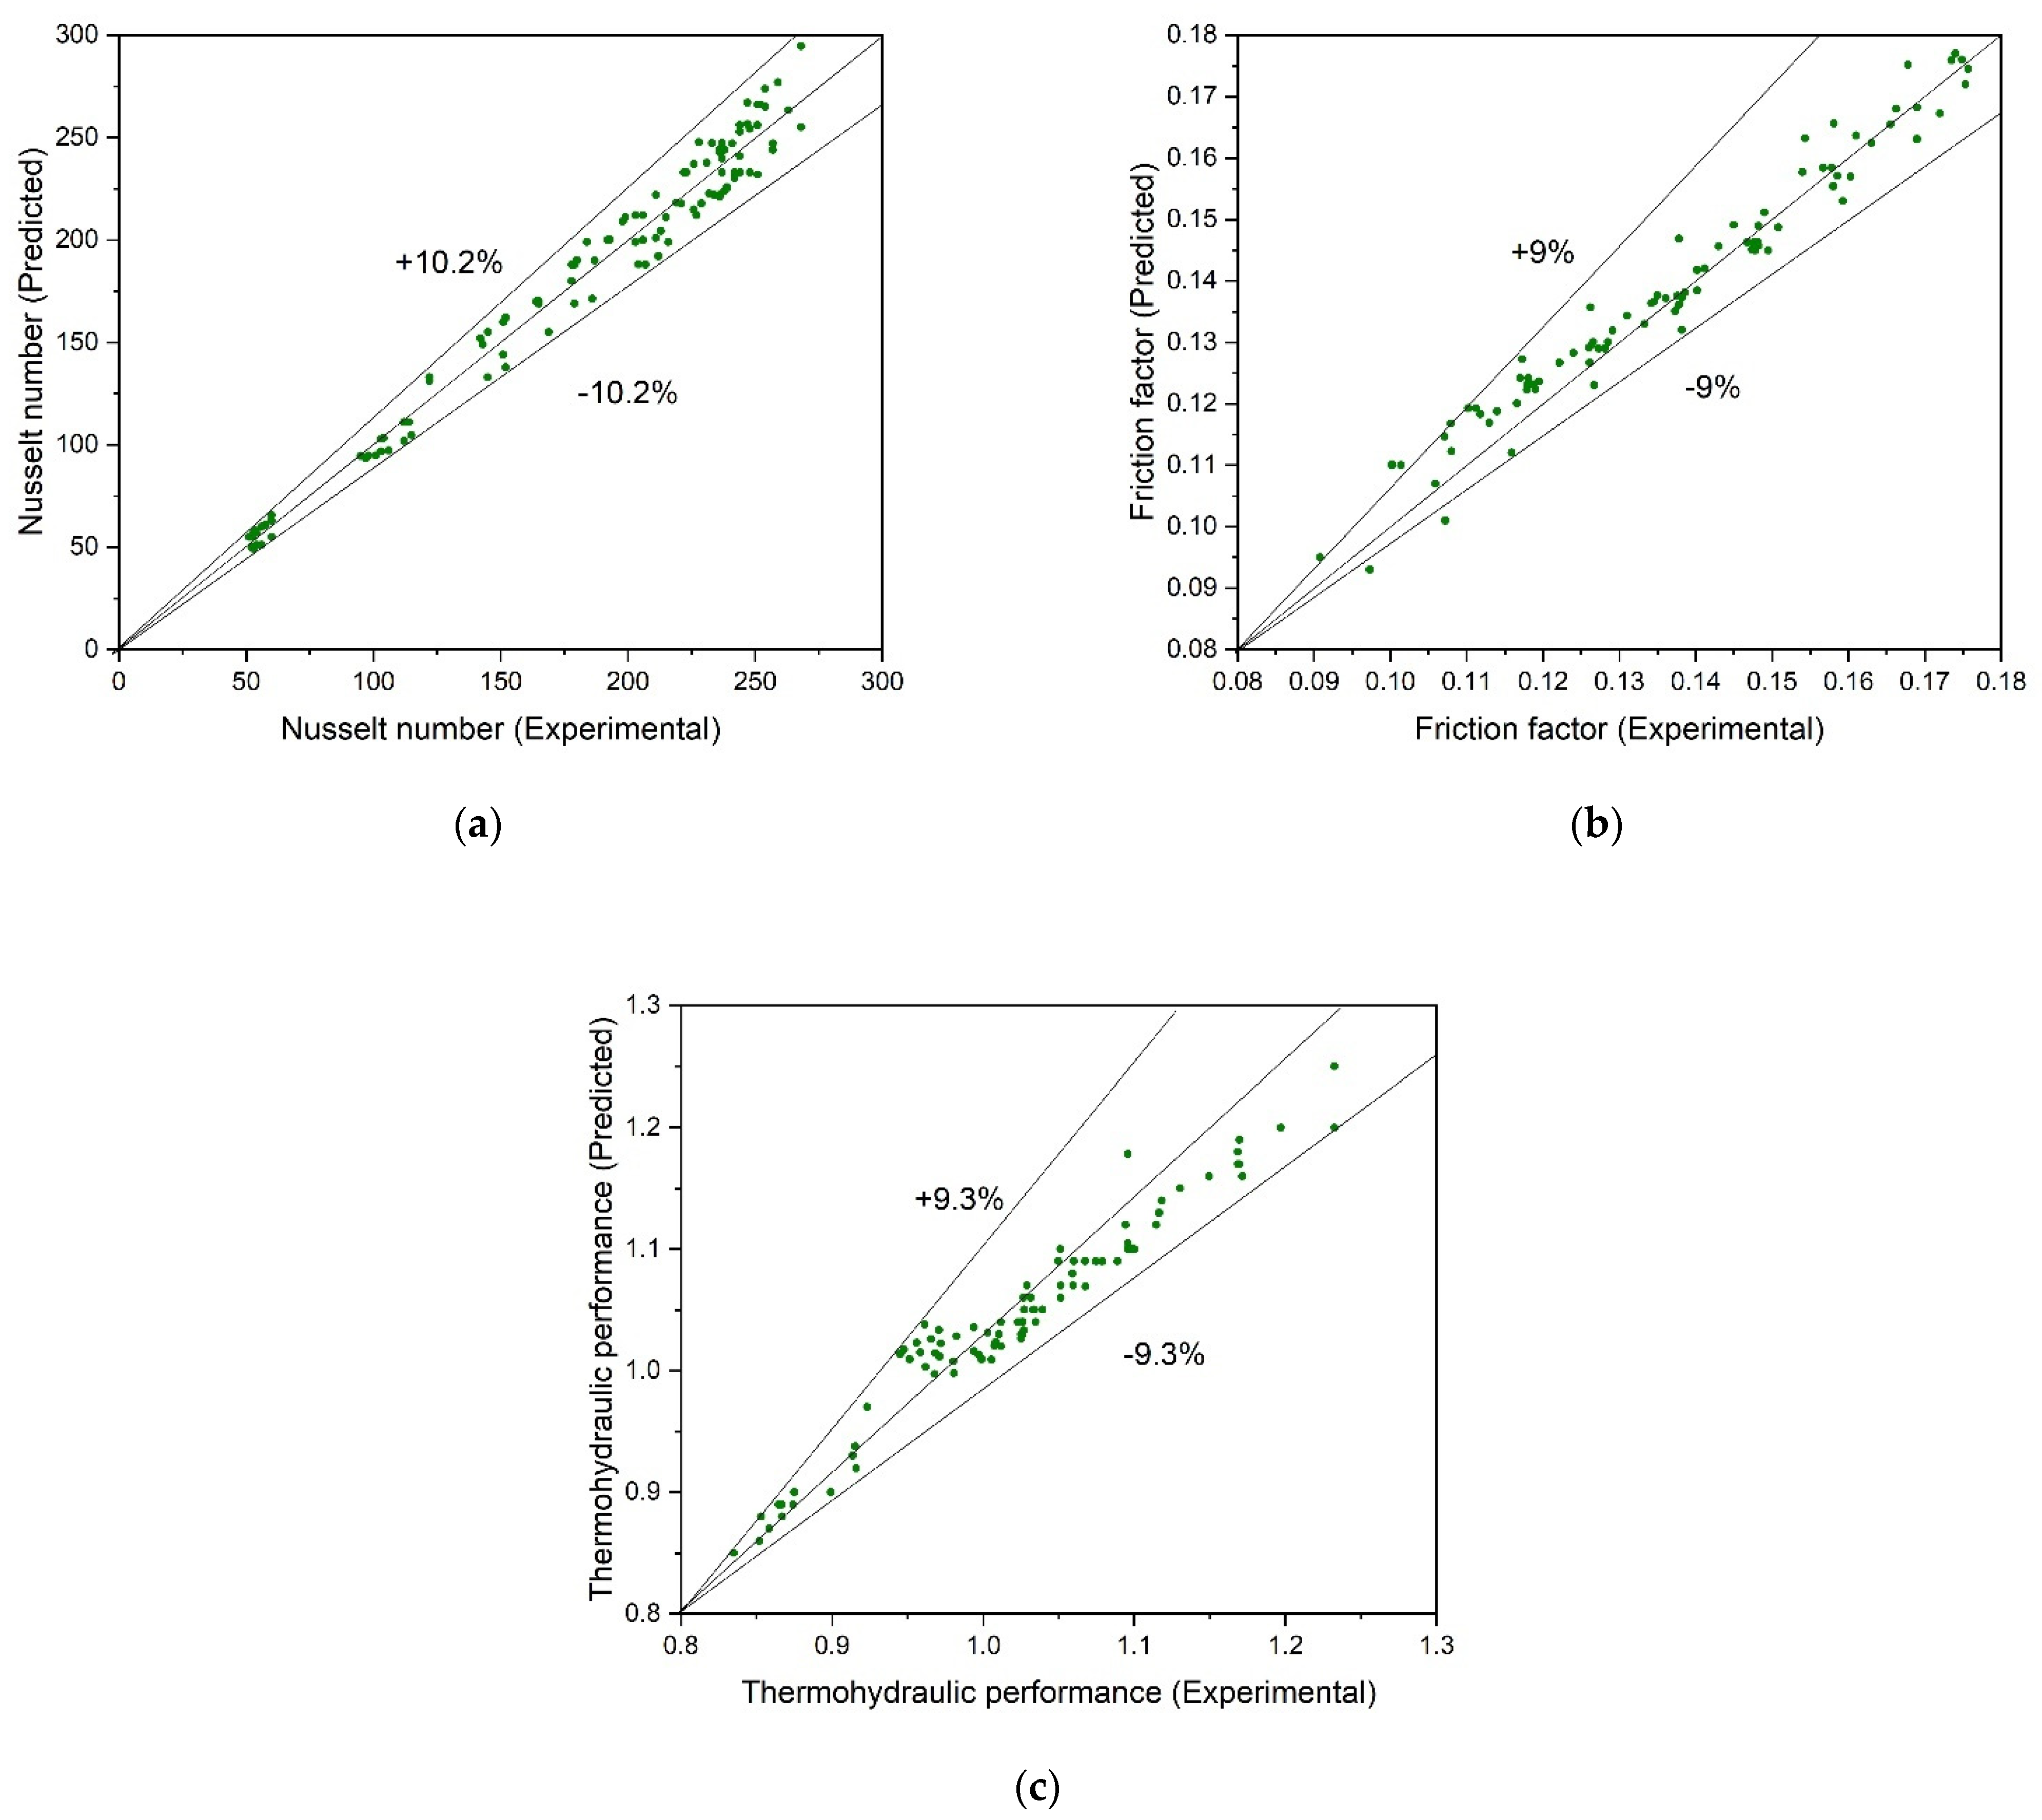
In order to determine the variation between the experimental and predicted data of N u r s ,   f r s   and   η r s , a comparative analysis is carried out, and the outcome is represented in are presented in Figure 12a–c. The difference of experimental and predicted data of N u r s ,   f r s   and   η r s has an average deviation of ±10.2%, ±9% and ±9.3%, respectively.

10. Conclusions

In this paper, the effect of the nanoparticle concentration, dimpled rib height, dimpled rib pitch, and dimpled arc angle on the hydrothermal characteristics of A l 2 O 3 H 2 O nanofluid flow in a square duct are investigated experimentally. The key conclusions are presented here:
  • Dimpled arc rib pitch, dimpled arc rib height, dimpled arc angle and volume fraction of nanofluid strongly affected the flow pattern and augmented the thermal-hydraulic performance of the square duct.
  • In general, the N u r s and   f r s all tend to upsurge with the upsurge in nanoparticle concentration, attaining the highest value of nanoparticle concentration of 4.5% gives the highest values of both the N u r s and   f r s for the range of parameters investigated.
  • A ratio of dimpled arc rib height to print diameter of 0.933 gives the highest value of N u r s and η p e r , whereas a ratio of dimpled arc rib height to print diameter of 1.133 gives the highest value of the   f r s .
  • A relative dimpled arc rib height of 4.64 gives the highest value of both the N u r s and η p e r , whereas a relative dimpled arc rib height of 3.71 gives the highest value of the f r s .
  • In general, the value of N u r s ,   f r s and η p e r have been found to increase with increases in the values of dimpled arc angle. Attaining the maximum value of dimpled arc angle of 55° gives the highest values of N u r s ,   f r s and η p e r given the set of parameters examined.
  • The maximum value of the thermal-hydraulic performance parameter occurs at φ n p of 4.5%, d n p of 30 nm, H A D / P d of 0.933, P A D / H A D of 4.64 and α A D of 55° for R e n u m of 11,000. The thermal-hydraulic performance characteristics’ maximum value was discovered to be 1.23 for Al 2 O 3 H 2 O -based nanofluid flow in a dimpled rib with arc pattern square duct for the range of parameters investigated.

Author Contributions

Conceptualization, A.K., R.M., S.S. and S.K.; methodology, M.S. and T.A. software, R.M., S.S. and S.K.; validation, T.A., A.K., S.M.E. and M.S.; formal analysis A.K., R.M., S.S. and T.A.; investigation, S.S. and S.K.; resources, M.S., N.K.G., S.M.E. and T.A.; data curation, A.K., R.M. and N.K.G.; writing—original draft preparation, A.K., R.M., S.M.E. and S.S.; writing—review and editing, A.K. and T.A.; visualization, A.K., R.M., S.S., S.M.E. and S.K.; supervision, M.S.; project administration, M.S. All authors have read and agreed to the published version of the manuscript.

Funding

This research received no external funding.

Institutional Review Board Statement

Not applicable.

Informed Consent Statement

Not applicable.

Data Availability Statement

Data available on request.

Conflicts of Interest

The authors declare no conflict of interest.

Nomenclature

C p ,   n f Specific heat
d n p Nanoparticle diameter
D h Hydraulic diameter
h   Convective heat transfer coefficient
H A D dimpled-arc-rib-height
P A D dimpled-rib-pitch
P d print diameter
P r n u m Prandtl number
N u r s Nusselt number of rough surface
f r s Friction factor of rough surface
k Thermal conductivity
Greek symbols
L Duct length
m ˙ Mass flow rate
R e n u m Reynolds number
Δ P d Pressure drop across the duct
u m   Fluid velocity
α A D dimpled arc angle
ϕ n p Volume fraction
η r s Thermohydraulic performance parameter
ρ n f Nanofluid density
μ Dynamic viscosity

References

  1. Kumar, S.; Shandilya, M.; Chauhan, A.; Maithani, R.; Kumar, A. Experimental Analysis of Zinc Oxide/Water/Ethylene Glycol-Based Nanofluid in a Square Duct Roughened with Inclined Ribs. J. Enhanc. Heat Transf. 2020, 27, 687–709. [Google Scholar] [CrossRef]
  2. Godson, L.; Raja, B.; Lal, D.M.; Wongwises, S. Enhancement of heat transfer using nanofluids—An overview. Renew. Sustain. Energy Rev. 2010, 14, 629–641. [Google Scholar] [CrossRef]
  3. Babu, M.J.; Sandeep, N.; Saleem, S. Free convective MHD Cattaneo-Christov flow over three different geometries with thermophoresis and Brownian motion. Alex. Eng. J. 2017, 56, 659–669. [Google Scholar] [CrossRef]
  4. Pandey, A.K.; Reji Kumar, R.; Kalidasan, B.; Laghari, I.A.; Samykano, M.; Kothari, R.; Abusorrah, A.M.; Sharma, K.; Tyagi, V.V. Utilization of solar energy for wastewater treatment: Challenges and progressive research trends. J. Environ. Manag. 2021, 297, 113300. [Google Scholar] [CrossRef]
  5. Kumar, N.; Gupta, S.K.; Sharma, V.K. Application of phase change material for thermal energy storage: An overview of recent advances. Mater. Today Proc. 2021, 44, 368–375. [Google Scholar] [CrossRef]
  6. Ogungbemi, A.T.; Adun, H.; Adedeji, M.; Kavaz, D.; Dagbasi, M. Does Particle Size in Nanofluid Synthesis Affect Their Performance as Heat Transfer Fluid in Flat Plate Collectors?—An Energy and Exergy Analysis. Sustainability 2022, 14, 10429. [Google Scholar] [CrossRef]
  7. Arıkan, E.; Abbasoğlu, S.; Gazi, M. Experimental Performance Analysis of Flat Plate Solar Collectors Using Different Nanofluids. Sustainability 2018, 10, 1794. [Google Scholar] [CrossRef] [Green Version]
  8. Kazem, H.A.; Chaichan, M.T.; Al-Waeli, A.H.A.; Jarimi, H.; Ibrahim, A.; Sopian, K. Effect of Temperature on the Electrical and Thermal Behaviour of a Photovoltaic/Thermal System Cooled Using SiC Nanofluid: An Experimental and Comparison Study. Sustainability 2022, 14, 11897. [Google Scholar] [CrossRef]
  9. Giwa, S.O.; Sharifpur, M.; Ahmadi, M.H.; Meyer, J.P. Magnetohydrodynamic convection behaviours of nanofluids in non-square enclosures: A comprehensive review. Math. Methods Appl. Sci. 2020, 1–59. [Google Scholar] [CrossRef]
  10. Naseema; NawazishMehdia, S.; Hussain, M.M.; Basha, S.K.; Samad, M.A. Heat Enhancement of Heat Exchanger Using Aluminium Oxide(Al2O3), Copper Oxide(CuO)Nano Fluids with Different Concentrations. Mater. Today Proc. 2018, 5 Pt 1, 6481–6488. [Google Scholar] [CrossRef]
  11. Karthikeyan, A.; Coulombe, S.; Kietzig, A. Boiling heat transfer enhancement with stable nanofluids and laser textured copper surfaces. Int. J. Heat Mass Transf. 2018, 126, 287–296. [Google Scholar] [CrossRef]
  12. Dormohammadi, R.; Farzaneh-Gord, M.; Ebrahimi-Moghadam, A.; Ahmadi, M.H. Heat transfer and entropy generation of the nanofluid flow inside sinusoidal wavy channels. J. Mol. Liq. 2018, 269, 229–240. [Google Scholar] [CrossRef]
  13. Shehzad, N.; Zeeshan, A.; Ellahi, R.; Vafai, K. Convective heat transfer of nanofluid in a wavy channel: Buongiorno’s mathematical model. J. Mol. Liq. 2016, 222, 446–455. [Google Scholar] [CrossRef]
  14. Tang, W.; Hatami, M.; Zhou, J.; Jing, D. Natural convection heat transfer in a nanofluid-filled cavity with double sinusoidal wavy walls of various phase deviations. Int. J. Heat Mass Transf. 2017, 115, 430–440. [Google Scholar] [CrossRef]
  15. Sharifpur, M.; Solomon, A.B.; Ottermann, T.L.; Meyer, J.P. Optimum concentration of nanofluids for heat transfer enhancement under cavity flow natural convection with TiO2—Water. Int. Commun. Heat Mass Transf. 2018, 98, 297–303. [Google Scholar] [CrossRef]
  16. Solomon, A.B.; Sharifpur, M.; Ottermann, T.; Grobler, C.; Joubert, M.; Meyer, J.P. Natural convection enhancement in a porous cavity with Al2O3-Ethylene glycol/water nanofluids. Int. J. Heat Mass Transf. 2017, 108, 1324–1334. [Google Scholar] [CrossRef] [Green Version]
  17. Garbadeen, I.; Sharifpur, M.; Slabber, J.; Meyer, J. Experimental study on natural convection of MWCNT-water nanofluids in a square enclosure. Int. Commun. Heat Mass Transf. 2017, 88, 1–8. [Google Scholar] [CrossRef]
  18. Ghodsinezhad, H.; Sharifpur, M.; Meyer, J.P. Experimental investigation on cavity flow natural convection of Al2O3–Water nanofluids. Int. Commun. Heat Mass Transf. 2016, 76, 316–324. [Google Scholar] [CrossRef]
  19. Joubert, J.; Sharifpur, M.; Solomon, A.B.; Meyer, J. Enhancement in heat transfer of a ferrofluid in a differentially heated square cavity through the use of permanent magnets. J. Magn. Magn. Mater. 2017, 443, 149–158. [Google Scholar] [CrossRef]
  20. Mansoury, D.; Doshmanziari, F.I.; Kiani, A.; Chamkha, A.J. Heat transfer and flow characteristics of Al2O3/water nanofluid in various heat exchangers: Experiments on counter flow. Heat Transf. Eng. 2020, 41, 1–37. [Google Scholar] [CrossRef]
  21. Mayeli, P.; Hesami, H.; Besharati-Foumani, H.; Niajalili, M. Al2O3–Water nanofluid heat transfer and entropy generation in a ribbed channel with wavy wall in the presence of magnetic field. Numer. Heat Transf. Part A Appl. 2018, 73, 604–623. [Google Scholar] [CrossRef]
  22. Chun, B.-H.; Kang, H.U.; Kim, S.H. Effect of alumina nanoparticles in the fluid on heat transfer in double-pipe heat exchanger system. Korean J. Chem. Eng. 2008, 25, 966–971. [Google Scholar] [CrossRef]
  23. Ghosh, S.; Mukhopadhyay, S. Flow and heat transfer of nanofluid over an exponentially shrinking porous sheet with heat and mass fluxes. Propuls. Power Res. 2018, 7, 268–275. [Google Scholar] [CrossRef]
  24. Yang, C.; Wu, X.; Zheng, Y.; Qiu, T. Heat transfer performance assessment of hybrid nanofluids in a parallel channel under identical pumping power. Chem. Eng. Sci. 2017, 168, 67–77. [Google Scholar] [CrossRef]
  25. Khoshvaght-Aliabadi, M.; Hormozi, F. Investigation on Heat Transfer and Pressure Drop of Copper–Water Nanofluid Flow in Plain and Perforated Channels. Exp. Heat Transf. 2015, 29, 427–444. [Google Scholar] [CrossRef]
  26. Xuan, Y.; Li, Q. Investigation on Convective Heat Transfer and Flow Features of Nanofluids. J. Heat Transf. 2003, 125, 151–155. [Google Scholar] [CrossRef] [Green Version]
  27. Xia, G.; Liu, R.; Wang, J.; Du, M. The characteristics of convective heat transfer in microchannel heat sinks using Al2O3 and TiO2 nanofluids. Int. Commun. Heat Mass Transf. 2016, 76, 256–264. [Google Scholar] [CrossRef]
  28. Parashar, A.K.; Gupta, A. Investigation of the effect of bagasse ash, hooked steel fibers and glass fibers on the mechanical properties of concrete. Mater. Today Proc. 2001, 44, 801–807. [Google Scholar] [CrossRef]
  29. Ekiciler, R.; Çetinkaya, M.S.A. A comparative heat transfer study between monotype and hybrid nanofluid in a duct with various shapes of ribs. Therm. Sci. Eng. Prog. 2021, 23, 100913. [Google Scholar] [CrossRef]
  30. Wang, G.; Feng, L.; Altanji, M.; Sharma, K.; Nisar, K.S.; Khorasani, S. Proposing novel “L” shaped fin to boost the melting performance of a vertical PCM enclosure. Case Stud. Therm. Eng. 2021, 28, 101465. [Google Scholar] [CrossRef]
  31. Çobanoğlu, N.; Banisharif, A.; Estellé, P.; Karadeniz, Z.H. The developing flow characteristics of water—Ethylene glycol mixture based Fe3O4 nanofluids in eccentric annular ducts in low temperature applications. Int. J. Thermofluids 2022, 14, 100149. [Google Scholar] [CrossRef]
  32. Vinoth, R.; Sachuthananthan, B.; Vadivel, A.; Balakrishnan, S.; Raj, A.G.S. Heat transfer enhancement in oblique finned curved microchannel using hybrid nanofluid. Int. J. Therm. Sci. 2023, 183, 107848. [Google Scholar] [CrossRef]
  33. Fujimoto, K.; Shibata, A.; Torii, S. An experimental and numerical study of turbulent heat transfer enhancement for graphene nanofluids produced by pulsed discharge. Int. J. Thermofluids 2022, 16, 100219. [Google Scholar] [CrossRef]
  34. Ho, C.; Huang, S.; Lai, C.-M. Enhancing laminar forced convection heat transfer by using Al2O3/PCM nanofluids in a concentric double-tube duct. Case Stud. Therm. Eng. 2022, 35, 102147. [Google Scholar] [CrossRef]
  35. Jalili, B.; Aghaee, N.; Jalili, P.; Ganji, D.D. Novel usage of the curved rectangular fin on the heat transfer of a double-pipe heat exchanger with a nanofluid. Case Stud. Therm. Eng. 2022, 35, 102086. [Google Scholar] [CrossRef]
  36. Zhang, H.; Nunayon, S.S.; Jin, X.; Lai, A.C. Pressure drop and nanoparticle deposition characteristics for multiple twisted tape inserts with partitions in turbulent duct flows. Int. J. Heat Mass Transf. 2022, 193, 121474. [Google Scholar] [CrossRef]
  37. Omri, M.; Smaoui, H.; Frechette, L.; Kolsi, L. A new microchannel heat exchanger configuration using CNT-nanofluid and allowing uniform temperature on the active wall. Case Stud. Therm. Eng. 2022, 32, 101866. [Google Scholar] [CrossRef]
  38. American Society of Heating, Refrigerating and Air-Conditioning Engineers. Methods of Testing to Determine the Thermal Performance of Solar Collectors; Technical Report ASHRAE-93-1986/XAB; ASHRAE: Washington, DC, USA, 1991. [Google Scholar]
  39. Ho, C.; Wei, L.; Li, Z. An experimental investigation of forced convective cooling performance of a microchannel heat sink with Al2O3/water nanofluid. Appl. Therm. Eng. 2010, 30, 96–103. [Google Scholar] [CrossRef]
  40. Vajjha, R.S.; Das, D.K. Experimental determination of thermal conductivity of three nanofluids and development of new correlations. Int. J. Heat Mass Transf. 2009, 52, 4675–4682. [Google Scholar] [CrossRef]
  41. Seyf, H.R.; Mohammadian, S.K. Thermal and Hydraulic Performance of Counterflow Microchannel Heat Exchangers with and without Nanofluids. J. Heat Transf. 2011, 133, 081801. [Google Scholar] [CrossRef]
  42. Vanaki, S.; Mohammed, H.; Abdollahi, A.; Wahid, M. Effect of nanoparticle shapes on the heat transfer enhancement in a wavy channel with different phase shifts. J. Mol. Liq. 2014, 196, 32–42. [Google Scholar] [CrossRef]
  43. Dittus, F.W.; Boelter, L.M.K. Heat transfer in automobile radiators of the tubular type. Int. Commun. Heat Mass Transf. 1930, 12, 3–22. [Google Scholar] [CrossRef]
  44. Sharma, S.; Das, R.K.; Kulkarni, K. Computational and experimental assessment of solar air heater roughened with six different baffles. Case Stud. Therm. Eng. 2021, 27, 101350. [Google Scholar] [CrossRef]
  45. Klein, S. Calculation of flat-plate collector loss coefficients. Sol. Energy 1975, 17, 79–80. [Google Scholar] [CrossRef]
  46. Webb, R.; Eckert, E. Application of rough surfaces to heat exchanger design. Int. J. Heat Mass Transf. 1972, 15, 1647–1658. [Google Scholar] [CrossRef]
Figure 1. Discuss arc with dimpled rib parameters.
Sustainability 14 14675 g001
Figure 2. (a) Schematic and (b) pictorial view of the experimental setup and (c) dimpled surface.
Sustainability 14 14675 g002
Figure 3. Pictorial view of the homogenizer and stability of A l 2 O 3 nanofluid (a) Immediately after preparation (b) After 2 days (c) After 4 days.
Sustainability 14 14675 g003
Figure 4. Validation of experimental results for a smooth surface duct with (a) N u s s (b) f s s .
Sustainability 14 14675 g004
Figure 5. Error bars (a) Nusselt number (b) friction factor.
Sustainability 14 14675 g005
Figure 6. (a) Variation of N u r s with ϕ n p and   R e n u m (b) Variation of f r s with ϕ r s and R e n u m .
Sustainability 14 14675 g006
Figure 7. (a) Variation of N u r s with H A D / P d and   R e n u m (b) Variation of f r s with H A D / P d and   R e n u m .
Sustainability 14 14675 g007
Figure 8. (a) Variation of N u r s with P A D / H A D and R e n u m (b) Variation of f r s with P A D / H A D and R e n u m .
Sustainability 14 14675 g008
Figure 9. (a) Variation of N u r s with α A D and   R e n u m (b) Variation of f r s with α A D and R e n u m .
Sustainability 14 14675 g009
Figure 10. Secondary flow pattern in dimpled-arc ribs.
Sustainability 14 14675 g010
Figure 11. (a) Variation of η p e r with H A D / P d and   R e n u m (b) Variation of η p e r with P A D / H A D and   R e n u m (c) Variation of η p e r with α A D and R e n u m .
Sustainability 14 14675 g011
Figure 12. Deviation of experimental and predicted values of (a) N u T T , (b) f T T and (c) η T T .
Sustainability 14 14675 g012
Table 1. Range of dimpled arc rib and flow parameters.
S.N.ParametersRanges
1. H A D / P d 0.533–1.133
2. P A D / H A D 3.71–6.71
3. α A D 35°–65°
4. ϕ n p 1.5–4.5%
5. d n p 30 nm
6. R e n u m 5000–26,000
Publisher’s Note: MDPI stays neutral with regard to jurisdictional claims in published maps and institutional affiliations.