
Fuel Cell Types, Properties of Membrane, and Operating Conditions: A Review

 ,
,  ,
,  ,
, 
 ,
, 
Abstract
1. Introduction
2. Classifications of Fuel Cells
2.1. Alkaline Fuel Cells (AFCs)
- The diffusion coefficients and motilities of OH− anions are fewer than H+ in many media and quaternary ammonium ionic sets are not as much dissociated as the standard sets of sulfonic acid where (acid dissociation constant) pKa for sulfonic acid sets are usually −1. However, for quaternary ammonium groups, the associated pKb values are approximately +4. There were worries that AEMs would not have sufficient intrinsic ionic conductivities for implementation in fuel cells [33].
- The OH− anions are active nucleophiles that potentially cause removal by using (a) a direct nucleophilic dislocation and/or (b) a Hofmann removal reaction when a b-hydrogen is present; it is possible that OH− will also displace methyl groups (-CH3), forming tertiary amines and methanol [31,32]. If the AEMs include good leaving sets (e.g., QA –NMe+3 sets), then the chemical stability of the AEMs may have been insufficient for use in fuel cells, mainly at elevated temperatures.
- The precursor anion-exchange membranes are usually immersed in aqueous NaOH/KOH solutions to convert them to the OH− form AEM. The anion exchange membrane should have the chemical stability to endure this process. A decade ago, the stabilities of different benzyltrimethylammonium-based AEMs were tested and found to be stable up to 75 °C in NaOHaq at concentrations up to 6 mol/dm3 for many days [34].
2.2. Proton Exchange Membrane Fuel Cells (PEMFCs)
2.3. Solid Oxide Fuel Cells (SOFCs)
2.4. Phosphoric Acid Fuel Cells (PACFs)
2.5. Molten Carbonate Fuel Cells (MCFCs)
3. Basics and Materials
3.1. Membrane
Modification of Membranes for Fuel Cell Applications
3.2. Catalyst Layers
3.3. Gas Diffusion Layers
4. Effect of Operating Conditions on AEMFCs Performance
4.1. Effect of Cell Operating Temperature
4.2. Effect of Relative Humidity in Inlet Gases
4.3. Effect of Flow Direction
4.4. Various Polytetrafluoro Ethylene Loadings in Gas Diffusion Layers (GDLs) and Layers of Microporous Structure
4.5. High-Temperature Hydroxide Conductivity
4.6. Transportation of Water with Inert Humidified Gas
5. Conclusions
- For AFCs, generally, the liquid electrolyte used is an aqueous KOH solution. However, the presence of CO2 in the air feed stream leads to the formation of carbonate precipitation via the formation of large metal carbonate crystals, which might close the pores of the GDL on the electrode. Moreover, the inadequacy and instability could be attributed to the positive ionic sets and the moveable negatively charged anions within AEMs.
- PEMFCs, which ordinarily produce electricity over a chemical reaction amid hydrogen and oxygen or another oxidizing agent, have become more abundant in recent years because of their essential benefits. The outstanding characteristics of PEMFCs include: high energy density and efficiency; low working noise, cost, working temperature, and sulfur oxides; zero emissions of nitrogen oxides and CO2; short startup time; zero corrosion; and long life.
- SOFCs are a power-producing technology that regularly varies the traditional central system of the power supply into a decentralized power source system and directly installs power generation depending on the power consumption desires at the household position. The important benefit of this structure is its simple structure, which needs neither a separator nor gas storage.
- PAFCs do not have such a requirement as hydrogen and can be produced in situ from methanol (or similar liquid fuel). This permits phosphoric acid fuel cells to utilize available refueling and distribution systems. A phosphoric acid fuel cell usually houses phosphoric acid (H3PO4, PA) trapped in a matrix (normally of silicon carbide, SiC) as the electrolyte. Platinum with various loadings on carbon-based GDLs forms the electrodes, i.e., the anode and cathode.
- MCFCs can be united with gas or steam turbines to attain combined heat and power, developing energy use and conversion efficiency. The molten carbonate fuel cell organizes a mixture of alkali carbonates as the electrolyte and works at intermediate temperatures (550–650 °C) utilizing carbonaceous fuels, for example, the natural gas.
- Perfluorosulfonic acid (PFSA) is normally utilized as a proton exchange membrane material for PEM fuel cells. The major chain is Teflon-like and extremely hydrophobic. The sulfonic acid group as an end group of the side chain is greatly hydrophilic; therefore, it permits water adsorption for proton conduction.
- The catalyst plays a critical role in dropping the reaction activation barrier. Hydrogen fuel is oxidized in the anode, while the oxygen reduction reaction happens in the cathode. Platinum or its alloy is the prevalent catalyst for the oxygen reduction and hydrogen oxidation reactions. Consequently, the catalyst layer contributes an essential part of the cost of the fuel cell.
- When the anion exchange membrane fuel cell is operated at a high cell temperature, the membrane ion conductivity and reaction kinetics at the electrodes can be developed. In contrast, the greater cell operating temperature could contribute to better water transportation in the gas diffusion substrate, driven by shear force and evaporation, resulting in less liquid water entrapped inside the gas diffusion substrate and thus simplifying the permeability of humidified reactant gases and active water removal for the duration of the cell procedure.
- The rise of the humidification temperature advances the hydrogen‒oxygen reaction at the catalyst and overwhelms the performance degradation produced via inadequate gas concentration. Though, the extreme inlet humidification temperature is prospective to cause internal water flooding.
- The flow path in the channels does not meaningfully affect the fuel cell’s whole performance since the reactant materials supplied to the CL are not affected by the flow path for these operational conditions.
- Especially, a development in the performance of the cell is referred to when raising the polytetrafluoro ethylene loading in the anode microporous layer from 5 to 23%.
- For the duration of the exchange of the HCO-3 to OH−, the electrolyte’s conductivity quickly rises, and the mobility OH− ions are increased. After 30–40 h, the anion exchange membrane is in its true OH− form, yielding a stable conductivity plateau recognized as the proper OH− conductivity (166 mS/cm, cf. 152 mS/cm).
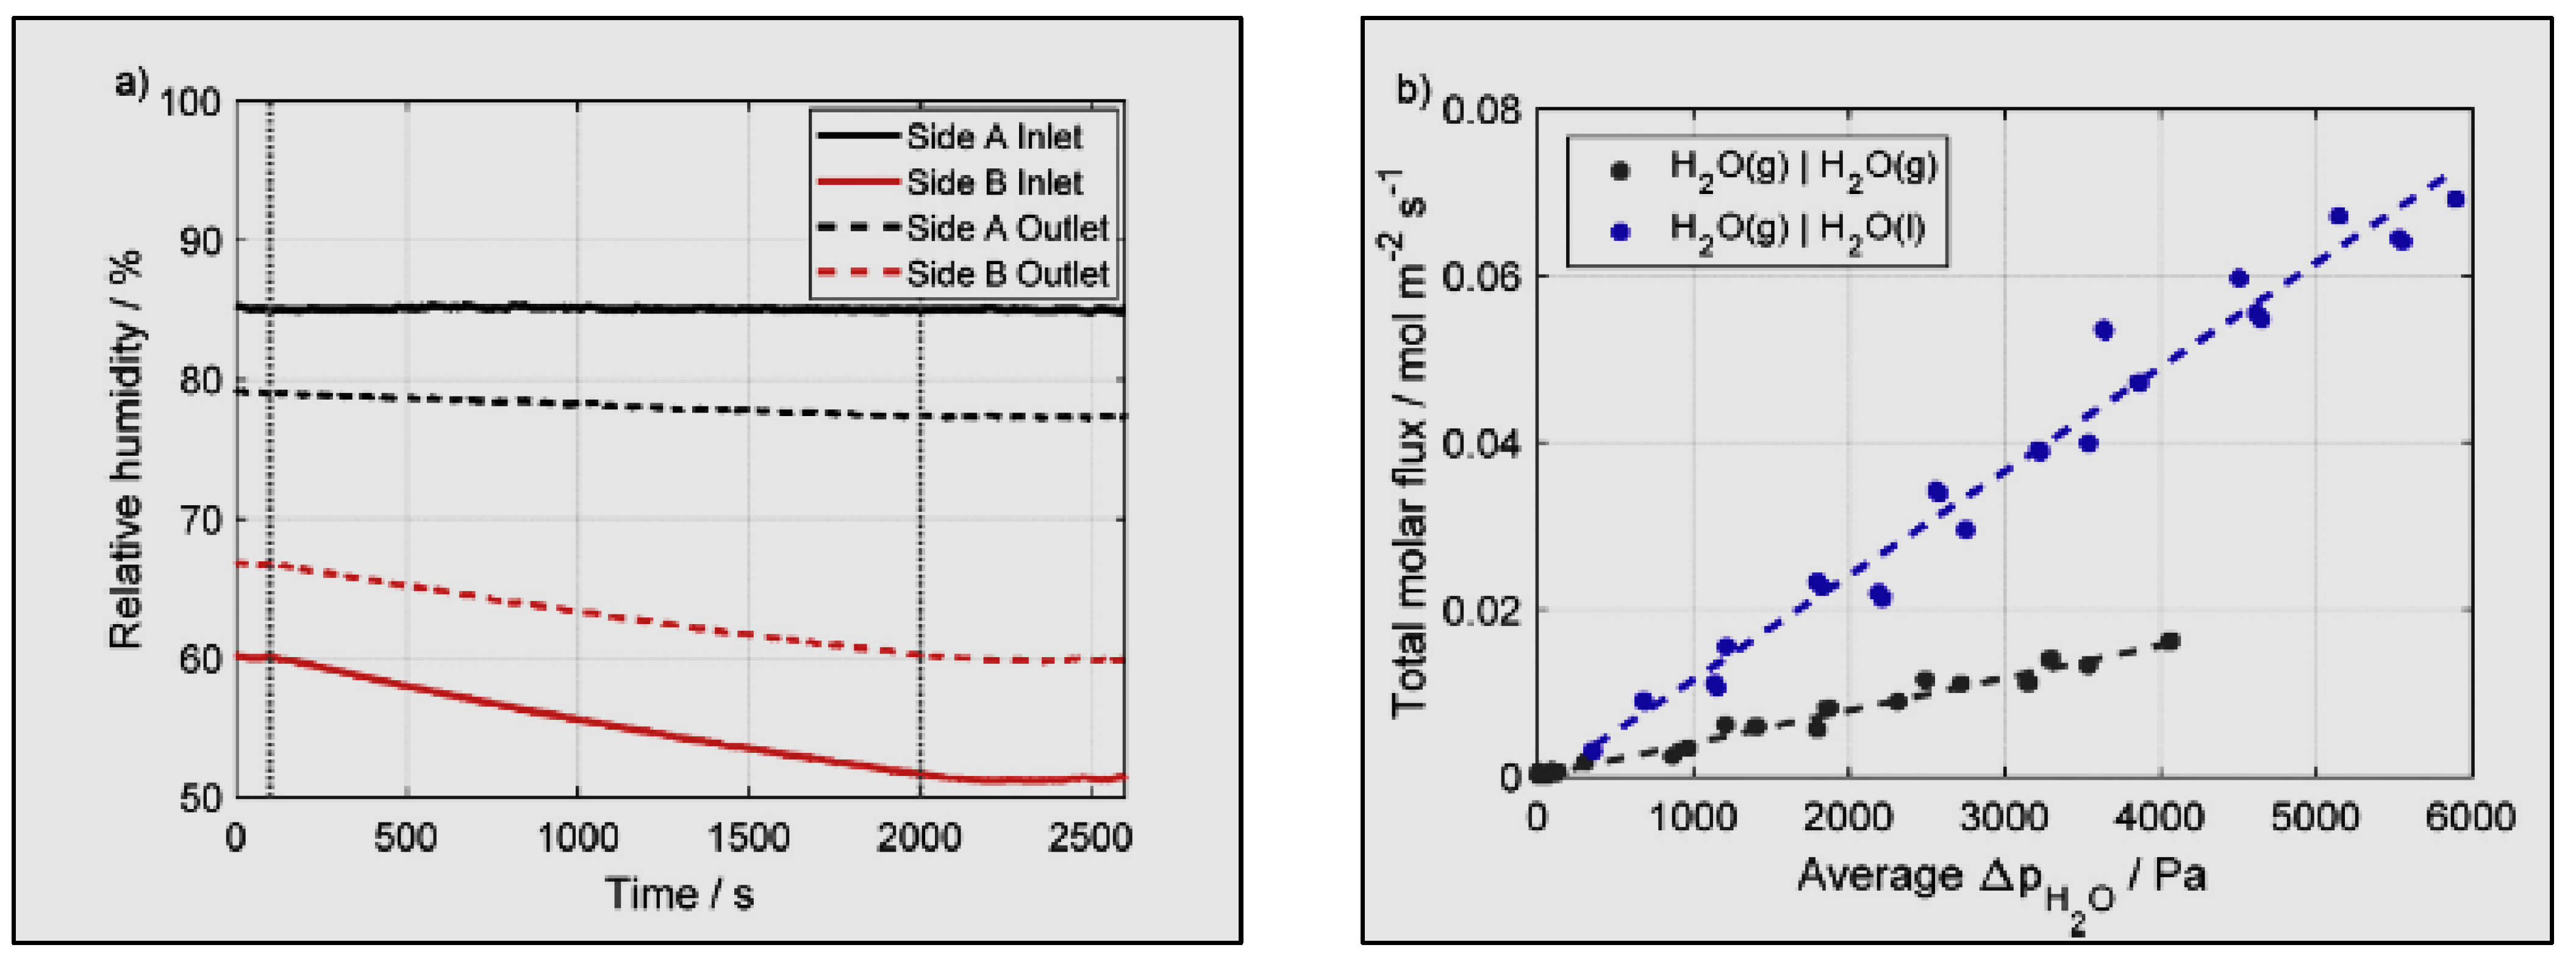
- The variance in water partial pressure is the only driving force for the transportation of water crossways in the membrane (water activity) amid the two sides of the membrane exchange assembly.
Author Contributions
Funding
Institutional Review Board Statement
Informed Consent Statement
Data Availability Statement
Acknowledgments
Conflicts of Interest
References
- Mandal, M. Recent advancement on anion exchange membranes for fuel cell and water electrolysis. ChemElectroChem 2021, 8, 36–45. [Google Scholar] [CrossRef]
- Cha, M.S.; Lee, J.Y.; Kim, T.-H.; Jeong, H.Y.; Shin, H.Y.; Oh, S.-G.; Hong, Y.T. Preparation and characterization of crosslinked anion exchange membrane (AEM) materials with poly (phenylene ether)-based short hydrophilic block for use in electrochemical applications. J. Membr. Sci. 2017, 530, 73–83. [Google Scholar] [CrossRef]
- Yang, Q.; Li, L.; Lin, C.X.; Gao, X.L.; Zhao, C.H.; Zhang, Q.G.; Zhu, A.M.; Liu, Q.L. Hyperbranched poly (arylene ether ketone) anion exchange membranes for fuel cells. J. Membr. Sci. 2018, 560, 77–86. [Google Scholar] [CrossRef]
- Sazali, N.; Wan Salleh, W.N.; Jamaludin, A.S.; Mhd Razali, M.N. New perspectives on fuel cell technology: A brief review. Membranes 2020, 10, 99. [Google Scholar] [CrossRef] [PubMed]
- Ramirez-Nava, J.; Martínez-Castrejón, M.; García-Mesino, R.L.; López-Díaz, J.A.; Talavera-Mendoza, O.; Sarmiento-Villagrana, A.; Rojano, F.; Hernández-Flores, G. The Implications of Membranes Used as Separators in Microbial Fuel Cells. Membranes 2021, 11, 738. [Google Scholar] [CrossRef] [PubMed]
- Chen, N.; Lee, Y.M. Anion exchange polyelectrolytes for membranes and ionomers. Prog. Polym. Sci. 2021, 113, 101345. [Google Scholar] [CrossRef]
- Lu, S.; Pan, J.; Huang, A.; Zhuang, L.; Lu, J. Alkaline polymer electrolyte fuel cells completely free from noble metal catalysts. Proc. Natl. Acad. Sci. USA 2008, 105, 20611–20614. [Google Scholar] [CrossRef]
- Biemolt, J.; Douglin, J.C.; Singh, R.K.; Davydova, E.S.; Yan, N.; Rothenberg, G.; Dekel, D.R. An Anion-Exchange Membrane Fuel Cell Containing Only Abundant and Affordable Materials. Energy Technol. 2021, 9, 2000909. [Google Scholar] [CrossRef]
- Dekel, D.R. Review of cell performance in anion exchange membrane fuel cells. J. Power Sources 2018, 375, 158–169. [Google Scholar] [CrossRef]
- Giorgi, L.; Leccese, F. Fuel Cells: Technologies and Applications. Open Fuel Cells J. 2013, 6, 1–20. [Google Scholar] [CrossRef]
- Omasta, T.; Wang, L.; Peng, X.; Lewis, C.; Varcoe, J.; Mustain, W.E. Importance of balancing membrane and electrode water in anion exchange membrane fuel cells. J. Power Sources 2018, 375, 205–213. [Google Scholar] [CrossRef]
- Mustain, W.E.; Chatenet, M.; Page, M.; Kim, Y.S. Durability challenges of anion exchange membrane fuel cells. Energy Environ. Sci. 2020, 13, 2805–2838. [Google Scholar] [CrossRef]
- Dekel, D.R.; Rasin, I.G.; Brandon, S. Predicting performance stability of anion exchange membrane fuel cells. J. Power Sources 2019, 420, 118–123. [Google Scholar] [CrossRef]
- Mohanty, A.D.; Tignor, S.E.; Sturgeon, M.R.; Long, H.; Pivovar, B.S.; Bae, C. Thermochemical stability study of alkyl-tethered quaternary ammonium cations for anion exchange membrane fuel cells. J. Electrochem. Soc. 2017, 164, F1279. [Google Scholar] [CrossRef]
- Pan, D.; Pham, T.H.; Jannasch, P. Poly (arylene piperidine) Anion Exchange Membranes with Tunable N-Alicyclic Quaternary Ammonium Side Chains. ACS Appl. Energy Mater. 2021, 4, 11652–11665. [Google Scholar] [CrossRef]
- Wright, A.G.; Fan, J.; Britton, B.; Weissbach, T.; Lee, H.-F.; Kitching, E.A.; Peckham, T.J.; Holdcroft, S. Hexamethyl-p-terphenyl poly (benzimidazolium): A universal hydroxide-conducting polymer for energy conversion devices. Energy Environ. Sci. 2016, 9, 2130–2142. [Google Scholar] [CrossRef]
- Hugar, K.M.; Kostalik IV, H.A.; Coates, G.W. Imidazolium cations with exceptional alkaline stability: A systematic study of structure–stability relationships. J. Am. Chem. Soc. 2015, 137, 8730–8737. [Google Scholar] [CrossRef]
- Nunez, S.A.; Capparelli, C.; Hickner, M.A. N-alkyl interstitial spacers and terminal pendants influence the alkaline stability of tetraalkylammonium cations for anion exchange membrane fuel cells. Chem. Mater. 2016, 28, 2589–2598. [Google Scholar] [CrossRef]
- Dang, H.-S.; Jannasch, P. Anion-exchange membranes with polycationic alkyl side chains attached via spacer units. J. Mater. Chem. A 2016, 4, 17138–17153. [Google Scholar] [CrossRef]
- Fan, J.; Wright, A.G.; Britton, B.; Weissbach, T.; Skalski, T.J.; Ward, J.; Peckham, T.J.; Holdcroft, S. Cationic polyelectrolytes, stable in 10 M KOHaq at 100 °C. ACS Macro Lett. 2017, 6, 1089–1093. [Google Scholar] [CrossRef]
- Mohanty, A.D.; Ryu, C.Y.; Kim, Y.S.; Bae, C. Stable elastomeric anion exchange membranes based on quaternary ammonium-tethered polystyrene-b-poly (ethylene-co-butylene)-b-polystyrene triblock copolymers. Macromolecules 2015, 48, 7085–7095. [Google Scholar] [CrossRef]
- Dekel, D.R.; Amar, M.; Willdorf, S.; Kosa, M.; Dhara, S.; Diesendruck, C.E. Effect of water on the stability of quaternary ammonium groups for anion exchange membrane fuel cell applications. Chem. Mater. 2017, 29, 4425–4431. [Google Scholar] [CrossRef]
- Diesendruck, C.E.; Dekel, D.R. Water—A key parameter in the stability of anion exchange membrane fuel cells. Curr. Opin. Electrochem. 2018, 9, 173–178. [Google Scholar] [CrossRef]
- Willdorf-Cohen, S.; Mondal, A.N.; Dekel, D.R.; Diesendruck, C.E. Chemical stability of poly (phenylene oxide)-based ionomers in an anion exchange-membrane fuel cell environment. J. Mater. Chem. A 2018, 6, 22234–22239. [Google Scholar] [CrossRef]
- Dekel, D.R.; Willdorf, S.; Ash, U.; Amar, M.; Pusara, S.; Dhara, S.; Srebnik, S.; Diesendruck, C.E. The critical relation between chemical stability of cations and water in anion exchange membrane fuel cells environment. J. Power Sources 2018, 375, 351–360. [Google Scholar] [CrossRef]
- Merle, G.; Wessling, M.; Nijmeijer, K. Anion exchange membranes for alkaline fuel cells: A review. J. Membr. Sci. 2011, 377, 1–35. [Google Scholar] [CrossRef]
- Zeng, R.; Varcoe, J. R Alkaline anion exchange membranes for fuel cells-a patent review. Recent Pat. Chem. Eng. 2011, 4, 93–115. [Google Scholar] [CrossRef][Green Version]
- McLean, G.; Niet, T.; Prince-Richard, S.; Djilali, N. An assessment of alkaline fuel cell technology. Int. J. Hydrog. Energy 2002, 27, 507–526. [Google Scholar] [CrossRef]
- Khade, A.R. Anion Exchange Membranes for Alkaline Fuel Cells. Int. J. Sci. Res. 2015, 4, 1406–1408. [Google Scholar]
- Khade, A.R. Fuel Cell Technologies and Applications. Int. J. Sci. Res. 2014, 3, 978–982. [Google Scholar]
- Zagorodni, A.A.; Kotova, D.L.; Selemenev, V.F. Infrared spectroscopy of ion exchange resins: Chemical deterioration of the resins. React. Funct. Polym. 2002, 53, 157–171. [Google Scholar] [CrossRef]
- Neagu, V.; Bunia, I.; Plesca, I. Ionic polymers VI. Chemical stability of strong base anion exchangers in aggressive media. Polym. Degrad. Stab. 2000, 70, 463–468. [Google Scholar] [CrossRef]
- Slade, R.C.; Kizewski, J.P.; Poynton, S.D.; Zeng, R.; Varcoe, J.R. Alkaline membrane fuel cells. In Fuel Cells; Springer: Berlin/Heidelberg, Germany, 2013; pp. 9–29. [Google Scholar]
- Sata, T.; Tsujimoto, M.; Yamaguchi, T.; Matsusaki, K. Change of anion exchange membranes in an aqueous sodium hydroxide solution at high temperature. J. Membr. Sci. 1996, 112, 161–170. [Google Scholar] [CrossRef]
- Habib, M.S.; Arefin, P.; Salam, M.A.; Ahmed, K.; Uddin, M.S.; Hossain, T.; Papri, N.; Islam, T. Proton Exchange Membrane Fuel Cell (PEMFC) Durability Factors, Challenges, and Future Perspectives: A Detailed Review. Mat. Sci. Res. India 2021, 18, 217–234. [Google Scholar] [CrossRef]
- Jia, J.; Li, Q.; Wang, Y.; Cham, Y.; Han, M. Modeling and dynamic characteristic simulation of a proton exchange membrane fuel cell. IEEE Trans. Energy Convers. 2009, 24, 283–291. [Google Scholar] [CrossRef]
- Al-Shamma’a, A.A.; Ali, F.A.A.; Alhoshan, M.S.; Alturki, F.A.; Farh, H.M.; Alam, J.; AlSharabi, K. Proton Exchange Membrane Fuel Cell Parameter Extraction Using a Supply–Demand-Based Optimization Algorithm. Processes 2021, 9, 1416. [Google Scholar] [CrossRef]
- Chikhaliya, N.P.; Rathwa, Y.J.; Likhariya, T. Polybenzimidazoles as proton exchange membrane in fuel cell applications. High Perform. Polym. 2021, 33, 998–1011. [Google Scholar] [CrossRef]
- Zou, Y.; Yang, M.; Liu, G.; Xu, C. Sulfonated poly (fluorenyl ether ketone nitrile) membranes used for high temperature PEM fuel cell. Heliyon 2020, 6, e04855. [Google Scholar] [CrossRef]
- Miyake, J.; Miyatake, K. Fluorine-free sulfonated aromatic polymers as proton exchange membranes. Polym. J. 2017, 49, 487–495. [Google Scholar] [CrossRef]
- Zheng, P.; Liu, Q.; Li, Z.; Wang, D.; Liu, X. Effect of crosslinking degree on sulfonated poly (aryl ether nitrile) s as candidates for proton exchange membranes. Polymers 2019, 11, 964. [Google Scholar] [CrossRef]
- Tian, S.; Shu, D.; Wang, S.; Xiao, M.; Meng, Y. Sulfonated poly (fluorenyl ether ketone nitrile) electrolyte membrane with high proton conductivity and low water uptake. J. Power Sources 2010, 195, 97–103. [Google Scholar] [CrossRef]
- Cocco, D.; Tola, V. Externally reformed solid oxide fuel cell–micro-gas turbine (SOFC–MGT) hybrid systems fueled by methanol and di-methyl-ether (DME). Energy 2009, 34, 2124–2130. [Google Scholar] [CrossRef]
- Li, W.; Wang, Y.; Liu, W. A review of solid oxide fuel cell application. In IOP Conference Series: Earth and Environmental Science; IOP Publishing: Bristol, UK, 2020; p. 619. [Google Scholar]
- Hanna, J.; Lee, W.Y.; Shi, Y.; Ghoniem, A.F. Fundamentals of electro-and thermochemistry in the anode of solid-oxide fuel cells with hydrocarbon and syngas fuels. Prog. Energy Combust. Sci. 2014, 40, 74–111. [Google Scholar] [CrossRef]
- Sadykov, V.A.; Sadovskaya, E.M.; Eremeev, N.F.; Pikalova, E.Y.; Bogdanovich, N.M.; Filonova, E.A.; Krieger, T.A.; Fedorova, Y.E.; Krasnov, A.V.; Skriabin, P.I. Novel materials for solid oxide fuel cells cathodes and oxygen separation membranes: Fundamentals of oxygen transport and performance. Carbon Resour. Convers. 2020, 3, 112–121. [Google Scholar] [CrossRef]
- Sadykov, V.A.; Mezentseva, N.V.; Bobrova, L.; Smorygo, O. Advanced materials for solid oxide fuel cells and membrane catalytic reactors. In Advanced Nanomaterials for Catalysis and Energy: Synthesis, Characterization and Applications; Elsevier: Amsterdam, The Netherlands, 2019; Chapter 12; pp. 435–514. [Google Scholar]
- Sadykov, V.; Sadovskaya, E.; Eremeev, N.; Skriabin, P.; Krasnov, A.; Bespalko, Y.N.; Pavlova, S.; Fedorova, Y.E.; Pikalova, E.Y.; Shlyakhtina, A. Oxygen mobility in the materials for solid oxide fuel cells and catalytic membranes. Russ. J. Electrochem. 2019, 55, 701–718. [Google Scholar] [CrossRef]
- Sadykov, V.A.; Muzykantov, V.S.; Yeremeev, N.F.; Pelipenko, V.V.; Sadovskaya, E.M.; Bobin, A.S.; Fedorova, Y.E.; Amanbaeva, D.G.; Smirnova, A.L. Solid oxide fuel cell cathodes: Importance of chemical composition and morphology. Catal. Sustain. Energy 2015, 2, 57–70. [Google Scholar] [CrossRef]
- Adler, S.B.; Lane, J.; Steele, B. Electrode kinetics of porous mixed-conducting oxygen electrodes. J. Electrochem. Soc. 1996, 143, 3554. [Google Scholar] [CrossRef]
- Steele, B.C.; Heinzel, A. Materials for fuel-cell technologies. In Materials for Sustainable Energy: A Collection of Peer-Reviewed Research and Review Articles from Nature Publishing Group; World Scientific: Singapore, 2011; pp. 224–231. [Google Scholar]
- Basu, S. Fuel Cell Science and Technology; Springer: Berlin/Heidelberg, Germany, 2007. [Google Scholar]
- Sadykov, V.; Eremeev, N.; Alikina, G.; Sadovskaya, E.; Muzykantov, V.; Pelipenko, V.; Bobin, A.; Krieger, T.; Belyaev, V.; Ivanov, V. Oxygen mobility and surface reactivity of PrNi1− xCoxO3+ δ–Ce0. 9Y0. 1O2− δ cathode nanocomposites. Solid State Ion. 2014, 262, 707–712. [Google Scholar] [CrossRef]
- Sadykov, V.; Eremeev, N.; Vinokurov, Z.; Shmakov, A.; Kriventsov, V.; Lukashevich, A.; Krasnov, A.; Ishchenko, A. Structural studies of pr nickelate-cobaltite-Y-doped ceria nanocomposite. J. Ceram. Sci. Technol. 2017, 8, 129–140. [Google Scholar]
- Sadykov, V.; Sadovskaya, E.; Eremeev, N.; Pikalova, E.; Bogdanovich, N.; Filonova, E.; Fedorova, Y.; Krasnov, A.; Skriabin, P.; Lukashevich, A. Design of materials for solid oxide fuel cells cathodes and oxygen separation membranes based on fundamental studies of their oxygen mobility and surface reactivity. In E3S Web of Conferences; EDP Sciences: Wrocław, Poland, 2019. [Google Scholar]
- Wang, H.-S.; Chang, C.-P.; Huang, Y.-J.; Su, Y.-C.; Tseng, F.-G. A high-yield and ultra-low-temperature methanol reformer integratable with phosphoric acid fuel cell (PAFC). Energy 2017, 133, 1142–1152. [Google Scholar] [CrossRef]
- Bhosale, A.C.; Suseendiran, S.R.; Ramya, R.; Choudhury, S.R.; Rengaswamy, R. 4.17-Phosphoric Acid Fuel Cells. In Comprehensive Renewable Energy, 2nd ed.; Letcher, T.M., Ed.; Elsevier: Oxford, UK, 2022; pp. 437–458. [Google Scholar]
- Netwall, C.J.; Gould, B.D.; Rodgers, J.A.; Nasello, N.J.; Swider-Lyons, K.E. Decreasing contact resistance in proton-exchange membrane fuel cells with metal bipolar plates. J. Power Sources 2013, 227, 137–144. [Google Scholar] [CrossRef]
- Tanno, K.; Makino, H. Development tendency and prospect of high performance coal utilization power generation system for low carbon society. KONA Powder Part. J. 2018, 35, 139–149. [Google Scholar] [CrossRef]
- Hilmi, A.; Yuh, C.; Farooque, M. Fuel Cells–Molten Carbonate Fuel Cells| Anodes. ECS Trans. 2014, 61. [Google Scholar] [CrossRef]
- Cui, C.; Li, S.; Gong, J.; Wei, K.; Hou, X.; Jiang, C.; Yao, Y.; Ma, J. Review of molten carbonate-based direct carbon fuel cells. Mater. Renew. Sustain. Energy 2021, 10, 1–24. [Google Scholar]
- Xing, H.; Stuart, C.; Spence, S.; Chen, H. Fuel cell power systems for maritime applications: Progress and perspectives. Sustainability 2021, 13, 1213. [Google Scholar] [CrossRef]
- Brunetti, A.; Scura, F.; Barbieri, G.; Drioli, E. Membrane technologies for CO2 separation. J. Membr. Sci. 2010, 359, 115–125. [Google Scholar] [CrossRef]
- Merkel, T.C.; Lin, H.; Wei, X.; Baker, R. Power plant post-combustion carbon dioxide capture: An opportunity for membranes. J. Membr. Sci. 2010, 359, 126–139. [Google Scholar] [CrossRef]
- Zhao, L.; Riensche, E.; Blum, L.; Stolten, D. Multi-stage gas separation membrane processes used in post-combustion capture: Energetic and economic analyses. J. Membr. Sci. 2010, 359, 160–172. [Google Scholar] [CrossRef]
- Hu, Q.; Marand, E.; Dhingra, S.; Fritsch, D.; Wen, J.; Wilkes, G. Poly (amide-imide)/TiO2 nano-composite gas separation membranes: Fabrication and characterization. J. Membr. Sci. 1997, 135, 65–79. [Google Scholar] [CrossRef]
- Kawakami, M.; Iwanaga, H.; Hara, Y.; Iwamoto, M.; Kagawa, S. Gas permeabilities of cellulose nitrate/poly (ethylene glycol) blend membranes. J. Appl. Polym. Sci. 1982, 27, 2387–2393. [Google Scholar] [CrossRef]
- Ma’mum, S.; Svendsen, H.F.; Hoff, K.A.; Juliussen, O. Selection of new absorbents for carbon dioxide capture. In Greenhouse Gas Control Technologies 7; Elsevier: Amsterdam, The Netherlands, 2005; pp. 45–53. [Google Scholar]
- Lin, H.; Freeman, B.D. Materials selection guidelines for membranes that remove CO2 from gas mixtures. J. Mol. Struct. 2005, 739, 57–74. [Google Scholar] [CrossRef]
- Chen, H.Z.; Li, P.; Chung, T.-S. PVDF/ionic liquid polymer blends with superior separation performance for removing CO2 from hydrogen and flue gas. Int. J. Hydrog. Energy 2012, 37, 11796–11804. [Google Scholar] [CrossRef]
- Alhassan, M.; Garba, M.U. Design of an Alkaline Fuel Cell. Leonardo Electron. J. Pract. Technol. 2006, 5, 99–106. [Google Scholar]
- Ariyanfar, L.; Ghadamian, H.; Roshandel, R. Alkaline Fuel Cell (AFC) engineering design, modeling and simulation for UPS provide in laboratory application. In World Renewable Energy Congress-Sweden, Linköping; Sweden, 8–13 May; 2011; Linköping Electronic Press: Linköping, Sweden, 2011. [Google Scholar]
- Zhang, S.; Reimer, U.; Rahim, Y.; Beale, S.B.; Lehnert, W. Numerical modeling of polymer electrolyte fuel cells with analytical and experimental validation. J. Electrochem. Energy Convers. Storage 2019, 16, 031002. [Google Scholar] [CrossRef]
- Buasri, P.; Salameh, Z.M. An electrical circuit model for a proton exchange membrane fuel cell (PEMFC). In Proceedings of the 2006 IEEE Power Engineering Society General Meeting, Montreal, QC, Canada, 18–22 June 2006. [Google Scholar]
- Goodenough, J.B.; Huang, Y.-H. Alternative anode materials for solid oxide fuel cells. J. Power Sources 2007, 173, 1–10. [Google Scholar] [CrossRef]
- Holcomb, F.H.B.; Taylor, M.J.; Torrey, W.R.; Westerman, J.M.; John, F. Phosphoric Acid Fuel Cells; E.R.a.D. Center, Ed.; Defense Technical Information Center: Fort Belvoir, VI, USA, 2000. [Google Scholar]
- Zhang, H.; Lin, G.; Chen, J. Performance analysis and multi-objective optimization of a new molten carbonate fuel cell system. Int. J. Hydrog. Energy 2011, 36, 4015–4021. [Google Scholar] [CrossRef]
- Wang, Y.; Seo, B.; Wang, B.; Zamel, N.; Jiao, K.; Adroher, X.C. Fundamentals, materials, and machine learning of polymer electrolyte membrane fuel cell technology. Energy AI 2020, 1, 100014. [Google Scholar] [CrossRef]
- Ma, Y.-L.; Wainright, J.; Litt, M.; Savinell, R. Conductivity of PBI membranes for high-temperature polymer electrolyte fuel cells. J. Electrochem. Soc. 2003, 151, A8. [Google Scholar] [CrossRef]
- Zhang, J.; Xie, Z.; Zhang, J.; Tang, Y.; Song, C.; Navessin, T.; Shi, Z.; Song, D.; Wang, H.; Wilkinson, D.P. High temperature PEM fuel cells. J. Power Sources 2006, 160, 872–891. [Google Scholar] [CrossRef]
- Zaidi, J.; Matsuura, T. Polymer Membranes for Fuel Cells; Springer: Cham, Switzerland, 2009; pp. 1–431. [Google Scholar]
- Shi, S.; Weber, A.Z.; Kusoglu, A. Structure/property relationship of Nafion XL composite membranes. J. Membr. Sci. 2016, 516, 123–134. [Google Scholar] [CrossRef]
- Eisenberg, A.; Yeager, H.L. Perfluorinated Ionomer Membranes; ACS Publications: Washington, DC, USA, 1982. [Google Scholar]
- Kreuer, K.D.; Rabenau, A.; Weppner, W. Vehicle mechanism, a new model for the interpretation of the conductivity of fast proton conductors. Angew. Chem. Int. Ed. Engl. 1982, 21, 208–209. [Google Scholar] [CrossRef]
- Kornyshev, A.; Kuznetsov, A.; Spohr, E.; Ulstrup, J. Kinetics of Proton Transport in Water; ACS Publications: Washington, DC, USA, 2003; pp. 3351–3366. [Google Scholar]
- Marx, D.; Tuckerman, M.E.; Hutter, J.; Parrinello, M. The nature of the hydrated excess proton in water. Nature 1999, 397, 601–604. [Google Scholar] [CrossRef]
- Springer, T.E.; Zawodzinski, T.; Gottesfeld, S. Polymer electrolyte fuel cell model. J. Electrochem. Soc. 1991, 138, 2334. [Google Scholar] [CrossRef]
- Wu, J.; Yuan, X.Z.; Martin, J.J.; Wang, H.; Zhang, J.; Shen, J.; Wu, S.; Merida, W. A review of PEM fuel cell durability: Degradation mechanisms and mitigation strategies. J. Power Sources 2008, 184, 104–119. [Google Scholar] [CrossRef]
- Kraytsberg, A.; Ein-Eli, Y. Review of advanced materials for proton exchange membrane fuel cells. Energy Fuels 2014, 28, 7303–7330. [Google Scholar] [CrossRef]
- Mehta, V.; Cooper, J.S. Review and analysis of PEM fuel cell design and manufacturing. J. Power Sources 2003, 114, 32–53. [Google Scholar] [CrossRef]
- Yu, J.; Yi, B.; Xing, D.; Liu, F.; Shao, Z.; Fu, Y.; Zhang, H. Degradation mechanism of polystyrene sulfonic acid membrane and application of its composite membranes in fuel cells. Phys. Chem. Chem. Phys. 2003, 5, 611–615. [Google Scholar] [CrossRef]
- Adanur, S.; Zheng, H. Synthesis and characterization of sulfonated polyimide based membranes for proton exchange membrane fuel cells. J. Fuel Cell Sci. Technol. 2013, 10, 041001. [Google Scholar] [CrossRef]
- Hwang, K.; Kim, J.-H.; Kim, S.-Y.; Byun, H. Preparation of polybenzimidazole-based membranes and their potential applications in the fuel cell system. Energies 2014, 7, 1721–1732. [Google Scholar] [CrossRef]
- Gao, Y.; Zhang, Z.; Zhong, S.; Daneshfar, R. Preparation and Application of Aromatic Polymer Proton Exchange Membrane with Low-Sulfonation Degree. Int. J. Chem. Eng. 2020, 2020, 8834471. [Google Scholar] [CrossRef]
- Zamel, N. The catalyst layer and its dimensionality–A look into its ingredients and how to characterize their effects. J. Power Sources 2016, 309, 141–159. [Google Scholar] [CrossRef]
- Lufrano, F.; Squadrito, G.; Patti, A.; Passalacqua, E. Sulfonated polysulfone as promising membranes for polymer electrolyte fuel cells. J. Appl. Polym. Sci. 2000, 77, 1250–1256. [Google Scholar] [CrossRef]
- Wang, L.; Liu, Y.; Yang, X.; Fang, Y.; Chen, Y.; Wang, Y. A high-performance direct methanol fuel cell with a polymer fiber membrane and RuO2/CNTs as a cathode catalyst. J. Mater. Chem. A 2013, 1, 1834–1839. [Google Scholar] [CrossRef]
- Salleh, M.T.; Jaafar, J.; Mohamed, M.; Norddin, M.; Ismail, A.; Othman, M.; Rahman, M.; Yusof, N.; Aziz, F.; Salleh, W. Stability of SPEEK/Cloisite®/TAP nanocomposite membrane under Fenton reagent condition for direct methanol fuel cell application. Polym. Degrad. Stab. 2017, 137, 83–99. [Google Scholar] [CrossRef]
- Gupta, D.; Choudhary, V. Non-fluorinated hybrid composite membranes based on polyethylene glycol functionalized polyhedral oligomeric silsesquioxane [PPOSS] and sulfonated poly(ether ether ketone) [SPEEK] for fuel cell applications. React. Funct. Polym. 2013, 73, 1268–1280. [Google Scholar] [CrossRef]
- Ni, C.; Wei, Y.; Zhao, Q.; Liu, B.; Sun, Z.; Gu, Y.; Zhang, M.; Hu, W. Novel proton exchange membranes based on structure-optimized poly(ether ether ketone ketone)s and nanocrystalline cellulose. Appl. Surf. Sci. 2018, 434, 163–175. [Google Scholar] [CrossRef]
- Wang, W.; Wang, S.; Li, W.; Xie, X.; Lv, Y. Synthesis and characterization of a fluorinated cross-linked anion exchange membrane. Int. J. Hydrog. Energy 2013, 38, 11045–11052. [Google Scholar] [CrossRef]
- Ko, B.-S.; Sohn, J.-Y.; Shin, J. Radiation-induced synthesis of solid alkaline exchange membranes with quaternized 1,4-diazabicyclo[2,2,2] octane pendant groups for fuel cell application. Polymer 2012, 53, 4652–4661. [Google Scholar] [CrossRef]
- Razmi, A.; Alirahmi, S.; Nabat, M.; Assareh, E.; Shahbakhti, M. A green hydrogen energy storage concept based on parabolic trough collector and proton exchange membrane electrolyzer/fuel cell: Thermodynamic and exergoeconomic analyses with multi-objective optimization. Int. J. Hydrog. Energy 2022, 47, 26468–26489. [Google Scholar] [CrossRef]
- Elumalai, V.; Sangeetha, D. Anion exchange composite membrane based on octa quaternary ammonium Polyhedral Oligomeric Silsesquioxane for alkaline fuel cells. J. Power Sources 2018, 375, 412–420. [Google Scholar] [CrossRef]
- Lade, H.; Kumar, V.; Arthanareeswaran, G.; Ismail, A. Sulfonated poly(arylene ether sulfone) nanocomposite electrolyte membrane for fuel cell applications: A review. Int. J. Hydrog. Energy 2017, 42, 1063–1074. [Google Scholar] [CrossRef]
- Kim, D.J.; Jo, M.J.; Nam, S.Y. A review of polymer–nanocomposite electrolyte membranes for fuel cell application. J. Ind. Eng. Chem. 2015, 21, 36–52. [Google Scholar] [CrossRef]
- Fang, F.; Liu, L.; Min, L.; Xu, L.; Zhang, W.; Wang, Y. Enhanced proton conductivity of Nafion membrane with electrically aligned sulfonated graphene nanoplates. Int. J. Hydrog. Energy 2021, 4, 17784–17792. [Google Scholar] [CrossRef]
- Yu, P.; Pemberton, M.; Plasse, P. PtCo/C cathode catalyst for improved durability in PEMFCs. J. Power Sources 2005, 144, 11–20. [Google Scholar] [CrossRef]
- Ferreira, P.; Shao-Horn, Y.; Morgan, D.; Makharia, R.; Kocha, S.; Gasteiger, H. Instability of Pt∕ C electrocatalysts in proton exchange membrane fuel cells: A mechanistic investigation. J. Electrochem. Soc. 2005, 152, A2256. [Google Scholar] [CrossRef]
- Vielstich, W.; Lamm, A.; Gasteiger, H. Handbook of Fuel Cells: Fundamentals, Technology, Applications; Wiley: Hoboken, NJ, USA, 2003. [Google Scholar]
- Debe, M. Advanced Cathode Catalysts and Supports for PEM Fuel Cells; 3M Company: Maplewood, MN, USA, 2012. [Google Scholar]
- Debe, M.K. Electrocatalyst approaches and challenges for automotive fuel cells. Nature 2012, 48, 43–51. [Google Scholar] [CrossRef]
- Rao, R.M.; Rengaswamy, R. Optimization study of an agglomerate model for platinum reduction and performance in PEM fuel cell cathode. Chem. Eng. Res. Des. 2006, 84, 952–964. [Google Scholar]
- Van Der Vliet, D.F.; Wang, C.; Tripkovic, D.; Strmcnik, D.; Zhang, X.F.; Debe, M.K.; Atanasoski, R.T.; Markovic, N.M.; Stamenkovic, V.R. Mesostructured thin films as electrocatalysts with tunable composition and surface morphology. Nat. Mater. 2012, 11, 1051–1058. [Google Scholar] [CrossRef]
- Wang, Y.; Feng, X. Analysis of the reaction rates in the cathode electrode of polymer electrolyte fuel Cells: II. Dual-Layer electrodes. J. Electrochem. Soc. 2009, 156, B403. [Google Scholar] [CrossRef]
- Feng, X.; Wang, Y. Multi-layer configuration for the cathode electrode of polymer electrolyte fuel cell. Electrochim. Acta 2010, 55, 4579–4586. [Google Scholar] [CrossRef]
- He, W.; Yi, J.S.; van Nguyen, T. Two-phase flow model of the cathode of PEM fuel cells using interdigitated flow fields. AIChE J. 2000, 46, 2053–2064. [Google Scholar] [CrossRef]
- Banham, D.; Ye, S. Current status and future development of catalyst materials and catalyst layers for proton exchange membrane fuel cells: An industrial perspective. ACS Energy Lett. 2017, 2, 629–638. [Google Scholar] [CrossRef]
- Othman, R.; Dicks, A.L.; Zhu, Z. Non Precious Metal Catalysts for the PEM Fuel Cell Cathode. Int. J. Hydrog. Energy 2012, 37, 357–372. [Google Scholar] [CrossRef]
- Mukherjee, P.P.; Wang, C.-Y. Direct numerical simulation modeling of bilayer cathode catalyst layers in polymer electrolyte fuel cells. J. Electrochem. Soc. 2007, 154, B1121. [Google Scholar] [CrossRef]
- Wang, G.; Mukherjee, P.P.; Wang, C.-Y. Direct numerical simulation (DNS) modeling of PEFC electrodes: Part I. Regular microstructure. Electrochim. Acta 2006, 51, 3139–3150. [Google Scholar] [CrossRef]
- Wang, G.; Mukherjee, P.P.; Wang, C.-Y. Direct numerical simulation (DNS) modeling of PEFC electrodes: Part II. Random microstructure. Electrochim. Acta 2006, 51, 3151–3160. [Google Scholar] [CrossRef]
- Wang, Y.; Feng, X. Analysis of reaction rates in the cathode electrode of polymer electrolyte fuel cell I. Single-layer electrodes. J. Electrochem. Soc. 2008, 155, B1289. [Google Scholar] [CrossRef]
- Mathias, M.; Roth, J.; Fleming, J.; Lehnert, W. Diffusion media materials and characterisation. Handb. Fuel Cells—Fundam. Technol. Appl. 2003, 3, 517–537. [Google Scholar]
- Larminie, J.; Dicks, A.; McDonald, M.S. Fuel Cell Systems Explained; Wiley: Chichester, UK, 2003; Volume 2. [Google Scholar]
- Sasikumar, G.; Ihm, J.; Ryu, H. Dependence of optimum Nafion content in catalyst layer on platinum loading. J. Power Sources 2004, 132, 11–17. [Google Scholar] [CrossRef]
- Cindrella, L.; Kannan, A.M.; Lin, J.; Saminathan, K.; Ho, Y.; Lin, C.; Wertz, J. Gas diffusion layer for proton exchange membrane fuel cells—A review. J. Power Sources 2009, 194, 146–160. [Google Scholar] [CrossRef]
- Kannan, A.M.; Veedu, V.P.; Munukutla, L.; Ghasemi-Nejhad, M.N. Nanostructured Gas Diffusion and Catalyst Layers for Proton Exchange Membrane Fuel Cells. Electrochem. Solid-State Lett. 2007, 10, B47. [Google Scholar] [CrossRef]
- Lim, C.; Wang, C. Effects of hydrophobic polymer content in GDL on power performance of a PEM fuel cell. Electrochim. Acta 2004, 49, 4149–4156. [Google Scholar] [CrossRef]
- Chen, T.; Liu, S.; Zhang, J.; Tang, M. Study on the characteristics of GDL with different PTFE content and its effect on the performance of PEMFC. Int. J. Heat Mass Transf. 2019, 128, 1168–1174. [Google Scholar] [CrossRef]
- Cindrella, L.; Kannan, A.M.; Ahmad, R.; Thommes, M. Surface modification of gas diffusion layers by inorganic nanomaterials for performance enhancement of proton exchange membrane fuel cells at low RH conditions. Int. J. Hydrog. Energy 2009, 34, 6377–6383. [Google Scholar] [CrossRef]
- Zamel, N.; Li, X. Effect of contaminants on polymer electrolyte membrane fuel cells. Prog. Energy Combust. Sci. 2011, 37, 292–329. [Google Scholar] [CrossRef]
- Wood, D.L.; Rulison, C.; Borup, R.L. Surface properties of PEMFC gas diffusion layers. J. Electrochem. Soc. 2009, 157, B195. [Google Scholar] [CrossRef]
- Wang, Y.; Chen, K.S.; Mishler, J.; Cho, S.C.; Adroher, X.C. A review of polymer electrolyte membrane fuel cells: Technology, applications, and needs on fundamental research. Appl. Energy 2011, 88, 981–1007. [Google Scholar] [CrossRef]
- Mukherjee, P.P.; Mukundan, R.; Borup, R.L. Modeling of durability effect on the flooding behavior in the PEFC gas diffusion layer. In International Conference on Fuel Cell Science, Engineering and Technology; ASME: New York, NY, USA, 2010. [Google Scholar]
- Qi, Z.; Kaufman, A. Improvement of water management by a microporous sublayer for PEM fuel cells. J. Power Sources 2002, 109, 38–46. [Google Scholar] [CrossRef]
- Wargo, E.; Schulz, V.; Çeçen, A.; Kalidindi, S.; Kumbur, E. Resolving macro-and micro-porous layer interaction in polymer electrolyte fuel cells using focused ion beam and X-ray computed tomography. Electrochim. Acta 2013, 87, 201–212. [Google Scholar] [CrossRef]
- Zamel, N.; Litovsky, E.; Shakhshir, S.; Li, X.; Kleiman, J. Measurement of in-plane thermal conductivity of carbon paper diffusion media in the temperature range of− 20 °C to+ 120 °C. Appl. Energy 2011, 88, 3042–3050. [Google Scholar] [CrossRef]
- Weber, A.Z.; Newman, J. Effects of microporous layers in polymer electrolyte fuel cells. J. Electrochem. Soc. 2005, 152, A677. [Google Scholar] [CrossRef]
- Nagai, Y.; Eller, J.; Hatanaka, T.; Yamaguchi, S.; Kato, S.; Kato, A.; Marone, F.; Xu, H.; Büchi, F.N. Improving water management in fuel cells through microporous layer modifications: Fast operando tomographic imaging of liquid water. J. Power Sources 2019, 435, 226809. [Google Scholar] [CrossRef]
- Chen, Y.; Liu, Y.; Xu, Y.; Guo, X.; Cao, Y.; Ming, W. Review: Modeling and Simulation of Membrane Electrode Material Structure for Proton Exchange Membrane Fuel Cells. Coatings 2022, 12, 1145. [Google Scholar] [CrossRef]
- Atkinson, R.W.; Rodgers, J.A.; Hazard, M.W.; Stroman, R.O.; Gould, B.D. Influence of Cathode Gas Diffusion Media Porosity on Open-Cathode Fuel Cells. J. Electrochem. Soc. 2018, 165, F1002. [Google Scholar] [CrossRef]
- Mezedur, M.M.; Kaviany, M.; Moore, W. Effect of Pore Structure, Randomness and Size on Effective Mass Diffusivity. AIChE J. 2002, 48, 15–24. [Google Scholar] [CrossRef]
- Martínez, M.J.; Shimpalee, S.; van Zee, J.W. Measurement of MacMullin Numbers for PEMFC Gas-Diffusion Media. J. Electrochem. Soc. 2009, 156, B80. [Google Scholar] [CrossRef]
- Nam, J.H.; Lee, K.; Hwang, G.; Kim, C.; Kaviany, M. Microporous layer for water morphology control in PEMFC. Int. J. Heat Mass Transf. 2009, 52, 2779–2791. [Google Scholar] [CrossRef]
- El-Kharouf, A.; Rees, N.V.; Steinberger-Wilckens, R. Gas Diffusion Layer Materials and their Effect on Polymer Electrolyte Fuel Cell Performance–Ex Situ and In Situ Characterization. Fuel Cells 2014, 14, 735–741. [Google Scholar] [CrossRef]
- Navarro, A.J.; Gomez, A.M.; Daza, L.; Molina-Garcia, A.; Lopez-Cascales, J.J. Influence of the gas diffusion layer on the performance of an open cathode polymer electrolyte membrane fuel cell. Int. J. Hydrog. Energy 2022, 47, 7990–7999. [Google Scholar] [CrossRef]
- Sun, W.; Peppley, B.A.; Karan, K. Modeling the Influence of GDL and flow-field plate parameters on the reaction distribution in the PEMFC cathode catalyst layer. J. Power Sources 2005, 144, 42–53. [Google Scholar] [CrossRef]
- Saebea, D.; Chaiburi, C.; Authayanun, S. Model based evaluation of alkaline anion exchange membrane fuel cells with water management. Chem. Eng. J. 2019, 374, 721–729. [Google Scholar] [CrossRef]
- Wang, T.; Shi, L.; Wang, J.; Zhao, Y.; Setzler, B.P.; Rojas-Carbonell, S.; Yan, Y. High-performance hydroxide exchange membrane fuel cells through optimization of relative humidity, backpressure and catalyst selection. J. Electrochem. Soc. 2019, 166, F3305. [Google Scholar] [CrossRef]
- Gao, X.; Yu, H.; Qin, B.; Jia, J.; Hao, J.; Xie, F.; Shao, Z. Enhanced water transport in AEMs based on poly (styrene–ethylene–butylene–styrene) triblock copolymer for high fuel cell performance. Polym. Chem. 2019, 10, 1894–1903. [Google Scholar] [CrossRef]
- Deng, H.; Wang, D.; Wang, R.; Xie, X.; Yin, Y.; Du, Q.; Jiao, K. Effect of electrode design and operating condition on performance of hydrogen alkaline membrane fuel cell. Appl. Energy 2016, 183, 1272–1278. [Google Scholar] [CrossRef]
- Zhang, J.; Zhu, W.; Huang, T.; Zheng, C.; Pei, Y.; Shen, G.; Nie, Z.; Xiao, D.; Yin, Y.; Guiver, M.D. Recent insights on catalyst layers for anion exchange membrane fuel cells. Adv. Sci. 2021, 8, 2100284. [Google Scholar] [CrossRef]
- Ozen, D.N.; Timurkutluk, B.; Altinisik, K. Effects of operation temperature and reactant gas humidity levels on performance of PEM fuel cells. Renew. Sustain. Energy Rev. 2016, 59, 1298–1306. [Google Scholar] [CrossRef]
- Parthasarathy, A.; Srinivasan, S.; Appleby, A.J.; Martin, C.R. Temperature dependence of the electrode kinetics of oxygen reduction at the platinum/Nafion® interface—A microelectrode investigation. J. Electrochem. Soc. 1992, 139, 2530. [Google Scholar] [CrossRef]
- Williams, M.V.; Kunz, H.R.; Fenton, J.M. Operation of Nafion®-based PEM fuel cells with no external humidification: Influence of operating conditions and gas diffusion layers. J. Power Sources 2004, 135, 122–134. [Google Scholar] [CrossRef]
- Natarajan, D.; Van Nguyen, T. Current distribution in PEM fuel cells. Part 2: Air operation and temperature effect. AIChE J. 2005, 51, 2599–2608. [Google Scholar] [CrossRef]
- Truong, V.M.; Duong, N.B.; Wang, C.-L.; Yang, H. Effects of cell temperature and reactant humidification on anion exchange membrane fuel cells. Materials 2019, 12, 2048. [Google Scholar] [CrossRef]
- Park, G.-G.; Sohn, Y.-J.; Yang, T.-H.; Yoon, Y.-G.; Lee, W.-Y.; Kim, C.-S. Effect of PTFE contents in the gas diffusion media on the performance of PEMFC. J. Power Sources 2004, 131, 182–187. [Google Scholar] [CrossRef]
- Yassin, K.; Rasin, I.G.; Willdorf-Cohen, S.; Diesendruck, C.E.; Brandon, S.; Dekel, D.R. A surprising relation between operating temperature and stability of anion exchange membrane fuel cells. J. Power Sources Adv. 2021, 11, 100066. [Google Scholar] [CrossRef]
- Machado, B.S.; Chakraborty, N.; Das, P.K. Influences of flow direction, temperature and relative humidity on the performance of a representative anion exchange membrane fuel cell: A computational analysis. Int. J. Hydrog. Energy 2017, 42, 6310–6323. [Google Scholar] [CrossRef]
- Li, X.; Ke, C.; Qu, S.; Li, J.; Shao, Z.; Yi, B. High Temperature PEM Fuel Cells Based on Nafion®/SiO2 Composite Membrane. In Energy Storage in the Emerging Era of Smart Grids; IntechOpen: London, UK, 2011. [Google Scholar]
- Douglin, J.C.; Varcoe, J.R.; Dekel, D.R. A high-temperature anion-exchange membrane fuel cell. J. Power Sources Adv. 2020, 5, 100023. [Google Scholar] [CrossRef]
- Yassin, K.; Rasin, I.G.; Brandon, S.; Dekel, D.R. Quantifying the critical effect of water diffusivity in anion exchange membranes for fuel cell applications. J. Membr. Sci. 2020, 608, 118206. [Google Scholar] [CrossRef]
- Gao, X.; Yu, H.; Jia, J.; Hao, J.; Xie, F.; Chi, J.; Qin, B.; Fu, L.; Song, W.; Shao, Z. High performance anion exchange ionomer for anion exchange membrane fuel cells. RSC Adv. 2017, 7, 19153–19161. [Google Scholar] [CrossRef]
- Mohanty, A.D.; Bae, C. Mechanistic analysis of ammonium cation stability for alkaline exchange membrane fuel cells. J. Mater. Chem. A 2014, 2, 17314–17320. [Google Scholar] [CrossRef]
- Sturgeon, M.R.; Macomber, C.S.; Engtrakul, C.; Long, H.; Pivovar, B.S. Hydroxide based benzyltrimethylammonium degradation: Quantification of rates and degradation technique development. J. Electrochem. Soc. 2015, 162, F366. [Google Scholar] [CrossRef]
- Marino, M.; Kreuer, K. Alkaline stability of quaternary ammonium cations for alkaline fuel cell membranes and ionic liquids. ChemSusChem 2015, 8, 513–523. [Google Scholar] [CrossRef]
- Park, E.J.; Maurya, S.; Hibbs, M.R.; Fujimoto, C.H.; Kreuer, K.-D.; Kim, Y.S. Alkaline stability of quaternized Diels–Alder polyphenylenes. Macromolecules 2019, 52, 5419–5428. [Google Scholar] [CrossRef]
- Li, H.; Tang, Y.; Wang, Z.; Shi, Z.; Wu, S.; Song, D.; Zhang, J.; Fatih, K.; Zhang, J.; Wang, H. A review of water flooding issues in the proton exchange membrane fuel cell. J. Power Sources 2008, 178, 103–117. [Google Scholar] [CrossRef]
- Ji, M.; Wei, Z. A review of water management in polymer electrolyte membrane fuel cells. Energies 2009, 2, 1057–1106. [Google Scholar] [CrossRef]
- Carlson, A.; Shapturenka, P.; Eriksson, B.; Lindbergh, G.; Lagergren, C.; Lindström, R.W. Electrode parameters and operating conditions influencing the performance of anion exchange membrane fuel cells. Electrochim. Acta 2018, 277, 151–160. [Google Scholar] [CrossRef]
- Benziger, J.; Kimball, E.; Mejia-Ariza, R.; Kevrekidis, I. Oxygen mass transport limitations at the cathode of polymer electrolyte membrane fuel cells. AIChE J. 2011, 57, 2505–2517. [Google Scholar] [CrossRef]
- Owejan, J.P.; Trabold, T.A.; Mench, M.M. Oxygen transport resistance correlated to liquid water saturation in the gas diffusion layer of PEM fuel cells. Int. J. Heat Mass Transf. 2014, 71, 585–592. [Google Scholar] [CrossRef]
- Büchi, F.N.; Srinivasan, S. Operating proton exchange membrane fuel cells without external humidification of the reactant gases: Fundamental aspects. J. Electrochem. Soc. 1997, 144, 2767. [Google Scholar] [CrossRef]
- Kim, T.; Kim, J.; Sim, C.; Lee, S.; Kaviany, M.; Son, S.; Kim, M. Experimental approaches for distribution and behavior of water in PEMFC under flow direction and differential pressure using neutron imaging technique. Nucl. Instrum. Methods Phys. Res. Sect. A Accel. Spectrometers Detect. Assoc. Equip. 2009, 600, 325–327. [Google Scholar] [CrossRef]
- Mishler, J.; Wang, Y.; Mukundan, R.; Spendelow, J.; Hussey, D.S.; Jacobson, D.L.; Borup, R.L. Probing the water content in polymer electrolyte fuel cells using neutron radiography. Electrochim. Acta 2012, 75, 1–10. [Google Scholar] [CrossRef]
- Wang, Y.; Wang, C.-Y. Dynamics of polymer electrolyte fuel cells undergoing load changes. Electrochim. Acta 2006, 51, 3924–3933. [Google Scholar] [CrossRef]
- Yang, W.; Cha, D.; Kim, Y. Effects of flow direction on dynamic response and stability of nonhumidification PEM fuel cell. Energy 2019, 185, 386–395. [Google Scholar] [CrossRef]
- Pasaogullari, U.; Wang, C.-Y.; Chen, K.S. Two-phase transport in polymer electrolyte fuel cells with bilayer cathode gas diffusion media. J. Electrochem. Soc. 2005, 152, A1574. [Google Scholar] [CrossRef]
- Weber, A.Z.; Darling, R.M.; Newman, J. Modeling two-phase behavior in PEFCs. J. Electrochem. Soc. 2004, 151, A1715. [Google Scholar] [CrossRef]
- Mukundan, R.; Davey, J.R.; Rockward, T.; Spendelow, J.S.; Pivovar, B.; Hussey, D.S.; Jacobson, D.L.; Arif, M.; Borup, R. Imaging of water profiles in PEM fuel cells using neutron radiography: Effect of operating conditions and GDL composition. ECS Trans. 2007, 11, 411. [Google Scholar] [CrossRef]
- Su, H.; Sita, C.; Pasupathi, S. The effect of gas diffusion layer PTFE content on the performance of high temperature proton exchange membrane fuel cell. Int. J. Electrochem. Sci. 2016, 11, 2919–2926. [Google Scholar] [CrossRef]
- Uchida, M.; Aoyama, Y.; Eda, N.; Ohta, A. Investigation of the microstructure in the catalyst layer and effects of both perfluorosulfonate ionomer and PTFE-loaded carbon on the catalyst layer of polymer electrolyte fuel cells. J. Electrochem. Soc. 1995, 142, 4143. [Google Scholar] [CrossRef]
- Orogbemi, O.; Ingham, D.; Ismail, M.; Hughes, K.; Ma, L.; Pourkashanian, M. The effects of the composition of microporous layers on the permeability of gas diffusion layers used in polymer electrolyte fuel cells. Int. J. Hydrog. Energy 2016, 41, 21345–21351. [Google Scholar] [CrossRef]
- Park, S.; Lee, J.-W.; Popov, B.N. A review of gas diffusion layer in PEM fuel cells: Materials and designs. Int. J. Hydrog. Energy 2012, 37, 5850–5865. [Google Scholar] [CrossRef]
- Ismail, M.; Damjanovic, T.; Hughes, K.; Ingham, D.; Ma, L.; Pourkashanian, M.; Rosli, M. Through-plane permeability for untreated and PTFE-treated gas diffusion layers in proton exchange membrane fuel cells. J. Fuel Cell Sci. Technol. 2010, 7, 051016.1–051016.7. [Google Scholar] [CrossRef]
- Ismail, M.; Borman, D.; Damjanovic, T.; Ingham, D.; Pourkashanian, M. On the through-plane permeability of microporous layer-coated gas diffusion layers used in proton exchange membrane fuel cells. Int. J. Hydrog. Energy 2011, 36, 10392–10402. [Google Scholar] [CrossRef]
- Zhegur-Khais, A.; Kubannek, F.; Krewer, U.; Dekel, D.R. Measuring the true hydroxide conductivity of anion exchange membranes. J. Membr. Sci. 2020, 612, 118461. [Google Scholar] [CrossRef]
- Wang, L.; Bellini, M.; Miller, H.A.; Varcoe, J.R. A high conductivity ultrathin anion-exchange membrane with 500+ h alkali stability for use in alkaline membrane fuel cells that can achieve 2 W cm− 2 at 80 C. J. Mater. Chem. A 2018, 6, 15404–15412. [Google Scholar] [CrossRef]
- Dang, H.-S.; Jannasch, P. High-performing hydroxide exchange membranes with flexible tetra-piperidinium side chains linked by alkyl spacers. ACS Appl. Energy Mater. 2018, 1, 2222–2231. [Google Scholar] [CrossRef]
- Zhegur, A.; Gjineci, N.; Willdorf-Cohen, S.; Mondal, A.; Diesendruck, C.; Gavish, N.; Dekel, D. Changes of anion exchange membrane properties during chemical degradation. ACS Appl. Polym. Mater. 2020, 2, 360–367. [Google Scholar] [CrossRef]
- Mandal, M.; Huang, G.; Kohl, P.A. Highly conductive anion-exchange membranes based on cross-linked poly (norbornene): Vinyl addition polymerization. ACS Appl. Energy Mater. 2019, 2, 2447–2457. [Google Scholar] [CrossRef]
- Pusara, S.; Srebnik, S.; Dekel, D.R. Molecular simulation of quaternary ammonium solutions at low hydration levels. J. Phys. Chem. C 2018, 122, 11204–11213. [Google Scholar] [CrossRef]
- Douglin, J.; Singh, R.; Haj-Bsoul, S.; Li, S.; Biemolt, J.; Yan, N.; Varcoe, J.; Rothenberg, G.; Dekel, D. A high-temperature anion-exchange membrane fuel cell with a critical raw material-free cathode. Chem. Eng. J. Adv. 2021, 8, 100153. [Google Scholar] [CrossRef]
- Li, Z.; He, X.; Jiang, Z.; Yin, Y.; Zhang, B.; He, G.; Tong, Z.; Wu, H.; Jiao, K. Enhancing hydroxide conductivity and stability of anion exchange membrane by blending quaternary ammonium functionalized polymers. Electrochim. Acta 2017, 240, 486–494. [Google Scholar] [CrossRef]
- Li, N.; Guiver, M.D.; Binder, W.H. Towards high conductivity in anion-exchange membranes for alkaline fuel cells. ChemSusChem 2013, 6, 1376–1383. [Google Scholar] [CrossRef]
- Paul, D.K.; McCreery, R.; Karan, K. Proton transport property in supported Nafion nanothin films by electrochemical impedance spectroscopy. J. Electrochem. Soc. 2014, 161, F1395. [Google Scholar] [CrossRef]
- Wang, C.; Mo, B.; He, Z.; Xie, X.; Zhao, C.X.; Zhang, L.; Shao, Q.; Guo, X.; Wujcik, E.K.; Guo, Z. Hydroxide ions transportation in polynorbornene anion exchange membrane. Polymer 2018, 138, 363–368. [Google Scholar] [CrossRef]
- Zelovich, T.; Tuckerman, M.E. Water layering affects hydroxide diffusion in functionalized nanoconfined environments. J. Phys. Chem. Lett. 2020, 11, 5087–5091. [Google Scholar] [CrossRef] [PubMed]
- Gao, X.; Lu, F.; Dong, B.; Wu, A.; Sun, N.; Zheng, L. Anion exchange membranes with well-defined ion transporting nanochannels via self-assembly of polymerizable ionic liquids. J. Mater. Chem. A 2016, 4, 13316–13323. [Google Scholar] [CrossRef]
- Dubey, V.; Maiti, A.; Daschakraborty, S. Predicting the solvation structure and vehicular diffusion of hydroxide ion in an anion exchange membrane using nonreactive molecular dynamics simulation. Chem. Phys. Lett. 2020, 755, 137802. [Google Scholar] [CrossRef]
- Ziv, N.; Dekel, D.R. A practical method for measuring the true hydroxide conductivity of anion exchange membranes. Electrochem. Commun. 2018, 88, 109–113. [Google Scholar] [CrossRef]
- Müller, J.; Zhegur, A.; Krewer, U.; Varcoe, J.R.; Dekel, D.R. Practical ex-situ technique to measure the chemical stability of anion-exchange membranes under conditions simulating the fuel cell environment. ACS Mater. Lett. 2020, 2, 168–173. [Google Scholar] [CrossRef]
- Wang, L.; Brink, J.J.; Liu, Y.; Herring, A.M.; Ponce-González, J.; Whelligan, D.K.; Varcoe, J.R. Non-fluorinated pre-irradiation-grafted (peroxidated) LDPE-based anion-exchange membranes with high performance and stability. Energy Environ. Sci. 2017, 10, 2154–2167. [Google Scholar] [CrossRef]
- Mahmoud, A.M.A.; Elsaghier, A.M.M.; Otsuji, K.; Miyatake, K. High hydroxide ion conductivity with enhanced alkaline stability of partially fluorinated and quaternized aromatic copolymers as anion exchange membranes. Macromolecules 2017, 50, 4256–4266. [Google Scholar] [CrossRef]
- Lin, B.; Qiu, L.; Qiu, B.; Peng, Y.; Yan, F. A soluble and conductive polyfluorene ionomer with pendant imidazolium groups for alkaline fuel cell applications. Macromolecules 2011, 44, 9642–9649. [Google Scholar] [CrossRef]
- Cao, X.; Novitski, D.; Holdcroft, S. Visualization of hydroxide ion formation upon electrolytic water splitting in an anion exchange membrane. ACS Mater. Lett. 2019, 1, 362–366. [Google Scholar] [CrossRef]
- Eriksson, B.; Grimler, H.; Carlson, A.; Ekström, H.; Lindström, R.W.; Lindbergh, G.; Lagergren, C. Quantifying water transport in anion exchange membrane fuel cells. Int. J. Hydrog. Energy 2019, 44, 4930–4939. [Google Scholar] [CrossRef]
- Ono, H.; Miyake, J.; Shimada, S.; Uchida, M.; Miyatake, K. Anion exchange membranes composed of perfluoroalkylene chains and ammonium-functionalized oligophenylenes. J. Mater. Chem. A 2015, 3, 21779–21788. [Google Scholar] [CrossRef]
- Adachi, M.; Navessin, T.; Xie, Z.; Frisken, B.; Holdcroft, S. Correlation of in situ and ex situ measurements of water permeation through Nafion NRE211 proton exchange membranes. J. Electrochem. Soc. 2009, 156, B782. [Google Scholar] [CrossRef]


| Types of Fuel Cells | The Main Components of Fuel Cells | ||
|---|---|---|---|
| Electrodes | Electrolyte | External Circuit | |
| Alkaline Fuel Cells (AFCs) |
|
|
|
| Proton Exchange Membrane Fuel Cells (PEMFCs) |
|
|
|
| Solid Oxide Fuel Cells |
|
|
|
| Phosphoric Acid Fuel Cells (PACFs) |
|
|
|
| Molten Carbonate Fuel Cells (MCFCs) |
|
|
|
| Material | Preparation | Comments |
|---|---|---|
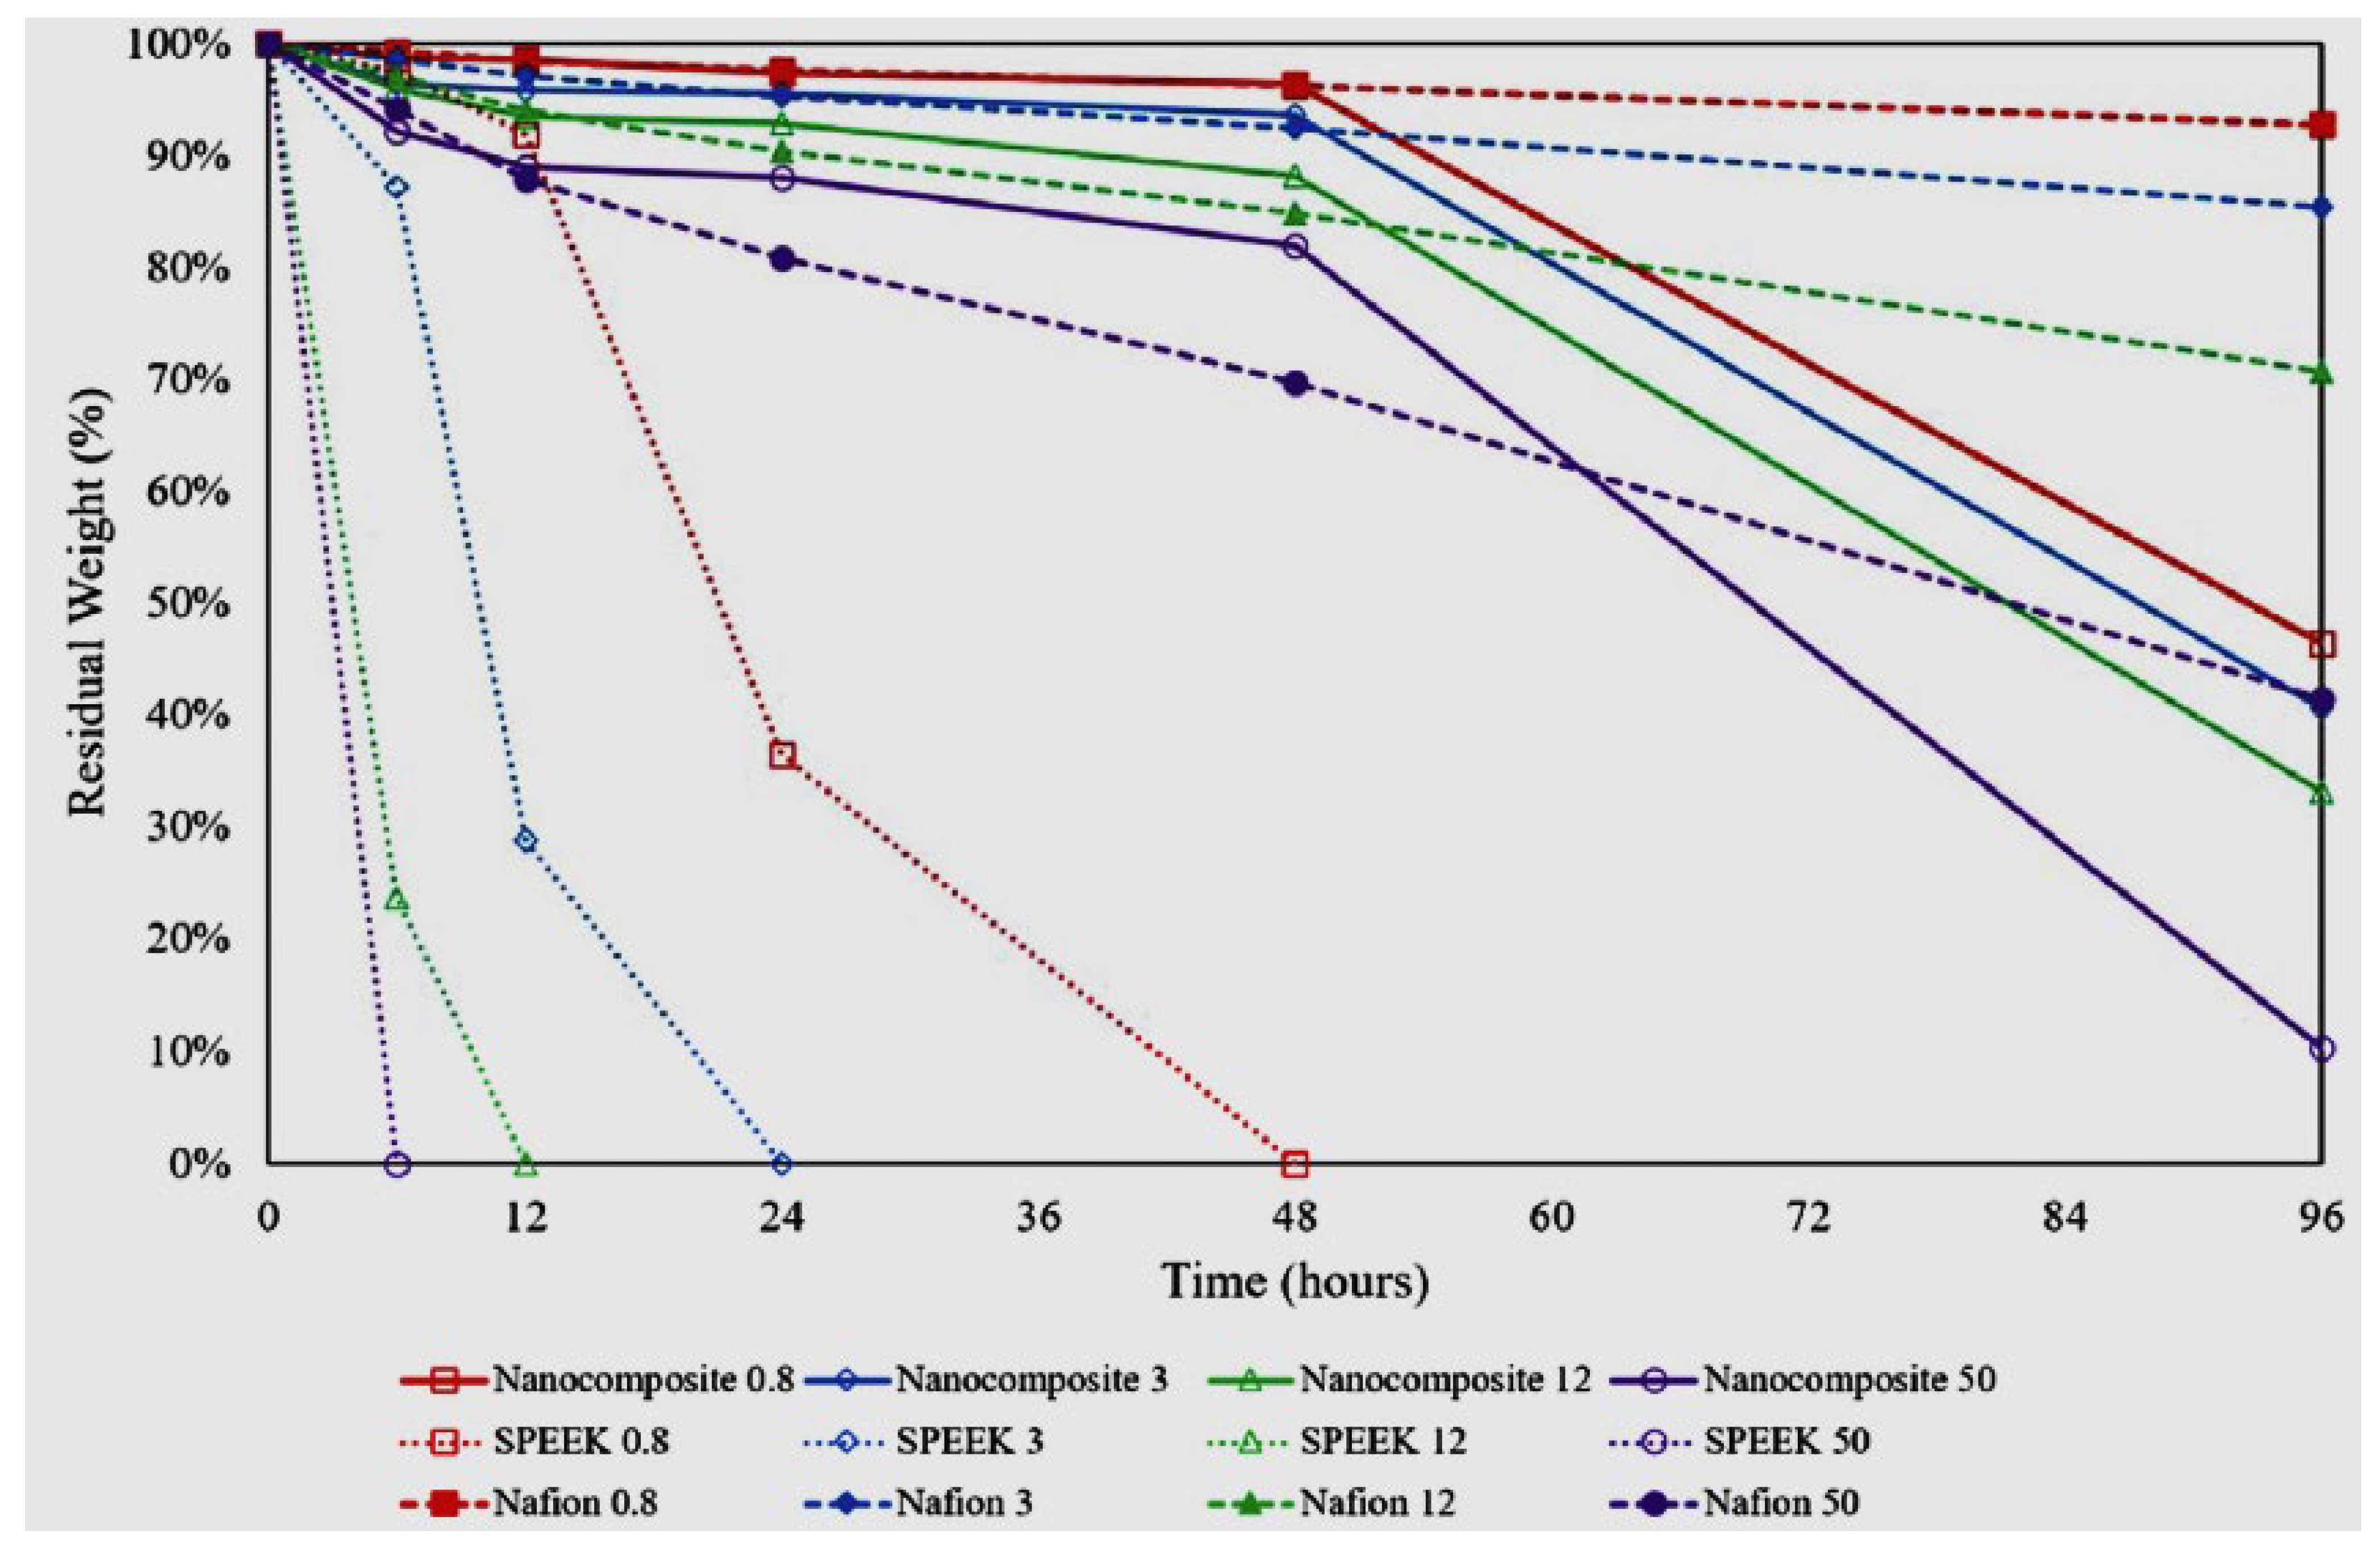
Polystyrene-sulfonic acid (PSSA) | To prepare PSSA-Nafion composite membranes, the recast Nafion membranes (H+ form) and PSSA, Nafion101 were initially transformed to the K+ form via soaking them in a solution of 0.5 M KOH at 80 °C for 60 min. The membrane of PSSA could be attached firmly with Nafion101 or a recast Nafion membrane utilizing hot-pressing at 160 °C for 2 min. Then, the composite membranes were transformed to the H+ form prior to creating the membrane fuel cell [91]. | They are relatively inexpensive compared to Nafion, with the main disadvantage of their instability. Specifically, styrene sulfonic acid morsels are missing at great rates, dropping the ion exchange capacity and conductivity. The weak points are developed due to the aromatic ring protons and ternary benzylic hydrogen in the polymer chain. Strengthening these chains is vital. |
Sulfonated polyimide (SPI)-based membranes. | The materials were utilized to generate sulfonated polyimide (SPI)-based membranes: 1,4,5,8 Naphthalenetetracarboxylic dianhydride acid (NTDA), 4,40-Diaminostilbene-2,20-disulfonic acid (DSDSA), 4,40-Diaminodiphenyl ether (ODA), 4,40- Diaminodiphenylmethane (MDA), Triethylamine, 3-Methylphenol (m-cresol), and benzoic acid. DSDSA, ODA, NTDA, and MDA were dried up in a vacuum oven at 120 °C [92]. | Their main advantages are their high mechanical and thermal properties and durability against harsh chemicals and heat because of their thermos ability. The sulfonation of polyimides has been used to increase proton conductivity. Their main drawback originates from their instability under hydrated states due to hydrolytic, oxidative, and swelling‒stress stability. |
Polybenzimidazole (PBI)-based membranes | 3,3’-diamino benzidine (3.1150 g) and isophthalic acid (4.0180 g) were mixed with Polyphthalamide (60 g) and put in a round-bottom flask delivered with a reflux condenser with an inlet for nitrogen. The mixture was raised in temperature to 190 °C for 20 h. The Polybenzimidazole PBI powder was collected and then dissolved in n-n DiMethyl Acetamide to prepare 10 wt% of the solution of PBI. The incompletely dissolved Polybenzimidazole powder in DiMethyl Acetamide was eliminated via simple centrifugation [93]. | They are tailored for operation at 160–220 ℃ and thus are suitable for PAFCs. The main challenges are: (i) electrolyte leakage, (ii) the presence of a liquid electrolyte and hence possible GDL flooding, and (iii) unsuitability for portable and transport applications. R&D also uses them in a new class of membranes with an improved matrix for H3PO4. |
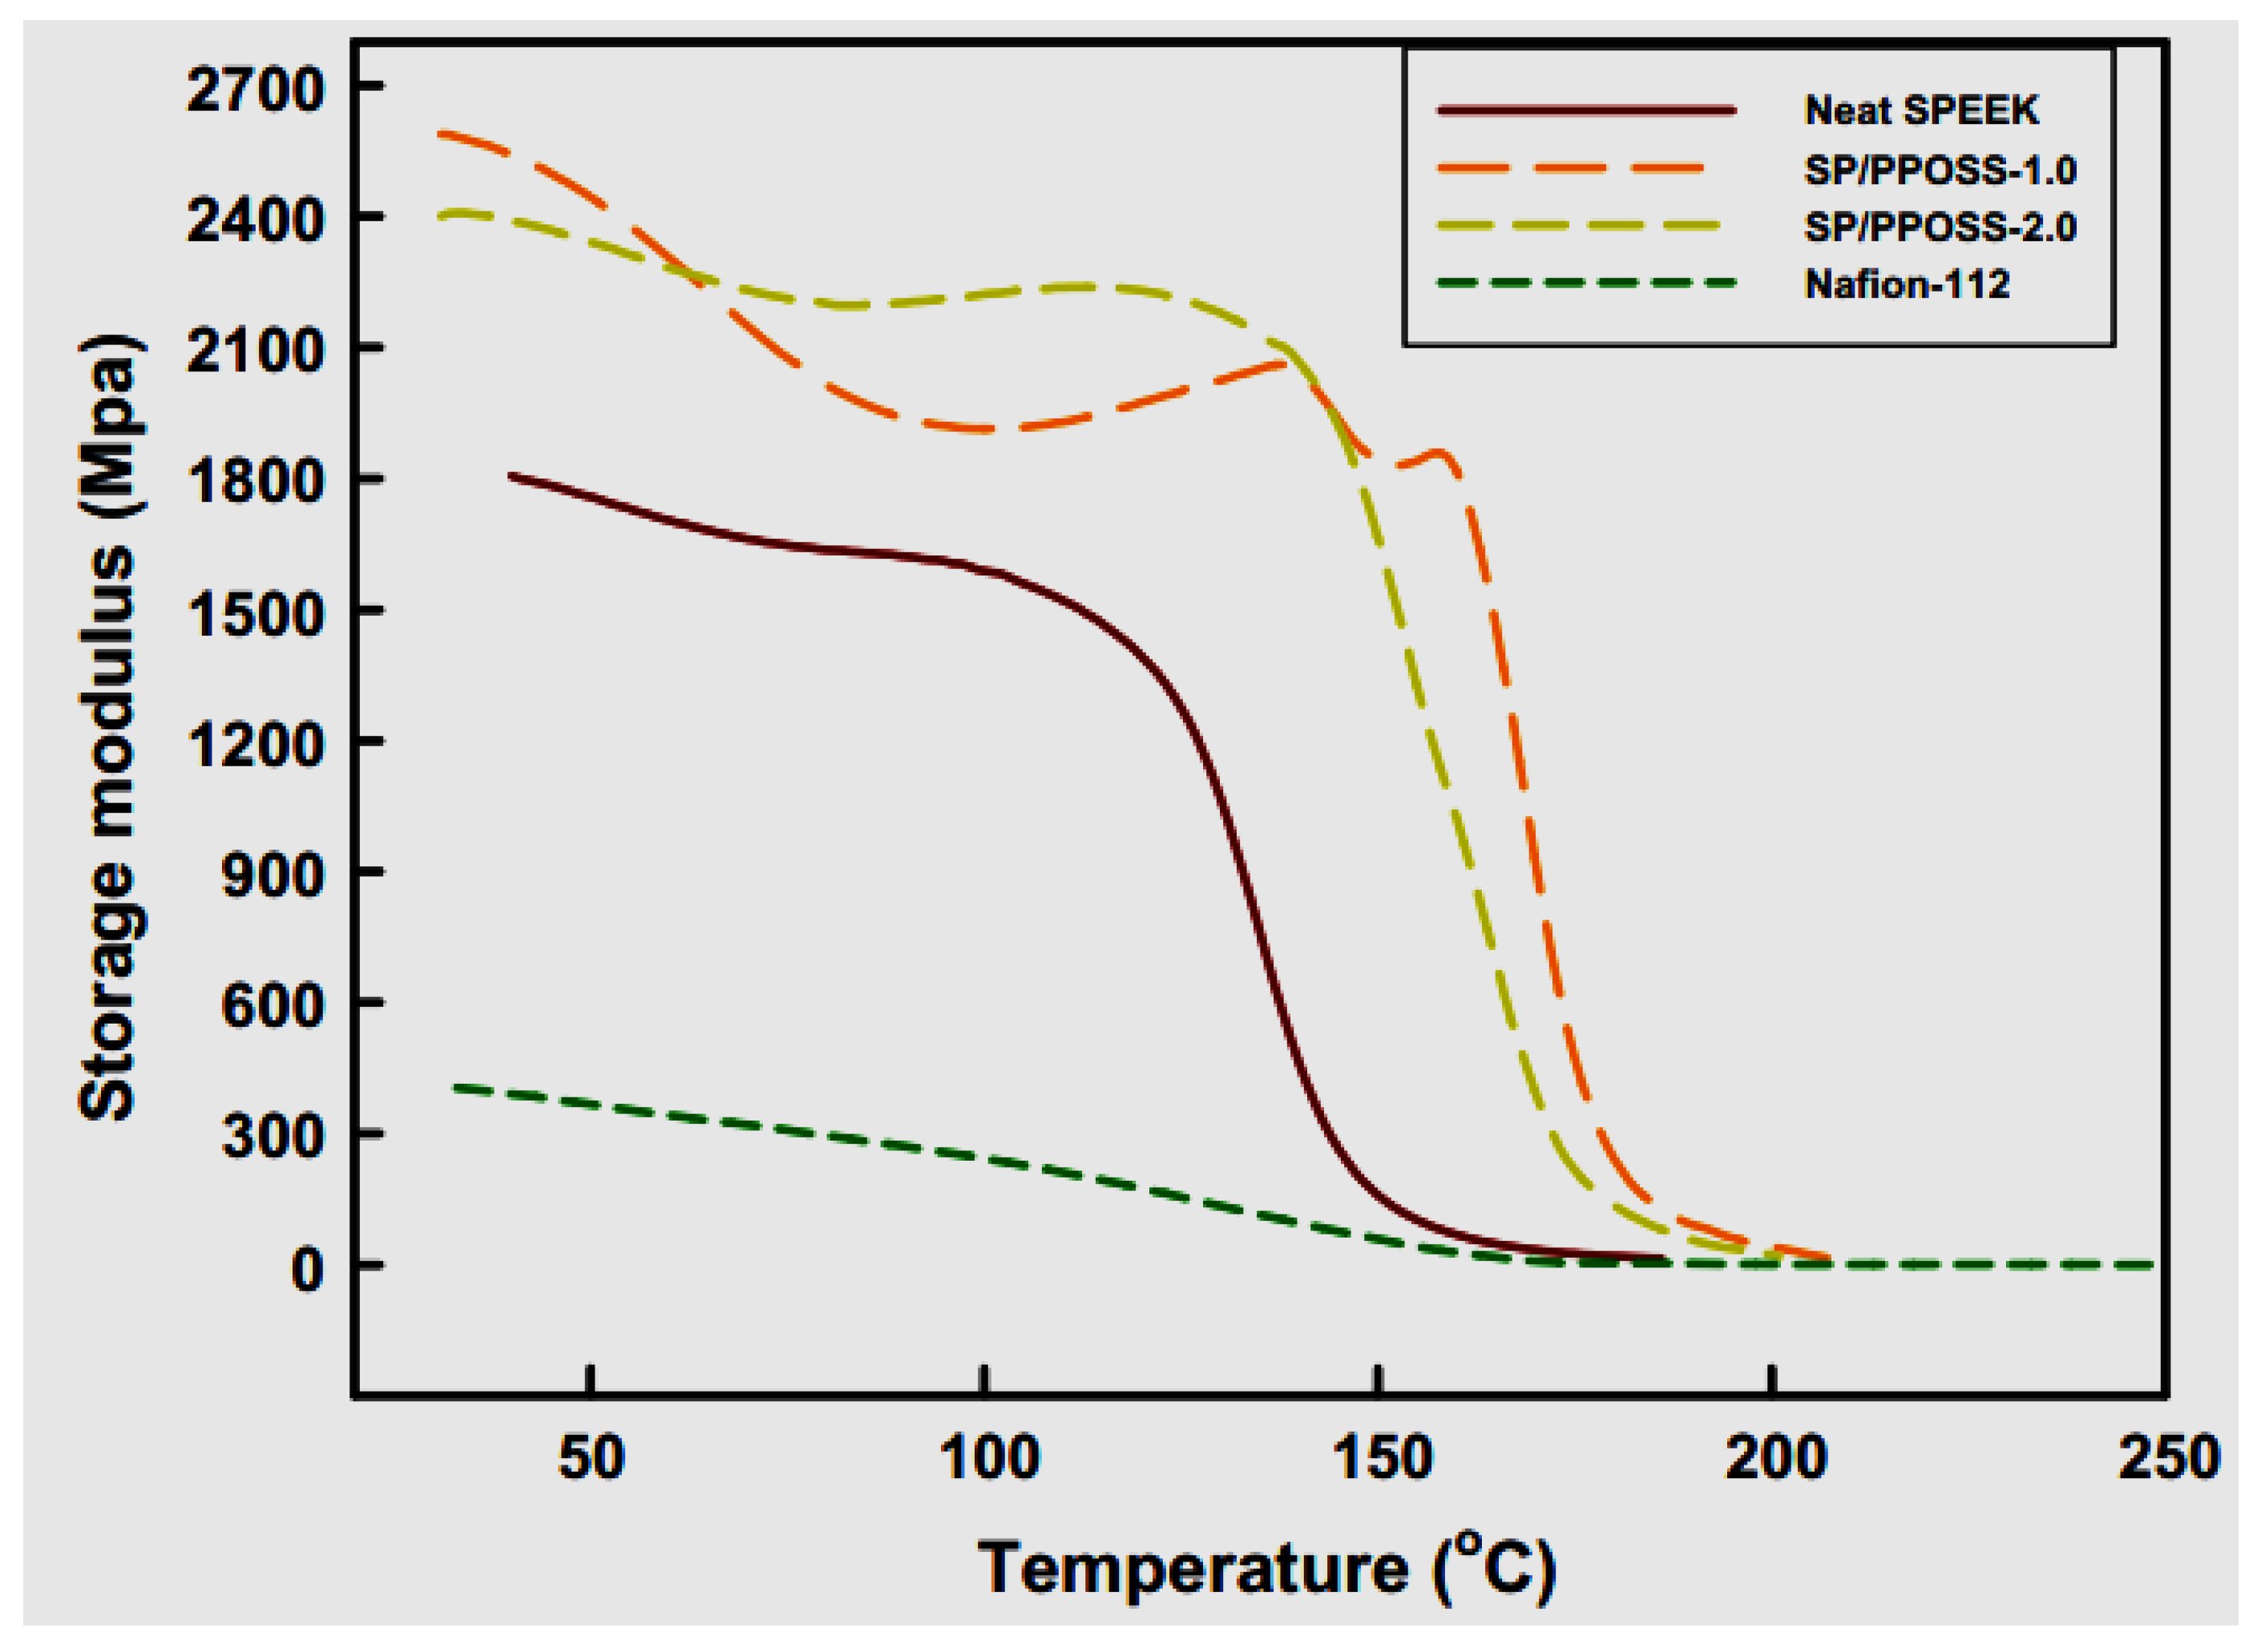
Sulfonated aromatic main-chain polymers I: Poly (arylene ether)-based SPEs S-PEEK membrane | 1.259 g (5 mmol) of 4,4′- difluorodiphenyl sulfone, 2.290 g (5 mmol) of 3,3′-disulfonic acid salt-bis (4-chlorophenyl) sulfone, and 25 mL sulfolane (TMS) were added continually to the dry three-port flask delivered with a condenser, magnetic stirrer, and water separator. Once the SPES-50 was prepared, 2.020 g (10 mmol) of 4,4′-dihydroxydiphenyl ether was added [94]. | They comprise sulfonated aromatic main-chain polymers and are cost-competitive with high mechanical strength and chemical/thermal stability. The SPEAKs and SPEEKs are the most studied, where various combinations are possible [95]. The main disadvantage is durability due to the scission of their main chain. Structural improvement of their backbone is vital. |
| Sulfonated aromatic main-chain polymers II: Polysulfone-, polysulfone-ether-, and polyphenylsulfone-based SPEs  Sulfonated polysulfone | Dissolving about 1.0 g of polymer in 5 to 10 mL of N, N-dimethylacetamide (DMAc) and casting the polymer solution on a glass plate led to the production of transparent membranes of sulfonated polysulfone. Dry membranes with thicknesses ranging from 2 to 10 cm were gained via changing the quantity of solvent or the distance between the Gardner knife and the plate for the duration of the casting process. Lastly, the membranes remained in acid form with 1M of HCl for 15 h at 50–60 °C [96]. | They are sulfonated aromatic main-chain polymers with the main advantages of cost competitiveness and thermal/chemical stability. Their mechanical properties rely on chemical modulation processing due to their amorphous nature. The main drawback is durability, especially in the presence of oxides. Thus, durability and stability enhancement are vital. |
| Catalysts Type | Benefits | Remaining Challenges |
|---|---|---|
Pt |
|
|
Pt alloy/de-alloy |
|
|
Core-shell |
|
|
Shaped controlled nanocrystal |
|
|
Nanoframe/nanocage |
|
|
Nano-precious metal catalyst |
|
|
| Operational Temperature (°C) | Current Density at 0.90 V (A/cm2) | Current Density at 0.70 V (A/cm2) | Peak Power Density (W/cm2) | Limiting Current Density (A/cm2) | Cell Voltage at 0.60 A/cm2 (V) |
|---|---|---|---|---|---|
| 45 | 0.093 | 1.42 | 0.89 | 1.54 | 0.759 |
| 60 | 0.159 | 1.89 | 1.29 | 2.71 | 0.798 |
| 90 | 0.225 | 3.06 | 2.36 | 7.04 | 0.828 |
| 120 | 0.282 | 3.89 | 2.94 | 11.46 | 0.842 |
| Current (A.cm−2) | High-Frequency Resistance (Ω cm2) | |||
|---|---|---|---|---|
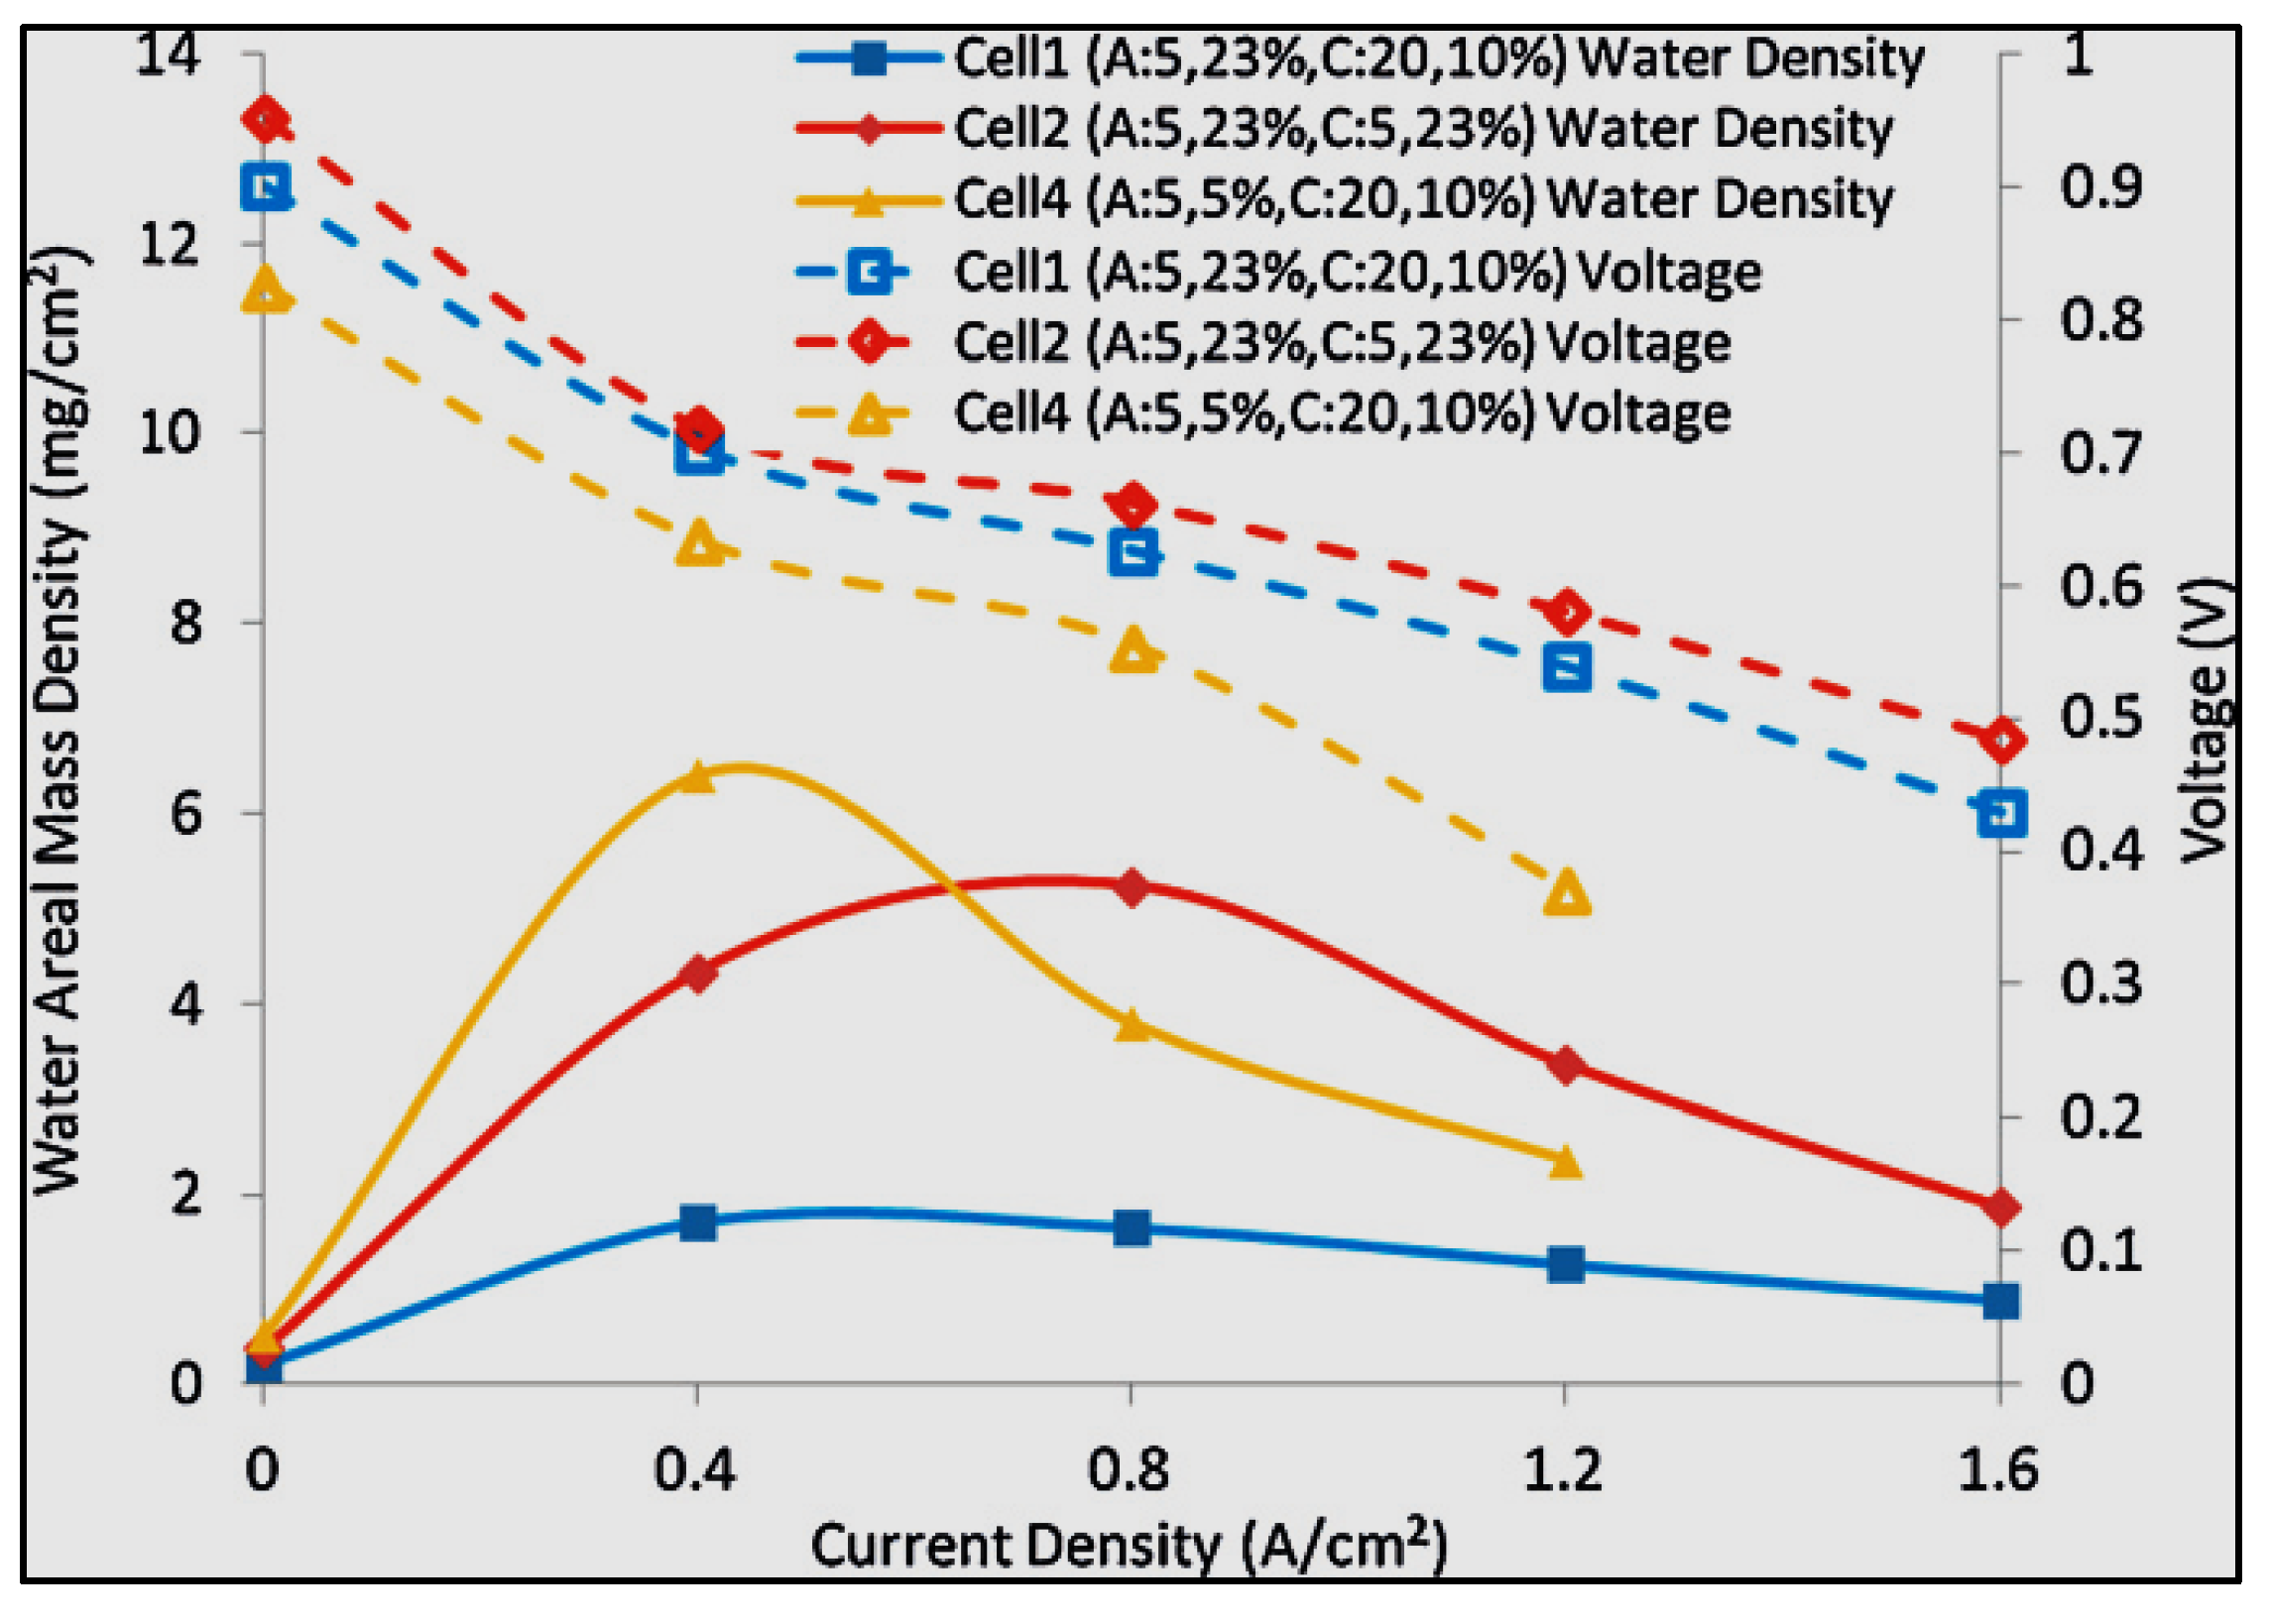
| Cell 1 (A: 5%, 23%; C: 20%, 10%) | Cell 2 (A: 5%, 23%; C: 5%, 23%) | Cell 3 (A: 5%, 23%; C: 20%, 10%) | Cell 4 (A: 5%, 5%; C: 20%, 10%) | |
| 50% inlet RH | ||||
| 0.40 | 0.0620 | 0.0460 | 0.0550 | 0.0440 |
| 0.80 | 0.0570 | 0.0400 | 0.0510 | 0.0580 |
| 1.20 | 0.0570 | 0.0410 | 0.0590 | 0.0560 |
| 1.60 | 0.0640 | 0.0430 | 0.0800 | – |
| 100% inlet RH | ||||
| 0.40 | 0.0420 | – | 0.0390 | 0.0410 |
| 0.80 | 0.0420 | – | 0.0380 | 0.0410 |
| 1.20 | 0.0420 | 0.0390 | 0.0390 | – |
| 1.60 | 0.0430 | 0.0390 | 0.0390 | – |
| Cell 1 (A: 5%, 23%; C: 20%, 10%) | ||||
| Co-flow, 50% inlet RH | Co-flow, 100% inlet RH | Counter-flow, 50% inlet RH | ||
| 0.40 | 0.0620 | 0.0420 | 0.0450 | |
| 0.80 | 0.0570 | 0.0420 | 0.0450 | |
| 1.20 | 0.0570 | 0.0420 | 0.0460 | |
| 1.60 | 0.0640 | 0.0430 | 0.0500 | |
Publisher’s Note: MDPI stays neutral with regard to jurisdictional claims in published maps and institutional affiliations. |
© 2022 by the authors. Licensee MDPI, Basel, Switzerland. This article is an open access article distributed under the terms and conditions of the Creative Commons Attribution (CC BY) license (https://creativecommons.org/licenses/by/4.0/).
Share and Cite
Jawad, N.H.; Yahya, A.A.; Al-Shathr, A.R.; Salih, H.G.; Rashid, K.T.; Al-Saadi, S.; AbdulRazak, A.A.; Salih, I.K.; Zrelli, A.; Alsalhy, Q.F. Fuel Cell Types, Properties of Membrane, and Operating Conditions: A Review. Sustainability 2022, 14, 14653. https://doi.org/10.3390/su142114653
Jawad NH, Yahya AA, Al-Shathr AR, Salih HG, Rashid KT, Al-Saadi S, AbdulRazak AA, Salih IK, Zrelli A, Alsalhy QF. Fuel Cell Types, Properties of Membrane, and Operating Conditions: A Review. Sustainability. 2022; 14(21):14653. https://doi.org/10.3390/su142114653
Chicago/Turabian StyleJawad, Noor H., Ali Amer Yahya, Ali R. Al-Shathr, Hussein G. Salih, Khalid T. Rashid, Saad Al-Saadi, Adnan A. AbdulRazak, Issam K. Salih, Adel Zrelli, and Qusay F. Alsalhy. 2022. "Fuel Cell Types, Properties of Membrane, and Operating Conditions: A Review" Sustainability 14, no. 21: 14653. https://doi.org/10.3390/su142114653
APA StyleJawad, N. H., Yahya, A. A., Al-Shathr, A. R., Salih, H. G., Rashid, K. T., Al-Saadi, S., AbdulRazak, A. A., Salih, I. K., Zrelli, A., & Alsalhy, Q. F. (2022). Fuel Cell Types, Properties of Membrane, and Operating Conditions: A Review. Sustainability, 14(21), 14653. https://doi.org/10.3390/su142114653