Abstract
Peat deposits are extensively distributed worldwide, and the various common engineering-failure problems involving peat have attracted greater attention from researchers in regard to understanding the mechanical behavior of peat. This study investigated extensive index and consolidated undrained triaxial compression tests applied to the peaty soils of Dian-Chi Lake, located in Yunnan, China. A series of consolidated undrained triaxial compression tests on peat specimens were carried out in this study, and the influences of confining pressure, organic matter content and strength parameters were investigated. The test results indicate that, to obtain a B-value greater than 0.98, the average back pressure of the Dian-Chi Lake peaty soil should be at least 150 kPa, with organic matter contents N ranging from 30% to 85%. Compared with the existing oedometer consolidation results of the research team, the values of compressibility and permeability behavior under the oedometer and isotropic consolidation conditions are not significantly different. In addition, the average failure strain, εf, ranged from 9% to 15% for the investigated normally consolidated specimens, and the average effective angle of internal friction was 43.8°, which is greater than the maximum internal friction angle of 35° for typical soft clay and silt soils. A correlation was proposed by curve fitting the experimental data to better capture the nonlinear relationship between φ′ and N. Furthermore, the values of the normalized undrained strength, Su/σc′, varied from 0.56 to 0.84, which is larger than that of the inorganic soft clay and silt deposits.
1. Introduction
Peat deposits are composed of partially decomposed plant residues accumulated under waterlogged and fossilized conditions, usually around basins and lake shores, and are extensively distributed worldwide. For example, in China, peatlands cover approximately 42,000 km2; thus, China ranks seventh among the countries with the largest organic land area [1]. Due to the effects of constant decomposition and consolidation, the physical mechanics of organic soil are poor compared with inorganic soils such as clay and sand [2,3,4,5,6,7]. The investigated Dian-Chi peat soils are widely distributed, and they exhibit a high organic-matter content, high humification degree, high water content, high compressibility and low bearing capacity. These factors adversely affect infrastructure, especially for constructions built on poor foundations, such as railway embankments and house foundations built on peat. Therefore, it is necessary to investigate the deformation and strength behavior of these soils; laboratory experiments are an effective means to analyze their physical and mechanical properties.
To describe the variation law of pore pressure and total stress during the undrained shearing process of soil, Skempton (1954) [8] proposed the pore pressure coefficient B, which can also be used to describe the change in saturation relative to the depth below the water table. ASTM (1995), BS1377-8 (1990) [9,10] and GB50021 (2001) [11] give specific steps of back pressure saturation for undisturbed soil specimens in the triaxial test. Shen et al. (2021) [12] and Chen et al. (2022) [13] studied the effect of saturation on shear behavior and particle breakage of coral sand. However, there is no uniform standard for how much back pressure is generally selected for peat soil to be saturated. Couling et al. (2014) [14] examined the change law of the B-value of lignite material with a composition and mechanical properties similar to peat soil and discovered that back pressure is the main reason for the change in the B-value. Studies on the oedometer consolidation have been conducted by our research team for the typical peat soil in the Dian-Chi Lake area [15,16,17,18], which provides relevant parameters for settlement calculations in practical engineering. He et al. (2018) [19] and Li et al. (2020) [20] have conducted experimental studies on triaxial isotropic consolidation characteristics for Shanghai soft clay. However, studies under isotropic consolidation are relatively rare, O’Kelly et al. (2013) [21] conducted a related analytical study of the isotropic consolidation test for Irish peat soils. In this test, a series of isotropic consolidation tests were conducted to investigate the consolidation behavior of Dian-Chi peaty soil.
The shear-strength properties of peat soils indicated that peat was strictly cohesive [22]. Adams (1965) [23] reported that the properties of peat were purely frictional, that the friction angle was 48° and that the static earth pressure coefficient (K0) was as low as 0.18. Subsequently, the friction properties of peat strength are now well established with high friction angles [24,25]. Yamaguchi et al. (1985) [26] and Edil et al. (2000) [27] also reported that anisotropic fabric of fibrous peat remains after isotropic consolidation. Therefore, this paper was concurrently summarized in the database. Triaxial tests of fibrous peat give effective internal friction angle (φ′) values in the range of 48° to 68° [1,24,25,28,29]. In the case of inorganic soft clay and silt, for normally consolidated clays, the value of the undrained strength ratio (Su/σc′) is considered a constant and varies with the overconsolidation ratio. For instance, a study applying anisotropically consolidated undrained triaxial compression tests on three different peats that contained a range of organic contents indicated that the Su/σc′ was in the normal consolidation range of organic soils and amorphous peats; the Su/σc′ varied from 0.62 to 0.75 [30]. Similar sources of high Su/σc′ from different organic Japan peaty soils show a high Su/σc′ in the range of 0.5 to 0.63 [31]. In another research project, the strength ratio was not constant; instead, it varied with the stress level in the range of 0.43 to 0.49 [32]. Edil et al. (2000) [27] reported a range of 0.69 to 0.75 for Madiso organic soils. These values are larger than the ranges of 0.3~0.35 and 0.2~0.28 for the inorganic soft clay and silt deposits, respectively.
In this study, a series of consolidation undrained (CU) triaxial tests that were strain-controlled were proceeded to study the strain behavior, excess pore-pressure development and strength properties of undisturbed Dian-Chi peaty soils in Yunnan, China. The Dian-Chi peaty soil is composed of strongly to completely humified peat and highly organic fine-grained soil layers. The study investigated the unique back pressure saturation, isotropic consolidation and strength behavior of deposition with organic matter content in the range of 30%–85%. The results were compared with the existing oedometer consolidation results of the research team. The value ranges of failure strain, εf; internal friction angle, φ′; cohesion, c′, and the normalized undrained strength, Su/σc′, were given. In addition, a regression relationship between φ′/N and N was proposed based on the experimental data.
2. Experimental Program
2.1. Field Site
Dian-Chi is located in the Yunnan-Guizhou Plateau in Southwestern China and is the largest lake in Yunnan. Due to its special geographical location and plateau climate, the late Quaternary peat deposits are concentrated here, and the groundwater level is affected by seasonal atmospheric conditions. The water-level fluctuations have a significant impact on the engineering properties of shallow peat soil layers. The sample site used in this test is located in the resettlement housing construction project plot of Dian-Chi North Area, Xishan District, Kunming City, Yunnan Province. The site is located on the east side of the Caohai Sea, 400–500 m from the Caohai Sea. The current site consists of mostly open land, which was formed after demolition in 2014, and the terrain is relatively flat. The location is shown in Figure 1.
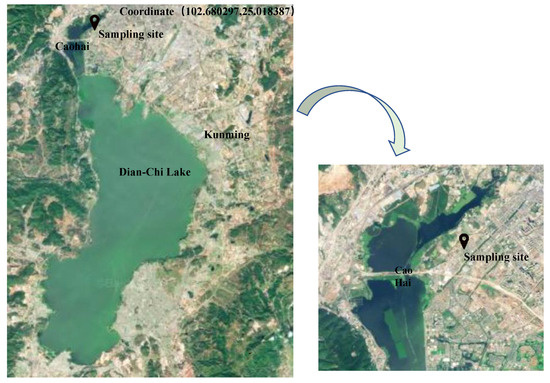
Figure 1.
Study area on a map of China.
2.2. Peat Mineralogy Composition and Index Properties
All undisturbed samples were obtained using a thin-wall sampler, and the soil sampler used for soil sampling was an open-top suction, GK-S double-sample, semi-integrated tube, which reduced the disturbance and damage occurred to the soil samples during the static pressure process via thin-wall sampling. After the peaty soil samples were removed, an on-site wax-sealing treatment was carried out, and the samples were taken to the laboratory for further testing.
The Dian-Chi samples were black or dark brown and had a slight organic smell, as shown in Figure 2. Multiple samples were tested to obtain values for the index and physical properties of Dian-Chi peaty soil by our research group [17,18,33,34]. However, to ensure the continuity and integrity of the paper, the test process for the main physical property index is briefly described. The main properties index values are summarized in Table 1. Considering that the specifications of the American Society for Testing and Materials (ASTM) and British Standards (BS) gave targeted test suggestions for peaty soils, the test methods in these standards were utilized as references in this article, and some differences among the related test methods of ASTM, BS and Chinese National Standards were employed for comparison.
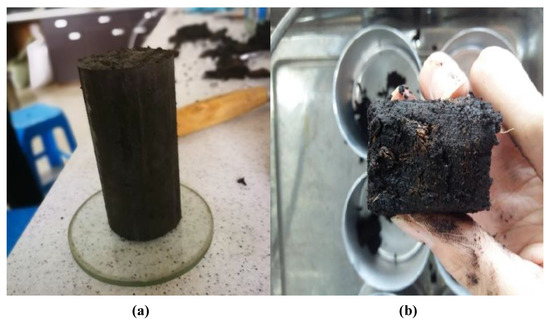
Figure 2.
Undisturbed Dian-Chi peaty soil: (a) soil-sample cutting and (b) section of soil sample.

Table 1.
Index properties of Dian-Chi peat.
For peats and other highly organic soils, from the perspective of geotechnical engineering, water content is the most important indicator test that can be used to estimate some of their geo-engineering properties [33,35,36]. The water content, w, for the Dian-Chi peaty soil was determined by the mass of about 50 g wet sample and the 24 h oven-drying time at 105 °C. Although some constituent solids in peat are prone to slight charring/oxidation at this drying temperature, the water-content values determined under these test conditions are sufficiently accurate [33,37,38,39]. According to ASTM (2014) [40], the powdered oven-dried samples were measured at 105 °C and calcined at 440 °C. During this period, the soil sample was weighed every 2 h until the weight of the soil sample reached a constant value, and the organic matter content was determined.
The natural bulk density of the samples was based on the specification of ASTM (2015) [41]. To investigate the specific gravity of the organic and inorganic solid fractions separately, a series of pycnometer tests were conducted according to ASTM (2014) [42]. This procedure was conducted on raw peat-soil specimens, using kerosene as a wetting agent to obtain the average specific gravity of solid phase, Gs, and distilled water was used as a wetting reagent to determine the specific gravity of residual ash after the organic-matter-determination procedure to obtain the average specific gravity of the inorganic solid phase, Gsm. Our research team explored the Gs–N relationship in depth for estimating the specific gravity of peaty soils based on the measured N value [34].
2.3. Test Procedure
Isotropic consolidated/undrained (CIU) triaxial compression testing was performed on a computer-controlled GDS triaxial apparatus, including two pressure volume controllers, which can automatically control the applied cell and back pressures with an accuracy of 1 kPa and measure the volume change response of the sample with an accuracy of 0.03 mL. The specimens were subjected to triaxial compression through a Tritech 50 kN load frame. The axial deformation of the specimen was measured by using a linear displacement sensor 3 kN load cell located in a plexiglass pressure cell. The specimens were obtained from larger block samples, and each specimen was shaped by a wire saw to a cylindrical specimen with a diameter and height of 38 mm and 79 mm, respectively, for the triaxial tests. The specimens were saturated with degassed water by means of stepped back pressure until a minimum B-value of 0.98 was achieved. The specimens in the “triaxial tests” were isotopically consolidated to 25–200 kPa effective stresses. For all the specimens, the consolidation time was determined by the end of pore pressure dissipation; that is, there was almost no time for secondary consolidation of the specimens before shearing. Note that, during the process of isotropic consolidation, single drainage was allowed at the top of the specimen, and the bottom porous stone was connected to a pore pressure transducer to measuring the base pore pressure. Drainage of the specimen was performed through filter papers surrounding the sample to a porous sintered bronze ring in the loading platens. The shearing process was undrained shear under strain control, and the shear rate was 0.05%/min.
3. Experimental Results and Analyses
3.1. Back Pressure Saturation
The saturation process of all the test specimens in this paper was carried out with three B-checks and three back pressure saturation tests at different pressures. Selecting the specimen with organic matter content of N = 30% as an example, in the saturation process, the back pressure and back volume against elapsed time responses are illustrated in Figure 3. Combined with Figure 4, the findings reveal that the initial B-value of the specimen is B1 = 0.9. The specimen was then saturated for 46 h under a back pressure of 100 kPa. As expected, since the closed air bubbles in the specimen gradually dissolve in water, the curve of the back volume shows a trend of fast, slow and then stable conditions, and the stable trend continues for nearly 30 h. A second B-check was performed, and B2 = 0.95. Because specimen saturation was confirmed by measuring a minimum pore-pressure-coefficient B-value of 0.98, the second-stage back pressure saturation of 200 kPa was carried out. This process determined that the back volume of the specimen remained stable after rapidly rising and that the ascent lasted approximately 15 min. The third B-check obtained B3 = 0.982. This process shows that the B-value of the Dian-Chi peaty soil specimens was greatly affected by back pressure but less correlated with the elapsed time of saturation. This view was consistent with the conclusions proposed by Black and Lee. (1973) [43] and Couling et al. (2014) [14] in back pressure saturation tests on soil and lignite. To further illustrate this phenomenon, the third-stage back pressure saturation of 300 kPa was carried out. The results revealed that the back volume of the specimen remained stable after rapidly rising and that the ascent elapsed time was less than 1 min. This phenomenon indicates that discontinuous pores in peaty soil specimens can be opened only under a certain pressure.
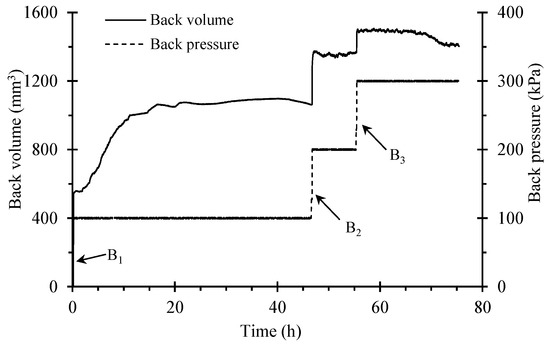
Figure 3.
Plot of the back pressure saturation process.
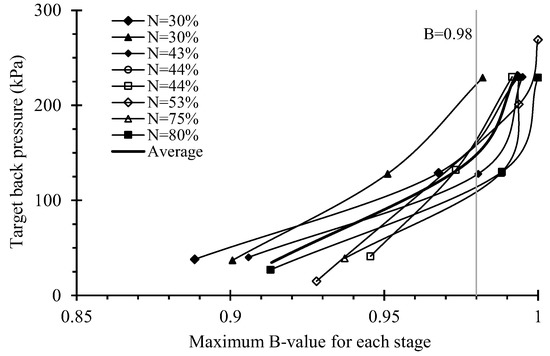
Figure 4.
Relationship between the B-value and target back pressure.
The most important result provided by the tests was the relationship between the B-value and the back pressure for the specimens of Dian-Chi peaty soil; the corresponding curve is shown in Figure 4. This curve shows the maximum B-value recorded for each stage of each test and the target back pressure for each stage. All curves have similar trends, but there are some differences. The specimens with N = 30% not only have different values of B1, but their back pressure corresponding to B = 0.98 differs by 60 kPa. When the back pressure reaches about 100 kPa, a significant change in the trend can be observed. At this point, the increase rate of B-value relative to back pressure decreases significantly. This trend also indicates that the specimens began to reach a B-value higher than 0.98, which indicates that the sample is approaching a fully saturated state. The analysis indicated that the average back pressure for Dian-Chi peaty soils should be at least 150 kPa to ensure that the average B-value exceeds 0.98. In this paper, the consolidation undrained test specimens underwent back pressure saturation using a back pressure of 300 kPa and a cell pressure slightly greater than 300 kPa. Complete saturation was confirmed by checking the B-value. In all tests, the B-value is greater than 0.98.
3.2. Isotropic Consolidation
The consolidation phase used the same equipment after the saturation phase, and the consolidation of the specimen for these tests is isotropic. The objective of the consolidation stage is to make the Dian-Chi peaty soil samples to the state of effective stress required for the triaxial compression shear test. The data obtained from the isotropic consolidation stage are generally applied to determine when consolidation is complete and to estimate a suitable rate of strain to be applied during compression. In addition, this paper also compared oedometer consolidation data that were previously published by the same research team [17] to investigate the effects of organic matter content and consolidation stress on the relationships of consolidation coefficient, Cv; volume compression coefficient, mv; and permeability coefficient, kv. The consolidation time is generally 2–3 days, depending on the pore pressure dissipation of each specimen, after which time the ue readings appeared to have started to equilibrate. Hence, the degree of isotropic consolidation (U) for the saturated specimens was in accordance with BS1377-8 (1990) [10]:
where U is the degree of consolidation, ui is the pore pressure when a steady value is reached, u is the observed excess pore pressure reading at time t, ub is the back pressure at the start of the consolidation and ui − ub is the excess pore pressure to be dissipated.
Figure 5 presents the degree of consolidation achieved during the triaxial consolidation stage and indicates that the primary consolidation occurred relatively quickly, especially for the specimens under isotropic consolidation stress of σc′ = 25 kPa with different organic matter contents. The duration of isotropic consolidation lasted approximately 20 min, and the dissipation of excess pore water pressure was almost instantaneous. However, the time required for dissipation of excess pore water pressure was 3965 min for the specimen under σc′ = 200 kPa and N = 85%. For σc′ = 50–100 kPa, the duration of isotropic consolidation ranged from 120 to 880 min and was generally required for substantive dissipation (U > 0.85) of excess pore-water pressures to occur. The result is basically consistent with Yamaguchi et al. (1985) [26], who reported that, under isotropic consolidation conditions, undisturbed fibrous peat samples (D = 50 mm by H = 125 mm), the dissipation time of excess pore-water pressure is between 700 and 1000 min, under isotropic consolidation for σc′ = 70–100 kPa and with side drains provided.
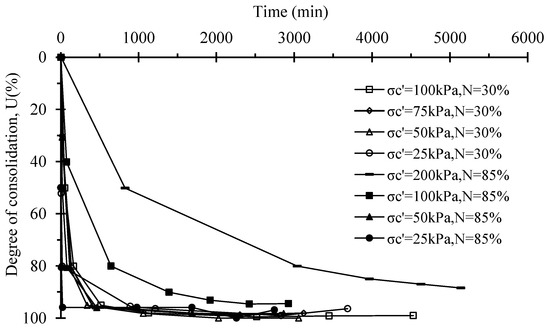
Figure 5.
Degree of triaxial isotropic consolidation for Dian-Chi peaty soils.
The conservatively adopted shear rate of 0.05%/min applied during the triaxial shear stage was based on the time period, t100. Figure 6 gives the determination method of t100, which is obtained from the straight line that best fits the early portion of the plot of volume change against the square root of time. The initial part of this plot to approximately 50% consolidation is approximately linear for the consolidation stage conditions. The final point should represent at least 95% dissipation of the excess pore pressure; this study chose U = 95%. The point time corresponding to the intersection of the straight-line portion and horizontal line is , which, multiplied by itself, gives t100, the time representing theoretical 100% consolidation [10]. “End of primary” refers to the state of Dian-Chi peaty soil corresponding to the actual complete dissipation of the excess pore water pressures. Figure 5 shows that the dissipation of the excess pore-water pressures is rapid during all loading stages, thus implying that the “end of primary” also occurs rapidly because of the high permeability of the Dian-Chi peaty soil. It can be inferred that t100 increases when the applied stress level increases. These t100 values were factored by 0.53 specified for the undrained condition in BS1377-8 (1990) [10] and were determined by the curve-fitting analysis of the measured degree of consolidation and volumetric strain responses with the square root of elapsed time and logarithm of elapsed time, as shown in Figure 7. Based on the curve-fitting, O’Kelly et al. (2013) [21] adopted the appropriate strain rate in triaxial consolidation drained test for Ireland fibrous peat. According to BS 1377-8, which was specified for the undrained test, the time to shear failure should not be less than 2 h. In this test, the rate of axial strain was 0.05%/min in undrained triaxial shear, and the minimum stage duration was 5 h, which is consistent with that report by Yamaguchi et al. (1985) [26].
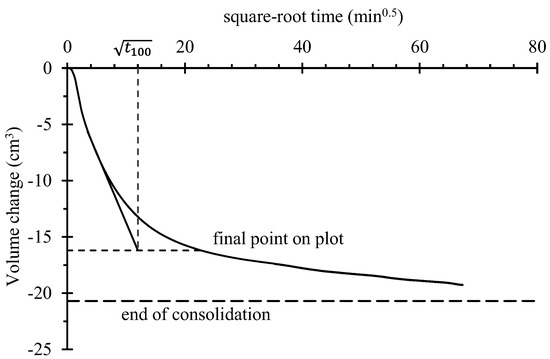
Figure 6.
Derivation of theoretical t100 from the volume-change square-root time-consolidation curve for a triaxial specimen.
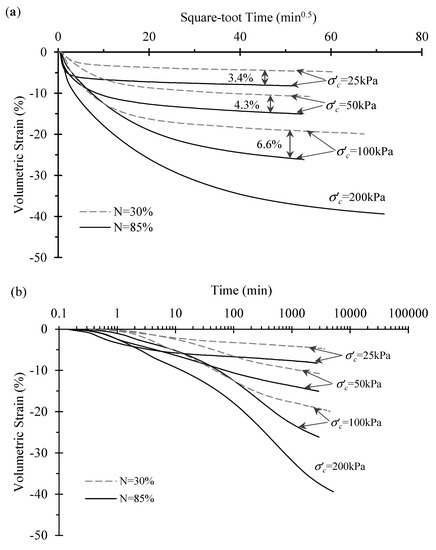
Figure 7.
Volumetric strain against elapsed time during triaxial consolidation for Dian-Chi peaty soils with N = 30% and N = 85%: (a) square root of elapsed time and (b) logarithm of elapsed time.
Figure 7a shows the volumetric strain responses against the square root of elapsed time. The volumetric strain of the Dian-Chi peaty soil specimen with high organic matter content is larger than that of the specimen with low organic matter content. The difference increases with increasing effective confining stress, σc′. Figure 7b shows that the consolidation stages for the two Dian-Chi peaty soils with different organic matter contents are not linear with the logarithm of time, and similar nonlinear behavior was also observed in some of the loading stages of the other tested specimens.
To determine the deviation of the consolidation properties under the oedometer and isotropic consolidation conditions for Dian-Chi peaty soils and to accumulate relevant test data, this information is used to investigate the consolidation properties of Dian-Chi peaty soils [17]. The variations of the consolidation coefficient (Cv) and the volume compressibility coefficient (mv) with vertical effective stress (σv′) are shown in Figure 8 and Figure 9. The coefficients under the two experimental conditions of oedometer and isotropic consolidation are compared; those of the oedometer test coefficients were previously published by our research team. The coefficient of isotropic consolidation (Cv) can be determined with Equation (2), and the coefficient of volume compressibility, mv (in m2/MN), can be defined with Equation (3), according to BS1377-8 (1990) [10]. We obtain the form as follows:
where D is the diameter of the specimen, 38 mm; L is the length of the specimen, 79 mm; and λ = 84, according to BS1377-8 (1990) [10]. Cv is expressed in m2/year, and t100 is expressed in minutes. Next, we obtain the mv:
where ∆Vc is the change in volume of the specimen due to consolidation (in cm3), V0 is the original specimen volume (in cm3), ui is the pore pressure at the start of the consolidation stage (in kPa) and uc is the pore pressure at the end of consolidation (in kPa).
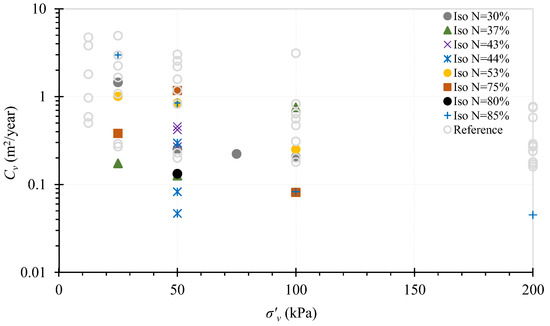
Figure 8.
Variation in the coefficient of consolidation with effective vertical stress for Dian-Chi peaty soil under isotropic and oedometer consolidation [17].
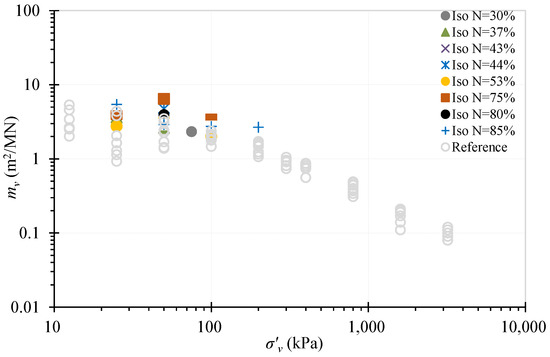
Figure 9.
Variation in the coefficient of volume compressibility with effective vertical stress for Dian-Chi peaty soil under isotropic and oedometer consolidation [17].
As shown in Figure 8 and Figure 9, a comparison between the oedometer and the isotropic consolidation conditions indicates that the values of both Cv and mv under the two test conditions are not significantly different. The comparison also reveals that the coefficient of consolidation has the same trend of decreasing with increasing effective stress and is not greatly affected by the organic matter content under the same stress conditions. Note that, for some tested specimens, the high value of Cv at low stresses may be attributed to their preconsolidation.
By substituting the values of mv and Cv in , the coefficient of vertical permeability (kv) for each test and loading stage was obtained, and γw is the unit weight of water. Figure 10 presents the relationship between the effective vertical stress and logarithm of vertical permeability under the two consolidation conditions. There is no significant difference in values, and the permeability of all tested samples will decrease when the applied pressure increases from 25 to 200 kPa. However, for the peat with N = 77%, the applied pressure increases from 25 to 100 kPa, which is consistent with the reported characteristics of fibrous peats [1].
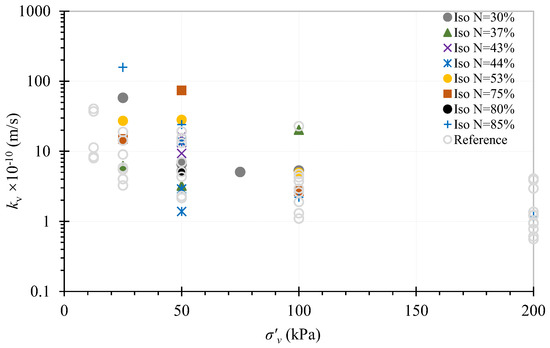
Figure 10.
Variation in the coefficient of permeability with effective vertical stress for Dian-Chi peaty soil under isotropic and oedometer consolidation [17].
Generally, the values of Cv calculated by isotropic consolidation should be used only for estimating the rate of strain in the triaxial test and not in consolidation or permeability calculations. Because side drains are utilized, the value of Cv derived in this way can be grossly in error. However, the results indicate that the overall differences between these two consolidation methods were minor.
3.3. Undrained Triaxial Compression Tests
To investigate the effect of organic matter content on the shear behavior of the investigated Dian-Chi peaty soil, a series of isotopically consolidated undrained triaxial compression tests were performed on undisturbed samples at effective confining stresses (σc′) ranging from 25 to 200 kPa, with organic matter contents of N = 30%~85%. In this study, the shear process is strain-controlled, and the failure is defined by the peak deviator stress, which is also known as the yield point. The deviator stress, axial strain and mean effective stress at the yield point that is the failure point are expressed as qf, εf and pf′, respectively.
All the test results are summarized in Table 2. An example of Dian-Chi peaty soil with organic matter content of N = 30% is used to present the test process. Figure 11 presents the typical q versus axial strain (εa) plots, change in pore water pressure (u) versus εa plots and mean effective stress (p′) space of the specimens with N = 30%. The specimens exhibit a linear elastic response of only up to approximately 2% of εa, and following the initial elastic behavior, all specimens show a gradual transition from a linear elastic strain-softening stress–strain response to a linear strain-softening stress–strain response (Figure 11a). The peak qf values of 61.7, 71.9, 95.3 and 115.6 kPa are 146.8%, 43.8%, 27.0% and 15.6% higher, respectively, than the corresponding effective consolidation pressures (σc′) of 25, 50, 75 and 100 kPa, respectively. Different from the deviatoric stresses, the evolution of the pore water pressure exhibits a nearly monotonic increase with the axial strains (Figure 11b).
Table 2.
Stress conditions prior to shear and results at failure in undrained triaxial compression tests.
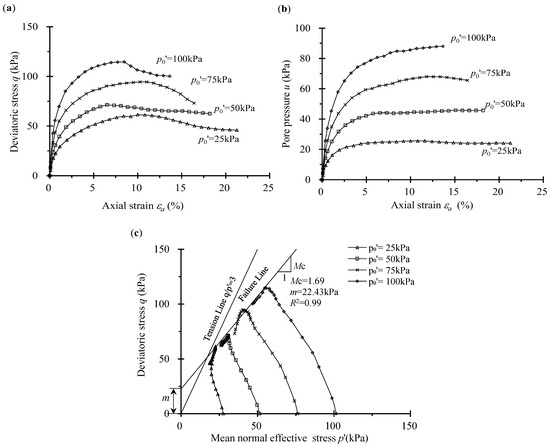
Figure 11.
Results of undrained triaxial tests on undisturbed Dian-Chi peaty soils with N = 30%: (a) stress–strain curves, (b) pore-water-pressure/strain curves, and (c) effective stress paths.
Figure 11c shows that the effective stress path developed to the left before the destruction (yield point), indicating that the excess pore water pressure in the peaty soil specimens continued to increase and that the average effective stress continued to decrease; that is, the specimen showed a shrinking trend at this stage. As shown in Figure 11c, Mc and m are the slope and y-intercept, respectively, of the fitted curve for the yield point in q–p′ space obtained from CU triaxial tests, and R2 is coefficient of determination. With the exception of the specimen with p0′ = 25 kPa, where the stress path developed to the left in the initial stage and then to the right until the yield point was reached, the peaty soil behavior changed from “shrinkage” to “dilation”, as is normally observed in sand samples [44]. Note that the latter is at a relatively small stress level, and its deformation characteristics are affected by factors such as the initial void ratio of the soil and the stress level. To assist in defining the failure behavior, a “tension cutoff” with an inclination of q/p′ = 3 through the origin is plotted in the q–p′ plane, which represents the zero effective stress condition. The stress paths are plotted below this line, indicating that no tensile failure occurs for the Dian-Chi peaty soil specimens. Under triaxial compression, the “Tension cutoff” failures are usually observed in peat, especially in fibrous peat samples [1]. The lack of a “tension cutoff” failure in the Dian-Chi peaty soil is possibly attributed to the relatively low fiber content in the Dian-Chi peaty soil, with N = 35%, compared with other peats. Although some fibers may break under tension, the frictional shear component controls the overall engineering behavior of this fibrous peat. Yamaguchi et al. (1985) [26] and Cola et al. (2005) [45] also observed this behavior. This discovery shows that the content and type of organic fibers will determine the failure mechanism and behavior of fibrous peats in engineering work.
3.4. Influence of Organic Content
Based on the results of the consolidation undrained compression test on the investigated Dian-Chi peaty soil specimens, the effect of the organic content on the undrained compression behavior was analyzed. To investigate the effect of organic matter content more precisely on the shear characteristics of peat soil, an effective confining pressure of 100 kPa was selected for the normalized samples.
The results of normalized q/σc′ vs. εa in Figure 12a show that the effect of the undrained shear behavior under triaxial compression conditions of the organic matter content on the compression shear behavior is remarkable and can be approximately normalized by the effective stress, σc′, at the beginning of shear. The organic matter content increases with an increase in the q/σc′ value, and the values are very large compared with those for the specimens (N = 30% and N = 85%) at strains larger than 25%.
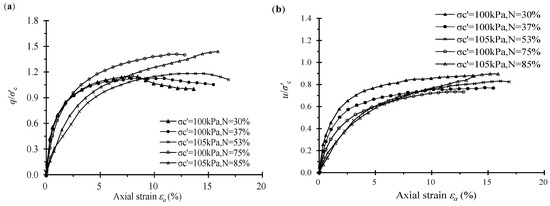
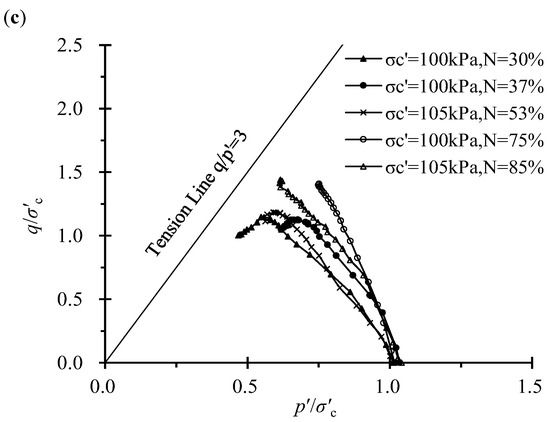
Figure 12.
Influence of organic matter contents on Dian-Chi peaty soils: (a) stress–strain curves, (b) pore-water-pressure/strain curves, and (c) effective stress paths.
Figure 12b showed that the amount of organic matter content has a significant effect on the pore-water-pressure behavior for specimens containing a relatively low organic matter content of 30% or less, especially at the beginning of the compression test. The values are very large compared with those for the specimens (N = 30% and N = 75%) at strains larger than 20%. As the triaxial compression progressed, in the cases of the specimens with organic matter contents greater than 30%, the u/σc′ curves gradually show agreement, and there is no apparent effect related to the organic matter content.
As shown in Figure 12c, for all the specimens that contain an organic matter content in the range of 75–85%, the effective stress paths reveal that the deviator stress, q, increases to the maximum value with an almost constant effective mean stress, p′, during undrained shear. Adams (1965) [23] also observed a similar stress-path relationship from an undrained triaxial compression test on saturated fibrous peat with organic matter content of N = 77–80%. Generally, failure is usually considered to correspond to the maximum principal stress difference (maximum deviatoric stress) or the principal stress difference (deviator stress) at 15% axial strain—whichever is obtained first during the performance of the tested cohesive soils in ASTM (1995) [9]. However, there are no special instructions for peaty soils in the existing specification.
Figure 13 presents the various strains (εf) corresponding to the maximum deviatoric stress plotted against the overconsolidation ratio (OCR) and ignition loss (N). There is a large scatter here. However, as is evident from this figure, εf generally increases in value with increasing N (organic matter content) for the specimens that are less than or near the preconsolidation stress OCR ≤ 1 for the investigated Dian-Chi peaty fine-grained soils. The preconsolidation pressure of the specimen was obtained according to the one-dimensional consolidation test of the research team [17]. For the case of overconsolidation, in which OCR is equal to 2.0 and 2.5, εf is roughly distributed at approximately 10% and has no obvious relationship with N.
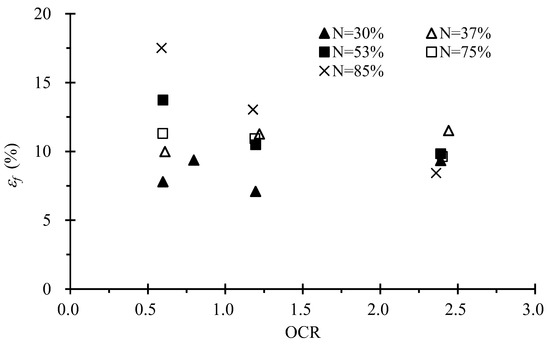
Figure 13.
Strain, εf, against OCR and organic matter contents, N, for Dian-Chi peaty soils.
To more intuitively present the relationship between εf and the organic matter content, N, as evident from Figure 13, the average value of all the peaty specimens with OCR 1 and the same N is obtained. As shown in Figure 14, the average value for εf ranges from 9% to 15% for the investigated Dian-Chi peaty soils with OCR 1. Yamaguchi et al. (1985) [26] also observed values of εf ranging from 12% to 15% from an undrained triaxial compression test on saturated fibrous peat. The εf vs. N relationship in Figure 14 approximately linearly increases with increasing N. Although the dataset at five entries was relatively small, the large range in N values for the worked specimens acted in favor of developing a robust correlation. From the curve fitting, the authors deduced the εf–N correlation given by Equation (4) to better capture their linear relationship for the Dian-Chi peaty soils:
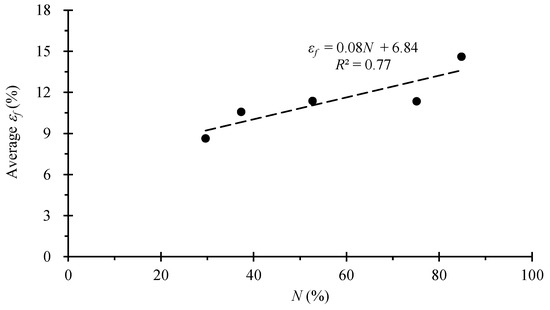
Figure 14.
Average εf against organic matter contents, N, for Dian-Chi peaty soils.
3.5. Undrained Strength Parameters
The effective friction angle of peats is usually determined in consolidated undrained (CU) triaxial compression tests and occasionally in drained direct ring or simple shear tests. Due to the overall change of specimen size and shape during the test, few drained triaxial tests were carried out. Using the CU test, the pore water pressure can be measured to derive the effective strength parameters. Based on the values of qf plotted against values of pf′ for the investigated Dian-Chi peaty specimens with organic matter content N = 30%–85%, only the stress states at failure, which are determined from deviator stress maximum criteria, are shown in Figure 15. Additionally, the symbols Mc and m in Figure 15 are the inclination and vertical intercept, respectively, of the yield line in q–p′ space obtained from CU triaxial tests (Figure 11c). Figure 15 shows the relationship of qf–pf′ for the investigated peaty soil specimens, approximated by a straight line. The effective angle of shearing resistance, φ′, and cohesion intercept, c′, can be estimated. These values of φ′ and c′ calculated by Equations (5) and (6) based on the slope (Mc) and vertical intercept (m), in addition to the values of Su/σc′, are summarized in Table 2, and Su is the undrained shear strength, qf/2.
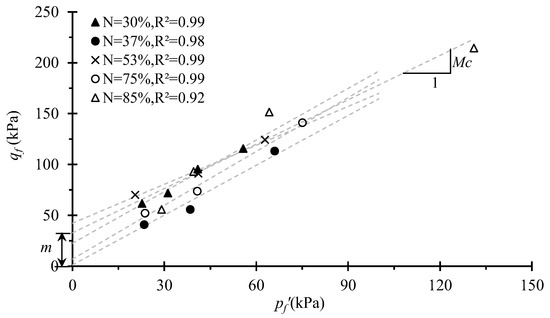
Figure 15.
Best fit straight line representing the tops of the yield line in q–p′ space obtained from CU triaxial tests.
As shown in Table 2, the value range of c′ was 0.57–19.8 kPa for the investigated peaty soil specimens with different organic matter contents and large dispersion. The value range of φ′ was 35°–60°, and the average effective angle of internal friction was 43.8°. According to the statistical results in this paper, as shown in Table 3 and Figure 16a, the internal friction angle of the fiber peat soil is in the range of 30.8° to 66.5°. The internal friction angle of fibrous peat soil is higher than that of general soft clay, and this fact has always been a concern of researchers. Edil et al. (2000) [27] and Badv et al. (2012) [46] also agree that because a large number of incompletely decomposed plant fibers in fibrous peat soil are crisscrossed among soil particles, during the triaxial compression process, the plant fibers have a similar role of “reinforcing” the fibers on the shearing surface. The fibers form an “interlocking” structure, which effectively improves the internal friction angle of the soil. Note that due to the small size of the geotechnical test specimens, the “reinforcing” effect of the residual fibers is magnified. Notably, the shear-strength parameters obtained from conventional geotechnical tests should be directly applied in engineering design with caution.
Table 3.
Physical and mechanical indices of the peat soil.
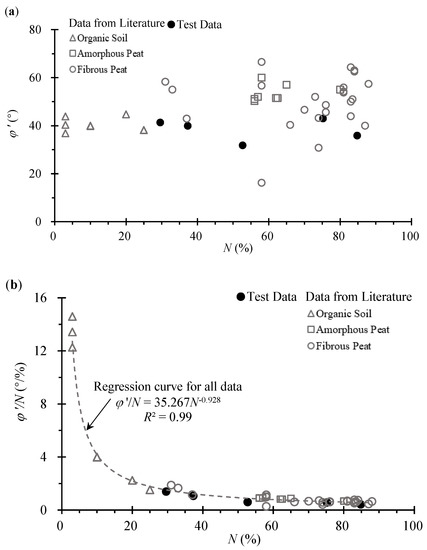
Figure 16.
Effect of N on φ′: (a) relationships between φ′ and N; (b) relationships between φ′/N and N.
Table 3 summarizes the results of typical triaxial compression carried out by other researchers on undisturbed peats and organic soils available to the authors. In this table, materials with an organic content less than approximately 25% are referred to as organic soils, and those with an organic content greater than 25% are referred to as “peat”. The tests are CU triaxial compression tests, under isotropic consolidation (ICU) or anisotropic consolidation (KCU). Yamaguchi et al. (1985) [26] reported that the anisotropic fabric of fibrous peat still exists after isotropic consolidation. Therefore, the results of both tests were simultaneously processed. There is no significant difference between the peat-soil data of Dianchi Lake and the literature data, thus indicating that the friction angle has no direct dependence on the organic content. The fibrous and amorphous peats show no perceptible differences.
As shown in Figure 16b, the above experimental observations and analyses indicate a certain regression relationship between φ′/N and N. The regression analysis based on the database in Table 2 and Table 3 gives the following expression between φ′ and N, and the regression coefficient reaches 0·99:
Additionally, the value of the normalized undrained strength, Su/σc′, varied from 0.56 to 0.84, with the exception of the undamaged specimen, with N = 85%, σc′ = 200 kPa and Su/σc′ = 0.52. When σc′ = 25 kPa, the specimens were overconsolidated, and the Su/σc′ values even reached 1.23. These large values in the strength parameters of peat have also been reported by other researchers, as summarized in Table 3 and Figure 17. Figure 17 shows the data on the investigated Dian-Chi peaty soil combined with additional normalized undrained strength (Su/σc′) data from the literature on peat deposits. The normalized undrained strength, Su/σc′, as a function of organic content for all peats and organic soils is given in Table 2 and Table 3. The investigated Dian-Chi peaty soil data are plotted with the data from the literature; both showed no distinct differences. These data indicate that the normalized undrained strength has no direct dependence on the organic matter content. The fibrous and amorphous peats show no significant differences, with an average normalized undrained strength of 0.60 and the majority of the data falling between 0.5 and 0.85. Compared with peat, the normalized undrained strength of organic soil, especially soil with organic content less than 20%, seems to be lower. For comparative purposes, soft inorganic clay and silt deposits have typical Su/σc′ ranges of 0.3~0.35 [57,58] and 0.2~0.28 [59], respectively, as shown in Figure 17.
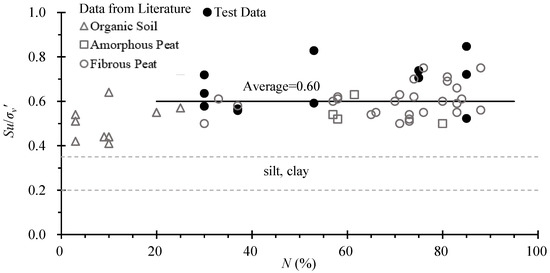
Figure 17.
Normalized undrained strength versus organic matter content for normally consolidated peat.
According to the CU triaxial compression test, there is obvious evidence that peat has very high undrained strength compared with most inorganic soils. However, the strength is attributed to the fact that the high pore pressure measured during the test is still unclear, which gives an artificial feeling that the effective normal stress of the shear resistance borne by the fiber-reinforced bar is low. Further research is needed to determine how much of this large measurable friction angle will operate in the field in an effective stress analysis.
4. Conclusions
The main conclusions from the standard consolidated undrained triaxial compression test procedure performed on the investigated Dian-Chi peaty soil specimens are presented as follows:
- (1)
- The back pressure saturation process indicates that the B-value is only related to the back pressure and unrelated to the saturation time for a certain level of pressure, and it suggested that, to ensure that B is greater than 0.98, the average back pressure for Dian-Chi peaty soils should be at least 150 kPa.
- (2)
- During isotropic consolidation, the volumetric strain for soils with high organic matter content is generally larger than that for soils with low organic matter content. Compared with the existing results of the research group, the values of both Cv and mv under the oedometer and isotropic consolidation conditions were not significantly different, and the variation trend of the consolidation coefficient decreased with increasing effective stress and was not greatly affected by the organic matter content under the same stress conditions.
- (3)
- The failure behavior was contraction, and the corresponding average strain, εf, at failure was in the range of 9–15% for the investigated normally consolidated specimens, except for the specimens with effective stress of 25 kPa. Based on the experimental results, the authors discovered an empirical relationship between εf and N. However, in the overconsolidated state, the shearing process was generally contraction and then dilation.
- (4)
- The average effective angle of internal friction is 43.8°, which is greater than the maximum internal friction angle of 35° for typical soft clay and silt soils. Combined with experimental data, this finding indicated a certain regression relationship between φ′/N and N and that the regression coefficient reached 0.99. The value of the normalized undrained strength, Su/σc′, varied from 0.56 to 0.84, which is larger than the range of 0.3~0.35 and 0.2~0.28 for inorganic soft clay and silt deposits, respectively.
Author Contributions
Conceptualization, X.L., M.Y. and W.L.; methodology, W.L. and X.L.; investigation, X.L. and H.Z.; data curation, X.L. and H.Z.; writing—original draft preparation, X.L.; writing—review and editing, X.L., W.L., M.Y. and H.Z. All authors have read and agreed to the published version of the manuscript.
Funding
This research was funded by National Natural Science Foundation of China (No. 41877236, 41972275 and 41572258).
Conflicts of Interest
The authors declare no competing interests.
Nomenclature
| D | Diameter of the specimen |
| L | Length of the specimen |
| N | Organic matter content |
| e | Void ratio |
| w | Water content |
| Gs | Specific gravity |
| Gsm | Specific gravity of inorganic solids |
| σc′ | Effective confining stress |
| σv′ | Vertical effective stress |
| U | Degree of consolidation |
| ∆Vc | Change in volume of the specimen |
| V0 | Original specimen volume |
| u | Excess pore pressure reading at time t |
| ui | Pore pressure at the start of the consolidation stage |
| uc | Pore pressure at the end of consolidation |
| ub | Back pressure at the start of the consolidation |
| Cv | Coefficient of consolidation |
| mv | Volume compressibility |
| kv | Coefficient of vertical permeability |
| p′ | Effective mean stress |
| q | Deviator stress |
| εa | Axial strain |
| εf | Failure axial strain |
| qf | Peak deviator stress |
| pf′ | Mean effective stress at the yield point |
| φ′ | Effective cohesion |
| c′ | Effective internal friction angle |
| Mc | Inclination of the yield line in q–p′ space |
| m | Vertical intercept of the yield line in q–p′ space |
| Su | Undrained shear strength qf/2 |
References
- Mesri, G.; Ajlouni, M. Engineering Properties of Fibrous Peats. J. Geotech. Geoenviron. Eng. 2007, 133, 850–866. [Google Scholar] [CrossRef]
- Dhowian, A.W.; Edil, T.B. Consolidation Behavior of Peats. Geotech. Test. J. 1980, 3, 105. [Google Scholar] [CrossRef]
- Mesri, G.; Stark, T.D.; Members, A.; Ajlouni, M.A.; Chen, C.S. Secondary compression of peat with or without surcharging. J. Geotech. Geoenviron. Eng. 1997, 123, 411–421. [Google Scholar] [CrossRef]
- O’Kelly, B.C. Compression and consolidation anisotropy of some soft soils. Geotech. Geol. Eng. 2006, 24, 1715–1728. [Google Scholar] [CrossRef]
- Gofar, N.; Sutejo, Y. Long term compression behavior of fibrous peat. Malays. J. Civ. Eng. 2007, 19, 104–116. [Google Scholar]
- Haan, E.D.; Feddema, A. Deformation and strength of embankments on soft Dutch soil. Proc. Inst. Civ. Eng. Geotech. Eng. 2013, 166, 239–252. [Google Scholar] [CrossRef]
- Sarkar, S.; Mukhopadhyay, A.; Mukherjee, I. A laboratory study on adsorption–desorption behavior of flupyradifurone in two Indian soils: Effect of soil properties and organic amendment. J. Soils Sediments 2022, 22, 2022–2035. [Google Scholar] [CrossRef]
- Skempton, A.W. The pore-pressure coefficients A and B. Géotechnique 1954, 4, 143–147. [Google Scholar] [CrossRef]
- ASTM D4767-11; Standard Test Method for Consolidated Undrained Triaxial Compression Test for Cohesive Soils. ASTM: West Conshohocken, PA, USA, 1995. [CrossRef]
- BS1377-8; Methods of Test for Soils for Civil Engineering Purposes. Shear Strength Tests (Effective Stress). British Standards Institution (BSI): London, UK, 1990.
- GB50021-2001; National Standard of the People’s Republic of China: Geotechnical Engineering Survey Specification: GB50021-2001. China Planning Press: Beijing, China, 2001.
- Shen, J.-H.; Hu, M.-J.; Wang, X.; Zhang, C.Y.; Xu, D.-S. SWCC of calcareous silty sand under different fines contents and dry densities. Front. Environ. Sci. 2021, 9, 682907. [Google Scholar] [CrossRef]
- Chen, X.; Shen, J.-H.; Wang, X.; Yao, T.; Xu, D.-S. Effect of saturation on shear behavior and particle breakage of coral sand. J. Mar. Sci. Eng. 2022, 10, 1280. [Google Scholar] [CrossRef]
- Couling, C.; Tolooiyan, A.; Mackay, R.; Xue, J. Measurement of Pore Water Pressure Properties of Unsaturated Brown Coal Using Triaxial Test; CRC Press: Boca Raton, FL, USA, 2014. [Google Scholar]
- Yang, M.; Liu, K. Deformation behaviors of peat with influence of organic matter. Springerplus 2016, 5, 573. [Google Scholar] [CrossRef] [PubMed]
- Liu, K.; Xue, J.; Yang, M. Deformation behaviour of geotechnical materials with gas bubbles and time dependent compressible organic matter. Eng. Geol. 2016, 213, 98–106. [Google Scholar] [CrossRef]
- Li, W.; O’Kelly, B.C.; Yang, M.; Fang, K. Compressibility behaviour and properties of peaty soils from Dian-Chi Lake area, China. Eng. Geol. 2020, 277, 105778. [Google Scholar] [CrossRef]
- Zhang, F.G.; Liu, K.; Yang, M. Study on Consolidation Behaviors of Peaty Soils Using a Viscoelastic Rheological-Consolidation Model in Kunming, China. KSCE J. Civ. Eng. 2020, 24, 752–761. [Google Scholar] [CrossRef]
- He, P.; Wang, W.; Xu, Z. Empirical correlations of compression index and swelling index for Shanghai clay. Geotech. Mech. 2018, 39, 3773–3782. (In Chinese) [Google Scholar] [CrossRef]
- Li, X.; Yang, M.; Li, W.; Shangguan, S.; Wan, J. Correlation between deformation index and initial void ratio of soft clay. J. Yangtze River Acad. Sci. 2022, 39, 104–110. (In Chinese) [Google Scholar] [CrossRef]
- O’Kelly, B.C.; Zhang, L. Consolidated-Drained Triaxial Compression Testing of Peat. Geotech. Test. J. 2013, 36, 20120053. [Google Scholar] [CrossRef]
- Hanrahan, E.T. An Investigation of Some Physical Properties of Peat. Géotechnique 1954, 4, 108–123. [Google Scholar] [CrossRef]
- Adams, J.I. The engineering behaviour of a Canadian Muskeg. In Proceedings of the 6th International Conference on Soil Mechanics and Foundation Engineering, Montreal, QC, Canada, 8–15 September 1965. [Google Scholar]
- Landva, A.O.; Rochelle, P.L. Compressibility and Shear Characteristics of Radforth Peats; Astm Special Technical Publication: West Conshohawken, PA, USA, 1983; pp. 157–191. [Google Scholar]
- Hendry, M.T.; Sharma, J.S.; Martin, C.D.; Barbour, S.L. Effect of fibre content and structure on anisotropic elastic stiffness and shear strength of peat. Can. Geotech. J. 2012, 49, 403–415. [Google Scholar] [CrossRef]
- Yamaguchi, H.; Yoshinori, O.; Kogure, k.; Mori, S. Undrained shear characteristics of normal consolidated peat under triaxial compression and extension conditions. Soil Found. 1985, 25, 1–18. [Google Scholar] [CrossRef]
- Edil, T.B.; Wang, X. Shear Strength and Ko of Peats and Organic Soils. In Geotechnics of High Water Content Materials; West Conshohocken: American Society for Testing and Materials; STM Special Technical Publication: Minneapolis, MN, USA, 2000. [Google Scholar]
- Hebib, S. Experimental Investigation on the Stabilisation of Irish Peat. Ph.D. Thesis, University of Dublin, Dublin, Ireland, 2001. [Google Scholar]
- Long, M. Review of peat strength, peat characterisation and constitutive modelling of peat with reference to landslides. Stud. Geotech. Mech. 2005, 27, 67–90. [Google Scholar]
- Dhowian, A.W. Consolidation Effects on Properties of Highly Compressive Soils-Peats. Ph.D. Thesis, The University at Madison, Madison, WI, USA, 1978. [Google Scholar]
- Yamaguchi, H.; Ohira, Y.; Kogure, K.; Mori, S. Deformation and strength properties of peat. In Proceedings of the Eleventh International Conference on Soil Mechanics and Foundation Engineering, San Francisco, CA, USA, 12–16 August 1985; Volume 11, pp. 985–991. [Google Scholar]
- Lechowicz, Z. An Evaluation of the Increase in Shear Strength of Organic Soils; International Workshop: Delft, The Netherlands, 1994. [Google Scholar]
- Li, W.; O’Kelly, B.C.; Fang, K.; Yang, M. Briefing: Water content determinations of peaty soils using the oven-drying method. Environ. Geotech. 2018, 9, 3–11. [Google Scholar] [CrossRef]
- Li, W.; O’Kelly, B.C.; Yang, M.; Fang, K.; Li, X.; Li, H. Briefing: Specific gravity of solids relationship with ignition loss for peaty soils. Geotech. Res. 2020, 7, 134–145. [Google Scholar] [CrossRef]
- Farrell, E.R. Chapter 35 Organics/Peat Soils; Thomas Telford: London, UK, 2012; pp. 463–479. [Google Scholar]
- O’Kelly, B.C.; Sivakumar, V. Water Content Determinations for Peat and Other Organic Soils Using the Oven-Drying Method. Dry. Technol. 2014, 32, 631–643. [Google Scholar] [CrossRef]
- BS1377; Methods of Test for Soils for Civil Engineering Purposes (Classification Tests). British Standards Institution: Milton Keynes, UK, 1990.
- O’Kelly, B.C. Accurate Determination of Moisture Content of Organic Soils Using the Oven Drying Method. Dry. Technol. 2004, 22, 1767–1776. [Google Scholar] [CrossRef]
- O’Kelly, B.C. Method to compare water content values determined on the basis of different oven-drying temperatures. Geotechnique 2005, 55, 329–332. [Google Scholar] [CrossRef]
- ASTM D2974; Standard Test Methods for Moisture, Ash, and Organic Matter of Peat and Other Organic Soils. ASTM International: West Conshohocken, PA, USA, 2014; American Society for Testing and Materials.
- ASTM D4531-15; Standard TEST methods for Bulk and Dry Density of Peat and Peat Products. ASTM: West Conshohocken, PA, USA, 2015. [CrossRef]
- West Conshohocken, PA, USA; Standard Test Methods for Specific Gravity of Soil Solids by Water Pycnometer. ASTM International: West Conshohocken, PA, USA, 2014.
- Black, D.K.; Lee, K.L. Saturating Laboratory Samples by Back Pressure. ASCE Soil Mech. Found. Div. J. 1973, 99, 75–93. [Google Scholar] [CrossRef]
- Ishihara, K.; Tatsuoka, F.; Yasuda, S. Undrained deformation and liquefaction of sand under cyclic stress. Soils Found. 1975, 15, 29–44. [Google Scholar] [CrossRef]
- Cola, S.; Cortellazzo, G. The Shear Strength Behavior of Two Peaty Soils. Geotech. Geol. Eng. 2005, 23, 679–695. [Google Scholar] [CrossRef]
- Badv, K.; Sayadian, T. An investigation into the geotechnical characteristics of Urmia peat. Iran. J. Sci. Technol.—Trans. Civ. Eng. 2012, 36, 167–180. [Google Scholar]
- Tillis, R.K.; Meyer, M.R.; Hultgren, E.M. Performance of Test Fill Constructed on Soft Peat. In Stability & Performance of Slopes & Embankments II; ASCE: Reston, VA, USA, 2010. [Google Scholar]
- Tsushima, M.; Miyakawa, I.; Iwasaki, T. Some investigations on shear strength of organic soil. Tsuchi-Kiso J. SoilMech Found. Eng. 1977, 235, 13–18. [Google Scholar]
- Tsushima, M.; Oikawa, H. Shear Strength and Dilatancy of Peat. J. Jpn. Soc. Soil Mech. Found. Eng. 1982, 22, 133–141. [Google Scholar] [CrossRef]
- Farrell, E.R.; Hebib, S. The Determination of the Geotechnical Parameters of Organic Soils. In Problematic Soils; Yanagisawa, E., Moroto, N., Mitachi, T., Eds.; Balkema: Rotterdam, The Netherlands, 1998. [Google Scholar]
- Tsushima, M. Method for Predicting In-Situ Undrained Strength of Highly Organic Soil Based on the Value of Suction and Unconfined Compression Strength. In Proceedings of the International Symposium on Problematic Soils, Sendai, Japan, 28–30 October 1998. [Google Scholar]
- Magnan, J.P. Construction on peat: State of the art in France. In Proceedings of the International Workshop on Advances in Understanding and Modeling the Mechanical Behavior of Peat, Delft, The Netherlands, 16–18 June 1993. [Google Scholar]
- Ulusay, R.; Tuncay, E.; Hasancebi, N. Geo-engineering properties and settlement of peaty soils at an industrial site (Turkey). Bull. Eng. Geol. Environ. 2010, 69, 397–410. [Google Scholar] [CrossRef]
- Hendry, M.T.; Barbour, S.L.; Martin, C.D. Evaluating the Effect of Fiber Reinforcement on the Anisotropic Undrained Stiffness and Strength of Peat. J. Geotech. Geoenviron. Eng. 2014, 140, 04014054. [Google Scholar] [CrossRef]
- Kanmuri, H.; Kato, M.; Suzuki, O.; Hirose, E. Shear Strength of Ko Consolidated Undrained Peat. In Problematic Soil; Balkema: Rotterdam, The Netherlands, 1998. [Google Scholar]
- Adams, J.I. Laboratory Compression Test on Peat; Ontario Hydro Research News: Toronto, ON, Canada, 1962; pp. 35–40. [Google Scholar]
- Hu, Y. Equivalent Timeline Shear Rheological Model of Soft Soil. J. Harbin Inst. Technol. 2018, 50, 84–90. [Google Scholar]
- Ladd, C.C. Stability Evaluation during Staged Construction. J. Geotech. Eng. 1991, 117, 540–615. [Google Scholar] [CrossRef]
- Terzaghi, K.; Peck, R.B.; Mesri, G. Soil Mechanics in Engineering Practice. Soil Sci. Soc. Am. J. 1996, 68, 149–150. [Google Scholar]


Publisher’s Note: MDPI stays neutral with regard to jurisdictional claims in published maps and institutional affiliations. |
© 2022 by the authors. Licensee MDPI, Basel, Switzerland. This article is an open access article distributed under the terms and conditions of the Creative Commons Attribution (CC BY) license (https://creativecommons.org/licenses/by/4.0/).