Abstract
The melting process of paraffin wax placed in storage capsules of different shapes was experimentally and numerically studied. The phase change material (PCM) was initially at 27 °C. The effect of the mushy zone parameter (Amush) value on the melting process of the PCM was studied with storage capsules of different shapes (circular, vertical oval, and horizontal oval). The results of the numerical model were validated with the experimental results to obtain the optimum Amush value for each shape of the latent heat storage unit. The results showed that the value of the Amush has a great impact on the numerical results of the PCM melting process and changes with the shape of the storage capsule. The rate of heat transfer, convection, and fluid velocity all decrease as the Amush value rises. The experimental results of the circular, vertical oval, and horizontal oval capsules match very well with the numerical model with Amush values equal to 2 × 10⁶, 1 × 10⁵, and 1 × 10⁶, respectively.
1. Introduction
Energy can be stored in several forms, such as sensible, latent, and thermochemical heat storage. Phase change materials (PCMs) are used in latent heat energy storage (LHES) systems, which have more desirable characteristics than conventional heat storage systems. PCMs offer a number of beneficial characteristics, including the ability to be used as a heat source at a constant temperature, with only slight temperature fluctuations through heat recovery. They possess a low vapour pressure at operating temperature, chemical stability, non-corrosion, and a high energy density with small storage space requirements [1]. Thus, PCMs demonstrate one of the best techniques used in thermal energy storage applications [2,3]. They are used in several engineering applications, for example, the technology of electronic cooling, waste heat recovery systems [4,5], solar cell systems [6], absorption systems [7], ventilation, and air conditioning (HVAC) systems [8].
1.1. Numerical Techniques Limitations
The numerical modeling of thermal energy storage (TES) systems has recently received a great deal of interest. Although the most appropriate numerical techniques can vary greatly depending on the system, cost and time restrictions are virtually always the driving forces behind their employment. Numerical models are now increasingly necessary to accurately explain the behaviour of TES systems, enabling computational tools to assist in the solution of governing equations. As a result, a significant portion of the research on this topic shows the development of adequate numerical analysis [9]. The heat transfer mechanism through the melting process is initially controlled by conduction; then, natural convection begins, and this process of natural convection has a great impact and cannot be ignored [10,11].
Different modeling approaches for the solid–liquid phase change have been developed in recent decades. The most widely used methodology for numerically simulating the phase change phenomenon in several types of research is the enthalpy-porosity technique [12,13]. The other approaches to doing the same thing depend on varying the PCM’s specific heat during the phase transition temperature [14]. The enthalpy-porosity approach can be used in all forms of the melting process, whereas the other methods are more suited to phase changes that are dominated by conduction [15]. The coupled convection–diffusion phase transition was numerically studied using the enthalpy-porosity technique [16]. This approach avoids directly following the solid–liquid contact. With appropriate momentum sink factors added to momentum equations, the solid–liquid mushy zone is viewed as a porous zone with a quantity denoted as a liquid fraction as its “porosity,” which is the reason for the pressure reduction as the resulting solid material comes into existence.
1.2. Mushy Zone Effect
The thin mushy zone that divides the areas occupied by the solid and liquid PCMs contains a parameter known as the mushy zone constant that measures the resistance to the flow of liquid PCMs in this region. The literature demonstrates that the value of this constant affects simulation outcomes [17,18,19], and that the best value for agreement with experiments varies depending on the situation [18,20]. The cell porosity, which is calculated using the cell enthalpy, is a non-linear function of this parameter. Thus, the parameter was designed in such a way that it would be zero for entirely liquid cells and have no effect, while it would be in the same order as the other transport terms for cells going through a phase transition. The parameter’s value would be high enough for totally solid cells to essentially push any velocity prediction to zero. The parameter also contains a constant known as the mushy zone parameter, Amush, which captures the impact of the shape of the mushy zone [15].
The mushy zone is considered to be a semi-solid that exists at the boundary between the melted and un-melted portion of a PCM through the melting or freezing process. The amplitude of the damping is measured by the mushy zone parameter Amush; the higher this value, the steeper the transition of the velocity of the material to zero as it solidifies. The predicted solution might oscillate at very high values of Amush [21]. The overall phase transition process and the degree of phase interaction are both greatly influenced by the value of Amush. However, the Amush value may vary depending on the substance. For Rubitherm RT82, the value of Amush ranges from 1 × 10⁵ [22] to 1.6 × 10⁶ [23] whereas for gallium it ranges from 1 × 10⁵ to 1 × 10¹⁵ [24,25]. Several studies have found a correlation between the value of Amush and the solid particle diameters within the mushy zone constant [26,27]. Thus, the choice of mushy zone constant becomes very important as the behaviour predicted using the enthalpy-porosity technique for the same material can differ significantly at different values of Amush.
In previous studies, the Amush value was studied for different types of phase change materials and it was observed that this value has a great impact on the melting process results of the numerical model. In the present work, the effect of the Amush value on the PCM melting process was studied with different shapes of storage capsules (circular, horizontal oval, and vertical oval), which are filled with paraffin wax, which has not been previously studied. The melting process of the PCM was experimentally and numerically investigated in a circular, horizontal, and vertical oval storage units. The results that were obtained from the numerical model were validated with the experimental results to obtain the optimum value of Amush for each shape of the latent heat storage unit.
The effects of Amush through the storage units of circular, vertical oval, and horizontal oval capsules have not been previously studied. However, it can be used in energy-saving building applications.
2. Experimental Setup and Procedures
An image of the test rig is shown in Figure 1, while the layout is shown in Figure 2. The test rig consists of the water tank (10), which is made of galvanized sheet with a diameter of 40 cm and a height of 40 cm. The tank is used to supply the test section with hot water (11) at a constant temperature value. The tank is insulated with glass wool insulation to decrease the heat lost from hot water in the tank. The tank is equipped with a 1 kW electric heater (12) connected to the electrical main supply with a TROIDC type electric transformer (13). The electric transformer provides a voltage variation from 0 to 220 V to adjust the water temperature in the tank at a predefined temperature. The tank is equipped with a small 100-Watt water pump (8) connected to the tank bottom via an inlet connection (4) to supply the test section with the required hot water. The hot water is used to heat the capsule at different velocities using a supply valve (5) which regulates the water discharge rate to the test section (1). The valve (7) is used to bypass the excess water from the pump to the tank via a bypass connection (6), to prevent the pump from overheating.
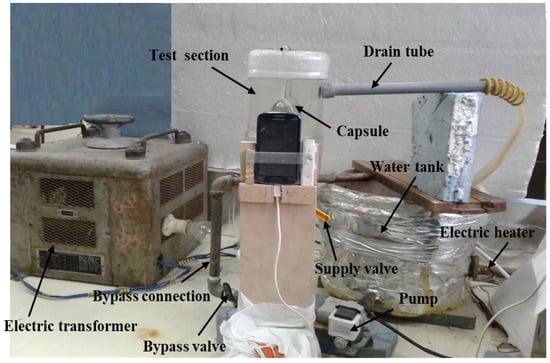
Figure 1.
Photography of the experimental setup.
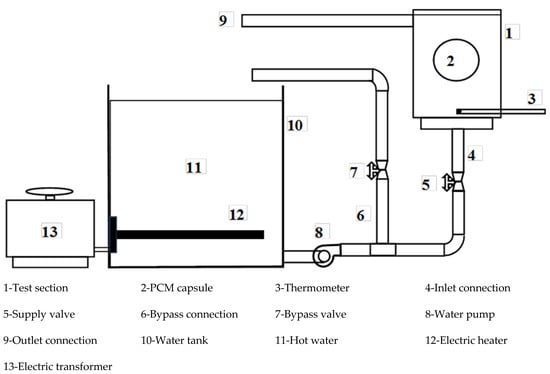
Figure 2.
Schematic representation of the experimental setup.
The test section (1) is a rectangular cross-section channel of 8 cm by 10 cm, and 15 cm in height. Hot water is brought to it via a ½-inch diameter pipe (4) connected to the bottom of the channel through the pump (8). To drain the water into the hot water tank, a hole of ½ inch diameter is used and a tube (9) of the same diameter is connected to one side near the top of the channel to return the water to the hot water tank. The inlet water temperature is measured using the thermometer (3). The capsule (2) filled with PCM is placed in a horizontal position using a 1 mm diameter wire carrier.
Two Pyrex glass capsules are used, as seen in Figure 3; one has a circular cross-section with a 4 cm diameter and 6 cm length. The second capsule has an elliptical cross-section, the axes of which have dimensions of 6.2 and 2.6 cm. The two capsules are filled with the molten paraffin, then left to cool and closed with the resulting solid paraffin. The PCM thermophysical properties are represented in Table 1.
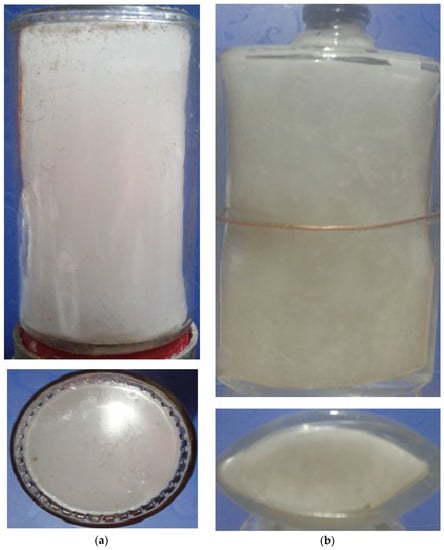
Figure 3.
Photos of experimental capsules for (a) circular and (b) elliptical cross-section.

Table 1.
PCM thermophysical properties.
To facilitate the viewing and imaging of the capsule, the test section was made from Pyrex glass. In order to measure the average temperature of the water before interring the channel, a thermometer (3) was fixed inside the channel (1). The rate of hot water passing through the test section was measured by the amount of water collected at a given time during the experiment.
Khot et al., [28] observed that the use of thermocouples inside the PCM capsule restricted the solid PCM from sinking to the bottom of the spherical capsule. Therefore, the unconstrained PCM melted faster than the constrained one. Based on the previous study, the experimental investigation was made to validate the results obtained by the Ansys Fluent software wherein there is no thermocouple embedded inside the capsules to measure the temperature distribution inside it. The image processing technique for the experimental liquid fraction photos was used to detect the value of the PCM liquid fraction.
3. Experimental Measurements
First of all, we checked the system against leakage by turning on the pump and monitoring the system connections. Then, we measured the flow rate of water and adjusted the two valves (5 and 7) to reach the predetermined mean velocity of the water. After that, we regulated the electric transformer to vary the voltage supplied to the electric heater and let the system work, monitoring the reading of the thermometer until reaching the wanted temperature of hot water interring the test section. After reaching the suggested temperature, we turned the circular cross-section PCM capsule in place inside the channel, into a horizontal position. We took photos of the capsule cross-section every five minutes until the total melting of the PCM. Finally, we repeated the previous steps for the capsule of the elliptical cross-section on its largest axes, vertical and horizontal, one at a time to investigate the two radii ratios.
The cross-section area of the elliptical cross-section can be calculated as:
where a is half the smallest axis and b is half of the largest axis of the ellipse as shown in Figure 4.
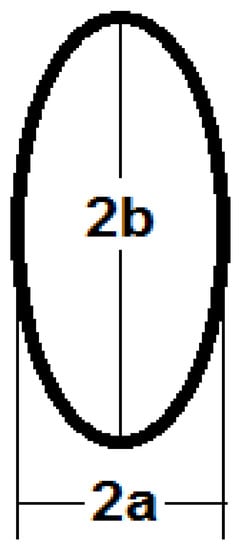
Figure 4.
The main axes of the elliptical cross-section.
The surface area of the elliptical cross-section capsule can be calculated as:
where l is the cylinder length and C is its perimeter.
The more accurate perimeter of the elliptical cross-section as a function of its axes using the Ramanujan second approximation [29] can be calculated as shown in the following equation:
Two positions of the elliptical cross-section are discussed. The first position is a vertical oval with an axes ratio of Ar = 0.383, and the second position is a horizontal oval with an axes ratio of Ar = 2.6.
4. Uncertainty Analysis
Calculation and measurement errors resulting from human and instrumental errors are presented. Repeating measurements several times can help eliminate or reduce individual errors. As demonstrated in Table 2, the instrumental errors are due to the accuracy of the measuring devices. Based on the uncertainty of the primary measurements, the uncertainty of the computation results was calculated.
Table 2.
Measurement device errors.
Error propagation is estimated by using the root sum square method. Given the specific result Z, as follows:
where xi is independently measured quantity, the uncertainty ωi is the uncertainty of independent variables, and the uncertainty in the result, Z is assumed as follows:
5. Numerical Modeling
The Boussinesq approximation, which incorporates thermal buoyancy, represents the liquid PCM density difference in the buoyancy term. As a result, the 2D transient laminar flow containing buoyancy-driven conventional governing equations can be expressed by the following equations [11]:
Continuity equation:
Momentum equations:
Momentum r:
Momentum θ:
The parameters s are Darcy’s law damping terms added to the momentum equation as a convective phase change effect. These terms depend on both the existing constant Amush and a liquid fraction (λ), which can be expressed as follows:
The minor number γ is used to avoid division by zero, and it is naturally about 10−3. The mushy zone constant Amush explains how steeply its velocity is condensed to zero when the material solidifies. Its value depends on the morphology of the medium. This value is frequently high and typically runs from 104 to 108. The same occurred when the local liquid fraction becomes high, and the velocity is reduced to zero. Numerous academics advise taking into account the Amush value of 106 as the best value. This value offers a good agreement between their experimental and numerical results [30]. In this study, Amush varies throughout the whole simulation, where it attains the best conformity between the experimental and numerical results.
Energy equation:
where H is the enthalpy of the PCM and is estimated as the summation of the sensible enthalpy, , and the latent heat ΔH:
where is the enthalpy reference at temperature reference and latent heat term can be expressed in the form of the latent heat of the PCMs (L) as follows:
where ΔH can vary from zero (solid) to L (liquid). Therefore, the liquid fraction λ can be articulated as follows:
where is the PCM melting temperature, and ∆Tm is the range between liquid and solid phase, which is expressed as the difference between liquidus temperature and solidus temperature, as demonstrated in Equation (14):
The PCM density and thermal conductivity depend on the phase change process as follows:
5.1. Initial and Boundary Conditions
The previous governing equations were solved together with the following initial and boundary conditions. Initially, the system was at the ambient temperature of 27 °C, and the storage capsules were filled with solid paraffin wax, which was at a temperature lower than the melting point. The outer side of the tank was insulated; in addition, the inlet of the hot water was defined as the velocity inlet and the outlet of the hot water was defined as the pressure outlet, as shown in Figure 5.
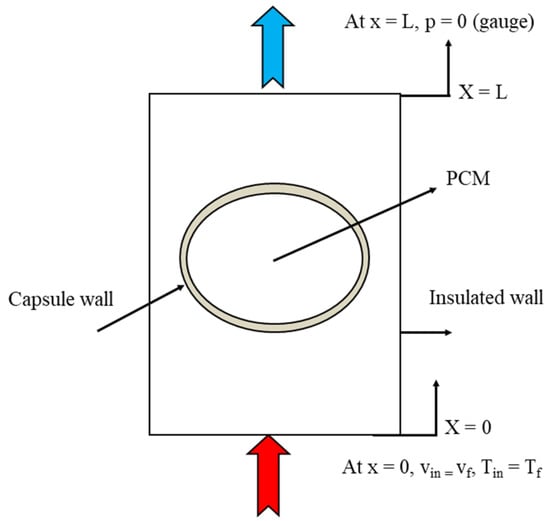
Figure 5.
Test section with boundary conditions.
5.2. Numerical Procedure and Validation
The numerical simulation was established using the ANSYS 2022 R2 program. The Semi-Implicit Method for the Pressure-Linked Equations (SIMPLE) scheme was used to calculate the pressure–velocity coupling equations in the PCM. A control volume approach was used to explain the governing equations in conjunction with the boundary and initial conditions. The diffusion and convection terms are described using the central difference and QUICK techniques, respectively. The pressure–velocity coupling was handled using the SIMPLER algorithm. By solving the governing equations at each time step, the liquid fraction could be changed using Equation (13). After carefully evaluating the independence of the results for high accuracy, the size of the grid and the time steps were selected. The calculation process continued until a relative convergence criterion of 10−6 was satisfied by all the present case variables.
To validate the numerical model of melting in the present finite volume computational fluid dynamic (CFD) code, an initial run was established and compared to the experimental results of Soliman et al. [10,11] for a vertical cylinder that was heated by a constant heat flux, and Kamkari and Amlashi [31] for a vertical enclosure that was heated by a constant wall temperature. The computational model and the experimental study were established under the same operating conditions. Figure 6 displays the PCM temperature and liquid fractions, with the melting time for the experimental results of [11,31], respectively, with the present numerical results. As can be noted from the figure, the numerical results are in good agreement with the experimental results.
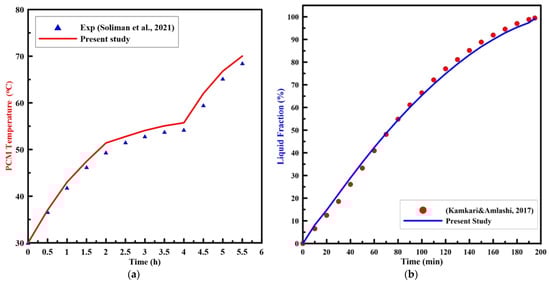
Figure 6.
Experimental results of PCM (a) temperature [11], and (b) liquid fraction [31] vs. time with the present numerical study.
5.3. Mesh Dependency Study
Free triangular mesh has been adapted in the numerical model. In order to test the dependency of numerical results on the mesh element size, a simulation was run with a circular capsule of 4 cm in diameter and 6 cm in length. The capsule was initially at 300 K. At any time, t > 0, the boundary of the capsule was at 340 K. The average temperature and liquid fraction of the PCM for the circular capsule were compared for different numbers of elements size (20,062, 32,634, 45,409, 68,312, and 87,472) as shown in Figure 7a,b. It is observed from the figure that there is a slight difference between the number of elements 68,312 and 87,472. Therefore, the number of elements equal to 68,312 is selected for the present study to save time. Similarly, a grid independency test has also been carried out for other configurations. The time steps used in the analysis is 0.3 sec throughout all models.
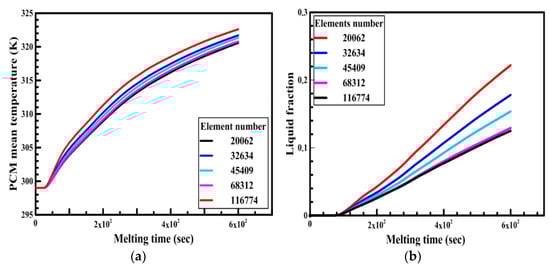
Figure 7.
Effect of elements size number on the PCM (a) temperature and (b) liquid fraction.
6. Results and Discussion
In this section, firstly, a comparison between the experimental results of different shapes of storage capsules (circular, horizontal oval, and vertical oval) is established with the theoretical results of the same shape and dimensions from the numerical model. Table 3, Table 4 and Table 5 illustrate the variation of the liquid fraction contours of the PCM melting process with the photos captured during the experiments.
Table 3.
Comparison between liquid fraction contours and camera photos for circular cross-section capsule.
Table 4.
Comparison between liquid fraction contours and camera photos for circular cross-section capsule of Ar = 0.383.
Table 5.
Comparison between liquid fraction contours and camera photos for circular cross-section capsule of Ar = 2.6.
Secondly, the effect of the mushy zone parameter on the PCM melting process is studied and validated with the experimental results to obtain the optimum value of Amush for each shape. Figure 8, Figure 9 and Figure 10 illustrate the PCM liquid fraction with the melting time of the experimental result and the numerical results with different values of the mushy zone parameter.
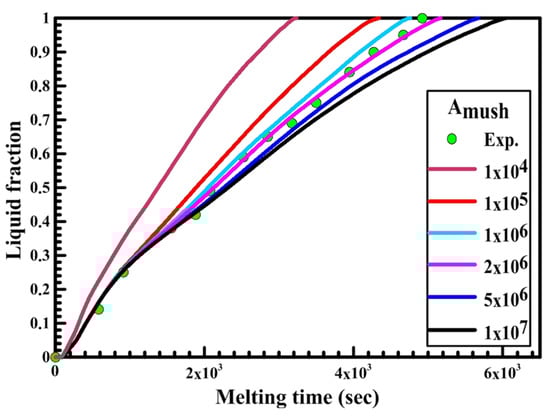
Figure 8.
Experimental and numerical liquid fraction vs. time for a circular capsule.
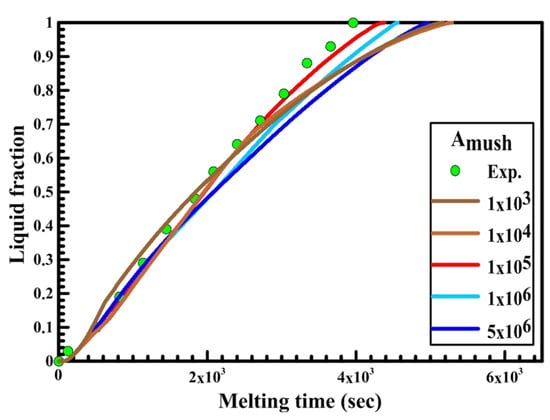
Figure 9.
Experimental and numerical liquid fraction vs. time for a vertical oval capsule.
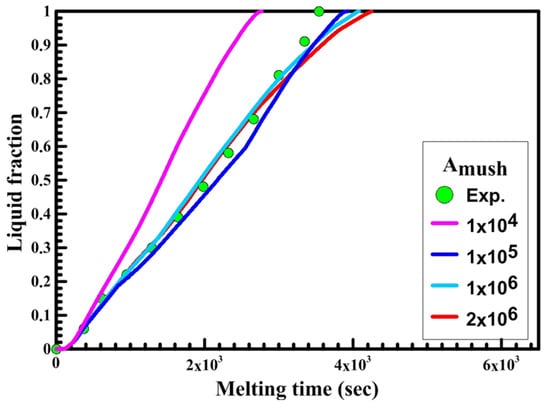
Figure 10.
Experimental and numerical liquid fraction vs. time for a horizontal oval capsule.
Table 3 represents the comparison between the liquid fraction contours of a circular capsule with the experimental photos. The circular cross-section capsule is 4 cm in diameter (axes ratio of 1) and 6 cm in length for heat transfer fluid (HTF) initial temperature of 340 K and a velocity of 0.003 m/s. Within the experimental photos, the white part is a solid PCM and the transparent part is a liquid PCM. Within the numerical contours, the blue color signifies the solid PCM and the red color denotes the liquid PCM. The solid PCM sinks to the bottom of the capsule due to the force of gravity for both the numerical and experimental results. The experimental total melting time is less than that of the theoretical one by 2 min.
Table 4 represents the comparison between the liquid fraction contours of the elliptical cross-section capsule with the experimental photos. The elliptical cross-section capsule is in a vertical position with an axes ratio of 0.383 for the HTF initial temperature of 340 K and a velocity of 0.003 m/s. The experimental total melting time is less than that of the theoretical one by 1 min.
Table 5 represents the comparison between the liquid fraction contours of the elliptical cross-section capsule with the experimental photos. The elliptical cross-section capsule is in a horizontal position with an axes ratio of 2.6 for the HTF initial temperature of 340 K and a velocity of 0.003 m/s. The experimental total melting time is less than that of the theoretical one by 2 min.
It is demonstrated in the figures that there is a fair agreement between the experimental and theoretical results and the shape of molten and solid paraffin. The fair agreement between experimental and theoretical results ensures the validity of the theoretical model and the accuracy of the different thermal properties of the paraffin wax.
The experimental investigation was made to validate the results obtained by the Ansys Fluent software. Khot et al. [28] observed that using the thermocouples inside the PCM throughout the melting process restricted the solid PCM from moving, which affected the melting process. Therefore, there is no thermocouple embedded inside the circular and oval capsules to measure the temperature distribution inside it. The experimental results of the liquid fraction are calculated using the image processing method, which enables the determination of the percentage of the solid “white color” and the liquid “gray color”.
Figure 8 shows the relation between liquid fraction and time for both experimental and numerical results for a circular capsule at the HTF inlet temperature of 340 K and a velocity of 0.003 m/s. The numerical results are obtained with different values of Amush (1 × 10⁴, 1 × 10⁵, 2 × 10⁶, 5 × 10⁶, 1 × 10⁷). It is observed from the figure that the melting rate of the numerical results is slow at Amush = 1 × 10⁷, while at Amush = 1 × 10⁴ the melting rate of the numerical results increases, and its value is greater than the experimental results.
The previous phenomena are due to the great effect of Amush on the convection effect. Increasing the Amush value leads to a reduction in the convection effect and the melting rate. For the circular capsule, the experimental results have a good agreement with the numerical results at the value of Amush equal to 2 × 10⁶.
Figure 9 displays the relation between liquid fraction and time for both experimental and numerical results for a vertical oval capsule at the HTF inlet temperature of 340 K and a velocity of 0.003 m/s. The numerical results are obtained with different numbers of Amush (1 × 10⁴, 1 × 10⁵, 1 × 10⁶, 5 × 10⁶). It can be observed from the figure that the melting rate of the numerical results is slow at Amush = 5 × 10⁶, while at Amush = 1 × 10⁶, and 5 × 10⁶ the melting rate of the numerical results is close to the experimental results. For the vertical oval capsule, the experimental results have a good agreement with the numerical results at the value of Amush equal to 1 × 10⁵.
Figure 10 illustrates the relation between liquid fraction and time for both experimental and numerical results for a horizontal oval capsule at HTF inlet temperature of 340 K and a velocity of 0.003 m/s. The numerical results are obtained with different numbers of Amush (1 × 10⁴, 1 × 10⁵, 1 × 10⁶, 2 × 10⁶).
It can be observed from Figure 10 that the melting rate of the numerical results increases and its value is greater than the experimental results at Amush = 1 × 10⁴, while at Amush = 1 × 10⁶ and 2 × 10⁶, the melting rate of the numerical results is close to the experimental results. For the horizontal oval capsule, the experimental results have a good agreement with the numerical results at the value of Amush equal to 1 × 10⁶.
From the present study, it can be observed that the mushy zone parameter (Amush) has a great impact on the numerical model results of the PCM melting process and changes with the shape of the storage unit. The present study provides a range of the mushy zone parameter for the numerical modeling of the melting process in the circular, horizontal oval, and vertical oval capsules in future work to obtain more accurate results. Table 6 represents the optimum number of the mushy zone parameter for circular, vertical oval, and horizontal oval capsules.
Table 6.
Optimum number of the mushy zone parameter for circular, vertical oval, and horizontal oval capsules.
7. Conclusions
The melting process of a phase change material (PCM) was experimentally and numerically investigated in storage capsules of different shapes (circular, vertical oval, and horizontal oval). The numerical model was established to study the effect of the Amush (mushy zone parameter) on the thermal performance of the PCM melting process. The model was validated with previous related work, and the results exhibited good agreement. The results of the numerical model were validated with the experimental results to obtain the optimum value of Amush for each shape of the latent heat storage unit. According to the present experimental/numerical results of the PCM melting process inside different capsules, the following conclusions can be drawn:
- The value of Amush has a great impact on the numerical model results of the PCM melting process and changes with the shape of the storage unit;
- The rate of heat transfer, convection, and fluid velocity all decrease as the value of Amush rises;
- The experimental results of the circular, vertical oval, and horizontal oval capsules match well with the numerical model at the value of Amush equal to 2 × 10⁶, 1 × 10⁵, and 1 × 10⁶, respectively.
The effect of nanoparticles on the mushy zone parameter should be taken into account in future research due to their great effect upon the enhancement of the pelting process.
Author Contributions
Credit author statement A.S.S.: idea, methodology, writing the original draft, writing the initial draft, and preparing literature survey, validation. A.A.S.: computer programming, writing the initial draft, writing, reviewing, editing, and supervision. M.A.S.: computer programming, writing the initial draft, writing, reviewing, and editing. All authors have read and agreed to the published version of the manuscript.
Funding
The publication fees of this article have been supported by Mansoura University.
Institutional Review Board Statement
Not applicable.
Acknowledgments
The author would like to gratefully acknowledge the support of Mansoura University, Egypt, on the development of this research by providing access to their facility.
Conflicts of Interest
The authors declare no conflict of interest.
References
- Hosseini, M.J.; Ranjbar, A.A.; Sedighi, K.; Rahimi, M. A Combined Experimental and Computational Study on the Melting Behavior of a Medium Temperature Phase Change Storage Material inside Shell and Tube Heat Exchanger. Int. Commun. Heat Mass Transf. 2012, 39, 1416–1424. [Google Scholar] [CrossRef]
- Guerraiche, D.; Bougriou, C.; Guerraiche, K.; Valenzuela, L.; Driss, Z. Experimental and Numerical Study of a Solar Collector Using Phase Change Material as Heat Storage. J. Energy Storage 2020, 27, 101133. [Google Scholar] [CrossRef]
- Haghighi, A.; Babapoor, A.; Azizi, M.; Javanshir, Z.; Ghasemzade, H. Optimization of the Thermal Performance of PCM Nanocomposites. J. Energy Manag. Technol. 2019, 4, 14–19. [Google Scholar]
- Soliman, A.S.; Zhu, S.; Xu, L.; Dong, J.; Cheng, P. Efficient Waste Heat Recovery System for Diesel Engines Using Nano-Enhanced Phase Change Materials. Case Stud. Therm. Eng. 2021, 28, 101309. [Google Scholar] [CrossRef]
- Soliman, A.S.; Radwan, A.; Xu, L.; Dong, J.; Cheng, P. Energy Harvesting in Diesel Engines to Avoid Cold Start-up Using Phase Change Materials. Case Stud. Therm. Eng. 2022, 31, 101807. [Google Scholar] [CrossRef]
- Soliman, A.S.; Xu, L.; Dong, J.; Cheng, P. A Novel Heat Sink for Cooling Photovoltaic Systems Using Convex/Concave Dimples and Multiple PCMs. Appl. Therm. Eng. 2022, 215, 119001. [Google Scholar] [CrossRef]
- Soliman, A.S.; Zhu, S.; Xu, L.; Dong, J.; Cheng, P. Design of an H2O-LiBr Absorption System Using PCMs and Powered by Automotive Exhaust Gas. Appl. Therm. Eng. 2021, 191, 116881. [Google Scholar] [CrossRef]
- Dhaidan, N.S.; Khodadadi, J.M. Melting and Convection of Phase Change Materials in Different Shape Containers: A Review. Renew. Sustain. Energy Rev. 2015, 43, 449–477. [Google Scholar] [CrossRef]
- Fadl, M.; Eames, P.C. Numerical Investigation of the Influence of Mushy Zone Parameter Amush on Heat Transfer Characteristics in Vertically and Horizontally Oriented Thermal Energy Storage Systems. Appl. Therm. Eng. 2019, 151, 90–99. [Google Scholar] [CrossRef]
- Soliman, A.S.; Zhu, S.; Xu, L.; Dong, J.; Cheng, P. Melting Enhancement of Nano-Phase Change Material in Cylindrical Enclosure Using Convex/Concave Dimples: Numerical Simulation with Experimental Validation. J. Energy Storage 2021, 44, 103470. [Google Scholar] [CrossRef]
- Soliman, A.S.; Zhu, S.; Xu, L.; Dong, J.; Cheng, P. Numerical Simulation and Experimental Verification of Constrained Melting of Phase Change Material in Cylindrical Enclosure Subjected to a Constant Heat Flux. J. Energy Storage 2021, 35, 102312. [Google Scholar] [CrossRef]
- Voller, V.R.; Cross, M.; Markatos, N.C. An Enthalpy Method for Convection/Diffusion Phase Change. Int. J. Numer. Methods Eng. 1987, 24, 271–284. [Google Scholar] [CrossRef]
- Voller, V.R.; Prakash, C. A Fixed Grid Numerical Modeling Methodology for Convection-Diffusion Mushy Region Phase-Change Problems. Int. J. Heat Mass Transf. 1987, 30, 1709–1719. [Google Scholar] [CrossRef]
- Ehms, J.H.N.; de Césaro Oliveski, R.; Rocha, L.A.O.; Biserni, C.; Garai, M. Fixed Grid Numerical Models for Solidification and Melting of Phase Change Materials (PCMs). Appl. Sci. 2019, 9, 4334. [Google Scholar]
- Singh, V.K.; Patel, A. Effect of Mushy Zone Constant on the Melting of a Solid-Liquid PCM under Hyper-Gravity Conditions. Int. Commun. Heat Mass Transf. 2022, 134, 105993. [Google Scholar] [CrossRef]
- Brent, A.D.; Voller, V.R.; Reid, K.J. Enthalpy-Porosity Technique for Modeling Convection-Diffusion Phase Change: Application to the Melting of a Pure Metal. Numer. Heat Transf. 1988, 5720, 297–318. [Google Scholar]
- Kumar, M.; Krishna, D.J. Influence of Mushy Zone Constant on Thermohydraulics of a PCM. Energy Procedia 2017, 109, 314–321. [Google Scholar] [CrossRef]
- Shmueli, H.; Ziskind, G.; Letan, R. Melting in a Vertical Cylindrical Tube: Numerical Investigation and Comparison with Experiments. Int. J. Heat Mass Transf. 2010, 53, 4082–4091. [Google Scholar] [CrossRef]
- Arena, S.; Casti, E.; Gasia, J.; Cabeza, L.F.; Cau, G. Numerical Simulation of a Finned-Tube LHTES System: Influence of the Mushy Zone Constant on the Phase Change Behaviour. Energy Procedia 2017, 126, 517–524. [Google Scholar] [CrossRef]
- Hosseinizadeh, S.F.; Rabienataj Darzi, A.A.; Tan, F.L.; Khodadadi, J.M. Unconstrained Melting inside a Sphere. Int. J. Therm. Sci. 2013, 63, 55–64. [Google Scholar] [CrossRef]
- Ansys. “Ansys Fluent 12.0 User’s Guide.” Fluent Documentation; Ansys: Canonsburg, PA, USA, 2009. [Google Scholar]
- Abdulateef, A.M.; Abdulateef, J.; Mat, S.; Sopian, K.; Elhub, B.; Mussa, M.A. Experimental and Numerical Study of Solidifying Phase-Change Material in a Triplex-Tube Heat Exchanger with Longitudinal/Triangular Fins. Int. Commun. Heat Mass Transf. 2018, 90, 73–84. [Google Scholar] [CrossRef]
- Nithyanandam, K.; Pitchumani, R. Computational Modeling of Dynamic Response of a Latent Thermal Energy Storage System with Embedded Heat Pipes. J. Sol. Energy Eng. Trans. ASME 2014, 136, 011010. [Google Scholar] [CrossRef]
- Yang, X.H.; Tan, S.C.; Liu, J. Numerical Investigation of the Phase Change Process of Low Melting Point Metal. Int. J. Heat Mass Transf. 2016, 100, 899–907. [Google Scholar] [CrossRef]
- Kousksou, T.; Mahdaoui, M.; Ahmed, A.; Msaad, A.A. Melting over a Wavy Surface in a Rectangular Cavity Heated from Below. Energy 2014, 64, 212–219. [Google Scholar] [CrossRef]
- Tabassum, T.; Hasan, M.; Begum, L. 2-D Numerical Investigation of Melting of an Impure PCM in the Arbitrary-Shaped Annuli. Int. J. Therm. Sci. 2017, 114, 296–319. [Google Scholar] [CrossRef]
- Libeer, W.; Ramos, F.; Newton, C.; Alipanahrostami, M.; Depcik, C.; Li, X. Two-Phase Heat and Mass Transfer of Phase Change Materials in Thermal Management Systems. Int. J. Heat Mass Transf. 2016, 100, 215–223. [Google Scholar] [CrossRef]
- Khot, S.A.; Sane, N.K.; Gawali, B.S. Experimental Investigation of Phase Change Phenomena of Paraffin Wax inside a Capsule. Int. J. Eng. Trends Technol. 2011, 2, 67–71. [Google Scholar]
- Villarino, M.B. Ramanujan’s Perimeter of an Ellipse. arXiv 2005, arXiv:0506384. [Google Scholar]
- Emam, M.; Ahmed, M. Cooling Concentrator Photovoltaic Systems Using Various Configurations of Phase-Change Material Heat Sinks. Energy Convers. Manag. 2018, 158, 298–314. [Google Scholar] [CrossRef]
- Kamkari, B.; Amlashi, H.J. Numerical Simulation and Experimental Verification of Constrained Melting of Phase Change Material in Inclined Rectangular Enclosures. Int. Commun. Heat Mass Transf. 2017, 88, 211–219. [Google Scholar] [CrossRef]


Publisher’s Note: MDPI stays neutral with regard to jurisdictional claims in published maps and institutional affiliations. |
© 2022 by the authors. Licensee MDPI, Basel, Switzerland. This article is an open access article distributed under the terms and conditions of the Creative Commons Attribution (CC BY) license (https://creativecommons.org/licenses/by/4.0/).