Abstract
The purpose of this article was to investigate the influence of uncertain soil parameters on slope stability problems using the probability method. The most important soil instability is probably the inherent spatial variability of soil properties and its influence on slope safety factors. The probability method is recognized for its validity both in practice and academic research. This method of geotechnical risk management involves uncertain parameters. In this study, randomly selected uncertain parameters were combined with traditional analysis using Bishop’s simple methodology and Monte Carlo simulation. The minimum safety factor and critical slip surface of the slope stability were analyzed by Bishop’s simple method. The influence of uncertain soil parameters was analyzed by the back analysis method with Monte Carlo simulation. The calculation was controlled by a critical slip surface, and the safety factor was equal to 1. The results of the analysis show the minimum safety factor and the significant slippery surface of slope stability with the original soil strength parameters. The new soil strength parameters were recommended by Monte Carlo simulation that was used for improving the soil strength parameters in construction. In addition, probability analysis can identify an insufficient understanding of groundwater level distribution and that the assumption of a uniform distribution increases the probability of failure. Governments can use the results of water level analysis in flood warnings and flood management projects to reduce risks to life and property.
1. Introduction
Slope stability analysis has been undertaken in many geotechnical structures, including dams, road embankments, and structures built on slopes [1,2,3]. Slope stability analysis is a risk assessment and mitigation process for the safe design of man-made or natural slopes (e.g., embankments, road cuts, landfills, etc.) with equilibrium conditions. Furthermore, slope stability analysis is to contribute to the safe and economic design of the geotechnical structure. Conventional slope stability analysis methods can be divided into three groups: kinetic analysis, limited balance analysis, and rock fall simulation [4]. Slope stability analysis presents the movement of the slope that results in landslides as well as detecting the unstable slippery surfaces that can cause slope failure.
The ratio of the available shear force and the acting shear force can be expressed in terms of factors of safety (FS). This is the first computing in the slope stability analysis. FS is determined for the surface that is most likely to fail by sliding, critical slip surface. Iterative aspects are used to selection of a potential sliding mass, subdivision this mass into a series of slices, and the force equilibrium of each of these slices computed. There are various methods to analyze slope stability, such as the Swedish Circle method [5], the Bishop simplified method [6], the Janbu simplified method [7], the Spencer method [8], and the GLE–Morgenstern–Price [9], inter alia. In all these methods, limit equilibrium slip circle analysis has been considered according to the influence of soil strength as a negative safety factor. A few slope stability methods were classified by [10,11], which presented assumptions and limitations of these analysis methods and compared the FS of the various methods, as shown in Table 1. The lowest FS indicates the global stability of the slope and is always larger than 1. It generally consists of between 1 and 1.3, depending on the regulations. When FS close to 1 indicates a slightly stable slope that requires attention, monitoring, and/or engineering interventions to increase safety factors to reduce the probability of slope movement.

Table 1.
Description of commonly used slope stability analysis methods [10].
There are two inevitable uncertainties associated with the variability of material properties and geotechnical models [12,13,14]. Thus, the factors of safety cannot reflect the uncertainty of soil and geometric parameters. The most important soil uncertainty is probably the inherent spatial variability of soil properties. Moreover, its influence on the reliability rating of the slope was already clearly noticed by [15]. Slopes consisting mainly of natural materials have significant variability that is difficult to establish and predict slope failures. Thus, geological material variability is one of the major sources of uncertainty. The evaluation of the role of uncertainty necessarily requires the implementation of probability concepts and methods. Probabilistic analyses allowed uncertainty to be quantified and incorporated rationally into the design process [16,17,18,19]. The Monte Carlo simulation is easy to implement and can get the probability of failure with the desired precision, while it takes a long time due to the high computational effort [20]. However, there are few published studies demonstrating the practicality and usefulness of the probabilistic analysis. Moreover, the recognition of the efficiency of probability and the link between a probabilistic assessment with a conventional slope stability analysis is unclear. Furthermore, it is difficult to understand the results of the probability analysis.
The objective of this current research was to study the influence of spatial variability of random soil parameters (cohesion c and friction angle φ) and groundwater levels on the probabilistic behavior of slope stability. The results of these analyses were used for designing the road embankment structure.
2. Materials and Methods
2.1. Slope Stability Analysis
Embankment sliding is a widespread problem, especially in areas where roads close to water are subject to changes in water levels over time, and researchers are always working on reducing and overcoming this problem. In the present study, Bishop’s simplified method [6] was used for slope stability analysis because it has been accepted as the accurate method of slices even though it does not satisfy all the limit equilibrium conditions [21] indicated in Figure 1. This method identified the satisfaction equilibrium of vertical force for each slice and the overall moment equilibrium about the center of the circular surface but did not consider the horizontal forces and interslice shear forces. The factor of safety can be computed as Equation (1).
where n is the total number of slices, bi is the width of the slice, is the average height of the slice, c is the cohesion of the soil, is the friction angle of the soil, is an angle of inclination, is the weight of the soil above the failure surface, is a pore water pressure, R is a circular slip surface of the radius, and ai is a moment arm.

Figure 1.
Forces acting on the slice.
In this research, the symmetry model of the road embankment of the Bang-Ban-Bang-Sai flood water canal project, Ayutthaya Province, Thailand, was a case study. It is a preliminary design concept and therefore was an opportunity to explore possible solutions. The material properties of the embankment were defined by the Mohr–Coulomb model, and soil-1 and soil-2 were defined by the undrained model (), as shown in Table 2.
Table 2.
Material properties of road embankment.
The groundwater table was determined by the observation-well response during floods. The road embankment model was used for analysis with random variables of embankment soil strength parameters and water levels that were changed by flood management. Flood conditions are important in this case since the canal level reaches its limit, and the speed of the lower water level tends to reach the limit. Flood control operations require changes in water levels that decrease the external hydrostatic pressure and modify the pore water pressure. The stability of the upstream slope of the road embankment was disturbed. The geometry, material properties, water level, and boundary conditions were modeled to Rocscience Slide 2 [22] software, as shown in Figure 2.

Figure 2.
Geometry model of the Bang-Ban-Bang-Sai Road embankment.
Rocscience Slide 2 [22] was a 2D limit equilibrium slope stability program for evaluating the Factor of Safety of soil and rock slopes used for the road embankment stability analysis.
The geometry model was divided into 50 slices. The global minimum slip surface and Factor of Safety for the Bishop simplified method [6] are presented in Figure 3. The overall minimum FS of the preliminary design was 0.985.
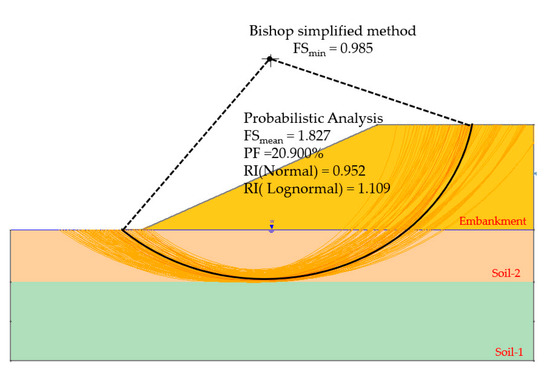
Figure 3.
The preliminary design of the Bang-Ban-Bang-Sai Road embankment.
2.2. Probabilistic Analysis of Slope Stability
Probabilistic analysis was used in engineering, where the calculation model contains random variables and identifies groups of uncertain parameters that will significantly affect slope stability performance [23,24]. The random variables simulations for the probabilistic analysis were carried out on the global minimum slip surface. Analysis of slope stability by the Bishop simple method [6] was applied to determine the initial FS and slip surface. The safety factor was recalculated several times for a minimum slip surface, giving a different randomly generated set of input variables for each analysis. Monte Carlo Simulation is a probabilistic numerical technique that was used in the process of replicating random variables. The study defined the following material properties (1) cohesion (), (2) friction angle (), and (3) groundwater as random variables.
Monte Carlo Simulation was a method for calculating a deterministic model iteratively using sets of random numbers as inputs that were proposed by Metropolis and Ulam [20,25]. The probabilistic slope analysis methodology based on the Monte Carlo simulation developed has the advantages of being simple and not requiring a comprehensive statistical and mathematical background. In slope stability analysis, this method is defined as an approximate method in which a random value for each input variable from within the defined probability distributions. The simulation iterations procedure has been used both ways to measure the accuracy and precision of results [26]. The data generated by Monte Carlo simulation can be expressed as a probability distribution (or histogram) or converted to error bars, reliability forecasts, tolerance zones, and confidence intervals. In slope stability analysis, the system failure probability () can be calculated using Equation (2) [27].
where PF is the probability of event failure, stands for the event of failure along , is the ith slip surface when i = 1, 2,…, N and N is the number of slip surfaces. When X () is referred to as an all-random variable related to the analysis of slope reliability, f(X) is referred to as the probability density function of X, and FSmin(X) is the minimum factor safety of n-slip surfaces. Thus, FSmin(X) − 1 = 0 is the state function limit for slope stability. The system failure probability can be calculated by combining f(X) with all X domains as Equation (3).
where I[FSmin] < 1 is a function of the failure domain calculated by Equation (4).
Finally, the system failure probability can be calculated by Equation (5).
where n is the number of samples and Xi is the ith sample of X. After a probabilistic analysis. The Reliability Index (RI) was applied. RI represents the number of standard deviations of the mean critical factor of safety (FS = 1) that can be calculated assuming either a normally distributed (Equation (6)) or lognormal distribution (Equation (7)) of the safety factor results.
where is a normal reliability index, is a lognormal reliability index, is a mean safety factor, and is a standard deviation of safety. A high-reliability index and low system failure probability indicate that this is a safe system. However, the reliability index cannot accurately describe the system failure probability; it was only an approximation.
In this study, probabilistic analysis with Monte Carlo simulation was used to estimate the spatial variability of random soil parameters (cohesion c and friction angle φ) and groundwater levels on the probabilistic behavior of slope stability. The groundwater levels were defined as random variables and included in established reliability issues, but it was not considered a given variable and was presumed to be subject to change according to the probability distribution function. The authors hope that probabilistic analysis with Monte Carlo simulation will help estimate the impact of the spatial variability of random soil parameters and the groundwater levels on the safety factor of slopes with relevant groundwater levels.
3. Results
Preliminary design of slope stability analysis in Figure 3, the safety factor of the preliminary design was 0.985, and the critical slip surface was provided by the black line under the slice element. For the stability of the slope to be considered safe, the safety of factors must be greater than 1. Thus, the strength properties of the soils should be improved. Herein, the probabilistic analysis method was used to perform a back analysis of the material strength parameters. The analysis procedures were divided into two categories depending on the level of flood water.
3.1. Random Variables without a Floodwater
Usually, the mean values of the strength parameters are defined by the strength parameters at a minimum safety factor (FS = 0.985). The slip surface and Bishop simplified method [6] were initial conditions for uncertainty soil parameters analysis. In the analysis procedure, the slip surface was controlled as a critical slip surface (FS = 0.985). Then, the random soil strength parameter was analyzed by the back analysis method with a controlled safety factor equal to 1. Table 3 shows the cohesion and friction angle parameters that were assumed by the range of possible values that were entered into the Rocscience Slide 2 [22].
Table 3.
Material properties of road embankment.
The sample size of 10,000 samplings was created based on their characteristics. The sensitivity analysis [28] option was activated. The analysis results of cohesion and friction angle parameters were defined by the interaction between a factory safety-strength parameter with a factory safety convergence to 1. The results of the probabilistic analysis showed that the minimum safety factor was 1.031. The new failure plane of the slope shows that improving the strength parameters of Soil-1 does not affect overall safety factors (Figure 4).
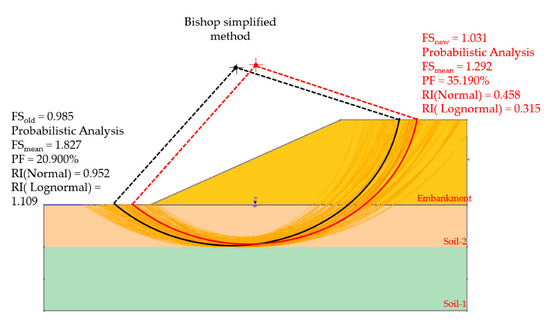
Figure 4.
The minimum safety factor of random variables.
This section may be divided into subheadings. It should provide a concise and precise description of the experimental results, their interpretation, as well as the experimental conclusions that can be drawn.
The mean, standard deviation, minimum, and maximum of factory safety are presented in the histogram graph, as shown in Figure 5. The convergence of the Monte Carlo simulation is shown in Figure 6 and Figure 7, which were plotted against random samples. The graphs show that after 2500 random samples, the Monte Carlo simulation converges without fluctuation. In total, 3519 random samples with FS less than zero were found. Thus, PF was calculated by 3519/10,000 = 0.3519 (35.190%).
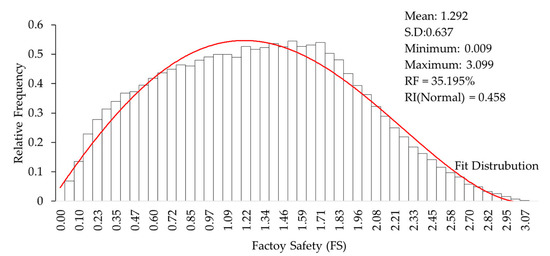
Figure 5.
Histogram of generating random sample for FS.
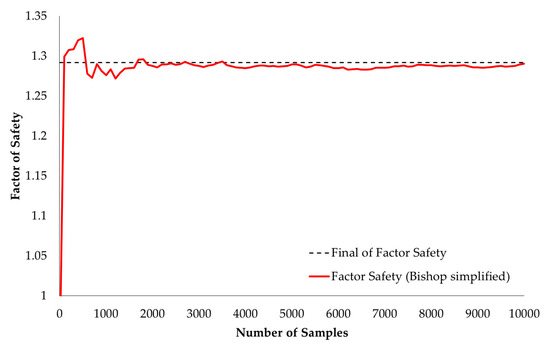
Figure 6.
The convergence of the factor safety (mean).
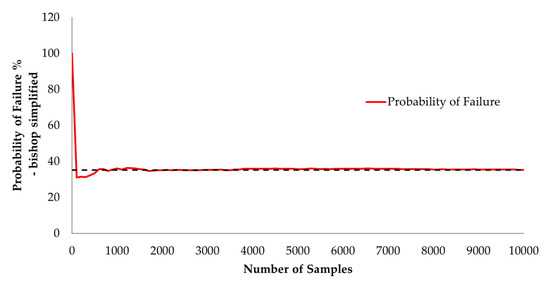
Figure 7.
The convergence of the probability of failure.
However, the safety factor was calculated by the probabilistic analysis with random variables in a critical scenario. The recommended international standard presents the minimum factor required for safety for embankments and foundations, which are 1.3 for end-of-construction conditions and 1.1–1.2 for the rapid drawdown condition [29]. The sensitivity analysis results in Figure 8, Figure 9 and Figure 10 were guidelines for improving the strength properties of the Bang-Ban-Bang-Sai Road embankment.
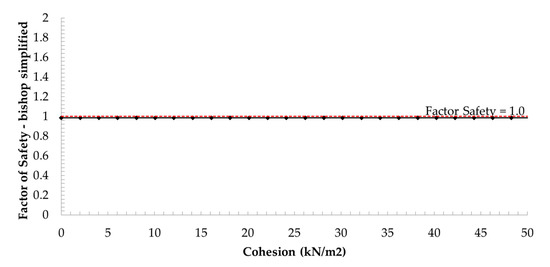
Figure 8.
Sensitivity plot of a soil strength parameter of soil-1.
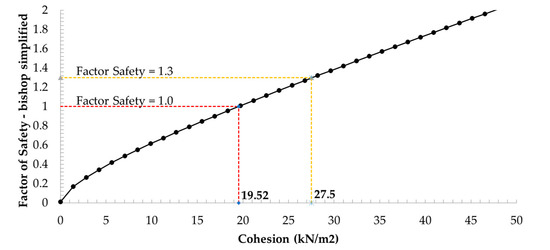
Figure 9.
Sensitivity plot of a soil strength parameter of soil-2.
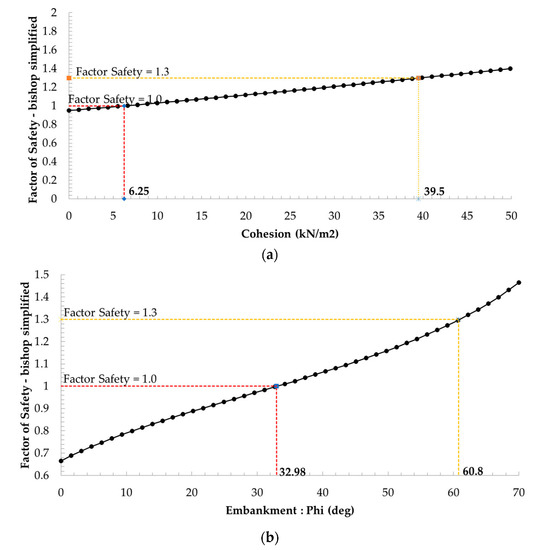
Figure 10.
Sensitivity plot of a soil strength parameter of the embankment. (a) Sensitivity plot of a cohesion parameter, (b) sensitivity plot of a friction angle parameter.
In practice, improving the strength properties of the embankment layer was a simple method and economical option. By using sensitivity analysis data, the strength properties of the embankment layer were analyzed in the 3-case study (Table 4). The analysis results show that the optimum FS was 1.324, as shown in Figure 11. Finally, the soil strength parameters of the slope should be improved with more data than is recommended, as shown in Table 5. The soil-cement technique was selected for improving the quality of soil strength parameters, which can reduce subsidence in soft soil layers and prevent soil degradation that is caused by the structure of soil grains with air and water.
Table 4.
Variables of material properties of the embankment layer.

Figure 11.
Variables of material properties of the embankment layer.
Table 5.
Material properties of road embankment.
3.2. Random Variables with a Floodwater
In this section, the level of groundwater was induced by the flood water lever. The extreme level of the groundwater of the Bang-Ban-Bang-Sai Road embankment model is shown in Figure 2. The material properties in Table 5 were implemented into the geometry model. The upper and lower groundwater levels were used to define the normalized mean of the groundwater table (YNm), as shown in Figure 12. The distribution function was a function used to provide the probability of all possible values. A detailed listing of the different types of probability distribution functions was included in [30]. The uniform distribution was selected for determining the water table level. The upper and lower limits of groundwater were generated for a random variables analysis. The groundwater levels were obtained by the observation-well test. The upper groundwater was measured during the flooding session, and the lower groundwater used observation-well test data 14 days after the flood.
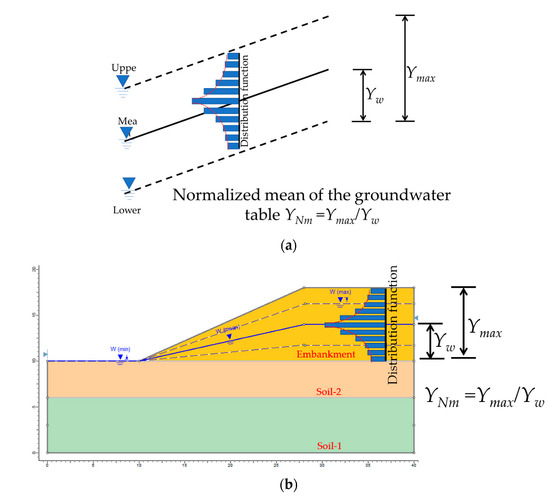
Figure 12.
Random variables with a groundwater model. (a) Concept of normalized mean groundwater table, (b) definition of normalized mean groundwater table.
The groundwater table was randomized between 0 and 1 with the probabilistic distribution function. The normalized mean groundwater table was set to 0.5 for the groundwater level in the Monte Carlo simulation (Figure 13). A sample size of 10,000 samplings was created for each of the variables involved, including the groundwater table.
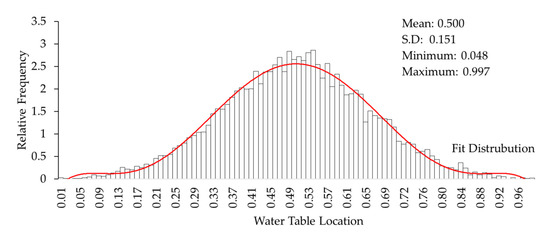
Figure 13.
Histogram of normalized groundwater table level.
The sensitivity analysis option was carried out by varying the groundwater table located between the minimum and maximum water table boundaries in 50 equal increments, and calculating the safety factor of the minimum slip surface, for each location of the groundwater table. In Figure 14 and Figure 15, the minimum safety factor included for the groundwater table was 1.125.
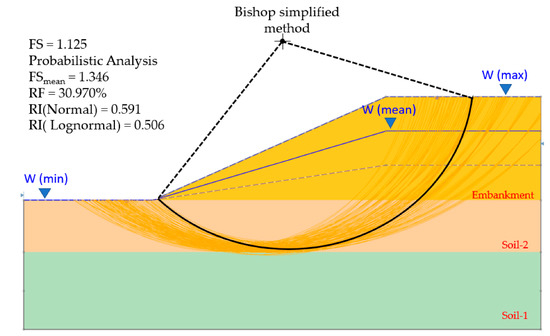
Figure 14.
Analysis results with groundwater table.
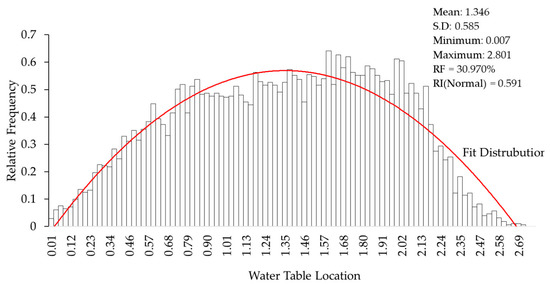
Figure 15.
Histogram of generating random sample for FS with a groundwater model.
The sensitivity variable (Figure 16) represented the water table location, which was a normalized variable. By using the recommendation in [29], the highest safety factor (FS = 1.2) occurs when the water table level is equal to 0.23 times the mean water table location (minimum water table). The minimum safety (FS = 1.1) occurs when the water table level is equal to 0.60 times the mean water table location (maximum water table). In the flood session, the groundwater level should be controlled no more than 0.9 times the mean water table location.
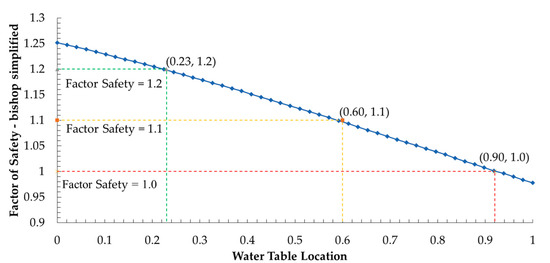
Figure 16.
Sensitivity plot of normalized groundwater table level.
4. Discussion
Probabilistic analysis is one of the main objectives of this article. The combination of Bishop’s simplified method [16] and random soil strength parameters by Monte Carlo simulation [14] allowed us to visualize various failure mechanisms with the distribution of random soil strength parameters. The failure mechanisms caused by the inherent spatial variability of soil properties cannot be presented by the conventional method, as shown in Table 1.
Monte Carlo Simulation [14] assigned a random parameter (c-φ parameter) to the slip surface, which was analyzed by Bishop’s simplified method [16]. The slip surface was fixed by a critical failure circle. However, the degree of variation of different failure mechanisms depends on the correlation between different potential slip surfaces. When the critical failure surface of a slope is changed, different failure mechanisms and random soil strength parameters will change greatly. In groundwater analysis, there are many types of distribution functions required to model groundwater levels. In this study, the uniform distribution function was recommended by [30], which was a reasonable assumption and provided a higher probability of failure than other distributions.
5. Conclusions
This article studied the influence of spatial variability of random soil parameters (cohesion c and friction angle φ) and groundwater levels on the probabilistic behavior of slope stability. Bishop’s simplified method and probability method with Monte Carlo Simulation were applied to this study. In the analysis case study. Bishop’s simplified method finds the critical slip surface and the resulting minimum FS of the preliminary design of the Bang-Ban-Bang Sai Road embankment equal to 0.985. It is practically unsafe. Thus, random variables studies were performed to investigate the influence of different parameters, such as soil strength parameter and groundwater table, on the probability of failure. With a similar critical slip failure, the random variables by Monte Carlo simulation proposed the improvement soil strength parameter that focused on the embankment soil layer. The mean of cohesion was equal to 39.5 kPa, and the mean friction angle of 32.98° was an optimal soil strength parameter on the slope stability analysis. Additionally, the FS changed as groundwater table levels were analyzed. The results of the analysis were based on the probabilistic analysis with Monte Carlo simulation, which could help estimate the impact of groundwater levels on the safety factor of slopes with the relevant groundwater levels. In the flood session, the groundwater level should be controlled no more than 0.9 times the mean water table location. The groundwater table level results were used for floodplain management and flood warning, which are to save a life by allowing people, support, and emergency services time to prepare for flooding. However, the results of the random variables studies in the article were focused on the groundwater distribution function. There were many distribution functions, such as normal distribution, exponential distribution, and beta distribution, which depended on the practical significance of the project.
Author Contributions
Conceptualization, P.C. and S.J.; methodology, P.C., S.J. and P.P.; software, N.K.; validation, P.C., S.J. and P.P.; formal analysis, P.C., S.J. and P.P.; writing—original draft preparation, P.C.; writing—review and editing, S.J. and P.P. All authors have read and agreed to the published version of the manuscript.
Funding
This research received no external funding.
Institutional Review Board Statement
Not applicable.
Informed Consent Statement
Not applicable.
Data Availability Statement
The data used in this research have been properly cited and reported in the main text.
Acknowledgments
The authors wish to acknowledge the Royal Irrigation Department of Thailand for data supports and Roy I. Morien, of the Naresuan University Graduate School, for his assistance in editing the English expression and grammar in this paper.
Conflicts of Interest
The authors declare no conflict of interest.
References
- Xiong, X.; Shi, Z.Y.; Xiong, Y.; Peng, M.; Ma, X.; Zhang, F. Unsaturated slope stability around the Three Gorges Reservoir under various combinations of rainfall and water level fluctuation. Eng. Geol. 2019, 261, 105231. [Google Scholar] [CrossRef]
- Obregon, C.; Mitri, H. Probabilistic approach for open pit bench slope stability analysis: A mine case study. Int. J. Min. Sci. Technol. 2019, 29, 629–640. [Google Scholar] [CrossRef]
- Amin, M.N.; Umair Ashfaq, M.; Mujtaba, H.; Ehsan, S.; Khan, K.; Faraz, M. Computer-Aided Slope Stability Analysis of a Landslide-A ase Study of Jhika Gali Landslide inPakistan. Sustainability 2022, 14, 12954. [Google Scholar] [CrossRef]
- Eberhardt, E. Rock Slope Stability Analysis–Utilization of Advanced Numerical Techniques; Earth and Ocean Sciences at UBC; University of British Columbia: Vancouver, BC, Canada, 2003. [Google Scholar]
- Deng, D.-P.; Li, L. Research on calculation methods of slope stability under two types of sliding surface. Rock Soil Mech. 2013, 34, 372–410. [Google Scholar]
- Bishop, A.W. The use of the Slip Circle in the Stability Analysis of Slopes. Géotechnique 1955, 5, 7–17. [Google Scholar] [CrossRef]
- Janbu, N. Applications of Composite Slip Surfaces for Stability Analysis. In Proceedings of the European Conference on the Stability of Earth Slopes, Stockholm, Sweden, 20–25 September 1954. [Google Scholar]
- Spencer, E. A Method of analysis of the Stability of Embankments Assuming Parallel Inter-Slice Forces. Géotechnique 1967, 17, 11–26. [Google Scholar] [CrossRef]
- Morgenstern, N.; Price, V. The Analysis of the Stability of General Slip Surfaces. Geotechnique 1965, 15, 79–93. [Google Scholar] [CrossRef]
- Duncan, J.; Wright, S.; Brandon, T. Soil Strength and Slope Stability; John Wiley and Sons: New York, NY, USA, 2014. [Google Scholar]
- Khan, M.I.; Wang, S. Comparing the Various Slope Stability Methods to Find the Optimum Method for Calculating Factor of Slope Safety. Mater. Corros. Eng. Manag. 2020, 1, 6–9. [Google Scholar] [CrossRef]
- El-Ramly, H.; Morgenstern, N.; Cruden, D. Lodalen slide: A probabilistic assessment. Can. Geotech. J. 2016, 43, 956–968. [Google Scholar] [CrossRef]
- Pieczy´nska-Kozłowska, J.; Bagi´nska, I.; Kawa, M. The Identification of the Uncertainty in Soil Strength Parameters Based on CPTu Measurements and Random Fields. Sensors 2021, 21, 5393. [Google Scholar] [CrossRef]
- Phoon, K.-K.; Cao, Z.J.; Ji, J.; Leung, Y.F.; Najjar, S.; Shuku, T.; Tang, C.; Yin, Z.-Y.; Ikumasa, Y.; Ching, J. Geotechnical uncertainty, modeling, and decision making. Soils Foundat. 2020, 62, 5. [Google Scholar] [CrossRef]
- Chen, F.; Zhang, W. Influence of Spatial Variability on the Uniaxial Compressive Responses of Rock Pillar Based on 3D Random Field. ASCE ASME J. Risk Uncertainty Eng. Syst. Part A Civil Eng. 2021, 7, 3. [Google Scholar] [CrossRef]
- Abdulai, M.; Sharifzadeh, M. Probability Methods for Stability Design of Open Pit Rock Slopes: An Overview. Geosciences 2021, 11, 319. [Google Scholar] [CrossRef]
- Varkey, D.; Hicks, M.A.; Vardon, P.J. Effect of uncertainties in geometry, inter-layer boundary and shear strength properties on the probabilistic stability of a 3D embankment slope. In Georisk: Assessment and Management of Risk for Engineered Systems and Geohazards; Taylor & Francis Group: Abingdon, UK, 2022. [Google Scholar]
- Bardhan, A.; Samui, P. Probabilistic slope stability analysis of Heavy-haul freight corridor using a hybrid machine learning paradigm. Transport. Geotech. 2022, 37, 100815. [Google Scholar] [CrossRef]
- Li, C.; Wang, G.; He, J.; Wang, Y. A novel approach to probabilistic seismic landslide hazard mapping using Monte Carlo simulations. Eng. Geol. 2022, 301, 106616. [Google Scholar] [CrossRef]
- Fang, H.; Chen, Y.F.; Hou, Z.; Xu, G.; Wu, J. Probabilistic analysis of a cohesion-frictional slope using the slip-line field theory in a Monte-Carlo framework. Comput. Geotech. 2020, 120, 103398. [Google Scholar] [CrossRef]
- Duncan, J. State of the Art: Limit Equilibrium and Finite-Element Analysis of Slopes. J. Geotech. Eng. 1996, 122, 577–596. [Google Scholar] [CrossRef]
- Rocscience. Slide 2 2D Limit Equilibrium Slope Stability for Soil and Rock Slopes; Rocscience: Toronto, ON, Canada, 2021. [Google Scholar]
- Gilbert, R.B.; Gilbert, R.B.; Liedtke, E. Uncertainty in Back Analysis of Slopes: Kettleman Hills Case History. J. Geotech. Geoenviron. Eng. 1998, 124, 12. [Google Scholar] [CrossRef]
- Zhang, J.; Wilson, H.; Tang, H.; Zhang, M. Efficient Probabilistic Back-Analysis of Slope Stability Model Parameters. J. Geotech. Geoenviron. Eng. 2010, 136, 99–109. [Google Scholar] [CrossRef]
- Metropolis, N.; Ulam, S. The Monte Carlo Method. J. Am. Stat. Assoc. 1949, 44, 335–341. [Google Scholar] [CrossRef] [PubMed]
- Almeida, F.S.; Silveira, F.H.; Silv´, V. Stopping criterion for Monte Carlo method-based simulations of the lightning performance of transmission lines. Electric Power Syst. Res. 2023, 214, 108797. [Google Scholar] [CrossRef]
- Li, L.; Wang, Y.; Cao, Z.; Chu, X. Risk de-aggregation and system reliability analysis of slope stability using representative slip surfaces. Comput. Geotech. 2013, 53, 95–105. [Google Scholar] [CrossRef]
- Riggs, J. Production Systems; Wiley: Hoboken, NJ, USA, 1987. [Google Scholar]
- Schnaid, F.; Mello, L.; Dzialoszynski, B.S. Guidelines and recommendations on minimum factors of safety for slope stability of tailings dams. Soils Rocks 2020, 43, 369–395. [Google Scholar] [CrossRef]
- Shadabfar, M.; Huang, H.; Kordestani, H.; Muho, E.V. Reliability Analysis of Slope Stability Considering Uncertainty in Water Table Level. ASCE ASME J. Risk Uncertainty Eng. Syst. Part A Civil Eng. 2020, 6, 3. [Google Scholar] [CrossRef]


Publisher’s Note: MDPI stays neutral with regard to jurisdictional claims in published maps and institutional affiliations. |
© 2022 by the authors. Licensee MDPI, Basel, Switzerland. This article is an open access article distributed under the terms and conditions of the Creative Commons Attribution (CC BY) license (https://creativecommons.org/licenses/by/4.0/).