Article

Investigation of Radon in Groundwater and the Corresponding Human-Health Risk Assessment in Northeastern Saudi Arabia

1
Department of Physics, College of Science, University of Hafr Al Batin, Hafr Al Batin 39524, Saudi Arabia
2
Department of Chemistry, College of Science, University of Hafr Al Batin, Hafr Al Batin 39524, Saudi Arabia
*
Author to whom correspondence should be addressed.
Sustainability 2022, 14(21), 14515; https://doi.org/10.3390/su142114515
Submission received: 10 October 2022 / Revised: 28 October 2022 / Accepted: 1 November 2022 / Published: 4 November 2022
(This article belongs to the Special Issue Water-Related Disasters and Risks)

Abstract

:
Radon is one of the most common human exposures as a natural radiation source and can cause lung, colon, and stomach cancer. In this study, groundwater from different wells was collected from the northeastern part of Saudi Arabia. The radon concentration was estimated using an electronic portable radon detector RAD7 with a big-bottle system. The annual effective dose of radon exposure by the ingestion and inhalation of water is calculated using the radon concentration for different age groups to assess the health risk of radon exposure. The calculated annual effective doses are then compared with the international risk limit standard as international organizations direct. The estimated radon concentration for groundwater samples in the searched area was between 0.03 and 3.20 Bq/L, with an average value of 1.16 Bq/L. These estimated values are far below the safety limit set by international organizations. The annual effective dose of radon exposure for infants, children and adults ranged from 0.05 to 16.24 μSv/y, with a mean value of 5.89 μSv/y. The health risk assessed by radon exposure for infants, children and adults was found to be in the safe limit recommended by international organizations.

1. Introduction

Exposure to radon and its progeny released from water can cause serious health problems, such as lung cancer [1,2,3,4,5]. It has been reported that most of the annual effective dose by radon and its progenies are due to ingestion and inhalation of water [6,7,8]. Inhalation of the released radon and its progeny is the main entrance route for humans and is responsible for the received dose. Direct ingestion of radon-containing water accounts for a part of the annual dose received from radon. The route of radon to other organs via blood is also responsible for the received dose. However, exposure to radon induced at even a minimal amount can transfer a large amount of energy to vulnerable cells of the inner organs. Since the lifetime of radon is much longer than the breath rate, a very small amount of radon decays in lungs, where the progeny can cause serious problems. It was found that most radon-induced cancer originates from inhaled progeny in the lung [9]. For these reasons, the International Agency for Research on Cancer (IARC), a branch of the WHO, classified radon as a group-1 carcinogen [7,10]. Hence, the measurement of radon concentration and the annual effective dose by radon is one of the significant essential issues for researchers worldwide [11].
Many international organizations set a value for radon concentration in water to protect from radon exposure. For example, the US Environmental Protection Agency (USEPA) and European Atomic Energy Community (EAEC) have set 11.1 Bq/L as a reference radon concentration level for drinking water [12]. In contrast, the World Health Organization (WHO) recommends 100 Bq/L [13,14] as a safe level. For any water source, if the radon concentration exceeds the safety level, the WHO recommends treating until the concentration reduces to 100 Bq/L. The WHO recommends linking an annual effective radon dose of 100 μSv/y to drinking-water consumption [15,16], which is supported by the European Commission (EC) [17].
Recently, to estimate the radon concentration in water, many researchers have used various techniques [16,18], such as liquid scintillation counter, Lucas cell, ionization chamber and gamma and alpha spectroscopy of radon, and extraction using aeration from water [19]. Among them, gamma-ray spectroscopy and liquid scintillation counting are mostly used [20]. A Durridge RAD7 digital radon meter can be used for radon detection which allows the separation of radon isotopes from water samples. A Durridge RAD7 digital radon meter is a useful digital detector meter which allows the separation of radon isotopes [20]. The RAD7 device is connected to a big-bottle system with a bubbling kit that separates radon gas from water to air in a closed loop [21,22,23]. This device can measure the radon concentration in an hour with high accuracy on the spot. After a national groundwater surveillance program started in 2007 for “Investigation of natural radioactivity levels,” many studies have been reported on radioactivity levels in well water. For example, Aleissa et al. reported the radon levels in groundwater supplies of Riyadh, Saudi Arabia by a liquid scintillation counter [6]. They found them to comply with the proposed national limits. Alharbi et al. reported the radioactive level in groundwater from the Al-Zulfi, Al-Qassim and Al-Majmah regions in Saudi Arabia and found a higher level of radioactive exposure [24]. Their studies confirm the actual harmful impacts of the selected groundwater samples on the consumers living in these three regions. Our present area of study is very near these areas. To date, no literature has reported radon exposure in groundwater from this well-populated region (Hafr Al Batin) of Saudi Arabia.
Therefore, the present work represents the estimation of radon activity concentration and its annual effective dose within different age groups by the ingestion and inhalation of water used for drinking and domestic purposes in the Hafr Al Batin area, Saudi Arabia. The results are compared with the international safety standard set by different organizations. Additionally, a comparison was made between the annual effective dose of radon exposure for the age groups of infants, children, and adults.

2. Materials and Methods
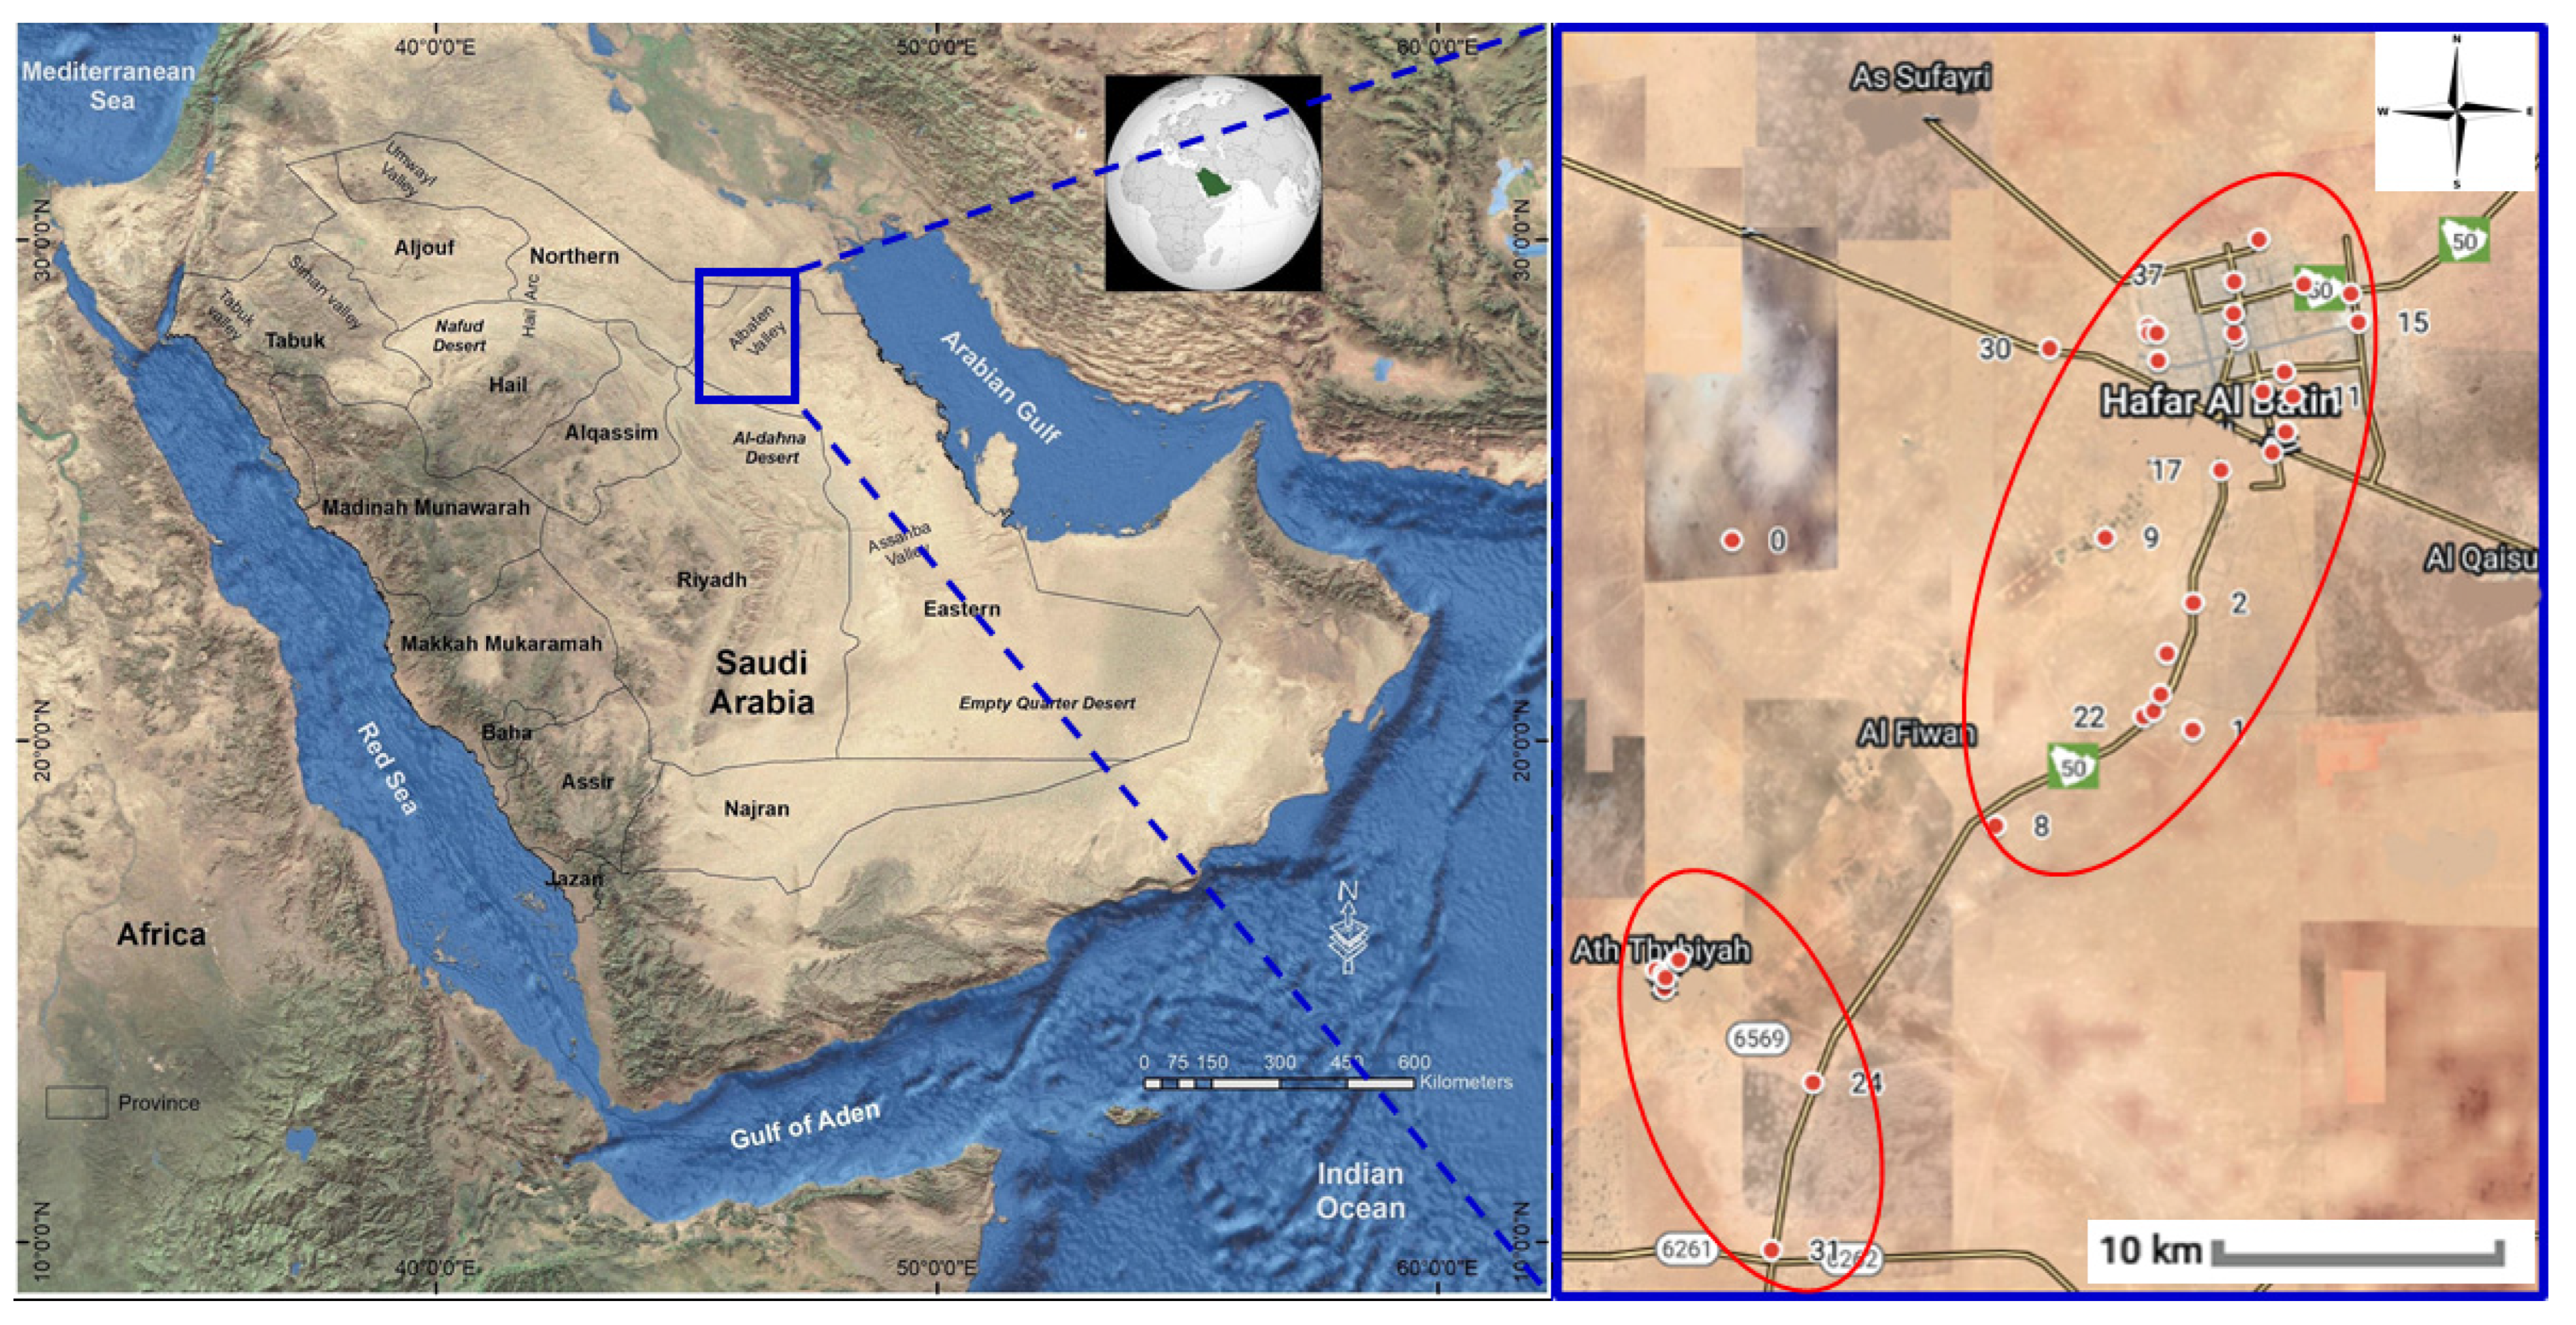
2.1. The Study Area

The present study selected two main cities: Hafr Al Batin and Thybiyah, in the Eastern Province of the northeast part of Saudi Arabia. The area lies between the longitude of 28°26′3″ N and latitude of 45°57′49″ E (Figure 1). During summer days, the climate is arid and hot (40–50 °C), and it falls during winter nights to (−2–8 °C). It rarely rains during winter, and no rainfall is recorded during summer.
The Eastern Province of Saudi Arabia has aquifers of good water quality due to its wide variation in geological settings. According to Vincent [25] and Alsharhan et al. [26], the principal aquifers are based on primary and secondary origins. The primary origin aquifers include the Quaternary sands of the wadi system, quartz sandstones, conglomerates with primary porosity and calcarenite, coquinite and oolitic limestone with secondary porosity. Hafr Al Batin has a Quaternary sand aquifer where deep wells supply relatively good water compared to shallow wells. Higher radon concentrations are usually detected in groundwater associated with granite and metamorphic rocks [27].

2.2. Radon Measurement

A Durridge RAD7 digital detector meter was used to measure the radon concentration in water (Durridge Company Inc., Billerica, MA, USA). RAD7 with the big-bottle accessory can measure very low radon levels, even one pCi/L [28]. The detector is a portable battery-based device with a high-speed measurement coupled with a bubbling kit, which helps to remove radon gas from water. Such a detector meter with big-bottle accessory system was used (Figure 2), while the schematic diagram is shown in the supporting information (Figure S1). A 2.5 L glass bottle supplied by Durridge Company Inc. was used to collect the groundwater samples. The detector with the big-bottle system employs an aeration method while keeping the air and water volumes constant. The airflow rate remained steady, and the relative humidity was below 7%. The system has high extraction efficiency from water to air [29]. Before the experiment, RAD7 runs for ten minutes to purge air to evacuate the residual radon gas from the measuring chamber. The big-bottle system employs a closed-loop areation scheme whereby the air volume and water volume are constant, and independent of flow rate. The air recirculates through the water and extracts the radon until a state of equilibrium develops. The big-bottle system reached this state of equilibrium after aeration for more than ten minutes. We used a common user protocol where the “Grab” initiates a grab sampling sequence (ten minutes) at the beginning of a run. When starting a new run with the pump set to “Grab”, the pump starts to run for ten minutes. This is followed by a ten-minute equilibrium delay, after which the counting period begins.

2.3. Sampling Method

Sampling is the most important factor when analyzing radon in groundwater. Since radon gas can be dissolved in groundwater, it might escape from water during contact with the atmosphere. Therefore, serious attention was taken to obtain the actual radon concentration during the sampling process. Groundwater samples from 38 sources were collected directly from the pumps. Water samples were collected into glass bottles and capped immediately. For better performance, in most cases, the measurements were carried out instantly on the spot and within four hours after sample collection. Later, the program was set to measure the radon concentration for fifteen cycles continuously. Every measurement, the relative data, respective bar charts, and cumulative spectra were printed by a wireless infrared printer provided by the company. The data from the detector were collected by a USB serial port to the computer and analyzed using RAD7 data-acquisition and analysis software (CAPTURE, Durridge Company Inc., USA). The counting process was repeated fifteen times to obtain precise results. The detector gives the average counting results after thirty minutes of analysis, considering a sensitivity level close to or exceeding that of liquid scintillation techniques [22,30]. Most residual radon gas (95%) from the detector chamber was removed during 10 min of aeration before each run. Finally, the system’s temperature, humidity, water salinity, and volume were corrected using CAPTURE analysis software.

2.4. Dose Assessment

The annual effective dose AED (μSv/y) within different age groups regarding water consumption by ingestion and inhalation was calculated using the following relationship [31,32,33,34]. The annual effective dose for ingestion of water was calculated using the following:
A E D i n g = C R n × A I W × E D C
where AEDing is the annual effective dose for ingestion (μSv/y); CRn is the radon concentration in water (Bq/L); AIW represents the annual intake of water in the different age groups, for example, 230 L/y for age range ≤ 1 year infant, 330 L/y for 2–17 years children, and 730 L/y for ≥17 years adult; and EDC is the effective dose coefficient 23, 5.9, 3.5 nSv/Bq for infant, children, and adult, respectively [33].
The annual effective dose for inhalation of water was calculated using the following equation:
A E D i n h = C R n × R a × F × O × D C F
where AEDinh is the annual effective dose for inhalation (μSv/y); CRn is the radon concentration in water (Bq/L); Ra is the air-to-water ratio for radon (10−4) [31]; F is the equilibrium factor of radon to its decay product (0.4) [33]; O is the average indoor occupancy time for a person annually (7000 h/y) [31,35]; and DCF is the dose conversion factor for exposure (9 nSv/(Bq.h.m−3)) [36].
The total annual effective dose (AEDT) is the sum of the annual effective dose for ingestion (AEDing) and the annual effective dose for inhalation (AEDinh).

3. Results and Discussion

For radon detection, the silicon (Si) scintillation detector of computerized multichannel radon detector RAD7 converts the α-radiation energy from radon gas directly into an electrical signal, which is amplified and converted to digital format [37]. The data processor of RAD7 receives the signal and processes it to form an energy spectrum within the energy range (1–10) MeV. Such a typical spectrum of sample H10 using an RAD7 with different windows is shown in Figure 3. The interest appears at 5–9 MeV, where radon and thorium decay are located. The observed spectra are divided into 200 channels in the different windows where the RAD7 detector can specify the isotope of α-particles and, hence, can distinguish the isotope of Po-218 by α-radiation (6 MeV) or the Po-214 nucleus (7.75 MeV).
During the measurement of activity concentration, the activity might be influenced by time due to aeration. Since the measurement time is half an hour, a change in concentration might be observed due to the continuous aeration of water in the big-bottle system. To monitor the more prolonged measurement effect by aeration, typically measured data of concentration with time are shown in Figure 4. For better understanding, sample H10 was chosen due to its higher radon concentration. It can be seen that, initially, the concentration was relatively high (5.05 Bq/L), which gradually decreased with time. After a few minutes, it shows an average concentration with a significant variation, which might be related to aeration during measurement. At the beginning of the measurement, due to the disequilibrium state of radon and its progeny (especially polonium-218), the concentration was relatively high. There should be a buildup of radon in the chamber with time and reaching of an equilibrium state after a few half-lives of polonium-218. After that equilibrium, the concentration seems saturated. However, to minimize the deviation, the measurement was taken for two minutes for fifteen cycles, and an average was calculated. After measuring the radon concentration in air (open circle in Figure 4a), CAPTURE software can generate data files for the big-bottle system. The software can also convert the radon concentration in air to the radon concentration in water using user-specified parameters, such as the measurement method, air and water volume, water salinity, humidity, temperature, etc. Such a correction was made for every sample (solid circle in Figure 4a). It was found that the radon concentration in air is consistently overestimated (approximately 1.3 times) compared to the radon concentration in water (Figure 4b).
The measured concentrations of radon for 38 groundwater samples collected from Hafr Al Batin, Saudi Arabia, are tabulated in Table 1. It was found that the concentration varied from 0.03 to 3.20 Bq/L with an average of 1.16 Bq/L, and a standard deviation of 0.79 Bq/L. Following a careful comparison between the shallow and deep wells, as indicated in Table 1, it can be seen that the average radon concentration in shallow wells, with few exceptions, was mostly lower than that in deep wells. The exceptions found for shallow wells are located in the lower valley of the dry Al Batin River. Similarly, exceptions were found for some deep wells and those located on the top of the hillside. The overall mean values of the radon concentration in shallow and deep wells are much below the international limit. One of the reasons for the lower radon concentration might be the geology of the searched area, which consists of sedimentary rock formations, which might contain a lower concentration of 226Ra and other radionuclides belonging to the uranium/thorium series.
As observed, all samples measured radon levels below those limits. Approximately 90% of the samples were far less than the radon levels reported earlier [37,38]. Furthermore, the estimated radon concentrations in the present study are comparable to those found in the rest of Saudi Arabia [6,21,22]. For example, a range of (1.45–9.15) Bq/L was found in the Al-Jawa area as reported by Althoyaib et al. [39]; (0.76–4.69) Bq/L was found for groundwater from the Al-Qassim area reported by El-Taher et al. [40]; (0.92–2.12) Bq/L was found in the Jeddah area reported by Tayyeb et al. [41]; (0.11–9.20) Bq/L was found in the Dammam area reported by Abuelhia [21]; and (1.74–4.32) Bq/L was found in the Jazan area as reported by El-Araby et al. [42].
The results in the present study can be compared with the other countries surrounding Saudi Arabia. Table 2 shows the range of radon concentrations for different types of water in several countries. The average radon concentration obtained in the current study is compatible with the surrounding countries, such as Yemen, UAE, Kuwait, Iraq, and Jordan, as shown in Table 2. The results in the present study are far below those of Turkey [43], Algeria [44], India [45], Romania [46], Sudan [47], Iran [48], and China [49]. The geological nature of the sampling area, soil nature, and environment can impact the radon concentration [50]. Moreover, the irradiative emissions from radon are the energy of neutrons, neutron flux, and contamination of radioactive sources, which can lead to differences from the experimental results.
For humans, those exposed to radon by ingestion and inhalation of water can experience radon directly entering into the gastrointestinal tract or indirectly from the respiratory tract. Even if a small quantity of radionuclide is absorbed into the body cell, it can cause severe hazards in the long term. The quantity for the estimation of exposure from terrestrial radionuclides is known as the effective dose, more precisely, the annual effective dose (AED) [3]. Owing to radon exposure, the annual effective dose is calculated using Equations (1) and (2). The AEDs for the three different age groups of infants, children, and adults were calculated using radon concentrations and are tabulated in Table 3.
From the estimated health risk data, the annual effective doses by ingestion of infants through drinking water ranged from 0.14–16.93 μSv/y. For children, the dose was within the range of 0.05–6.23 μSv/y. Furthermore, the obtained results for adults ranged from 0.07–8.18 μSv/y, and the corresponding mean values for ingestion were 6.14, 2.26, and 2.96 μSv/y for infants, children, and adults, respectively. The findings demonstrated a significant difference in the annual effective dose across different age groups, as shown in Table 3. Although infants usually drink less water than adults, the annual effective dose of infants is higher than that of adults. The smaller organ and difference in the metabolism of infants result in a higher effective dose [56]. In addition, the dose coefficient and yearly consumption of water for the different age groups can lead to differences among the groups (Table 3). The annual effective dose for the inhalation of water was calculated only for adults. The range lies between 0.07–8.06 μSv/y with a mean value of 2.92 μSv/y. It is interesting to note that the annual effective dose by ingestion and inhalation for adults was almost the same (Figure S2 in the supporting information). In most cases, the ratio between ingestion and inhalation was found to be approximately 3, as mentioned by El-Araby et al. [42]. However, the uncertainty due to the weighted mean, age group, diffusion effect, tissue-weighting factor, and population deviation are not accounted for in the present calculation. Such corrections are now ongoing, and detailed results will be published elsewhere. All of the groundwater samples in the Hafr Al Batin area are found to be much less than the safety value of 100 μSv/y (as recommended by EAEC, EC, and WHO). However, inhalation in males and females is different [56]. Gender and other effects do not account for the calculation of the AED. Finally, it can be concluded that the total annual effective dose resulting from exposure to radon in groundwater in the Hafr Al Batin area is significantly low.

4. Conclusions

Estimation of radon concentration and the total effective dose for radon exposure by the ingestion and inhalation of water were estimated within different age groups from various groundwater sources of Hafr Al Batin, Saudi Arabia, using an electronic portable RAD7 radon detector. The estimated radon activity concentrations in the groundwater samples range from 0.03 to 3.20 Bq/L with an average of 1.16 Bq/L, with a standard deviation of 0.79 Bq/L, which lies within the safety recommended by the USEPA and EAEC and far below that recommended by the UNSCEAR and WHO. In addition, the estimated total annual effective dose of radon exposure by ingestion and inhalation for the different age groups, ranging from infants, children, and adults, was found to be in the range of 0.05 to 16.24 μSv/y, with a mean value of 5.89 μSv/y, which is in the safety range according to the EAEC, EC, and WHO standards. Therefore, the radon level in groundwater in the Hafr Al Batin area is significantly lower than the permissible international standard limit of 100 μSv/y. This work will be helpful for governmental agencies for the better management of groundwater resources and sustainability for utilization. Expanding the search areas targeting all over Saudi Arabia to build up a radon zone map is in progress, and the report will be published elsewhere.

Supplementary Materials

The following supporting information can be downloaded at https://www.mdpi.com/article/10.3390/su142114515/s1. Figure S1. Schematic diagram of a RAD7 detector meter with big-bottle system. Figure S2. The ratio between the annual effective dose for ingestion and inhalation for adults.

Author Contributions

Conceptualization, A.M.; methodology, A.M.; formal analysis, A.M.; investigation, A.M.; resources, A.S.A.; data curation, A.M.; writing—original draft preparation, A.M.; writing—review and editing, A.M.; visualization, A.M.; supervision, A.S.A.; project administration, A.S.A.; funding acquisition, A.M. All authors have read and agreed to the published version of the manuscript.

Funding

This work is financially supported by the Institutional Funding Project (No: IFP-A-202-1-3) from the Ministry of Education, Saudi Arabia.

Institutional Review Board Statement

Not applicable.

Informed Consent Statement

Not applicable.

Data Availability Statement

The dataset used in this study are available from the corresponding author on reasonable request except for data that is subject to third party restrictions.

Acknowledgments

The authors thank the Deanship of Scientific Research, University of Hafr Al Batin, for the experimental facilities. Furthermore, the authors are thankful to Department of Nondestructive Evaluation Technology (NDET), Hafr Al Batin Community College, for the experimental facilities.

Conflicts of Interest

The authors declare no conflict of interest.

References

  1. UNSCEAR. Sources, Effects and Risks of Ionizing Radiation; United Nations: New York, NY, USA, 1988; Volume 199. [Google Scholar]
  2. USEPA. National primary drinking water regulations; Radionuclides, proposed rule. Fed. Reg. 1991, 56, 33050–33127. [Google Scholar]
  3. Harrison, J.D. Lung cancer risk and effective dose coefficients for radon: UNSCEAR review and ICRP conclusions. J. Radiol. Prot. 2021, 41, 433–441. [Google Scholar] [CrossRef] [PubMed]
  4. Küçükönder, E.; Gümbür, S. Radon Gas Measurement in Water Samples in Kahramanmaras Province of Turkey. Water Air Soil Pollut. 2022, 233, 175. [Google Scholar] [CrossRef]
  5. Tirmarche, M.; Harrison, J.D.; Laurier, D.; Paquet, F.; Blanchardon, E.; Marsh, J.W. ICRP Publication 115. Lung cancer risk from radon and progeny and statement on radon. Ann. ICRP 2010, 40, 1–64. [Google Scholar] [CrossRef] [PubMed]
  6. Aleissa, K.A.; Alghamdi, A.S.; Almasoud, F.I.; Islam, M.S. Measurement of radon levels in groundwater supplies of Riyadh with liquid scintillation counter and the associated radiation dose. Radiation Prot. Dosim. 2012, 154, 95–103. [Google Scholar] [CrossRef]
  7. Mehra, R.; Bala, P. Estimation of annual effective dose due to Radon level in indoor air and soil gas in Hamirpur district of Himachal Pradesh. J. Geochem. Explor. 2014, 142, 16–20. [Google Scholar] [CrossRef]
  8. Harrison, J.D.; Balonov, M.; Bochud, F.; Martin, C.; Menzel, H.G.; Ortiz-Lopez, P.; Smith-Bindman, R.; Simmonds, J.R.; Wakeford, R. ICRP Publication 147: Use of Dose Quantities in Radiological Protection. Ann. ICRP 2021, 50, 9–82. [Google Scholar] [CrossRef]
  9. Petoussi-Henss, N.; Satoh, D.; Endo, A.; Eckerman, K.; Bolch, W.; Hunt, J.; Jansen, J.T.M.; Kim, C.H.; Lee, C.; Saito, K.; et al. ICRP Publication 144: Dose Coefficients for External Exposures to Environmental Sources. Ann. ICRP 2020, 49, 11–145. [Google Scholar] [CrossRef]
  10. Sharma, S.; Mehta, K.; Narang, S.; Kumar, A. Dose estimation from the exposure to radon, thoron and their progeny concentrations in the environs of Kangra area, Himachal Himalayas, India. Groundw. Sustain. Dev. 2020, 11, 100409. [Google Scholar] [CrossRef]
  11. Maringer, F.J.; Baumgartner, A.; Rechberger, F.; Seidel, C.; Stietka, M. Activity measurement and effective dose modelling of natural radionuclides in building material. Appl. Radiat. Isot. 2013, 81, 279–283. [Google Scholar] [CrossRef]
  12. European Commission. Radon in Workplaces: Implementing the Requirements in Council Directive 2013/59/Euratom; Publications Office of the European Union: Luxembourg, 2019. [Google Scholar] [CrossRef]
  13. WHO. Desalination for Safe Water Supply: Guidance for the Health and Environmental Aspects Applicable to Desalination; World Health Organization (WHO): Geneva, Switzerland, 2007.
  14. WHO. Guidelines for Drinking-Water Quality; World Health Organization: Geneva, Switzerland, 2011; Volume 216, pp. 303–304.
  15. WHO. The World Health Organization (2009) WHO Handbook on Indoor Radon; World Health Organization: Geneva, Switzerland, 2009; ISBN 978-92-4-154767-3.
  16. Malik, M.F.I.; Rabaiee, N.A.; Jaafar, M.S. Determination of radon concentration in water using RAD7 with RAD H2 accessories. In Proceedings of the National Physics Conference 2014 (PERFIK 2014), Kuala Lumpur, Malaysia, 1 April 2015; p. 120005. [Google Scholar]
  17. European Commission. Exposure to Radon in Drinking Water Supplies. Off. J. Eur. Comm. 2001, 344, 85–88. [Google Scholar]
  18. Hopke, P.K.; Borak, T.B.; Doull, J.; Cleaver, J.E.; Eckerman, K.F.; Gundersen, L.C.S.; Harley, N.H.; Hess, C.T.; Kinner, N.E.; Kopecky, K.J.; et al. Health Risks Due to Radon in Drinking Water. Environ. Sci. Technol. 2000, 34, 921–926. [Google Scholar] [CrossRef] [Green Version]
  19. De Simone, G.; Galli, G.; Lucchetti, C.; Tuccimei, P. Calibration of Big Bottle RAD H2O set-up for radon in water using HDPE bottles. Radiat. Meas. 2015, 76, 1–7. [Google Scholar] [CrossRef]
  20. Jobbágy, V.; Altzitzoglou, T.; Malo, P.; Tanner, V.; Hult, M. A brief overview on radon measurements in drinking water. J. Environ. Radioact. 2017, 173, 18–24. [Google Scholar] [CrossRef] [PubMed]
  21. Abuelhia, E. Evaluation of annual effective dose from indoor radon concentration in Eastern Province, Dammam, Saudi Arabia. Radiat. Phys. Chem. 2017, 140, 137–140. [Google Scholar] [CrossRef]
  22. Abuelhia, E. Assessment of radiation dose from radon ingestion and inhalation in commercially bottled drinking water and its annual effective dose in Eastern Province, Saudi Arabia. Int. J. Environ. Health Res. 2019, 29, 164–172. [Google Scholar] [CrossRef]
  23. Salih, N.F. Determine the Contaminations of Radon in the Drinking Water Using NTDs (CR-39) and RAD7 Detectors. Arab. J. Sci. Eng. 2021, 46, 6061–6074. [Google Scholar] [CrossRef]
  24. Alharbi, T.; Adel, A.; Baloch, M.A.; Alsagabi, S.F.; Alssalim, Y.A.; Alslamah, A.S.; Alkhomashi, N. Natural radioactivity measurements and age-dependent dose assessment in groundwater from Al-Zulfi, Al-Qassim and Al-Majmaah regions, Saudi Arabia. J. Radioanal. Nucl. Chem. 2018, 318, 935–945. [Google Scholar] [CrossRef]
  25. Vincent, P. Saudi Arabia: An Environmental Overview; CRC Press: London, UK, 2008. [Google Scholar] [CrossRef]
  26. Alsharhan, A.S.; Rizk, Z.A.; Nairn, A.E.M.; Bakhit, D.W.; Alhajari, S.A. Preface. In Hydrogeology of An Arid Region: The Arabian Gulf and Adjoining Areas; Alsharhan, A.S., Rizk, Z.A., Nairn, A.E.M., Bakhit, D.W., Alhajari, S.A., Eds.; Elsevier Science B.V.: Amsterdam, The Netherlands, 2001. [Google Scholar] [CrossRef]
  27. Durrani, S.A. Radon concentration values in the field: Correlation with underlying geology. Radiat. Meas. 1999, 31, 271–276. [Google Scholar] [CrossRef]
  28. El-Taher, A.M.; Abojassim, A.A.; Najam, L.A.; Mraity, H.A.A.B. Assessment of Annual effective Dose for Different Age Groups based on Radon Concentrations in the Groundwater of Qassim, Saudi Arabia. Iran. J. Med. Phys. 2020, 17, 15–20. [Google Scholar] [CrossRef]
  29. Binesh, A.; Mohammadi, S.; Mowlavi, A.; Parvaresh, P. Evaluation of the radiation dose from radon ingestion and inhalation in drinking water. Int. J. Water Resour. Environ. Eng. 2010, 2, 174–178. [Google Scholar]
  30. Alzurfi, S.; Abojassim, A.; Mraity, H. Monthly Monitoring of Physicochemical and Radiation Properties of Kufa River, Iraq. Pak. J. Sci. Ind. Res. Ser. A Phys. Sci. 2018, 61, 43–50. [Google Scholar] [CrossRef]
  31. UNSCEAR. Sources and Effects of Ionizing Radiation, United Nations Scientific Committee on the Effects of Atomic Radiation (UNSCEAR) 1993 Report: Report to the General Assembly, with Scientific Annexes; UNSCEAR: New York, NY, USA, 1993. [Google Scholar]
  32. Alam, M.N.; Chowdhury, M.I.; Kamal, M.; Ghose, S.; Islam, M.N.; Anwaruddin, M. Radiological Assessment of Drinking Water of the Chittagong Region of Bangladesh. Radiat. Prot. Dosim. 1999, 82, 207–214. [Google Scholar] [CrossRef]
  33. UNSCEAR. The General Assembly with Scientific Annex; UNSCEAR: New York, NY, USA, 2000. [Google Scholar]
  34. El-Taher, A. Annual effective dose exposure in ground water from Qassim area, Saudi J. Environmen. Sci. Techn 2012, 5, 475–481. [Google Scholar]
  35. IAEA. WHO—International Basic Standards for Protection against Ionizing Radiation and for the Safety of Radiation Sources. In Safety Series; IAEA: Vienna, Austria, 1996. [Google Scholar]
  36. UNSCEAR. United Nations Scientific Committee on the Effects of Atomic Radiation (2019) UNSCEAR 2019 Report, Annex B—Lung Cancer from Exposure to Radon; United Nations: New York, NY, USA, 2019. [Google Scholar]
  37. Aljaloud, K.B.; ElBatouti, M. Statistical analysis of 222Rn concentration in Zamzam and other water sources in the Kingdom of Saudi Arabia. Heliyon 2021, 7, e06057. [Google Scholar] [CrossRef] [PubMed]
  38. Al-Jaseem, Q.K.; Almasoud, F.I.; Ababneh, A.M.; Al-Hobaib, A.S. Radiological assessment of water treatment processes in a water treatment plant in Saudi Arabia: Water and sludge radium content, radon air concentrations and dose rates. Sci. Total Environ. 2016, 563–564, 1030–1036. [Google Scholar] [CrossRef]
  39. Althoyaib, S.; El-Taher, A. Natural radioactivity measurements in groundwater from Al-Jawa, Saudi Arabia. J. Radioanal. Nucl. Chem. 2015, 304, 547–552. [Google Scholar] [CrossRef]
  40. El-Taher, A.; Al-Turki, A. Radon activity measurements in irrigation water from Qassim Province by RAD7. J. Environ. Biol. 2016, 37, 1299–1302. [Google Scholar]
  41. Tayyeb, Z.; Kinsara, A.; Farid, S. A study on the radon concentrations in water in Jeddah (Saudi Arabia) and the associated health effects. J. Environ. Radioact. 1998, 38, 97–104. [Google Scholar] [CrossRef]
  42. El-Araby, E.H.; Soliman, H.A.; Abo-Elmagd, M. Measurement of radon levels in water and the associated health hazards in Jazan, Saudi Arabia. J. Radiat. Res. Appl. Sci. 2019, 12, 31–36. [Google Scholar] [CrossRef] [Green Version]
  43. Yalım, H.A.; Sandıkcıoğlu, A.; Ünal, R.; Orhun, Ö. Measurements of radon concentrations in well waters near the Akşehir fault zone in Afyonkarahisar, Turkey. Radiat. Meas. 2007, 42, 505–508. [Google Scholar] [CrossRef]
  44. Amrani, D. Natural radioactivity in Algerian bottled mineral waters. J. Radioanal. Nucl. Chem. 2002, 252, 597–600. [Google Scholar] [CrossRef]
  45. Mahesh, H.; Avadhani, D.; Karunakara, N.; Somashekarappa, H.; Narayana, Y.; Siddappa, K. 222Rn concentration in ground waters of coastal Karnataka and Kaiga of south west coast of India. Health Phys. 2001, 81, 724–728. [Google Scholar] [CrossRef] [PubMed]
  46. Moldovan, M.; Nita, D.C.; Cucos-Dinu, A.; Dicu, T.; Bican-Brişan, N.; Cosma, C. Radon concentration in drinking water and supplementary exposure in Băiţa-Ştei mining area, Bihor county (Romania). Radiat. Prot. Dosim. 2014, 158, 447–452. [Google Scholar] [CrossRef] [PubMed]
  47. Idriss, H.; Salih, I.; Sam, A. Study of radon in ground water and physicochemical parameters in Khartoum state. J. Radioanal. Nucl. Chem. 2011, 290, 333–338. [Google Scholar] [CrossRef]
  48. Malakootian, M.; Nejhad, Y.S. Determination of radon concentration in drinking water of Bam villages and evaluation of the annual effective dose. Int. J. Radiat. Res. 2017, 15, 81. [Google Scholar]
  49. Xinwei, L. Analysis of radon concentration in drinking water in Baoji (China) and the associated health effects. Radiat. Prot. Dosim. 2006, 121, 452–455. [Google Scholar] [CrossRef]
  50. Hystad, P.; Brauer, M.; Demers, P.A.; Johnson, K.C.; Setton, E.; Cervantes-Larios, A.; Poplawski, K.; McFarlane, A.; Whitehead, A.; Nicol, A.M. Geographic variation in radon and associated lung cancer risk in Canada. Can. J. Public Health 2014, 105, e4–e10. [Google Scholar] [CrossRef]
  51. Elmehdi, H.; Dalah, E.; Bakhronov, K. Measurements of Radon Concentration in Water in the United Arab Emirates and the Associated Health Effects. In Proceedings of the 2019 Advances in Science and Engineering Technology International Conferences (ASET), Dubai, United Arab Emirates, 26 March–10 April 2019; pp. 1–5. [Google Scholar] [CrossRef]
  52. Seoud, M. Measurement of Radon-222 Concentration in Bottled Natural Mineral Drinking Water in Kuwait Using the Nuclear Track Detector (CR-39). Int. J. Phys. 2017, 5, 201–207. [Google Scholar]
  53. Ahmed, F.A.; El-Kamel, A.H.; Harb, S.; Zahran, A.M.; Abbady, A.A. Natural radioactivity of ground water in some areas in Aden governorate South of Yemen Region. Radiat. Prot. Environ. 2013, 36, 8. [Google Scholar] [CrossRef]
  54. Al-Bataina, B.A.; Ismail, A.M.; Kullab, M.K.; Abumurad, K.M.; Mustafa, H. Radon measurements in different types of natural waters in Jordan. Radiat. Meas. 1997, 28, 591–594. [Google Scholar] [CrossRef]
  55. Abojassim, A. Radon Concentrations Measurement for Drinking Water in Kufa City /Iraq Using Active Detecting Method. Adv. Phys. Theor. Appl. 2014, 26, 6. [Google Scholar]
  56. Leggett, R.; Eckerman, K. Dosimetric Significance of the ICRP’s Updated Guidance and Models, 1989–2003, and Implications for U.S. Federal Guidance; United States Department of Energy: Washington, DC, USA, 2003. [Google Scholar] [CrossRef]
Figure 1. Map of the two cities in the study area (Hafr Al Batin and Thybiyah, Eastern Province, Saudi Arabia from Google Maps).
Sustainability 14 14515 g001
Figure 2. Schematic diagram of the RAD7 detector meter with big-bottle system of measuring devices to estimate the radon concentration in groundwater samples.
Sustainability 14 14515 g002
Figure 3. Cumulative spectrum for the selected channel for a typical measurement for sample H10 with the different windows of alpha energy spectrum recorded by the RAD7 detector.
Sustainability 14 14515 g003
Figure 4. (a) Radon concentration with number cycles converted to measurement time for sample H10; radon in the air (open circle) and radon in water for big-bottle system (solid circle) calculated using CAPTURE software; and (b) radon concentration in the air as a function of concentration in water.
Sustainability 14 14515 g004
Table 1. Radon activity concentration.
Sample No.Purpose of UseDepth of WellCRn (Bq/L)Sample No.Purpose of UseDepth of WellCRn (Bq/L)
H01Domestic useShallow0.29H21Domestic useShallow0.27
H02Domestic useShallow0.03H22Domestic useShallow0.23
H03Drinking and domesticDeep2.11H23Domestic useShallow0.34
H04Drinking and domesticDeep1.15H24Domestic useShallow1.69
H05Drinking and domesticDeep1.00H25Domestic useShallow2.17
H06Drinking and domesticDeep0.89H26Drinking and domesticDeep1.99
H07Drinking and domesticDeep0.67H27Drinking and domesticDeep1.67
H08Drinking and domesticShallow1.02H28Drinking and domesticDeep2.04
H09Drinking and domesticShallow1.27H29Domestic useShallow0.60
H10Domestic useShallow3.20H30Domestic useShallow0.67
H11Drinking and domesticDeep1.67H31Domestic useShallow1.51
H12Drinking and domesticDeep0.17H32Drinking and domesticDeep1.21
H13Domestic useShallow0.65H33Domestic useShallow1.20
H14Domestic useShallow0.85H34Drinking and domesticDeep1.73
H15Domestic useShallow0.46H35Domestic useShallow1.38
H16Domestic useShallow0.32H36Domestic useShallow1.99
H17Domestic useShallow0.13H37Domestic useShallow1.67
H18Domestic useShallow0.52H38Domestic useShallow0.57
H19Drinking and domesticDeep2.95Max 3.20
H20Domestic useShallow1.80Min 0.03
Average 1.16
Depth of the shallow well: ~400 m S. D 0.79
Depth of the deep well: 800 m and above
Table 2. Radon concentration ranges for different types of water in other countries.
LocationWater TypeRadon Concentration, CRn (Bq/L)
Sharjah, UAEGroundwater0.05–1.82 [51]
Kuwait City, KuwaitDrinking-bottle water1.02–6.05 [52]
Aden, YemenGroundwater0.33–2.67 [53]
Afyonkarahisar, TurkeyWell water0.70–31.70 [43]
JordanWell water3.10–5.10 [54]
AlgeriaDrinking-bottle water2.6–14.0 [44]
Kufa, IraqDrinking water0.0039–0.221 [55]
Karnataka, IndiaGroundwater0.14–25.40 [45]
Baita Stei, RomaniaWell water4.78–35.50 [46]
Khartoum, SudanGroundwater1.58–345.10 [47]
Bam village, IranDrinking water1.20–9.88 [48]
Baoji, ChinaDrinking water30.0–127.0 [49]
Al-Jawa, Saudi ArabiaGroundwater1.45–9.15 [39]
Al-Qassim, Saudi ArabiaGroundwater0.76–4.69 [34]
Jeddah, Saudi ArabiaGroundwater0.92–2.12 [41]
Dammam, Saudi ArabiaDrinking water0.11–9.20 [22]
Jazan, Saudi ArabiaGroundwater1.74–4.32 [42]
Hafr Al Batin,
Saudi Arabia
Groundwater0.03–3.20
(present study)
Table 3. The annual effective dose for infants, children, and adults.
Sample No.AED for Ingestion (μSv/y)AED for Inhalation (μSv/y)Total Dose (μSv/y)
AEDing (≤1 year)AEDing (2–17 year)AEDing (≥17 year)AEDinh (≥17 year)AEDT
H011.510.560.730.721.45
H020.140.050.070.070.13
H0311.164.115.395.3210.71
H046.082.242.942.905.84
H055.291.952.562.525.08
H064.711.732.272.244.52
H073.541.301.711.693.40
H085.401.992.612.575.18
H096.722.473.243.206.45
H1016.936.238.188.0616.24
H118.833.254.274.218.48
H120.910.330.440.430.87
H133.441.271.661.643.30
H144.501.652.172.144.31
H152.450.901.191.172.35
H161.670.620.810.801.60
H170.700.260.340.330.67
H182.761.011.331.312.64
H1915.615.747.547.4314.97
H209.523.504.604.549.14
H211.440.530.700.691.39
H221.210.450.590.581.16
H231.820.670.880.871.75
H248.943.294.324.268.58
H2511.484.225.545.4711.01
H2610.533.875.085.0110.10
H278.833.254.274.218.48
H2810.793.975.215.1410.35
H293.171.171.531.513.05
H303.541.301.711.693.40
H317.992.943.863.817.66
H326.402.363.093.056.14
H336.352.343.073.026.09
H349.153.374.424.368.78
H357.302.693.533.487.00
H3610.533.875.085.0110.10
H378.833.254.274.218.48
H383.021.111.461.442.89
Max16.936.238.188.0616.24
Min0.140.050.070.070.13
Average6.142.262.962.925.89
S. D4.181.542.021.994.01
Publisher’s Note: MDPI stays neutral with regard to jurisdictional claims in published maps and institutional affiliations.

