Article

Study on the Disintegration Characteristics and Mechanism of Modified Dispersive Soil Based on the C-S-H Synthesis Principle

1
College of Water Resources and Architectural Engineering, Northwest A&F University, Yangling 712100, China
2
Institute of Geotechnical Engineering/Museum of Problematic Rock and Soil, Northwest A&F University, Yangling 712100, China
*
Author to whom correspondence should be addressed.
Sustainability 2022, 14(21), 14370; https://doi.org/10.3390/su142114370
Submission received: 3 October 2022 / Revised: 31 October 2022 / Accepted: 31 October 2022 / Published: 2 November 2022

Abstract

:
Since dispersive soil has the characteristic of dispersing and disappearing when making contact with water, lime, fly ash, and cement are often used to modify dispersive soil in engineering. This often causes environmental pollution. Current studies tend to search for environmentally friendly modification methods. A new Ca−Si-modified dispersive soil method was proposed based on the synthesis principle of calcium silicate hydrate (C-S-H). Pinhole, mud ball, dispersion, and disintegration tests were used to investigate the modification effect and physical, chemical, and microscopic tests were used to investigate the mechanism. The results show that the dispersivity of soil can be eliminated by using 0.8% CaO or 4% nanosilica. The dispersivity of Ca−Si-treated soil can be eliminated at a 0.5 C/S and a 1% solid dosage. The disintegration characteristics of CaO-modified and Ca−Si-modified soils are different from those of dispersive soil. The final disintegration time of CaO-modified soil was shortened, and the disintegration rate was stable. The Ca−Si-modified soil had the best disintegration resistance at a 0.5 C/S and a 2% solid dosage. With the increase in the C/S, the disintegration resistance was reduced. The mechanism of Ca−Si-modified soil includes reducing the pH and exchangeable sodium percentage and generating calcium silicate hydrate cement. The results show that the Ca−Si treatment method based on the C-S-H synthesis principle can effectively eliminate soil dispersivity and improve disintegration resistance, which can theoretically support the reduction in contamination caused by traditional materials and improve engineering safety.

1. Introduction

Dispersive soil easily disperses in deionized water or environmental water and has poor resistance to water erosion, meaning that it easily causes damage to pipe, gutters, and poses other severe threats to safety. Casagrande [1] and Gutiérrez [2] found that many reservoir dams using dispersive soil as impervious materials suffered from the piping effect. Premkumar [3] proposed that the presence of dispersive soil in embankment soils can cause contact erosion damage. The dispersion mechanism of dispersive soil is complex; Flecther [1], Ingles [4], and Sherard [5] suggested that exchangeable sodium ions and montmorillonite are the causes of soil dispersivity. Holmgren believed that dispersive soil contained high sodium ions [6]. Due to the complexity of dispersive soil, comprehensive identification is currently used to determine dispersivity. Conventional laboratory tests are cumbersome and laborious. Tao [7] proposed a method to quickly and accurately evaluate the dispersivity of fine-grained soil; the mud ball test was substituted for the crumb test in that study. If the clay content is lower than 10%, the results of the mud ball test should be used as the basis of dispersivity and if the clay content is greater than 10%, the results of the mud ball test and the pinhole test should be used as the basis of dispersivity; the most dispersive result should be used as the dispersivity discrimination criterion. The double hydrometer test, the pore water test, and the exchangeable sodium percentage test are only used as explanatory tests for the dispersive mechanism of soil and are no longer used for comprehensive discrimination.
Depending on the dispersive mechanism, various methods can be used to reduce or eliminate dispersivity to ensure engineering safety. Traditional materials such as lime [8], fly ash [9,10], and cement [11,12] have been shown to have modified dispersivity, but these materials are more ecologically damaging. The prevailing focus of research is on finding an environmentally friendly modified material. With the research and application of new materials, a series of new materials and technologies, such as calcium lignosulfonate [13], silica fume [14], nanosilica [15], xanthan gum [16,17], MICP [18] (microbially-induced carbonate precipitation), have been applied to modify dispersive soil with effective results.
Disintegration refers to a property of soil that disintegrates when it is wetted with water. The study of soil disintegration is of great significance to the fields of engineering safety and soil and water conservation. Li [19] and Wang [20] used in-situ disintegration tests and laboratory disintegration tests to study the disintegration characteristics of loess. There are three stages in the disintegration process: wetting, softening, and sinking. The soil sample’s morphology and initial moisture content all affect the loess’s disintegration process. Zhang [21] investigated the effect of water content on the disintegration characteristics of loamy soils and concluded that the disintegration rate of soil samples was faster with lower water contents. Chen [22] studied the dispersivity and disintegration characteristics of dispersive soil under different soil−water−electrolyte systems and found that the disintegration process of dispersive soil differs significantly from that of non-dispersive soil. Different electrolyte environments could influence the disintegration characteristics of dispersive soil, and the specific disintegration characteristics of dispersive soil may be a cause of the rapid destruction of engineering.
Calcium silicate hydrate (C-S-H) is a product of the process of cement hydration and it plays a vital role in the performance of cement paste and concrete. C-S-H is mainly produced by the hydration of complex minerals, such as C3S and C2S, in cement and it can also be synthesized artificially by selecting suitable calcium and silicon materials. The main methods for the synthesis of single-phase C-S-H include the hydrothermal method, the alkali silicate−calcium salts method, and the single mine hydration method [23]. The gel morphology of C-S-H is dependent on the raw material, the calcium silicate ratio (C/S), and the reaction time and it mainly takes on the form of a nanoscale porous non-crystalline structure [24].
Currently, in engineering and research, soil treatment is more focused on environmental protection and energy-saving purposes. Traditional materials such as lime, cement, and fly ash consume significant energy in the production process and cause environmental damage. Therefore, this study is dedicated to finding an environmentally friendly treatment method for dispersive soil. The C-S-H synthesis principle from SiO2 and CaO for soil treatment is not well-studied and should be further researched; the disintegration of dispersive soils is also not well-studied. Therefore, this study proposes a method for the modification of dispersive soil based on the SiO2−CaO synthesis C-S-H principle. In this study, the dispersivity discrimination test and the disintegration test were used to investigate the effects of the C/S and proportion on the dispersivity and disintegration of dispersive soil, while physical, chemical, and microscopic tests were used to investigate the mechanism.

2. Materials and Methods

2.1. Soil

The soil used in this experiment was taken from a construction site on the south side of Meng Yang Road, Yangling District, Shaanxi Province, China, (34°16′48″ N,108°3′50″ E) at a depth of about 5 m. Yangling loess is a non-dispersible soil. After the soil was air-dried and crushed and residual plant roots were removed, a Na2CO3 solution with a dry soil mass fraction of 0.16% was prepared and added to the soil to match the water content of the soil to the liquid limit; it was then stirred well and left for several days to make it dispersible [25]. The basic physicochemical properties of the soil and the dispersivity discrimination tests results are shown in Table 1. The soil samples were classified as dispersive soil.

2.2. Materials

The nanosilica was produced by Shanghai Macklin Biochemical Co., Ltd. (Shanghai, China) with a purity of 99.5%, an average particle size of 15 ± 5 nm, a density of 2.6 g/mL, and a specific surface area of 250 ± 30 m2/g in powder form. The calcium oxide adopted the analytical reagent calcium oxide produced by Xilong Scientific Co., Ltd. (Shantou, China) where the CaO content was ≥98.0% in powder form.

2.3. Methods

2.3.1. Test Design

Table 2 shows the soil sample number, materials, and dosage design in this study. For this study, nanosilica (NS) and calcium oxide were chosen as the modified materials and the calcium silicate ratio (C/S) and solid dosages were set as test variables to investigate the effect of different C/S and solid dosages on the modification of dispersive soil. A control group using nanosilica and calcium oxide alone was set up. The calcium silicon ratio refers to the molar ratio of CaO to SiO2 and the solid dosage means the total mass of the two as a percentage of the dry soil mass. The dosage for the control group refers to the mass of a single material as a percentage of the dry soil mass. Values of the initial CaO and nano-SiO2 content as a percentage of dry soil mass for each C/S and solid dosage are shown in Table 3. Using the A-1 soil sample as an example, explanation of the parameters in Table 3 are as follows: the C/S of the A-1 soil sample is 0.5, meaning that the molar ratio of CaO to SiO2 is 0.5:1. Taking the molar mass of CaO to be 56 g/mol and SiO2 to be 60 g/mol, the molar mass ratio of the two is 7:15. Assuming 100 g of completely air-dried soil is taken, a 1% solid dosage means that the total mass of CaO and SiO2 at this point is 1 g. Calculating each dosage according to the ratio of 7:15 and keeping two decimals, the mass of CaO is 0.32 g and the mass of SiO2 is 0.68 g. Therefore, each initial ratio was 0.32 and 0.68%, extending to other soil samples.
The modified soil samples were prepared as follows: the test group first weighed nano-SiO2 and CaO according to the C/S and solid dosage; it was mixed with deionized water at a water–solid ratio of 10:1 and stirred for 1 min. The slurry was left to stand for 24 h and then mixed with the soil at the optimum moisture content. In the control group, the dry soil was mixed with CaO- or nano-SiO2-powdered soil, and the soil was prepared with deionized water to the optimum moisture content.

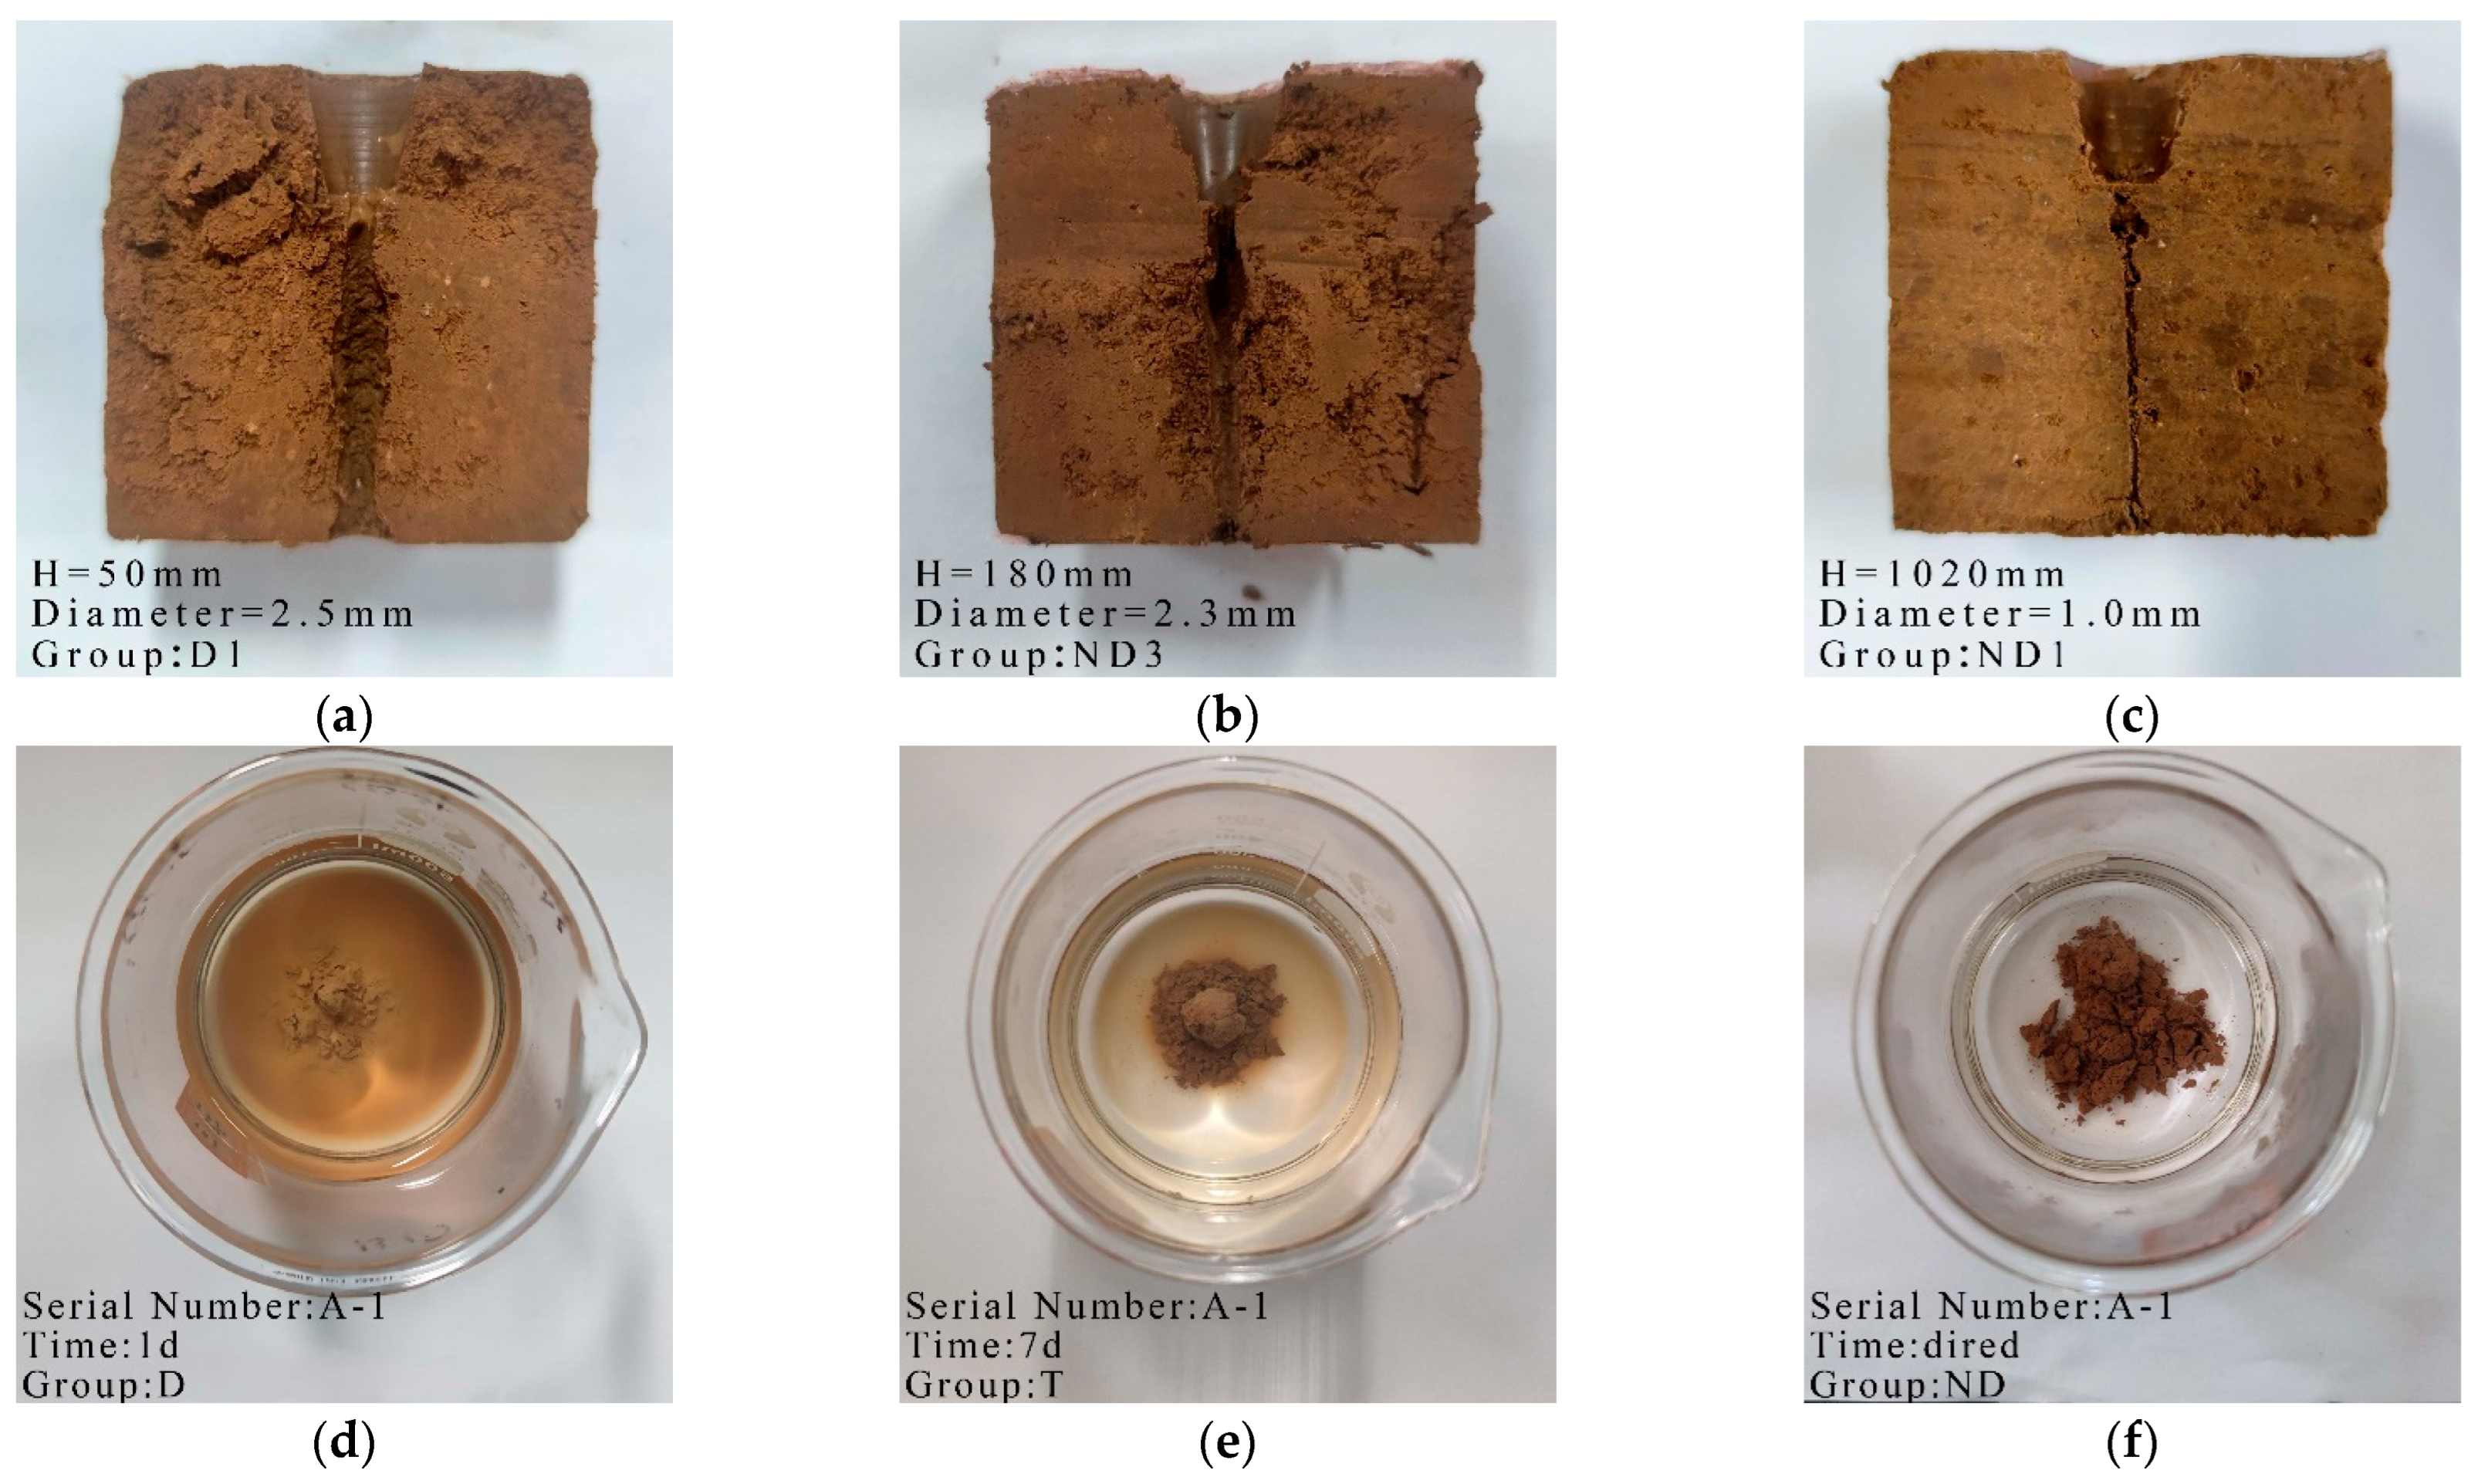
2.3.2. Dispersivity Discrimination Tests

The pinhole test in this study was based on the ASTM D4647 [26] and “Study of dispersive soil” [27]. The soil sample was compacted to a certain degree to make a sample φ38.1 mm × 40 mm in size, and distilled water was passed through a 1 mm hole in the middle of the soil sample under 50, 180, 380, and 1020 mm heads. Changes in water color, flow rate, and pore size were recorded. The mud ball test is an improvement on the crumb test in the ASTM D6572 [28]. Referring to the mud ball test method used in the study by Tao [7], the soil needs to be finely ground and passed through a 2 mm sieve, stirred into a homogeneous paste with deionized water, massed into clay balls of about 1 cm3, and placed in deionized water to judge its dispersivity.
The pinhole test and the clay ball test results were used as criteria for the determination of soil dispersivity and the most unfavorable result was used as the final determination factor. The mud ball test was used to investigate the change in the dispersivity of the soil from preparation to air drying, with samples taken at 1 d, 3 d, and 7 d and then completely air-dried. The final determination was made by the results of the mud ball test when the soil sample was completely air-dried. The test discrimination criteria are shown in Table 4.

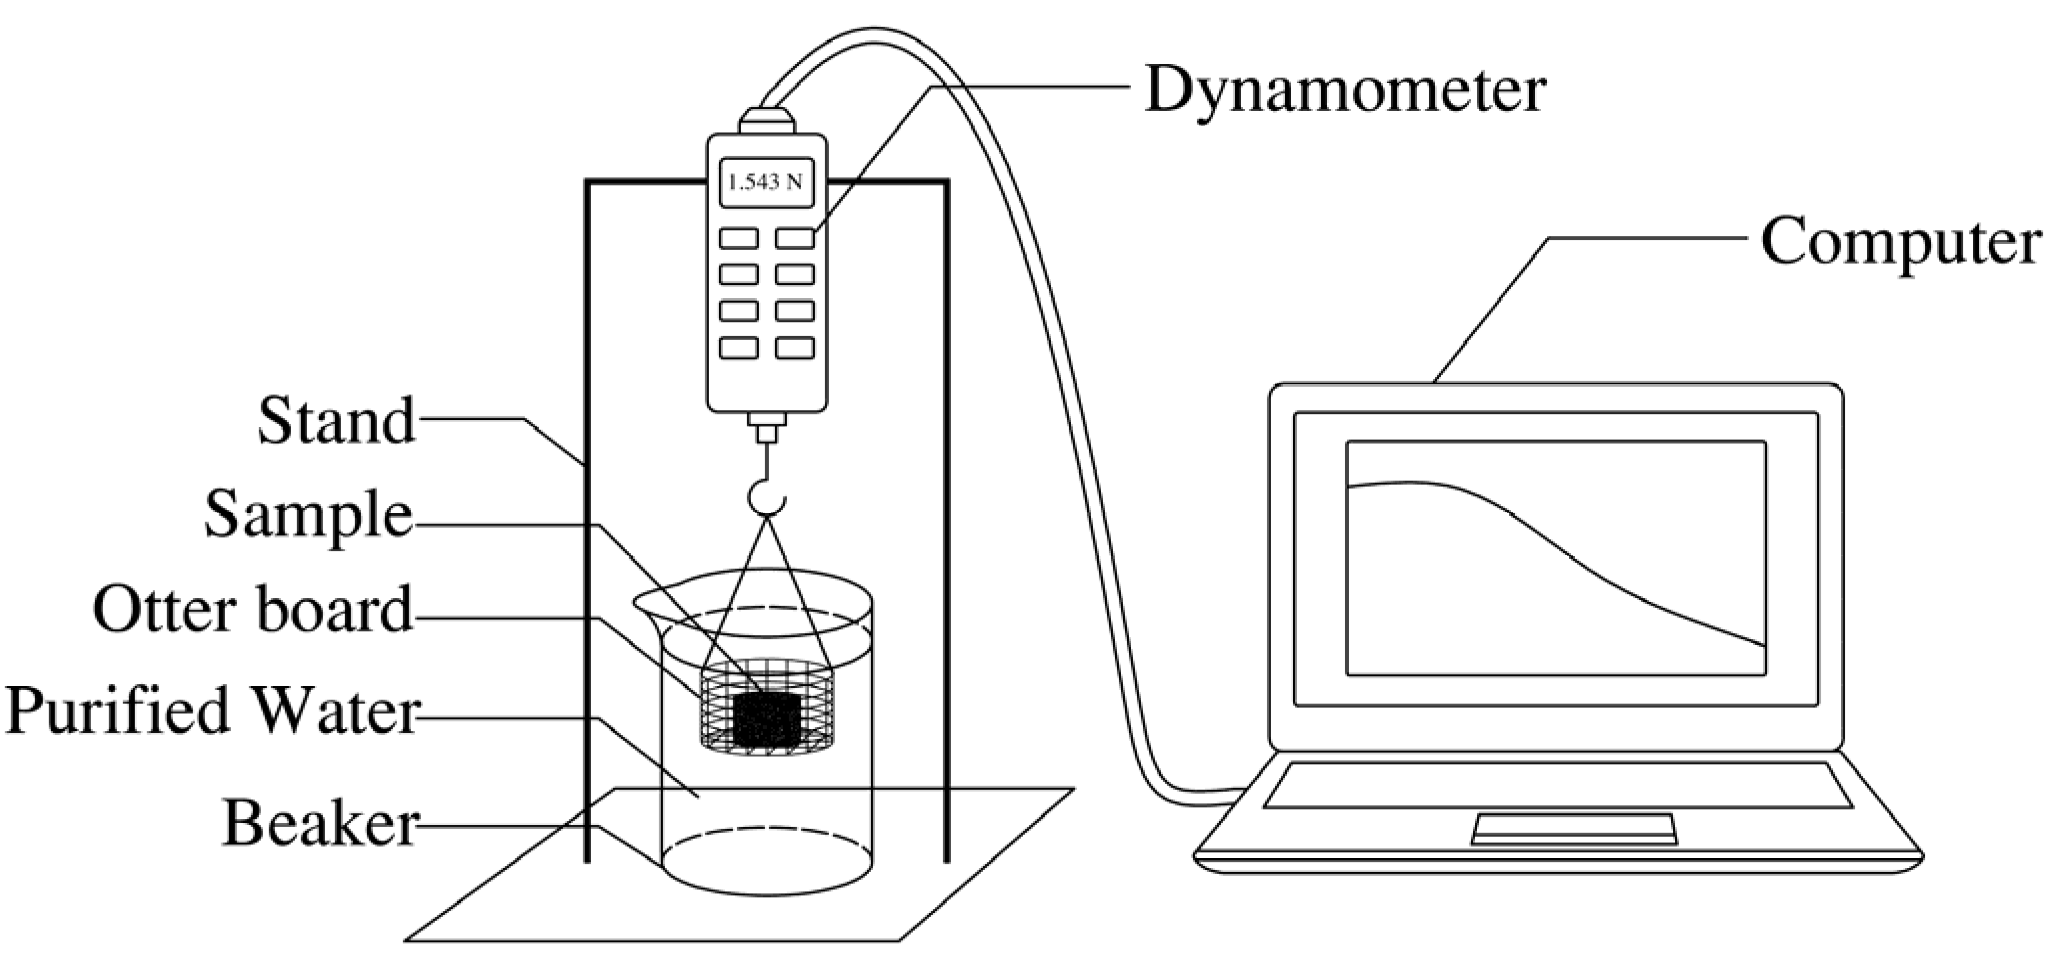
2.3.3. Dispersion and Disintegration Test

The dispersion and disintegration test was carried out with reference to the Standard for Geotechnical Testing Method (GBT 50123–2019) [29]. The disintegration rate of the specimen was determined by self-made dispersion and disintegration tester.. The soil was compacted to a certain degree and made into a column with a size of φ38.1 mm × 40 mm. The dispersion and disintegration tester is shown in Figure 1.
The disintegration rate refers to the soil sample’s degree of disintegration at a given time. The formula for the disintegration rate at a given moment is shown in Equation (1):
A t = F 0 F t F 0 F z × 100 %
where At is the disintegration rate at the moment t, F0 is the tensiometer reading at the initial moment, Ft is the tensiometer reading at the moment t, and Fz is the tensiometer reading at the final moment. The disintegration velocity is obtained from the first-order derivative of the disintegration rate–time curve.

2.3.4. Mechanism Tests

The laser particle size analysis test was carried out using a Mastersizer 2000E laser particle size analyzer from Malvern Panalytical (Malvern, UK). In order to avoid damaging the cement produced in the soil, the test was carried out without ultrasonic dispersion.
The pH test used the PHS–3C precision pH meter from Shanghai REX (Shanghai, China). The conductivity test used the DDS–11A conductivity meter from Shanghai REX. Soil samples were mixed with pure water to form a soil–water suspension at a soil–water mass ratio of 1:5, shaken thoroughly, and left to stand for 30 min before measurement.
The exchangeable sodium percentage test was carried out according to the method in “Study of dispersive soil” [27]. Cation exchange capacity (CEC) was extracted using the sodium acetate method. CNa+ was extracted by the NH4OAc–NH4OH method. Both CEC and CNa+ were measured for sodium ions using a ZA3000 atomic absorption spectrometer from Hitachi, Japan. The formulae for CEC, CNa+, and ESP are given in Equations (2)–(4).
CEC = K n V 23 m d × 0.1
C Na + = K n V 23 m d × 0.1
ESP = C N a + CEC × 100 %
where Kn is the sodium ion content of the solution to be measured, as found from the sodium standard curve, in mg/L; V is the constant volume of the measured solution, mL; 23 is the molar mass of the sodium ion in g/mol; md is the drying soil mass in g; and 0.1 is a factor used to convert mmol to cmol.
The FT–IR (Fourier transform infrared reflection) test used the Thermo Nicolet iS50 Fourier Transform Infrared Spectrometer (Thermo Fisher Scientific, Waltham, MA, USA). The test sample was dried and prepared using the potassium bromide tablet press method. The test samples for the scanning electron microscope (SEM) were cold-dried using an Epsilon 2-4 LSC (Martin Christ, Osterode, Germany) plus vacuum freeze dryer and observed with a Hitachi S–4800 field emission scanning electron microscope (Tokyo, Japan).

3. Results and Discussion

3.1. Dispersivity Tests Result Analysis of Modified Soil

3.1.1. Effect of CaO on Soil Dispersivity

Images of the mud ball test and pinhole test for dispersive, transitional and non-dispersive soils are shown in Figure 2. The test results on the effect of CaO on soil dispersivity are shown in Table 5. The table shows that the soil still exhibited dispersivity at a CaO dosage below 0.8%. The soil exhibited dispersivity at 0.4% CaO and a transition at 0.6% CaO, and the mud ball test gave the same results as the pinhole test. The soil dispersivity was eliminated at dosages of 0.8% Cao and above. The mud ball test showed that the soil dispersivity did not change at all the dosage levels during air drying. CaO can react with water to form Ca2+ within one day and exerts a cation exchange effect to eliminate dispersivity.

3.1.2. Effect of Nano-SiO2 on Soil Dispersivity

The test results on the effect of SiO2 on soil dispersivity are shown in Table 5. The results of both tests show that the soil exhibited dispersivity below 3.0% SiO2, and the dispersivity was eliminated at 4.0% SiO2. The mud ball test showed that the dispersivity of the soils at 3.0 and 4.0% SiO2 gradually decreased during air drying. From the test results, it is assumed that the slow chemical reaction of the SiO2 with the small amount of Ca2+ present in the soil produced a certain amount of C-S-H colloid [15] and the cementation of the C-S-H reduced the soil dispersivity. The results of this study differ from the optimum modified doping of 1% SiO2 derived from a study by Vakili [15]. Due to the high sodium chemical dispersive soil in this test, there were few free Ca2+ or soluble calcium compounds. SiO2 has less of an opportunity to react chemically with Ca2+ in the soil, making it difficult to generate C-S-H cementation, resulting in poor modification at lower SiO2 dosages.

3.1.3. Effect of the C/S and Solid Dosage on Ca–Si-Treated Soil Dispersivity

The dispersivity test results of the Ca–Si-treated soil are shown in Table 5. The test results show that the soil samples were non-dispersive at all C/S and solid dosages, but the dispersivity varied during air drying. The mud ball test showed that the soil samples with all C/S were non-dispersive at 1 d for the solid dosage at 2.0% and above. It is assumed that this result was related to the initial CaO content. The initial CaO content of the five soil samples was greater than 0.9%, except for the A-2 specimen, for which it was 0.64%. If the amount of CaO involved in the reaction is not considered, the initial CaO content of the five soil samples exceeded the optimum admixture of CaO-modified dispersive soil; therefore, the samples showed an excellent modification effect at 1 d. The initial CaO and SiO2 contents of all three soil samples at a 1% solid dosage were lower than the optimum dosage of the two. Of the three soil samples, the A-1 specimen showed dispersivity over 3 d and the dispersivity decreased to transition at 7 d. The B-1 specimen showed dispersivity at 1 d and the dispersivity decreased to transition at 3 d and 7 d. The C-1 specimen showed transition at 1 d and the dispersivity was eliminated at 3 d. The dispersivity of all three soil samples was completely eliminated after air drying.
In summary, the modification effect improved with the increasing solid dosage. The modification effect gradually enhances with increasing C/S over 7 d. This was related to the increase in free Ca2+ content when the C/S increased. The higher the Ca2+ content, the more fully SiO2 reacts with it and the stronger the cation exchange effect.

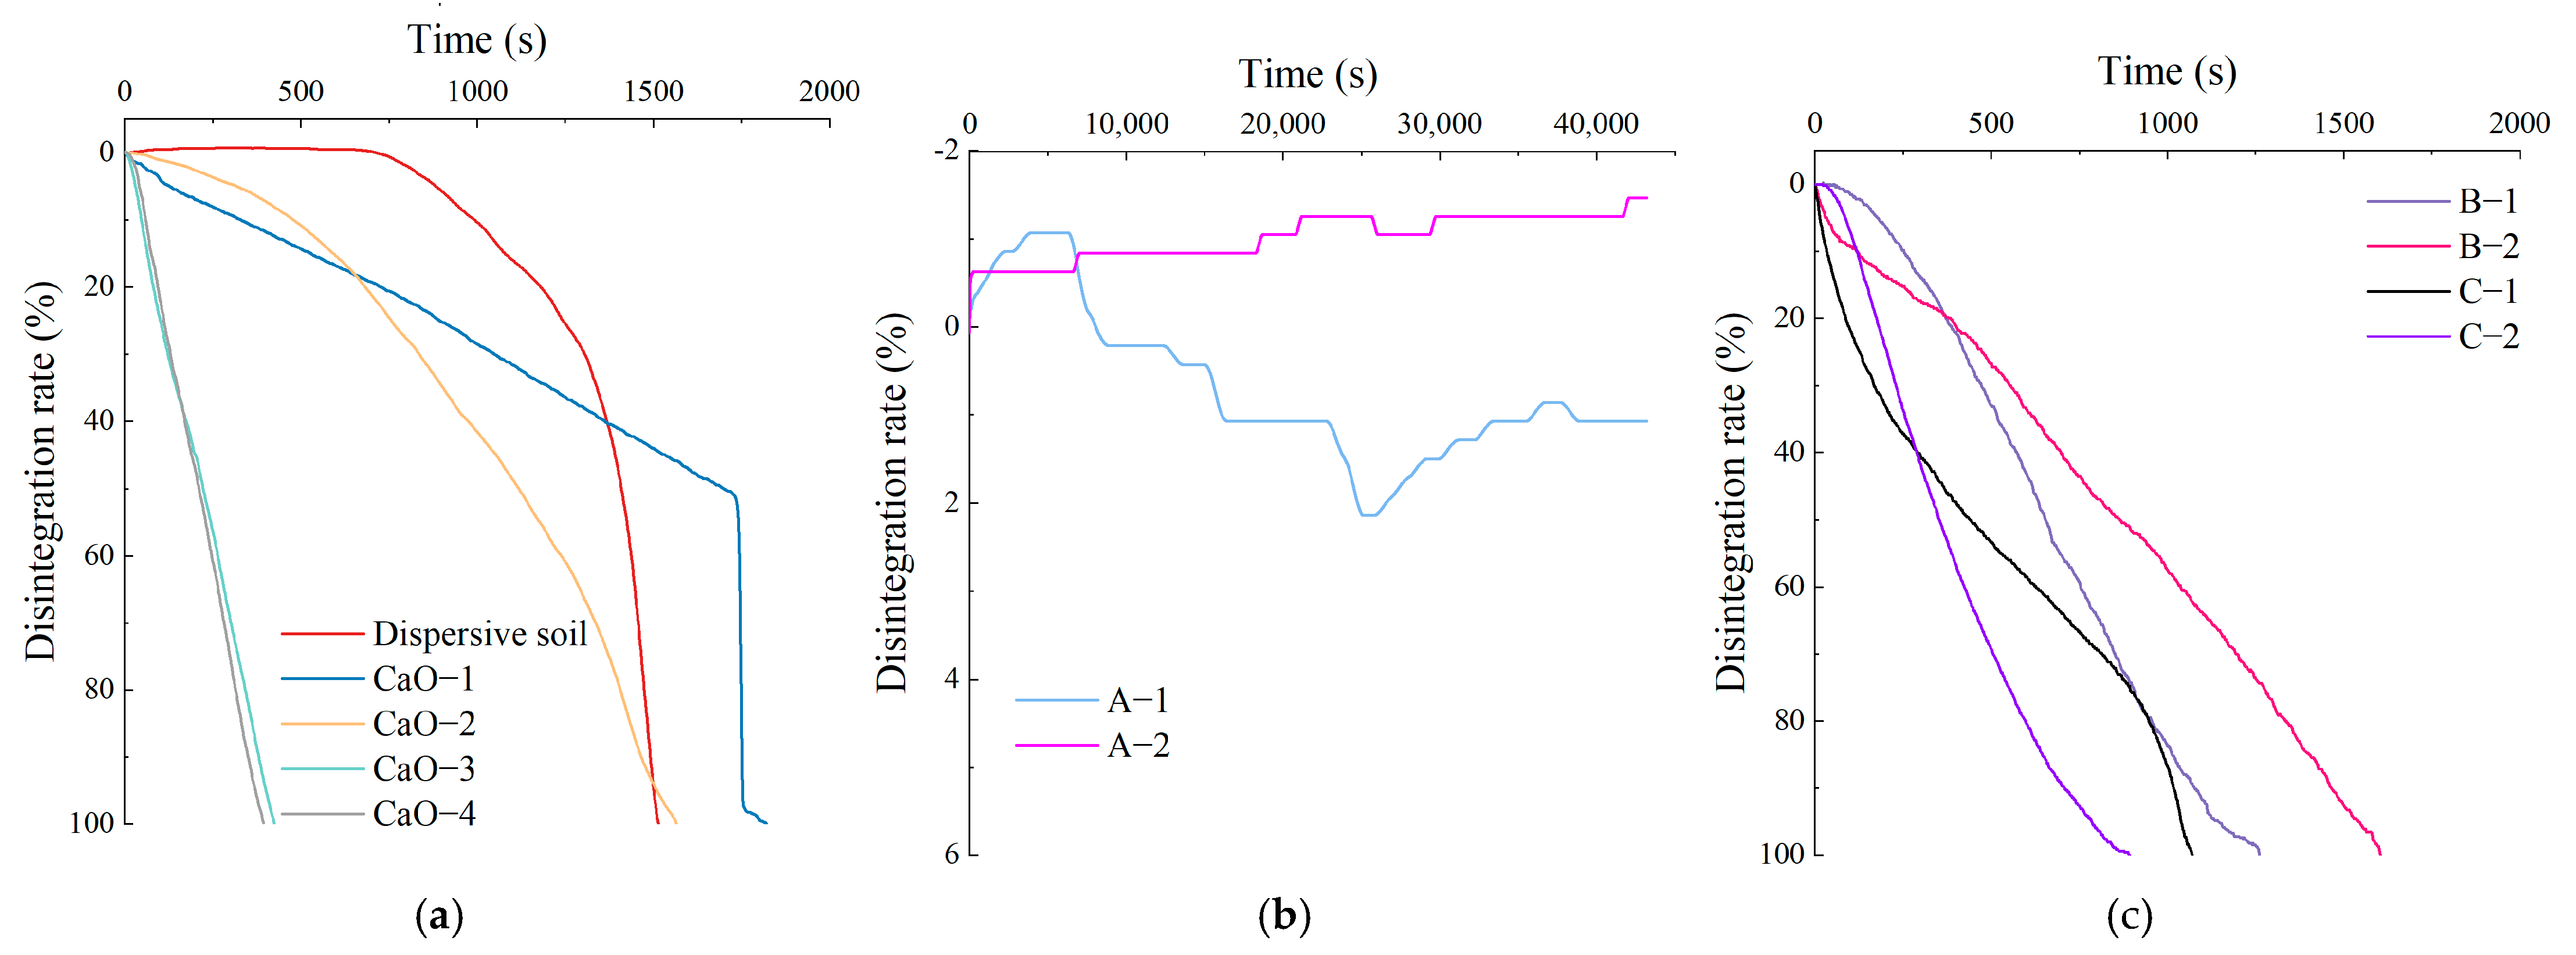
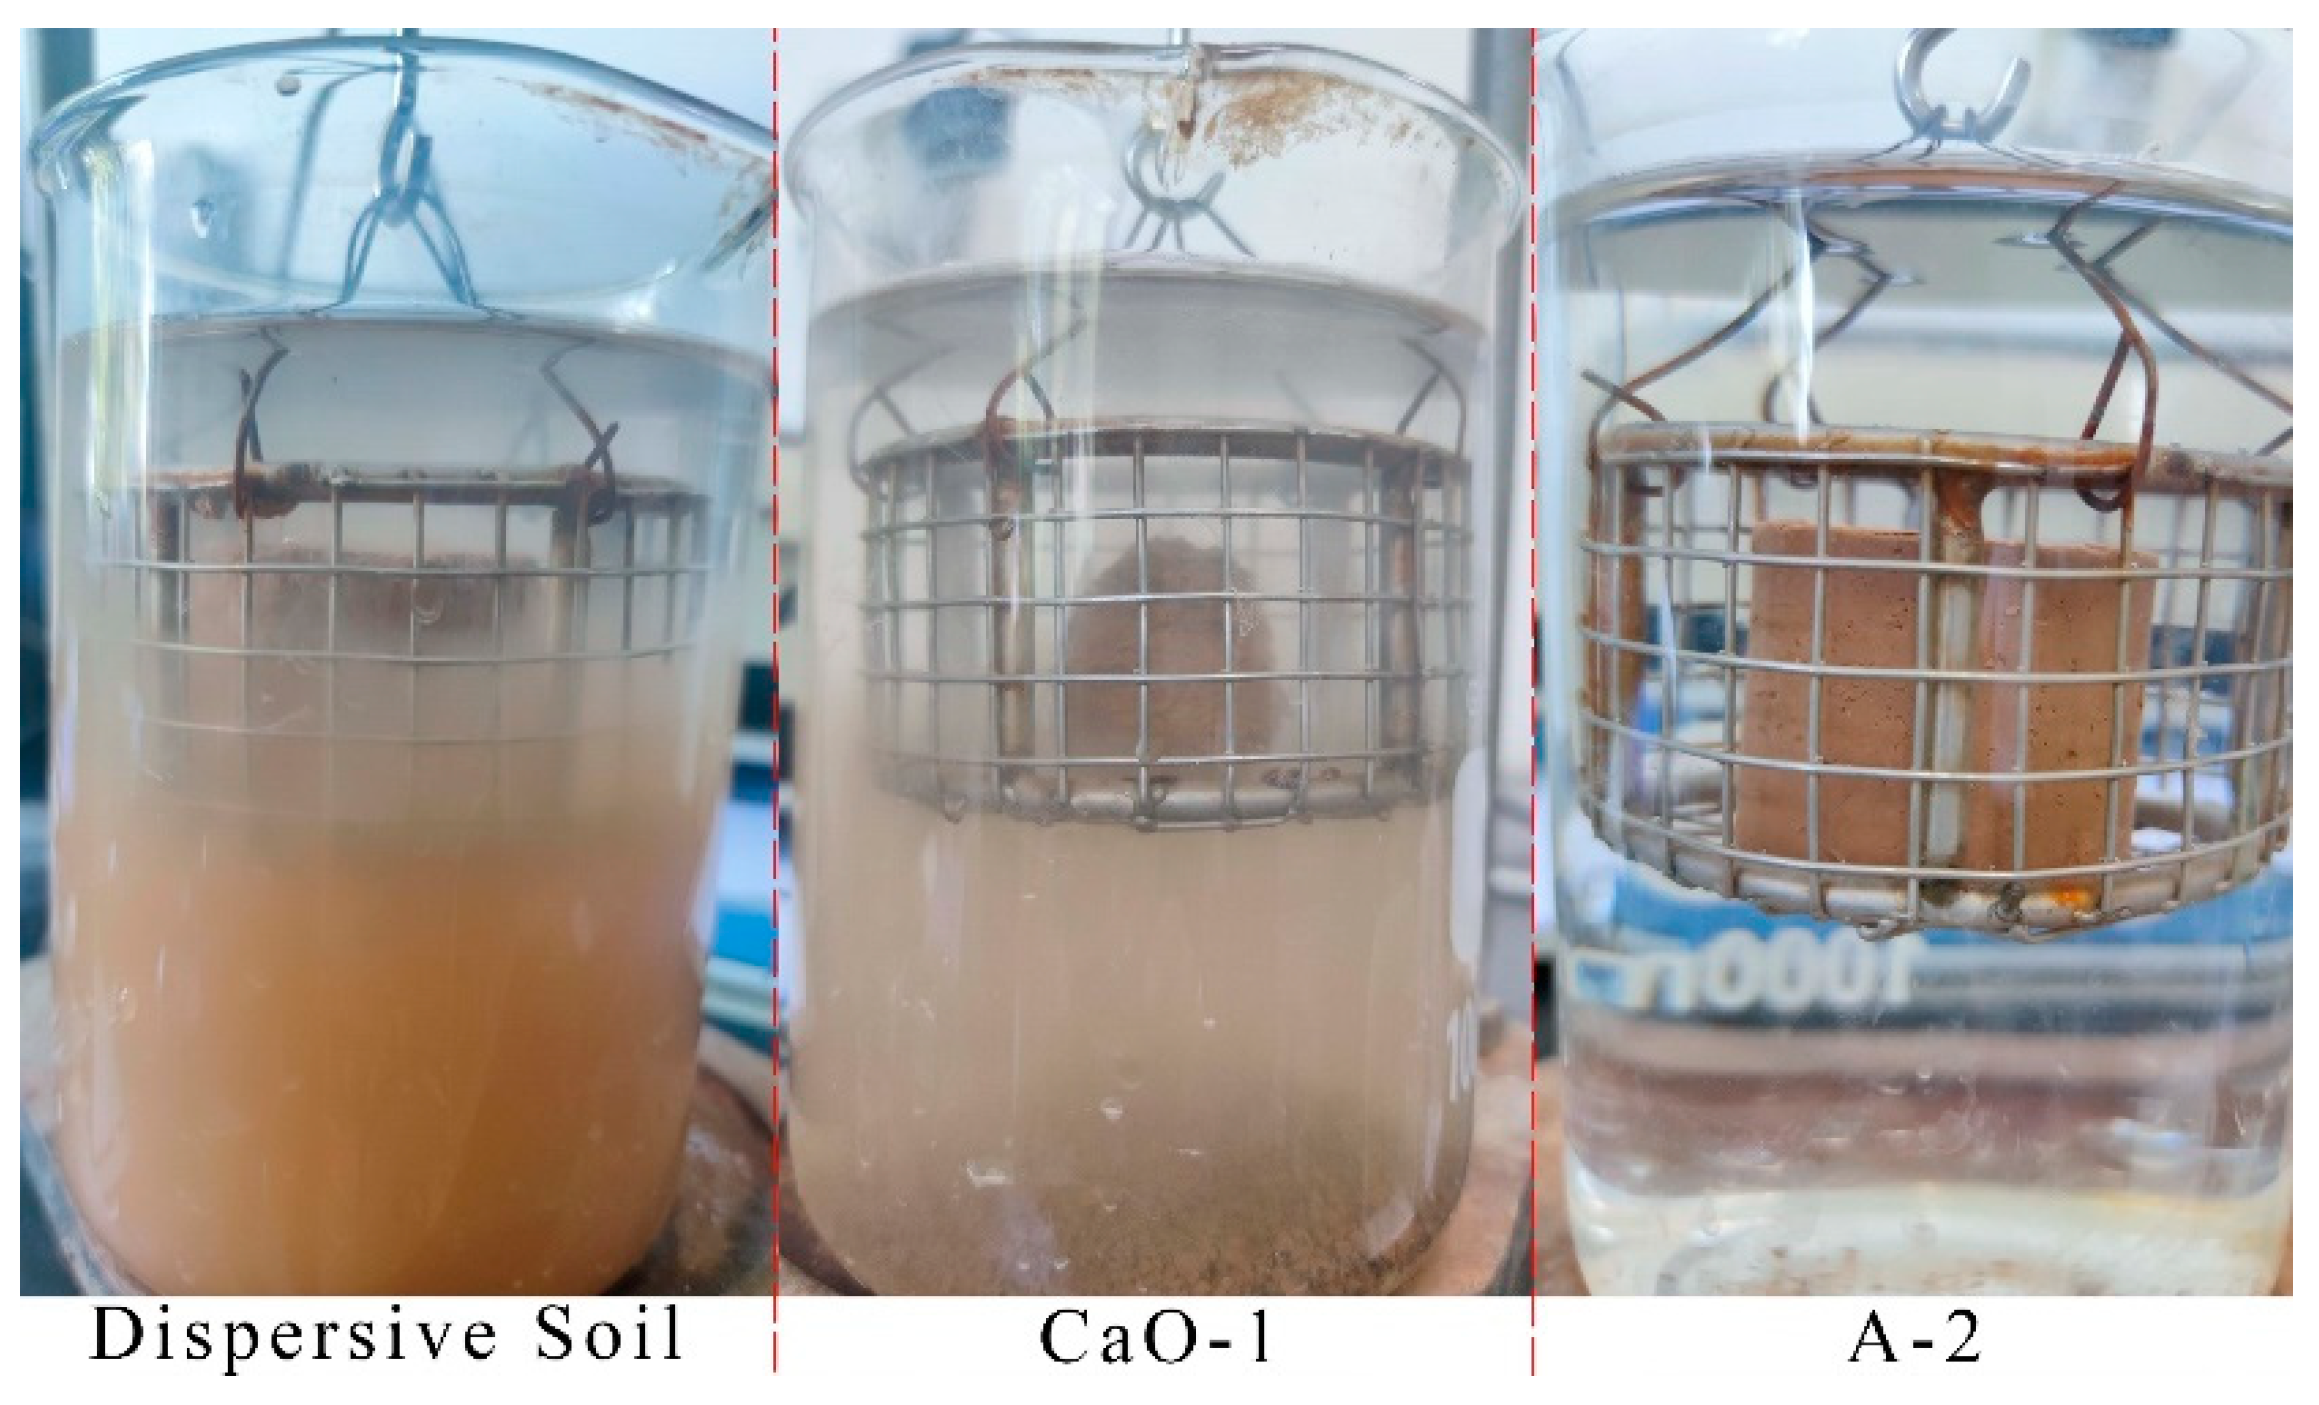
3.2. Dispersion and Disintegration Test Result Analysis of Modified Soil

The disintegration characteristics of Ca–Si-treated soils with solid dosages below 2% were investigated through a dispersion and disintegration test and compared with those of CaO-treated soil and dispersive soil. The disintegration rate–time curve is shown in Figure 3, the images of the three different disintegration patterns of the soil samples are shown in Figure 4, and the results of the disintegration test parameters are shown in Table 6.
The disintegration rate–time curve for the dispersive soil is shown in Figure 3a. There are two stages in the disintegration process of dispersed soil. The first stage is water absorption saturation and slow disintegration and the late stage is rapid collapse and disintegration over a short time. The disintegration rate of the soil sample was negative in the early stages, indicating that the soil sample absorbed water and swelled at this time. During this process, the clay particles of the soil sample precipitated rapidly and a cloudy haze gradually appeared in the water; a layer of fine soil particles was deposited at the bottom of the beaker. The disintegration rate started to increase at 750 s as the outer layer of clay particles was disintegrated entirely into the water environment and the large particles lost their inter-particle adhesion and started to collapse, thus exposing the interior of the soil sample to the water; then, the internal clay particles started to disperse and disintegrate. The disintegration velocity increased rapidly after 1400 s, with a maximum value of 0.621%/s. At this point, the clay particles in the soil sample were close to being completely dispersed and precipitated and the residual soil particles showed rapid slip disintegration due to the loss of cohesion.
The disintegration rate–time curve for the CaO-treated soil is shown in Figure 3a. Since the 0.4% CaO soil sample was still dispersive, the disintegration characteristics were similar to those of a dispersive soil with a sudden change in the disintegration velocity, but without the obvious slow disintegration phase of water absorption saturation. The soil sample disintegrated at a relative velocity up to 50.3% in the first stage and the clay particles were completely dispersed and precipitated by 1721 s, after which it showed characteristics of rapid slip disintegration. The 0.6% CaO soil sample was transitional soil with suppressed dispersivity and its disintegration characteristics changed. There was no obvious sudden change in the disintegration velocity on the curve, and the maximum disintegration velocity dropped below 0.2%/s. The phenomenon was characterized by the simultaneous occurrence of clay particles dispersing and blocky structures crumbling. The dispersivity of the soil samples with 0.8% CaO and above was eliminated. The soil samples exhibited a slide disintegration of large particles and no longer showed significant cloud-like suspended clay particles in the water. The curve was basically straight, the disintegration velocity was stable, the average disintegration velocity was close to the maximum disintegration velocity, and the complete disintegration time was reduced to about 400 s.
The disintegration rate–time curves for the Ca–Si-treated soil are shown in Figure 3b,c. The curve times for the A-1 and A-2 were only calculated up to 43,200 s as the instrument readings no longer varied after the soil samples had been placed in water for 12 h. The test results show that the soil sample had the best disintegration resistance at a C/S of 0.5, which worsened as the C/S increased. The A-1 soil sample showed only a small amount of flaking or block spalling, which allowed the soil to come into contact with water internally and permitted a certain amount of water absorption to occur. The soil sample stopped disintegrating at 12 h and reached a stable state, with a final disintegration rate of 1.07%. The A-2 soil sample did not disintegrate within 12 h; only a minute quantity of flaky soil particles was present on the surface. The final disintegration rate of −1.46% at 12 h was due to the water absorption and swelling that occurred during the process, and the weight of the soil sample increased. At a C/S of 1 or 1.5, all four soil samples disintegrated completely and the larger the C/S, the worse the disintegration resistance and the shorter the complete disintegration time. Nevertheless, the disintegration velocity was smoother and the final disintegration time was longer than for the CaO-treated soils. In summary, the Ca–Si-treated soil improved the disintegration resistance of the dispersive soil after modification due to the generation of effective C-S-H cementation within the soil. The soil sample with a C/S of 0.5 and a 2% solid dosage showed the best resistance to disintegration. The disintegration resistance became weaker at a high C/S. This study suggests that combined with the disintegration characteristics of the CaO-treated clays, the residual Ca(OH)2 reduces the disintegration resistance.
The modification significantly alters the disintegration characteristics of dispersive soil. In general, the disintegration velocity of the soil tends to be stable after the dispersibility is eliminated by soluble calcium and potassium compounds; the disintegration rate–time curve becomes smoother and no longer shows the abrupt changes characteristic of dispersive soil, but resistance to disintegration is usually poor. The results of the tests show that soil samples with a C/S of 0.5 are much more resistant to disintegration, indicating that the C-S-H produced under these conditions is more effective in the formation of a cementing substance between soil particles.

3.3. Mechanism Tests Result Analysis

3.3.1. Results of the Laser Particle Analysis Test

Dispersive soil and eight groups of modified soils were selected for the laser particle size analysis. The test investigated the agglomerate structure characteristics of the soil samples modified by CaO and Ca–Si. The calculated particle volume composition is shown in Table 7.
The test results show that the dispersive soil particles are concentrated in the range of 5~75 μm and the volume fraction of the large particles only accounts for 19.1%. This indicates that dispersive soil has a loose agglomerate structure and is not firmly cemented, making it more susceptible to dispersion by the action of water, which is manifested macroscopically by the mass precipitation of clay particles when exposed to water. After modification by CaO, the soil particles below 75 μm in size were significantly reduced and those above 75 μm were significantly increased. This suggests that CaO has the effect of promoting the agglomeration of soil particles. However, the test results show that the content of clay particles below 5 μm was reduced, indicating that the cementation between large particles was weakened. This caused the CaO-treated soil to exhibit the disintegration characteristic of large particle slips and increased disintegration rates.
The percentage of particles smaller than 5 μm did not change significantly in the Ca–Si-treated soil samples, the particles between 5 and 75 μm decreased, and the particles larger than 75 μm increased significantly. The trend became more obvious as the C/S increased. Compared to the CaO-treated soils, the Ca–Si-modified soils with particles smaller than 5 μm did not show a significant reduction, but the content tended to decrease as the C/S increased. Combined with the characteristics of the soil samples in the dispersion and disintegration test, this study inferred that the larger the C/S, the more pronounced the cohesive and unifying effect of the soil particles; however, the weakening of the association between the larger particles led to a decrease in the disintegration resistance of the soil samples.

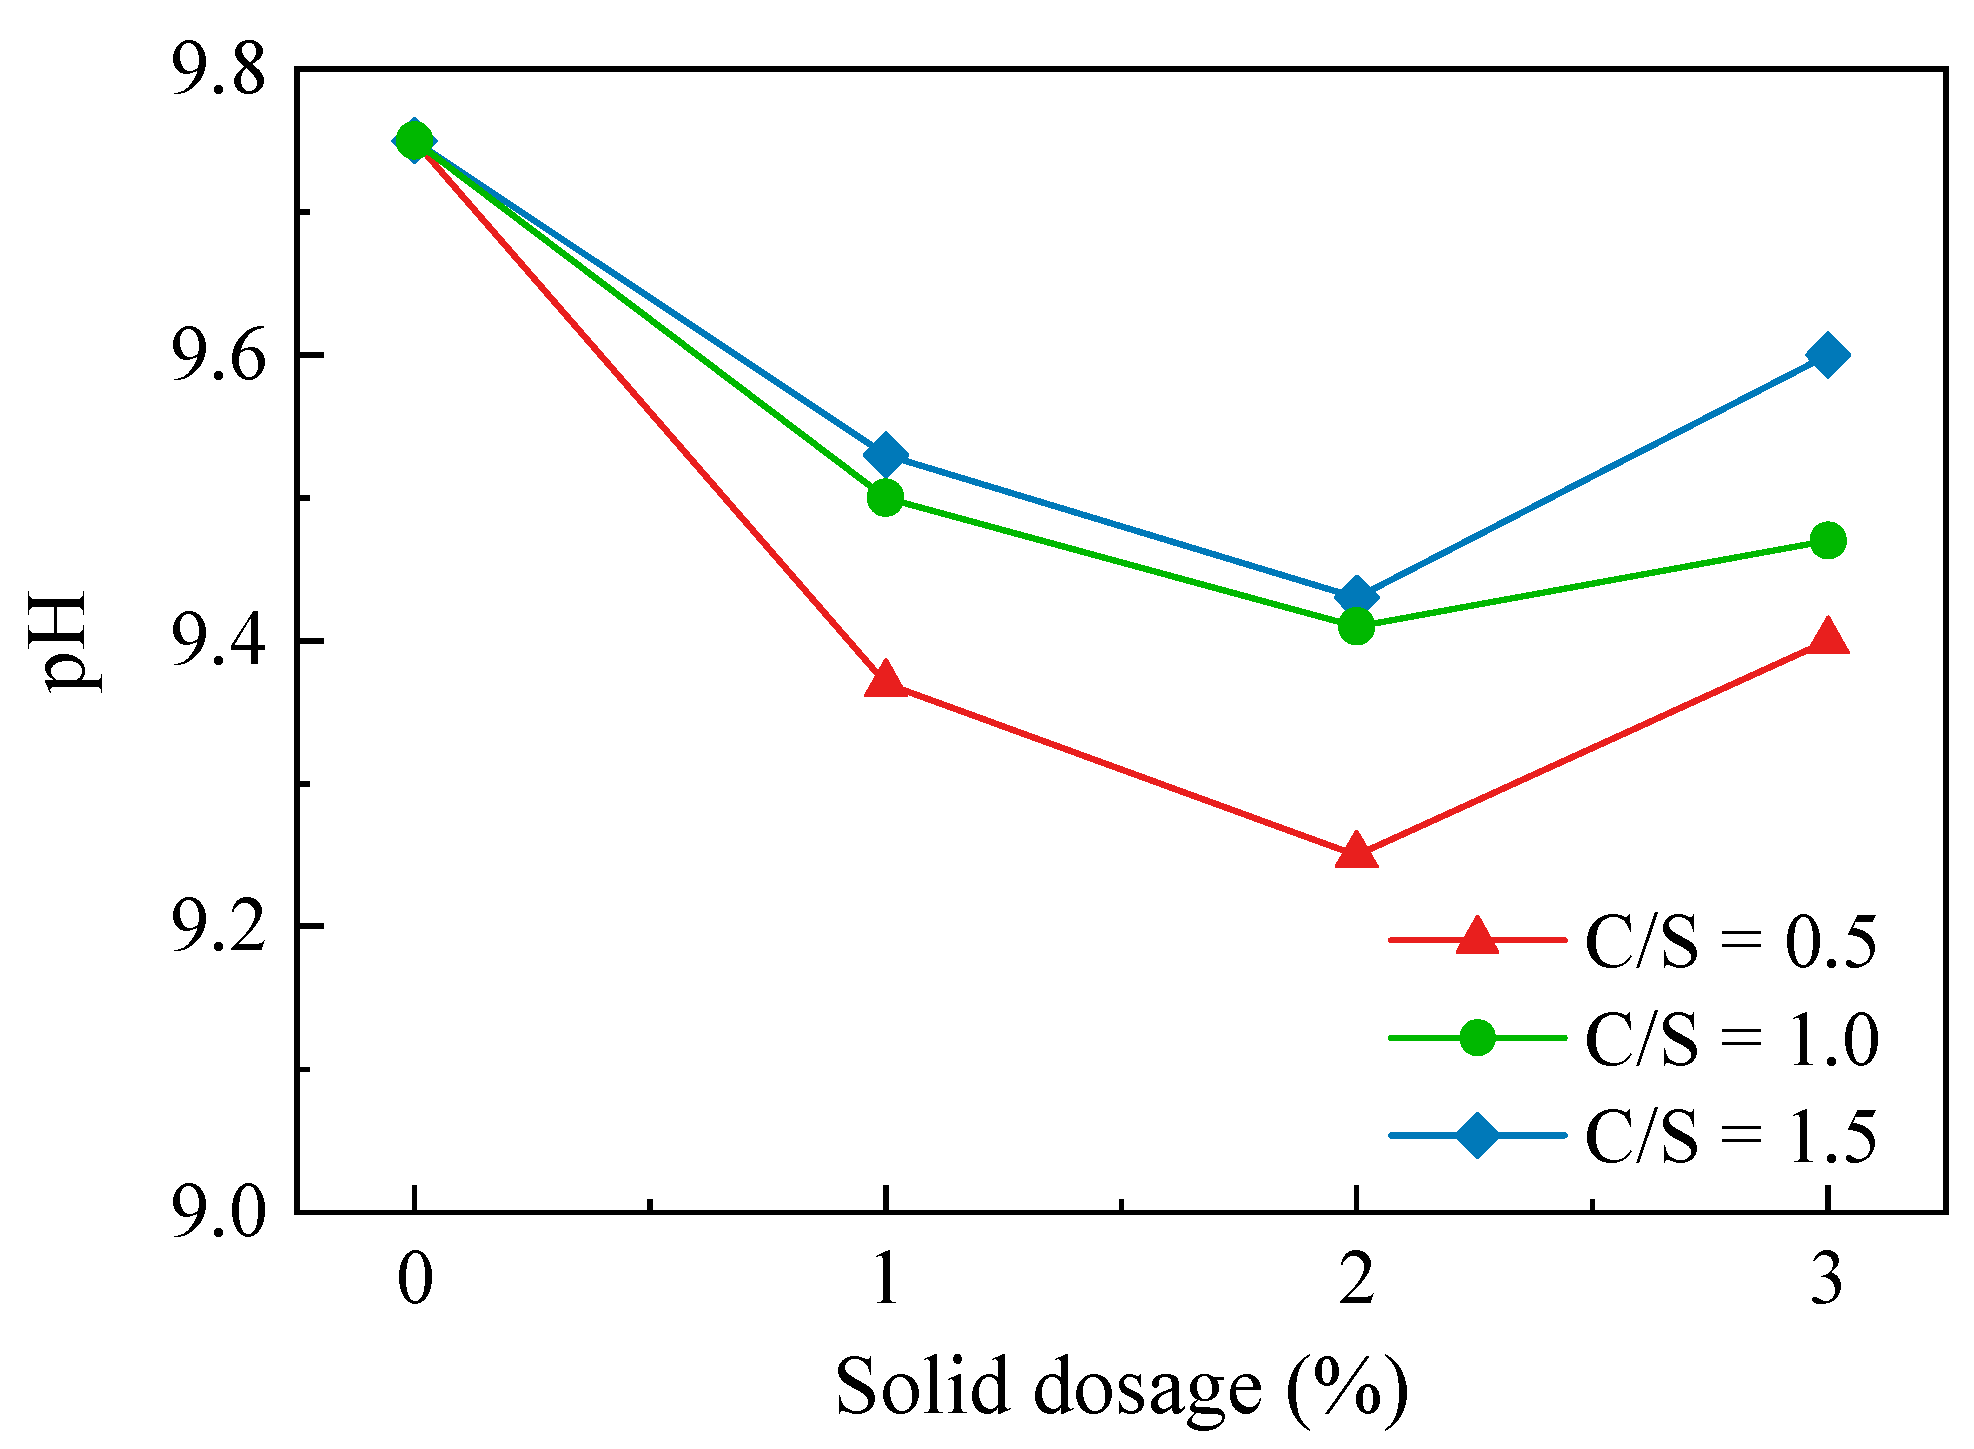
3.3.2. Results of the pH Test

The pH is an important factor influencing the electric potential of soil and the level of electric potential reflects the thickness of the diffusion layer. Under alkaline conditions, clay particles form a stable, negatively charged, diffuse double layer, resulting in more Na+ adsorption, higher electric potential, increased thickness of the diffuse layer and hydration film, and a tendency for the clay particles to disperse.
The results of the Ca–Si-treated soil pH test are shown in Figure 5. After the Ca–Si modification treatment, the soil was less alkaline. The pH of the three soil samples in the 0.5 C/S group was lower than those of the 1.0 C/S and 1.5 C/S groups—the lowest pH of the soil sample was at a 2% solid dosage, from 9.75 to 9.25. The pH of all three soil groups was lowest at a 2% solid dosage and increased at a 3% solid dosage, indicating that the best pH reduction was achieved the at a 2% solid dosage. After increasing the solid dosage, the alkalinity was increased instead due to the presence of incompletely reacted Ca(OH)2. The test results illustrate that, at an appropriate solid dosage, the reaction between CaO and SiO2 during the modification process can consume the OH in the soil environment and produce products such as C-S-H, CaCO3, and H2O (Equations (5)–(7)), which can reduce the soil acidity and alkalinity to a certain extent, reduce the clay particle diffusion layer and hydration film thickness, and eliminate soil dispersion.

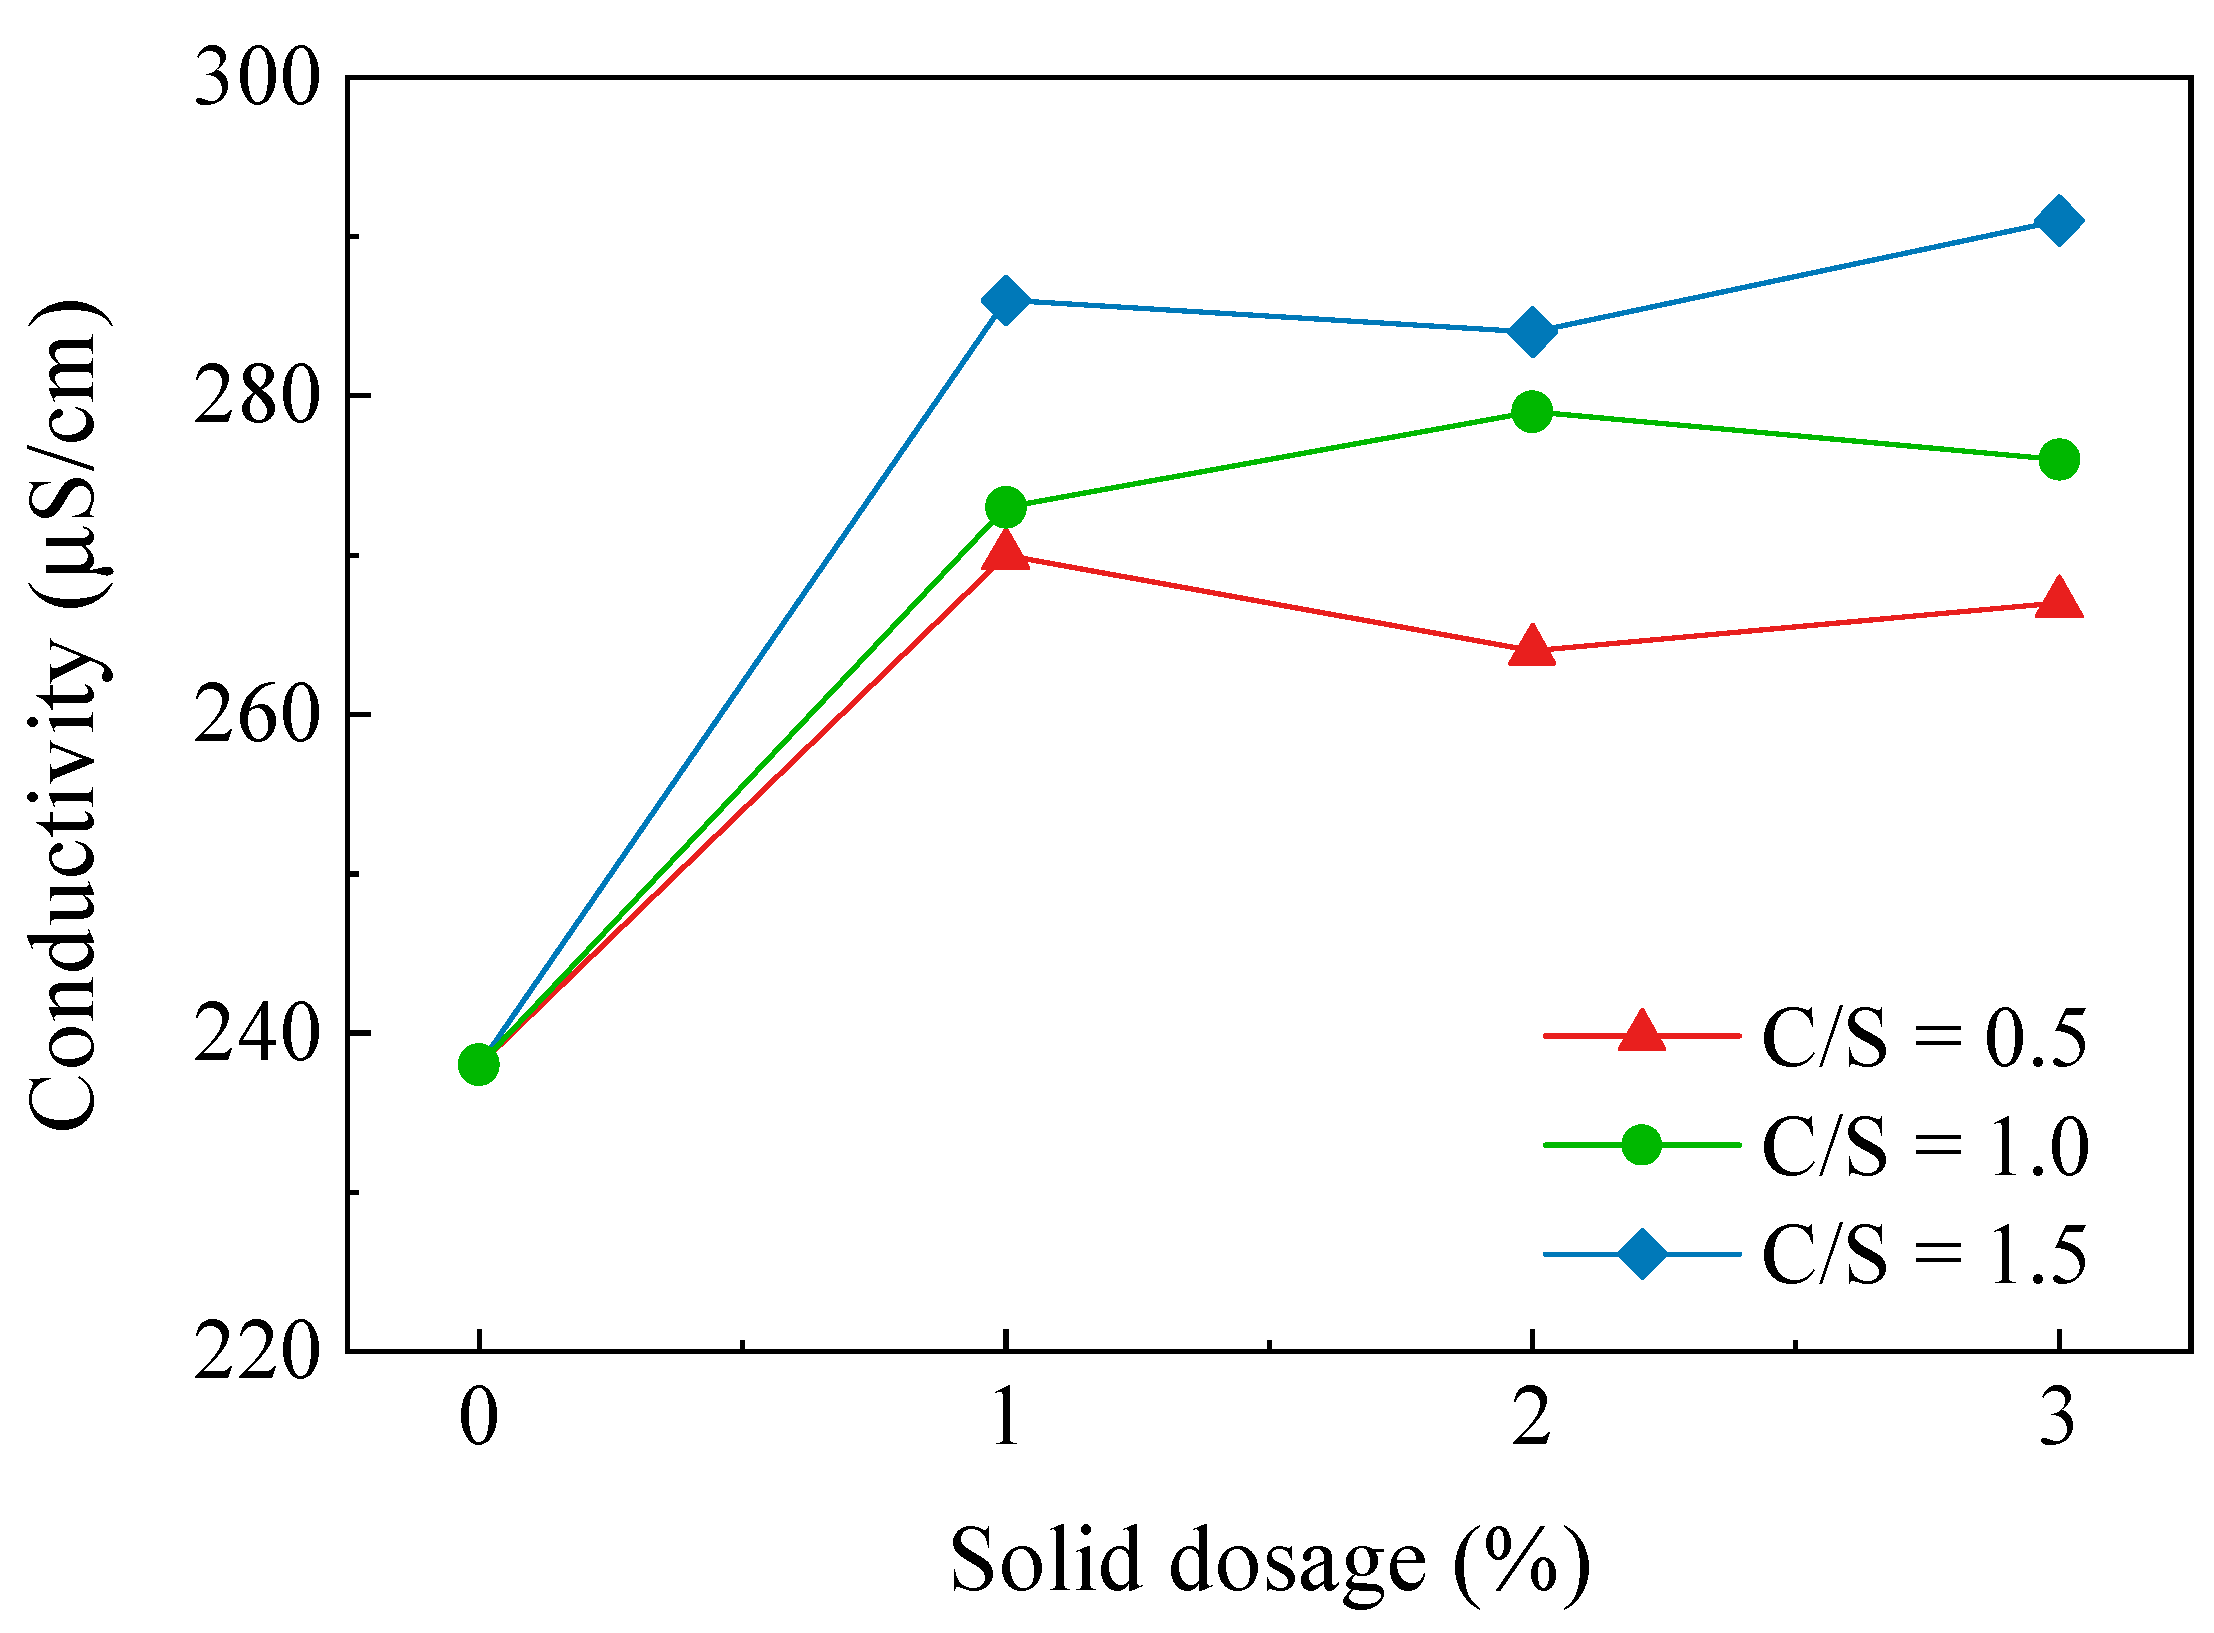
3.3.3. Results of the Conductivity Test

The electrical conductivity reflects the ease of the charge flow in a substance. Testing the electrical conductivity of a soil sample reflects the concentration of ions in the soil pore solution. The results of the electrical conductivity tests for soils with different C/S and solid dosages are shown in Figure 6. It can be seen from the figures that the conductivity of the soil sample tended to rise as the C/S increased, but the increase was not significant. The conductivity of the C-3 soil sample rose from 238 μS/cm to a maximum of 291 μS/cm, which was an increase of 22.3%. The conductivity of the soil samples did not change significantly with the increasing solid dosage and the Ca–Si treatment had essentially no effect on the conductivity. The test results show that the free ion concentration in the soil pore fluid environment did not increase significantly after the Ca–Si modification of the dispersive soil. The products of the reaction between CaO and SiO2 were primarily present in the soil in the form of C-S-H cementation, CaCO3. The increase in conductivity reduced the thickness of the double electric layer of the soil particles, which encouraged the flocculation of the soil particles and inhibited the soil dispersivity. The conductivity test results show that the Ca–Si modification method in this study introduced fewer external ions into the soil and did not affect the environment of the soil itself, which can achieve a green modification effect.

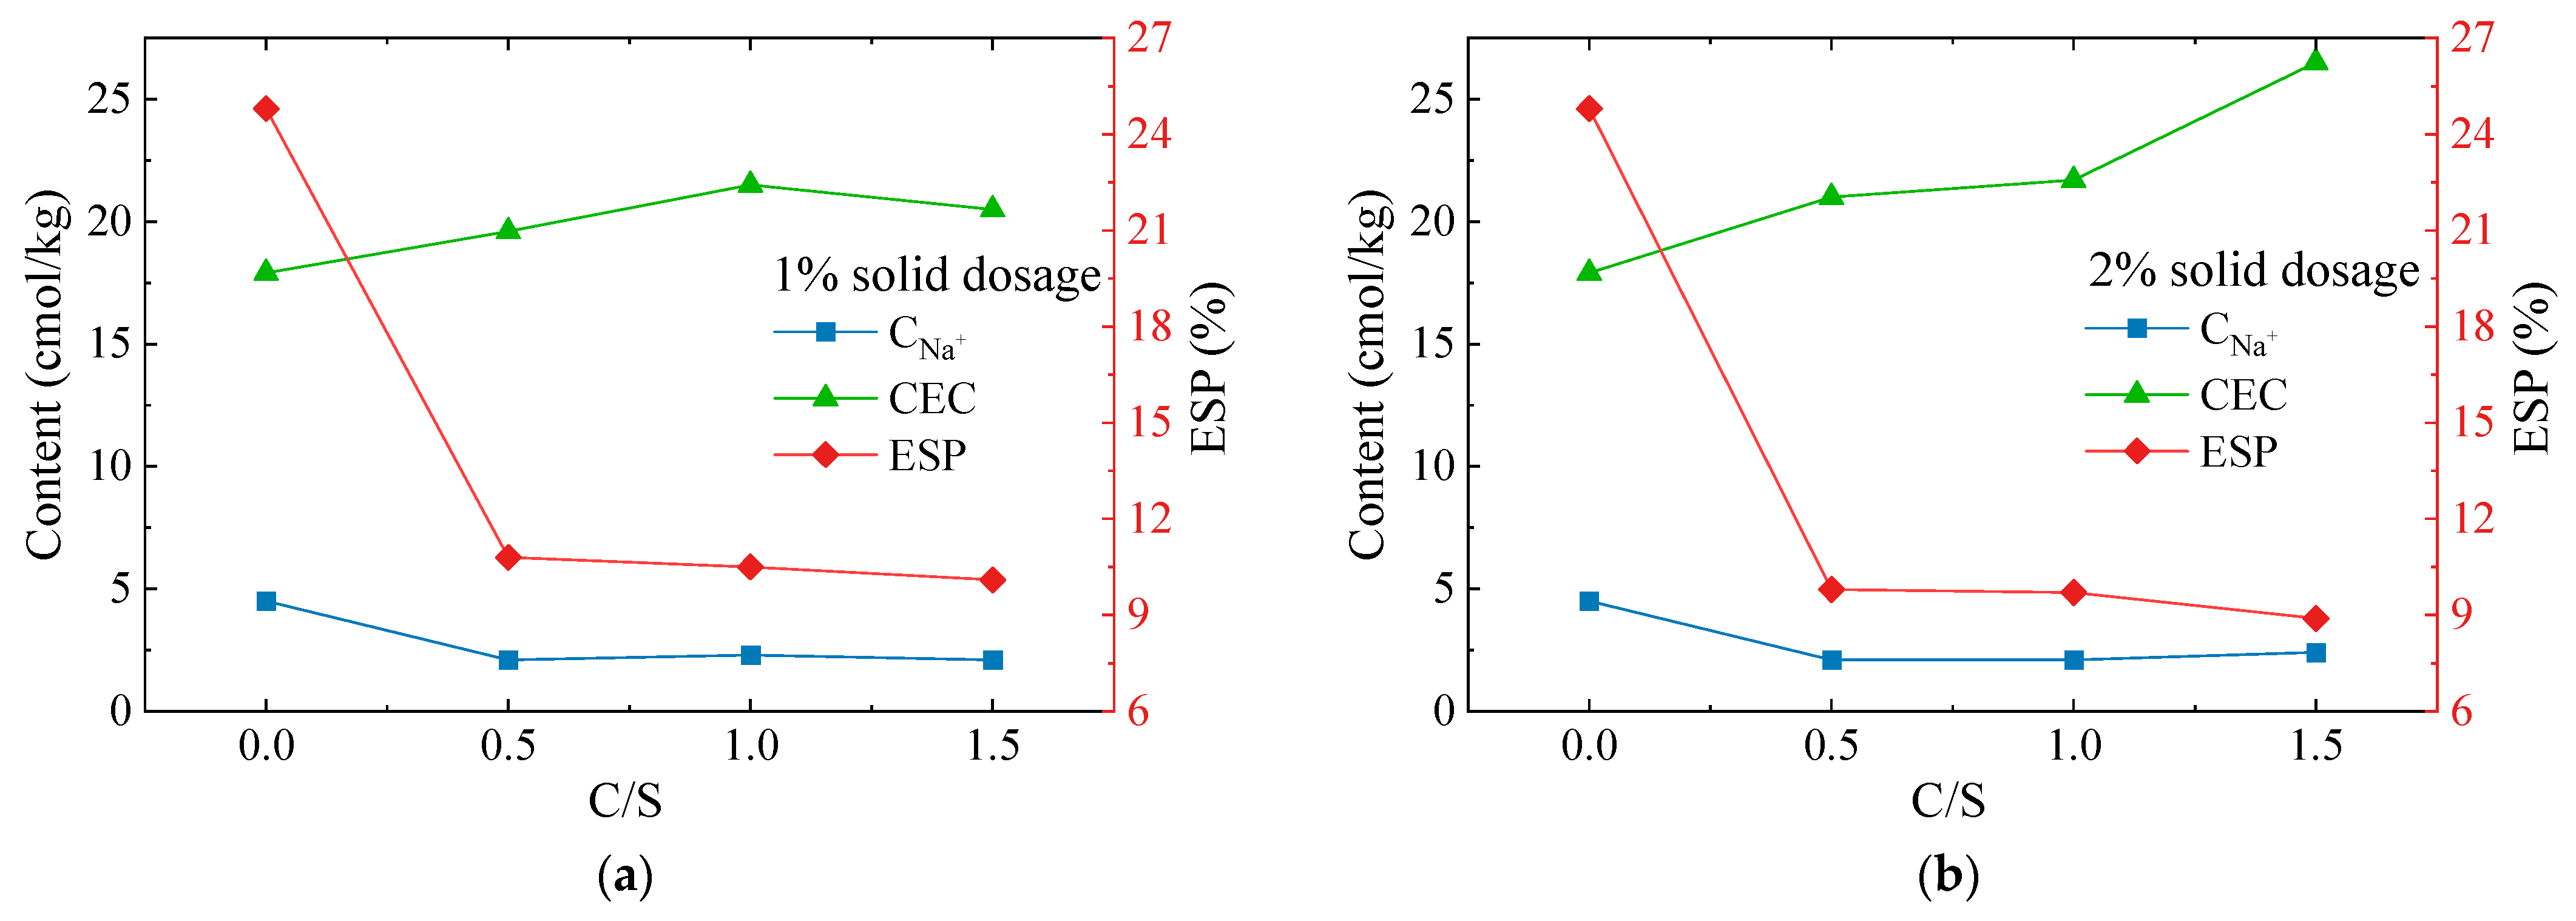
3.3.4. Results of the Exchangeable Sodium Percentage Test

The exchangeable sodium percentage (ESP) is the ratio of the number of exchangeable sodium ions adsorbed by the soil to the amount of cation exchange capacity (CEC). ESP is an important indicator of soil alkalinity and the determination of chemical dispersivity. The CNa+ and CEC of seven soil samples from the dispersive soil and Ca–Si group with 1 and 2% solid dosages were measured and the ESP values were calculated. The test results are shown in Figure 7.
The test results show that the CEC of the soil samples modified with Ca–Si were all enhanced. The C-2 soil sample increased from 17.9 cmol/kg to a maximum of 26.5 cmol/kg, while the CEC of all the other soil samples increased to 19.6~2.17 cmol/kg. The exchangeable sodium ion content CNa+ was significantly reduced from 4.5 cmol/kg to 2.1~2.4 cmol/kg; therefore, the ESP was also significantly reduced. The A-1 soil sample decreased from 24.8 to 10.8%, which was a reduction of 56%. The ESP of the soil samples decreased with increasing C/S and solids admixture, with the maximum decrease being 8.9% for the C-2 soil sample, which was a 64% reduction. The results indicate that ion exchange reactions occur within soils during the Ca–Si modification of dispersive soil and the free Ca2+ present in the system adsorbs with the clay particles, increasing the CEC values. The cation exchange capacity in the pore solution is related to the ionic valency, with divalent calcium ions displaying a higher exchange capacity than monovalent sodium ions. As a result, the exchangeable Na+ on the clay surface was replaced by the free state Ca2+, the thickness of the double electric layer was reduced, and the clay particles tended to agglomerate and no longer exhibit dispersivity.

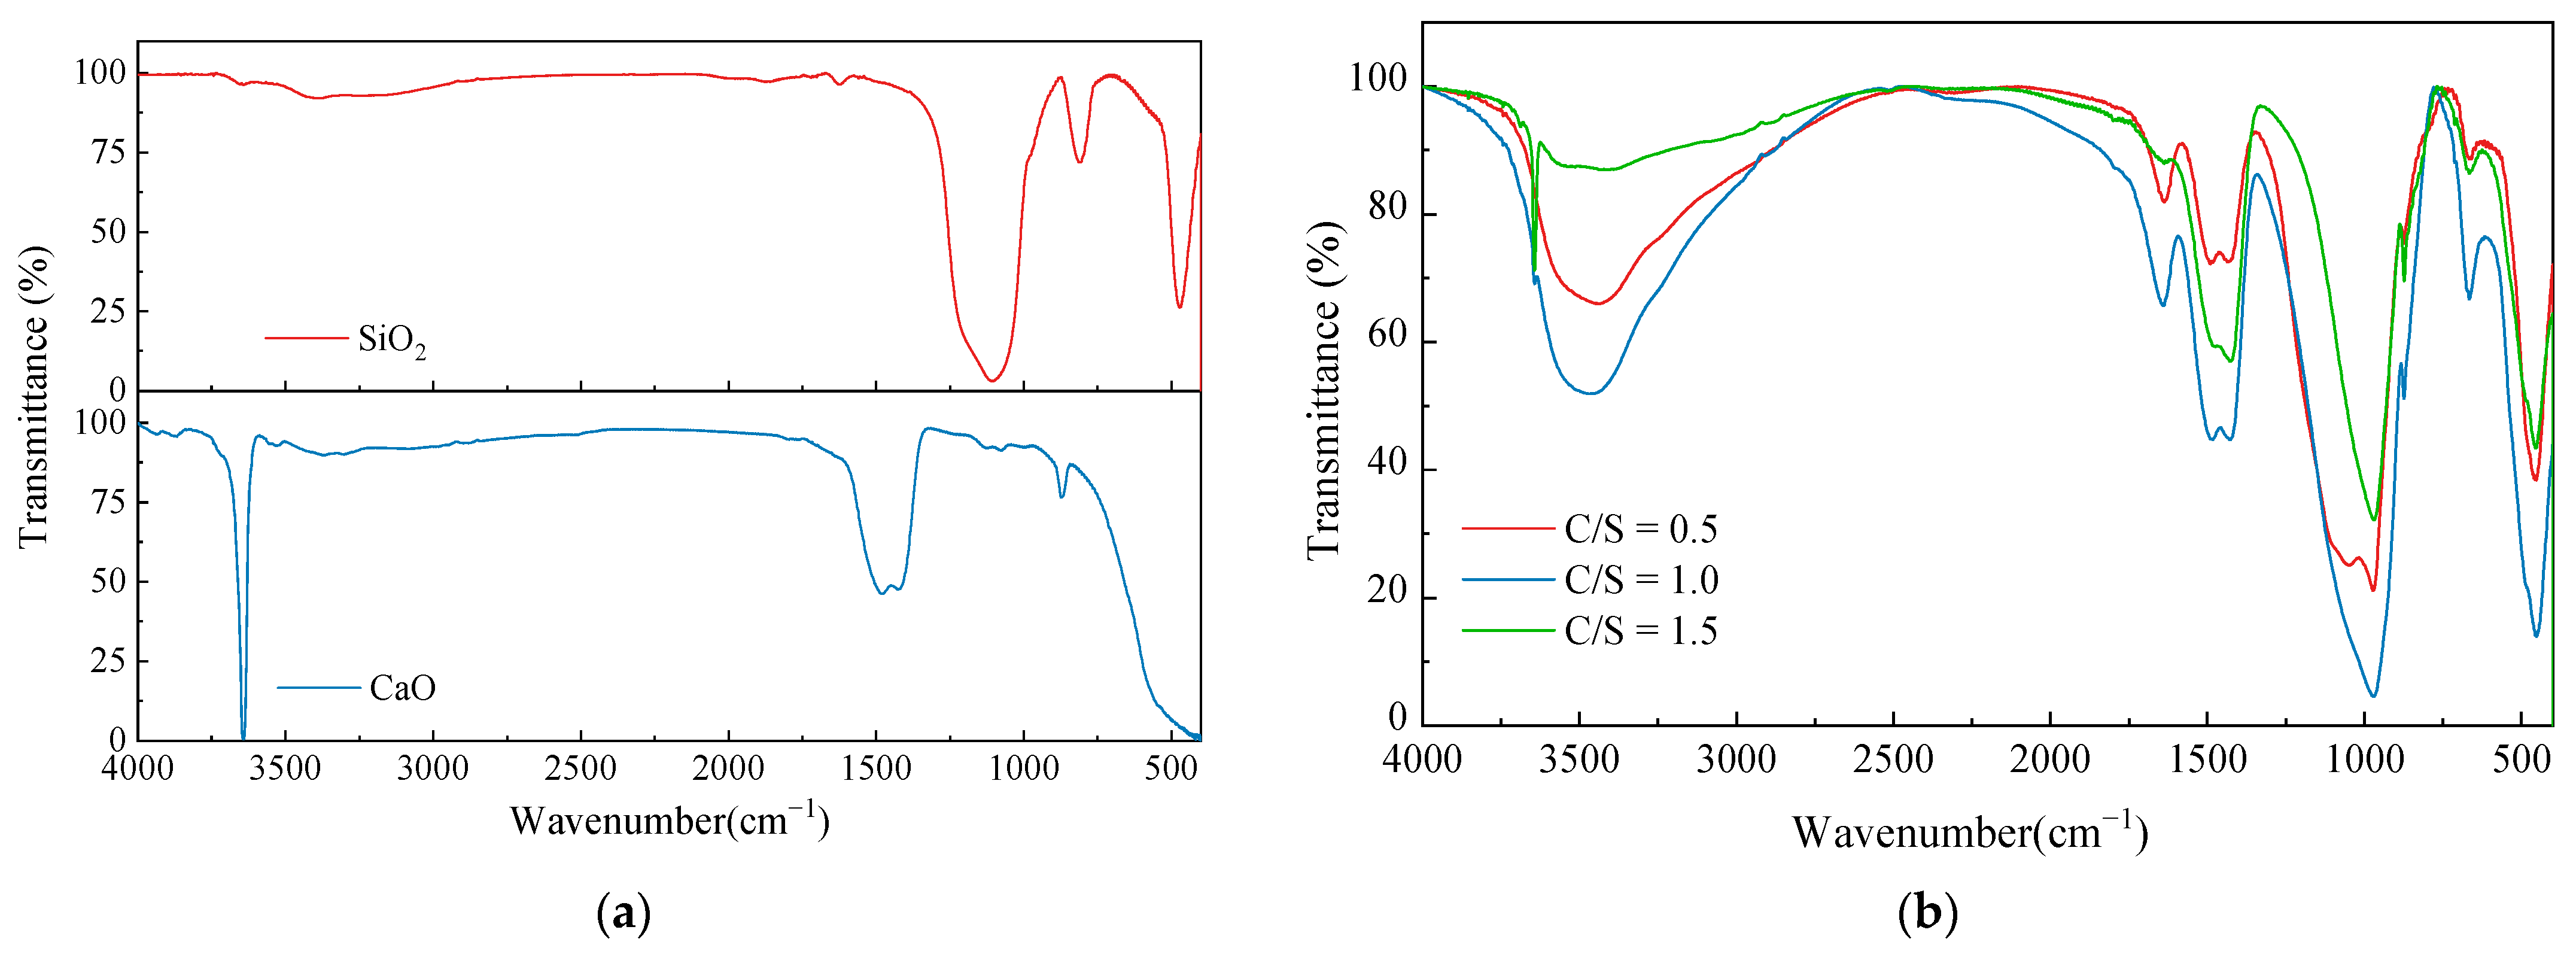
3.3.5. Results of the FT–IR Test

The reactants of CaO and SiO2 at three different C/S were naturally air-dried and measured by FT–IR for the reactants, SiO2 and CaO. All the substances were dried prior to testing to remove the free water. The test results are shown in Figure 8.
According to Kalinkin’s study [30], the characteristic peak of CaO occurs at 1400–1500 cm−1. The absorption peaks at 1417~1482 cm−1 can be observed in Figure 8a, and the peak vibration intensity can be used to judge the degree of the CaO reaction in the three groups of C/S. The O–H vibrational peak was evident at 3643 cm−1 due to the reaction of CaO with water in the atmosphere to form Ca(OH)2. The nano-SiO2 showed symmetric stretching vibrational peaks at 417 cm−1, 812 cm−1 for the Si–O bond, and 1108 cm−1 for the Si–O–Si antisymmetric stretching vibrations.
The positions of the vibrational peaks of the three different groups of C/S reactants were essentially the same and the δ(Si–O–Si) bending vibrational peaks appeared near 456 cm−1, indicating that a small amount of SiO2 remains in the reactants. The characteristic CaO peaks were present from 1400 cm−1 to 1500 cm−1, with the lowest peak intensity at a 0.5 C/S and no obvious O–H peak at 3600 cm−1 at this C/S, indicating that the reaction of CaO at this C/S was fuller in response than the other two C/S samples. There was residual Ca(OH)2 after the reaction at a 1.0 and 1.5 C/S. The disintegration characteristics of the corresponding soil samples can thus be demonstrated to be deteriorated due to Ca(OH)2 residues. All three reactant samples showed distinctive –OH characteristic peaks at 3380~3560 cm−1, and it can be assumed that C-S-H containing chemically bound water was generated. All three samples showed a ν(Si–O)Q2 vibrational peak at 971 cm−1, which proves that the C-S-H silica–oxygen tetrahedra in the samples had a preferable degree of polymerization and crystalline morphology.
The test results showed that all three sets of reactant samples produced effective C-S-H cementation. The reaction can also take place in the alkaline environment of dispersive soil. The dispersivity of the soil was effectively suppressed by the consolidation and coagulation effect of the product. The reaction of CaO was largely complete at a 0.5 C/S and the least amount of residual Ca(OH)2 was present in the samples at this condition. Therefore, the C-S-H consolidation was strongest in the soil sample at a 0.5 C/S. The products at a 0.5 C/S were effective at modifying the dispersive soil and greatly improved the disintegration resistance of the soils. The remaining two groups of C/S conditions had more residual Ca(OH)2 due to a less complete reaction, which reduced the disintegration resistance of the soil samples.

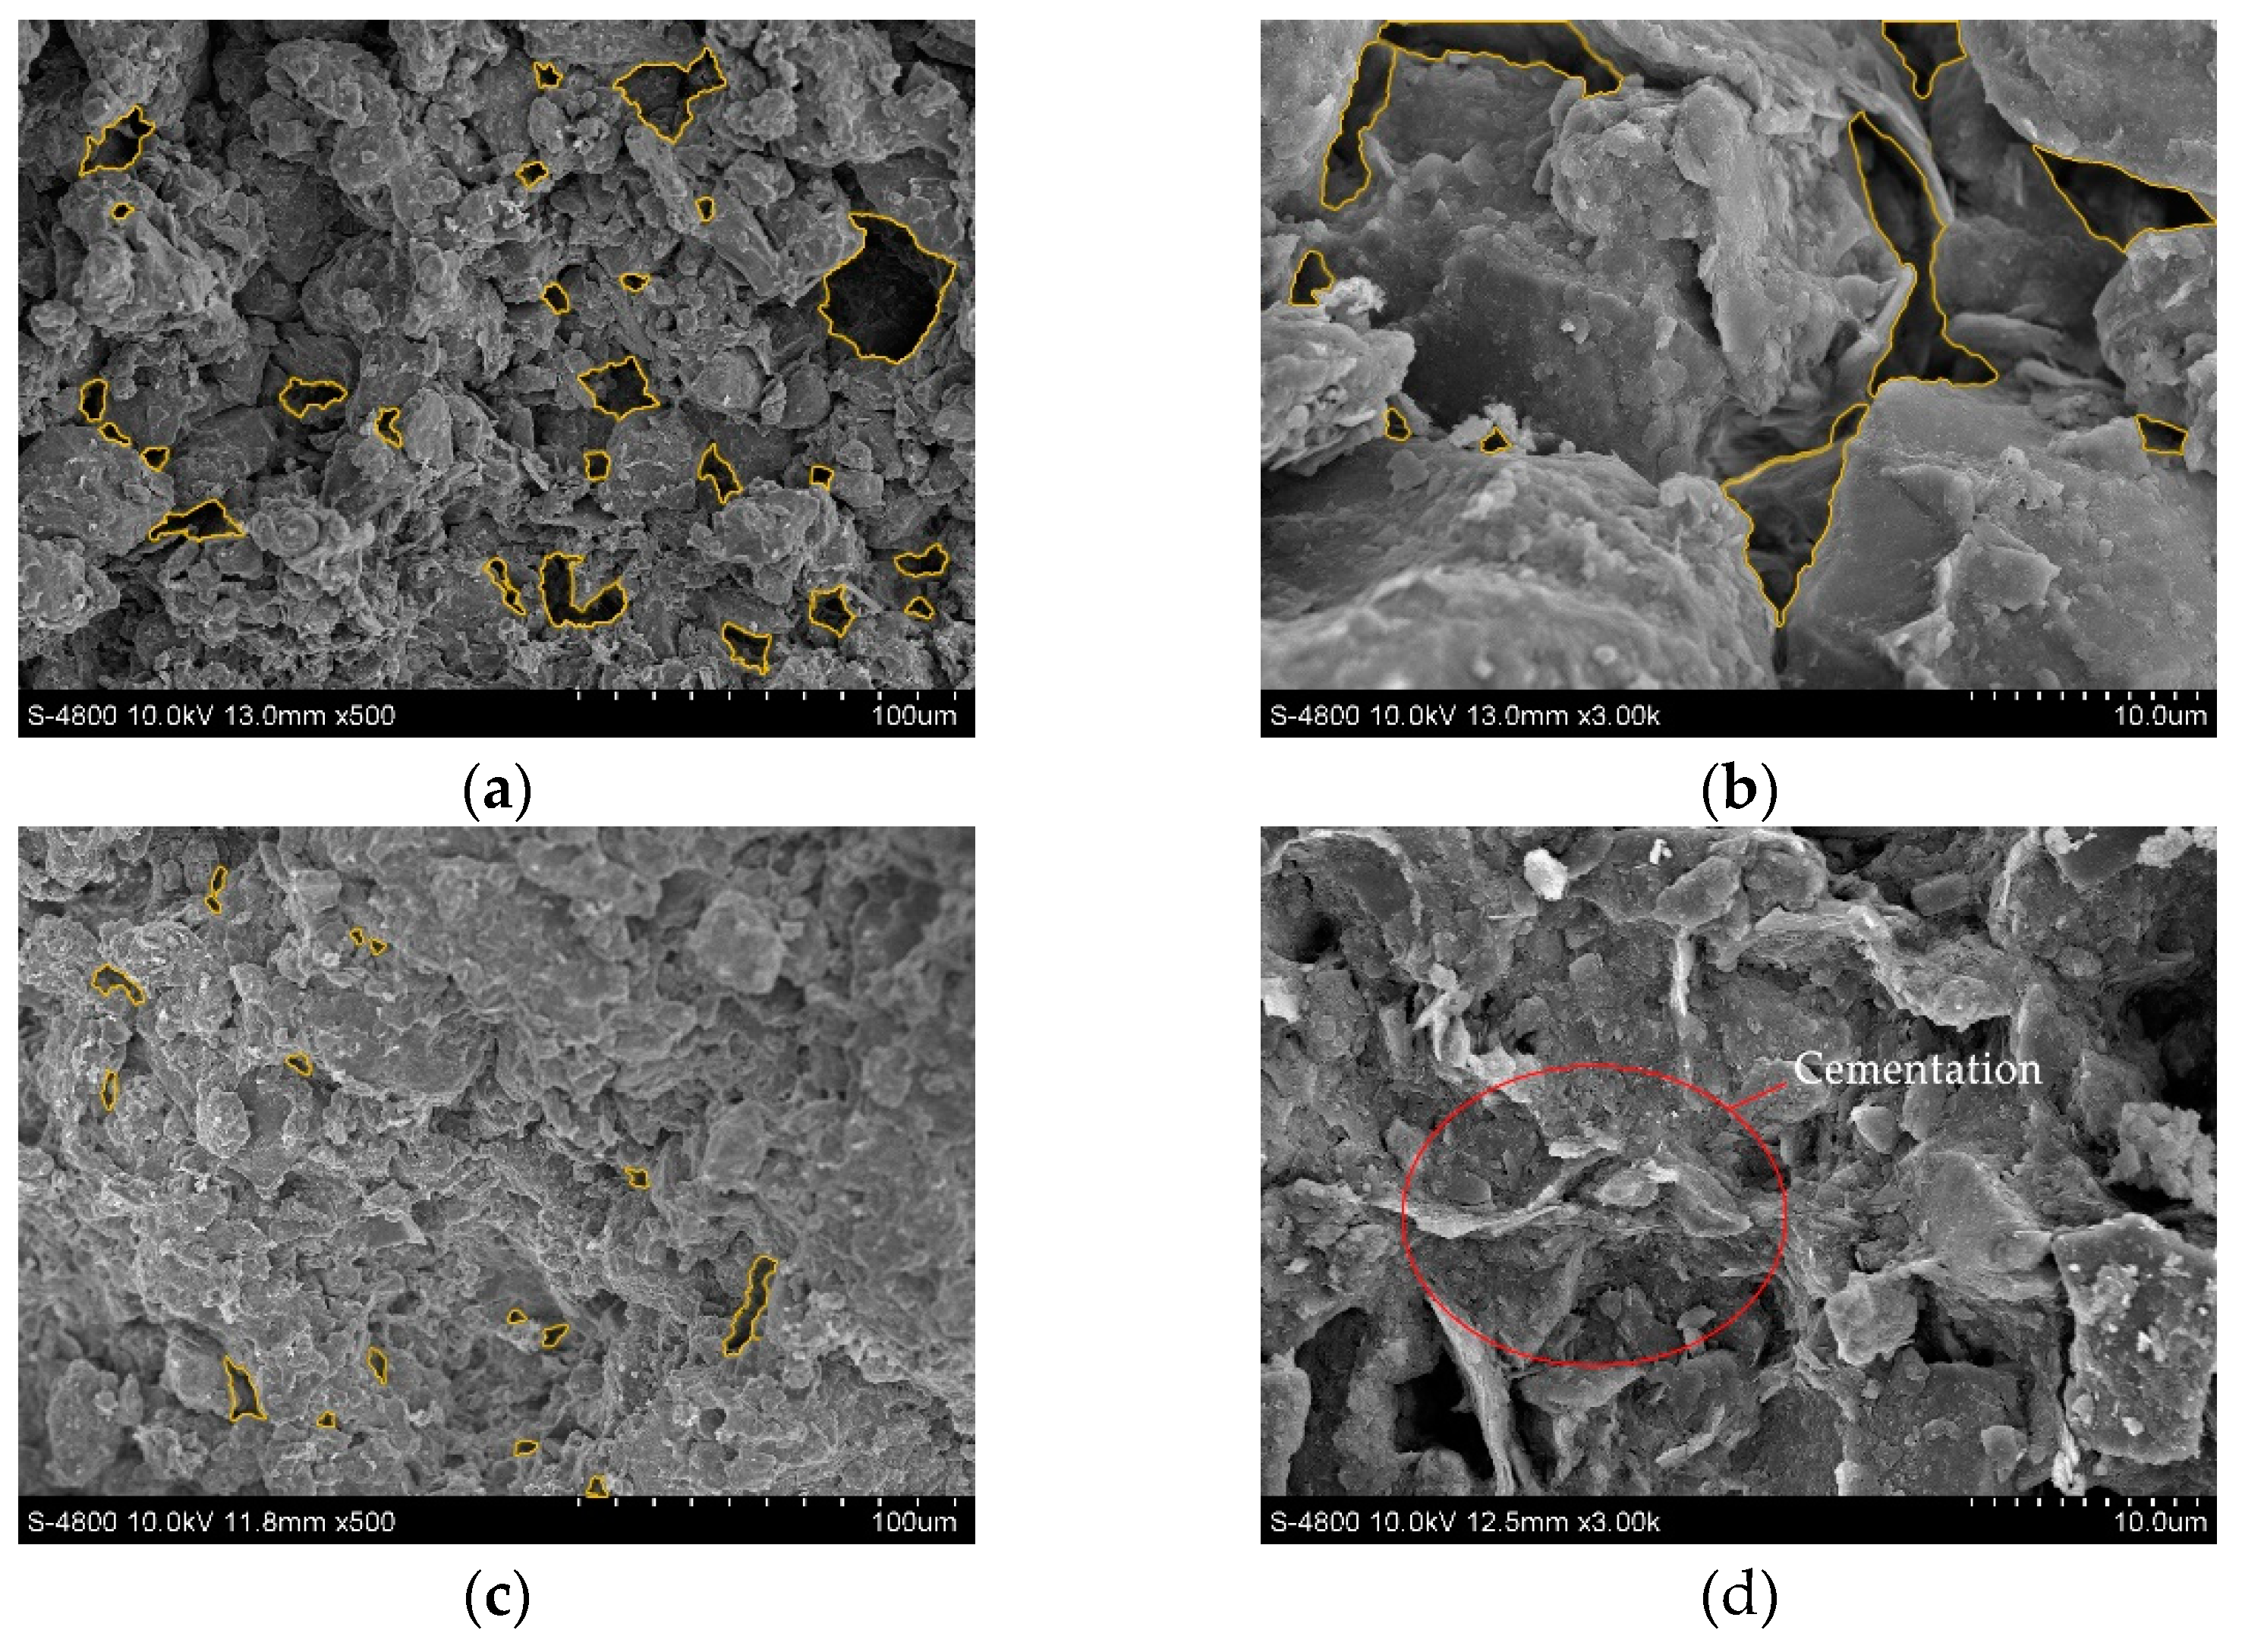
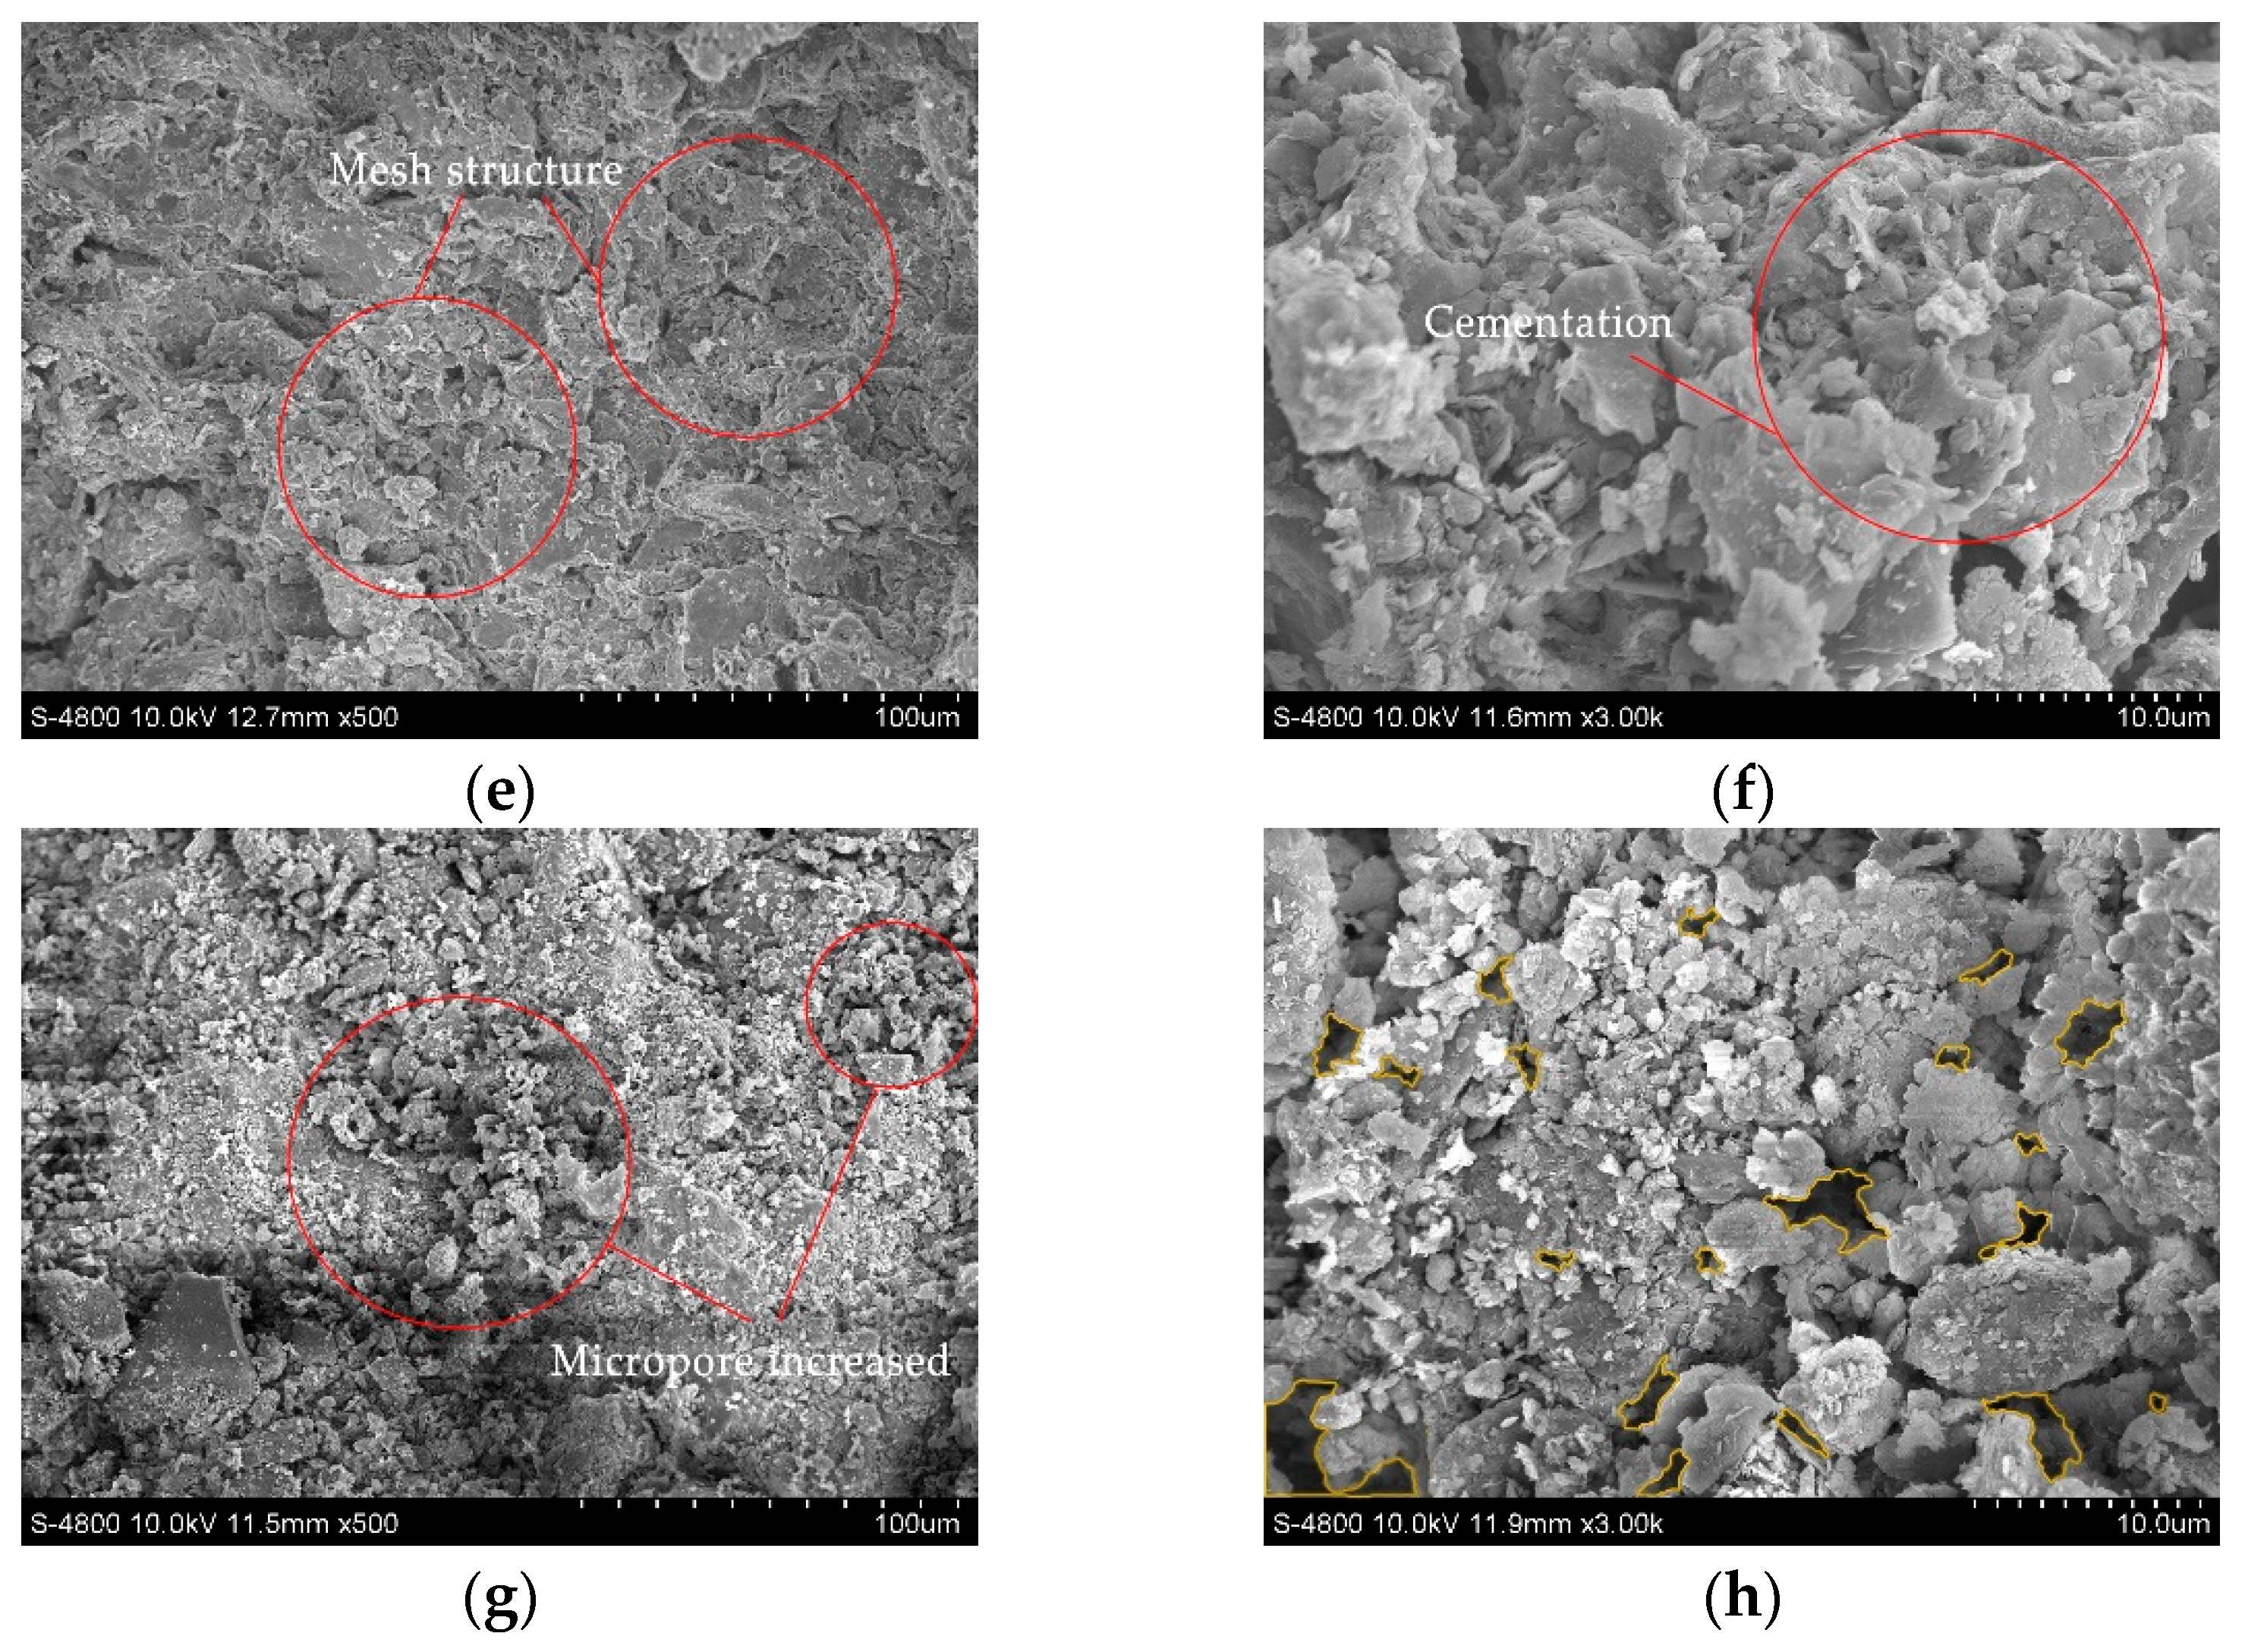
3.3.6. Results of the SEM Test

Four soil samples of D, A-1, A-2, and C-2, were selected for SEM tests to observe their pore characteristics, soil particle spatial distribution characteristics, and cement morphology. The images of the SEM test are shown in Figure 9, where the yellow circled part of the figure shows the pores.
The dispersive soil exhibited a trellis pore structure with good spatial connectivity. The effective cementing material between the soil particles was low, the number of large pores was high, and the soil particles were mainly in point-to-point contact. When the dispersive soil was exposed to water, the water easily penetrated through the pores into the soil and increased the contact area with the soil particles. The clay particles were separated from the large particles by the action of water and dispersed in an aqueous environment as a suspension of colloidal particles.
The A-1, A-2, and C-2 soil samples showed a significant reduction in macropores and an increase in their degree of compactness. The C-S-H cementation produced in the soil was observed at a high magnification in the soil samples A-1 and A-2, forming a strongly linked mesh structure, as in Figure 9c,d, effectively filling the interstices of the soil particles. The soil particle connection pattern changed from point-to-point to surface-to-surface contact, mostly manifesting as a laminar or blocky accumulation, as in Figure 9d,f. As a result, it was difficult for the water to enter the interior of the soil and the soil dispersivity was eliminated, enhancing its resistance to disintegration. The C-2 soil samples tended to agglomerate into large particles due to the presence of residual Ca(OH)2 and the cement between the particles was reduced, the connectivity became poor, and the tiny pores between the particles were slightly increased. The C-2 soil sample was less dense than the A-1 and A-2 soil samples; therefore, although the dispersion was eliminated, the resistance to disintegration was reduced and large particles crumbled off during the disintegration.
Combining the results of the above tests, the mechanism of action of the Ca–Si modified dispersive soil based on the CaO and nano-SiO2 synthesis of C-S-H has the following aspects:
(1)
A serious chemical reaction occurred during the modification of the dispersive soil by Ca–Si, as shown in Equations (5)–(7).
CaO + H2O = Ca(OH)2
Ca(OH)2 + CO2 = CaCO3↓ + H2O
Ca2+ + SiO2 + 2OH + (n − 1)H2O→CaO·SiO2·nH2O
The reaction generated C-S-H gel and CaCO3, which, through physical filling and cementation, coalesced the fine soil particles into agglomerates, increased the inter-particle linkage’s strength, and enhanced the compactness and resistance to disintegration by reducing the soil pore space.
(2)
Through chemical reactions, the OH in the soil was depleted to a certain extent. As a result, the alkalinity of the dispersive soil decreased, and the adsorption of the Na+ by the clay particles was weakened.
(3)
During the CaO reaction, some free Ca2+ was generated within the soil pore fluid. As the ion exchange capacity of Ca2+ is stronger than that of Na+ [31], the Ca2+ underwent an ion replacement reaction with the exchangeable Na+ on the surface of the clay particles, effectively reducing the ESP value. This effectively reduced the thickness of the double electric layer of the clay particles, decreased the inter-particle repulsion, and eliminated the dispersivity.

4. Conclusions

The following conclusions were obtained from the results and analysis of the tests in this research: (1) A Ca–Si modification method based on the C-S-H synthesis principle was proposed, which can effectively reduce the amount of CaO or SiO2 used for treatment alone; also, the modification effect is stable. (2) The disintegration resistance of the Ca–Si-modified dispersible soil at a 0.5% C/S and 2% solid dosage was substantially improved, inhibiting the dispersive disintegration of the soil under submerged water conditions. (3) Through mechanism tests, the action mechanism of the Ca–Si treatment method to eliminate the dispersivity and improve the disintegration resistance of the soil was described. The results of this research can provide further research ideas and a scientific basis for the application of the Ca–Si method in the treatment of poor soil.
In previous studies of dispersive soil modification, scholars rarely examined changes in the disintegration properties of dispersive soils before and after modification. Chen’s [22] research on the disintegration of dispersive soil considers soil disintegration to be a property that cannot be ignored. Soil disintegration, as an indicator of soil erosion resistance, reflects the stability of soil samples under submerged conditions and is relevant to the safety of earth dams in the event of water erosion. The use of CaO to modify dispersive soils is a common method, but previous studies [12,13,14,15,16,18] did not include research on disintegration properties. In this study, it was found that the resistance to disintegration was reduced under the action of CaO, as the soil exhibited large particle agglomerates. When CaO and SiO2 were used together and controlled at a certain C/S and dosage, the disintegration resistance of the soil was substantially improved. This result fills a gap in the study of the disintegration of CaO-modified dispersive soils and provides an approach for future disintegration studies of dispersive soil modification. As an environmentally friendly material, SiO2 has protective and sustainable advantages for the environment by reducing the usage of CaO to reduce the alkalizing effect on soil. However, there are still some issues in this paper that need further research: The reaction efficiency of CaO and SiO2 was not particularly high and an effective catalyst could be found in the future to improve this. Furthermore, the method in this study applies to chemical dispersive soils with a high clay particle content; further in-depth research is required to apply this method to physical dispersive soils with low clay particle contents.

Author Contributions

Conceptualization, H.F.; methodology, Y.L. and H.F.; software, Y.L. and C.T.; validation, H.F. and B.Z.; formal analysis, Y.L. and C.T.; investigation, Y.L. and Z.Z.; resources, H.F.; data curation, Y.L.; writing—original draft, Y.L.; writing—review and editing, H.F.; visualization, Y.L.; supervision, H.F. and S.J.; project administration, H.F.; funding acquisition, H.F. All authors have read and agreed to the published version of the manuscript.

Funding

This research was funded by National Natural Science Foundation of China, grant numbers 52079116, 51579215, and 52108343.

Institutional Review Board Statement

Not applicable.

Informed Consent Statement

Not applicable.

Data Availability Statement

The data that support the findings of this study are available from the corresponding author upon reasonable request.

Conflicts of Interest

The authors declare no conflict of interest.

References

  1. Petry, T.M. Identification of Dispersive Clay Soils by a Physical Test; Oklahoma State University: Stillwater, OK, USA, 1974. [Google Scholar]
  2. Gutiérrez, F.; Desir, G.; Gutiérrez, M. Causes of the catastrophic failure of an earth dam built on gypsiferous alluvium and dispersive clays (Altorricón, Huesca province, NE Spain). Environ. Geol. 2003, 43, 842–851. [Google Scholar] [CrossRef]
  3. Premkumar, S.; Piratheepan, J.; Arulrajah, A.; Disfani, M.M.; Rajeev, P. Experimental study on contact erosion failure in pavement embankment with dispersive clay. J. Mater. Civ. Eng. 2016, 28, 4015179. [Google Scholar] [CrossRef]
  4. Ingles, O.G.; Aitchison, G.D. Soil–water disequilibrium as a cause of subsidence in natural soils and earth embankments. In Proceedings of the Association Internationale d’Hydrologie Scientifique, Affaisement du Sol, Tokyo, Japan, September 1970; Volume 89, pp. 342–353. [Google Scholar]
  5. Sherard, J.L.; Decker, R.S.; Ryker, N.L. Piping in Earth Dams of Dispersive Clay, Performance of Earth and Earth–Supported Structures; ASCE: Reston, VA, USA, 1972; p. 589. [Google Scholar]
  6. Holmgren, G.G.S.; Flanagan, C.P. Factors affecting spontaneous dispersion of soil materials as evidenced by the crumb test. In Dispersive Clays, Related Piping, and Erosion in Geotechnical Projects; ASTM International: West Conshohocken, PA, USA, 1977; Volume 623, pp. 218–239. [Google Scholar]
  7. Tao, R.; Meng, M.Q.; Zhang, W.B.; Fan, H.H.; Wen, J.X.; Guo, H.D.; Yang, X.J. Study on the dispersivity discrimination methods of fine–grained soil based on dispersive mechanism. Chin. J. Geotech. Eng. 2022, 1–10. Available online: http://kns.cnki.net/kcms/detail/32.1124.TU.20220424.1635.002.html (accessed on 25 April 2022).
  8. Bhuvaneshwari, S.; Soundra, B.; Robinson, R.G.; Gandhi, S.R. Stabilization and microstructural modification of dispersive clayey soils. In Proceedings of the 1st International Conference on Soil and Rock Engineering, Srilankan Geotechnical Society, Columbo, Srilanka, 7–11 August 2007. [Google Scholar]
  9. Savaş, H.; Türköz, M.; Seyrek, E.; Ünver, E. Comparison of the effect of using class c and f fly ash on the stabilization of dispersive soils. Arab. J. Geosci. 2018, 11, 612. [Google Scholar] [CrossRef]
  10. Indraratna, B.; Nutalaya, P.; Kuganenthira, N. Stabilization of a dispersive soil by blending with fly ash. Q. J. Eng. Geol. Hydrogeol. 1991, 24, 275–290. [Google Scholar] [CrossRef]
  11. Turkoz, M.; Vural, P. The effects of cement and natural zeolite additives on problematic clay soils. Sci. Eng. Compos. Mater. 2013, 20, 395–405. [Google Scholar] [CrossRef]
  12. Umesha T, S.; Dinesh S, V.; Sivapullaiah, P.V. Control of dispersivity of soil using lime and cement. Int. J. Geol. 2009, 3, 8–16. [Google Scholar]
  13. Vakili, A.H.; Ghasemi, J.; Bin Selamat, M.R.; Salimi, M.; Farhadi, M.S. Internal erosional behaviour of dispersive clay stabilized with lignosulfonate and reinforced with polypropylene fiber. Constr. Build. Mater. 2018, 193, 405–415. [Google Scholar] [CrossRef]
  14. Türköz, M.; Umu, S.U.; Öztürk, O. Effect of silica fume as a waste material for sustainable environment on the stabilization and dynamic behavior of dispersive soil. Sustainability 2021, 13, 4321. [Google Scholar] [CrossRef]
  15. Vakili, A.H.; Shojaei, S.I.; Salimi, M.; Bin Selamat, M.R.; Farhadi, M.S. Contact erosional behaviour of foundation of pavement embankment constructed with nanosilica–treated dispersive soils. Soils Found. 2020, 60, 167–178. [Google Scholar] [CrossRef]
  16. Reddy, J.J.; Varaprasad, B. Long–term and durability properties of xanthan gum treated dispersive soils—An eco–friendly material. Mater. Today Proc. 2021, 44, 309–314. [Google Scholar] [CrossRef]
  17. Reddy, J.J.; Varaprasad, B. Effect of Xanthan Gum on Internal Erosion Characteristics of Dispersive Soils—As an Ecofriendly Additive. Int. J. Eng. Adv. Technol. 2020, 29, 4716–4724. [Google Scholar]
  18. Li, C.; Shi, G.Y.; Wu, H.M.; Wang, C.Y.; Gao, Y. Experimental study on bio–mineralization for dispersive soil improvement based on enzyme induced calcite precipitate technology. Rock Soil Mech. 2021, 42, 333–342. [Google Scholar]
  19. Li, X.A.; Huang, R.Q.; Peng, J.B. Experimental research on disintegration of loess. Chin. J. Rock Mech. Eng. 2009, 28, 3207–3213. [Google Scholar]
  20. Wang, J.; Gu, T.; Zhang, M.; Xu, Y.; Kong, J. Experimental study of loess disintegration characteristics. Earth Surf. Proc. Land. 2019, 44, 1317–1329. [Google Scholar] [CrossRef]
  21. Ze, Z.; Vadim, P.; Svetlana, N.; Zhongqiong, Z.; Junjie, W. Disintegration characteristics of a cryolithogenic clay loam with different water content: Moscow covering loam (prqiii), case study. Eng. Geol. 2019, 258, 105159. [Google Scholar] [CrossRef]
  22. Chen, H.; Fan, H.H.; Nie, Y.; He, Z.Q. Study on water stability of clayey soil under soil–water–electrolyte systems. J. Hydroelectr. Eng. 2015, 34, 128–138. [Google Scholar]
  23. Yu, L.C. Preparation of Calcium Silicate (C–S–H) and the Effect on the Cement Hydration Process. Master’s Thesis, East China University of Science and Technology, Shanghai, China, 2018. [Google Scholar]
  24. Zhao, X.G. Synthesis of Calcium Silicate Hydrate and Its Composition, Structure and Morphology. Master’s Thesis, Wuhan University of Technology, Wuhan, China, 2010. [Google Scholar]
  25. Abbasi, N.; Nazifi, M.H. Assessment and modification of Sherard chemical method for evaluation of dispersion potential of soils. Geotech. Geol. Eng. 2013, 31, 337–346. [Google Scholar] [CrossRef]
  26. The American Society for Testing and Material. D4647–2020 Standard Test Method for Dispersive Characteristics of Clay Soil by the Pinhole Test; ASTM International: West Conshohocken, PA, USA, 2020. [Google Scholar]
  27. Fan, H.H.; Kong, L.W. Study of Dispersive Soil; Water & Power Press: Beijing, China, 2012. [Google Scholar]
  28. The American Society for Testing and Material. D6572–2020 Standard Test Method for Dispersive Characteristics of Clay Soil by the Crumb Test; ASTM International: West Conshohocken, PA, USA, 2020. [Google Scholar]
  29. Ministry of Water Resources of the People’s Republic of China. GB/T 50123-2019 Standard for Geotechnical Testing Method; China Planning Press: Beijing, China, 2019.
  30. Kalinkin, A.M.; Kalinkina, E.V.; Zalkind, O.A.; Makarova, T.I. Chemical interaction of calcium oxide and calcium hydroxide with CO2 during mechanical activation. Inorg. Mater. 2005, 41, 1073–1079. [Google Scholar] [CrossRef]
  31. Gao, G.R. The Modern Soil Science; Southeast University Press: Nanjing, China, 1990. [Google Scholar]
Figure 1. Dispersion and disintegration tester.
Sustainability 14 14370 g001
Figure 2. Typical photos of dispersivity tests of soil: (a) Dispersive soil; (b) CaO-2 (Transitional soil); (c) A-1 (Non-dispersive soil); (d) A-1 1 d (Dispersive soil); (e) A-1 7 d (Transitional soil); (f) A-1 air–dried (Non-dispersive soil).
Sustainability 14 14370 g002
Figure 3. Disintegration rate–time curve: (a) Dispersive soil and CaO-treated soil; (b) A-1, A-2; (c) B-1, B-2, C-1, C-2.
Sustainability 14 14370 g003
Figure 4. Three soil samples with different disintegration characteristics.
Sustainability 14 14370 g004
Figure 5. pH variation curve of Ca–Si-treated soil.
Sustainability 14 14370 g005
Figure 6. Conductivity variation curve of Ca–Si-treated soil.
Sustainability 14 14370 g006
Figure 7. CEC, CNa+, and ESP variation curve of the Ca–Si-treated soil: (a) 1% solid dosage; (b) 2% solid dosage.
Sustainability 14 14370 g007
Figure 8. Infrared radiation of modifying material: (a) FT–IR results of SiO2 and CaO; (b) FT–IR results of three reactants at different C/S.
Sustainability 14 14370 g008
Figure 9. Scanning electron microscope images: (a) Dispersive soil (500×); (b) Dispersive soil (3000×); (c) A-1 (500×); (d) A-1 (3000×); (e) A-2 (500×); (f) A-2 (3000×); (g) C-2 (500×); (h) C-2 (3000×).
Sustainability 14 14370 g009aSustainability 14 14370 g009b
Table 1. Basic properties of soil.
PropertiesValue
Specific gravity of solid particles2.71
Liquid limit (%)29.9
Plastic limit (%)18.5
Plastic index11.4
Clay percentage (%)35.2
Slit percentage (%)63.5
Sand percentage (%)1.3
Soil typeCL
Maximum dry density (g/cm3)1.77
Optimum moisture content (%)16.5
Soluble salt content (g/kg)1.7
Organic content (g/kg)5.3
pH9.75
Result of mud ball testDispersive soil
Result of pinhole testDispersive soil
Dispersity (%)77.6
Exchangeable sodium percentage (%)24.8
CL: Low liquid limit clay.
Table 2. Design soil sample number, materials, and dosage in this study.
Soil Sample No.C/SSolid Dosage
(%)
Nano-SiO2 Dosage
(%)
CaO Dosage
(%)
D (dispersive soil)////
A-10.51//
B-11.01//
C-11.51//
A-20.52//
B-21.02//
C-21.52//
A-30.53//
B-31.03//
C-31.53//
NS-1//1/
NS-2//2/
NS-3//3/
NS-4//4/
CaO-1///0.4
CaO-2///0.6
CaO-3///0.8
CaO-4///1.0
Table 3. Initial ratio of each material of Ca–Si-treated soil.
Soil Sample No.C/SSolid Dosage
(%)
CaO Initial Ratio (%)SiO2 Initial Ratio (%)
A-10.510.320.68
B-11.010.480.52
C-11.510.580.42
A-20.520.641.36
B-21.020.971.03
C-21.521.170.83
A-30.530.952.05
B-31.031.451.55
C-31.531.751.25
Table 4. Dispersivity discrimination criteria [7,26,27,28].
Mud Ball TestPinhole TestResult
Serious reactions between soil and water and the soil–water interface was completely blurred.Cloudy water flowed under a 50 mm head and the pinhole was enlarged to more than 1.5 times.Dispersive (D)
Slight reactions between soil and water and the soil–water interface was slightly blurred.Cloudy water flowed under a 180 mm or 380 mm head and the pinhole was enlarged.Transitional (T)
No reaction between soil and water and the soil–water interface was clear.Clear water flowed under a 1020 mm head and the pinhole was unchanged.Non-dispersive (N)
Table 5. Test results of the dispersivity of soil.
Soil No.(Solid) Dosage (%)Pinhole TestMud Ball TestDiscrimination
H
(mm)
CR
(mL/s)
PD
(mm)
Result1 d3 d7 dAir-Dried
D/50cloudy0.292.5DDDDDD
CaO-10.450cloudy0.602.2DDDDDD
CaO-20.6180cloudy0.382.3TTTTTT
CaO-30.81020clear1.071.0NNNNNN
CaO-41.01020clear1.701.0NNNNNN
NS-11.050cloudy0.232.4DDDDDD
NS-22.050cloudy0.322.1DDDDDD
NS-33.0180cloudy0.582.1TDDTTT
NS-44.01020clear1.481.0NDTNNN
A-11.01020clear1.371.0NDDTNN
B-11.01020clear1.451.0NDTTNN
C-11.01020clear1.651.0NTNNNN
A-22.01020clear1.531.0NNNNNN
B-22.01020clear1.281.0NNNNNN
C-22.01020clear1.551.0NNNNNN
A-33.01020clear1.611.0NNNNNN
B-33.01020clear1.771.0NNNNNN
C-33.01020clear1.231.0NNNNNN
H: Head. C: Water color. R: Flow rate. PD: Final pinhole diameter. D: Dispersive. T: Transitional. N: Non-dispersive.
Table 6. Results of the dispersion and disintegration test.
Soil Sample No.Final Disintegration Rate (%)Final Disintegration Time (s)Average Disintegration Velocity (%/s)Maximum Disintegration Velocity (%/s)
D10015140.060.62
CaO-110018200.053.81
CaO-210015660.060.16
CaO-31004250.230.31
CaO-41003930.250.31
A-11.07/2.4 × 10−50.03
B-110012600.080.11
C-110010690.090.29
A-2−1.46/−3.4 × 10−50.03
B-210016030.060.11
C-21008920.110.18
Table 7. Particle volume composition of the laser particle analyzer test.
Soil Sample No.Particle Volume Composition (%)
<5 μm5~75 μm>75 μm
D9.871.119.1
CaO-32.638.359.1
CaO-45.543.251.3
A-19.947.043.2
B-19.644.545.9
C-17.844.647.6
A-210.440.948.7
B-29.938.351.8
C-28.736.454.9
Publisher’s Note: MDPI stays neutral with regard to jurisdictional claims in published maps and institutional affiliations.

