Abstract
Today, the use of numerical modeling for characterizing properties of porous media and related concepts has been widely extended, especially in subsurface flow issues such as geological CO2 storage and petroleum recovery. Therefore, in this study, the fundamental problem of laminar fluid flow through uniform or non-uniform and periodic array of cylinders was functionally investigated using the smoothed particle hydrodynamics (SPH) method as a modern and applied method of modeling in order to develop the past studies and introduce a complementary numerical tool alongside laboratory methods. All modeling processes were performed in the form of dimensionless processes for generalization and applicability at different scales. The results were used to characterize properties of porous media and to investigate basic properties such as fluid velocity, permeability, streamlines, and hydraulic tortuosity. Accuracy of modeling was shown in comparison with the results obtained in the literature. In this study, the potential of the method has been investigated in order to show the ability in modeling characteristic laboratory experiments of porous media and the possibility of using it instead of them. For this purpose, three periodic models of uniform and randomly distributed non-uniform porous media with arrays of circular, square, and diamond-shaped cylinders in a porosity range of 30–95%, with different types of cylinder distribution at the pore scale, were investigated. New equations were proposed for permeability as a function of porosity. Moreover, the method of tortuosity calculation was investigated directly through the time history of properties in the SPH method, and shape factors were obtained for the studied porous media models. The results showed that the geometry of a square cylinder with distribution in a square grid led to a higher permeability than circular and diamond-shaped grids. In contrast, diamond-shaped geometry with distribution in a hexagonal grid led to higher permeability than the other two models. Furthermore, diamond-shaped geometry had higher tortuosity, and circular and square geometries had almost identical tortuosity. Increasing the size of the modeling domain and decreasing the size of cylinders (i.e., decreasing resolution) reduces effects of the shape and the geometry of cylinders and achieves the same results. Random and non-uniform distribution of cylinders within porous media reduces fluid velocity, permeability, tortuosity, and shape factor (p) compared to the uniform models.
1. Introduction
Fluid flow through porous media and characterizing properties of porous media, such as permeability, fluid velocity, streamlines, and tortuosity, are important to study flow physics in various fields such as subsurface flow, CO2 sequestration, oil and gas recovery, and thermal reservoirs. Permeability is a well-known and important property that can be used in Darcy’s fluid flow equation in underground structures. In other words, permeability expresses formation transmissibility with fluid flowing inside it. On the other hand, tortuosity as a property indicates heterogeneity in the geometry of the structure and deviation of the actual path of fluid flow relative to a straight path. Of course, there are different types of tortuosity, such as hydraulic, diffusive, dispersive, and electrical tortuosity, among which the hydraulic type is very important in characterizing properties of porous media, and herein, the focus is on this type of tortuosity [1]. Today, computational modeling is used as a high-precision method to study the dynamic behavior of fluids in a porous media. Computational modeling is generally divided into two categories: grid-based and particle-based methods. Grid-based methods such as FDM and FEM have not shown much success compared to particle-based methods such as the smoothed particle hydrodynamics (SPH) method due to geometry and the complex contact surfaces of fluid flow in porous media [2]. Many pore-scale modeling studies have been performed so far using the general method of digital construction of porous media geometry, solving the Navier–Stokes equation, and calculating properties.
Matyka et al. investigated tortuosity through 2D random overlapping mono-sized squares using the lattice Boltzmann (LB) method and provided an algebraic relationship for tortuosity depending on hydraulic radius and specific surface area [3]. Duda et al. modeled fluid flow through 2D freely overlapping squares aimed at investigating tortuosity and presenting the tortuosity–porosity relationship in a porosity range of 36.7–99%. They showed that the tortuosity–porosity relationship can be calculated as a function of porosity with the following equation: τ = 1 + p(1 − ϕ)1/2, where p is a coefficient dependent on the geometry of porous media and influenced by solid particle size [4]. Latief and Fauzi modeled fluid flow inside a sample containing spherical and non-spherical 3D solid particles in a porosity range of 5–55% using LB. They investigated permeability calculation and compared it with the Kozeny–Carman model. They also presented a computational method for tortuosity using LB modeling [5]. Hyman et al. experimentally studied fluid flow in sand pack, sandstones, and carbonates in a porosity range of 43–60%, aimed at characterizing permeability and tortuosity in the laboratory. They also developed digital models related to the media under study. They also used a pore network and computational fluid dynamics (CFD) to model porous media in a 35–60% porosity range and investigated power laws for permeability [6]. Ebrahimi et al. used LB to model 2D staggered cylinders and 3D body-centered cubic spheres in a porosity range of 25–98%. They proposed algebraic relationships for permeability through modeling and worked on improving the Kozeny–Carman relationship [7]. Allen and Sun recently investigated properties of fluid flow and transfer such as permeability, tortuosity, and diffusion of computer-generated porous media. They studied three types of in-line arrays of uniform shapes, a staggered-array of squares, and randomly distributed square porous media using the staggered-grid finite-difference method. They mostly focused on diffusion and tortuosity [8]. A review of the literature showed that most of grid-based CFD methods have limitations in their application due to complex formulation, the need for more initial parameters for modeling, and complexity regarding application of the tracking algorithm for direct calculation of tortuosity.
The SPH method was first proposed by Lucy [9], as well as Gingold and Monaghan [10], and then it was modified in order to be used in modeling problems of fluid mechanics [11,12]. Finally, it was introduced as a valuable candidate for modeling fluid problems [13]. The SPH method has been developed in recent years to model pore scale and porous media under laminar flow conditions [14,15,16,17]. Zhu et al. introduced the SPH method as a formulation with the potential to predict mesoscopic and microscopic properties of pores in fluid flow modeling studies in a porous media [15]. Holmes et al. [18] and Pereira et al. [19] studied implementation of the SPH method to model fluid flow with a low Reynolds number in uniform porous media made of a 2D and 3D array of cylinders. They proposed a method for performing the friction coefficient and permeability calculations using the SPH method. In SPH studies, limitations of other computational methods have been reduced due to the simplicity of formulation that has made the method to be introduced one of options for modeling the flow of fluids at pore scale and providing the possibility of modeling the flow of fluid in porous media of the reservoir [20,21]. As mentioned before, a particle-based scheme is a key advantage of the SPH method, making it possible to extract particle time history and directly calculate system transfer with a particle-tracking algorithm. The simplicity of the formulation based on statistical mechanics, the ability to model complex systems, the lack of need for a contact surface tracking algorithm, and the possibility of a combinational application at multiple scales are other advantages of the SPH method [22].
To the best of our knowledge, most of the studies based on the SPH method have been focused on permeability calculation. Although the SPH method has been used widely to study the flow problems (particularly, multiphase flows) in porous media [23,24,25,26,27], we tried in this work to study streamlines and tortuosity using SPH. It can be considered as an added value and illustrate its capabilities. Recently, Wu et al. investigated the characterization of porous media in interior and exterior flow fields with free surfaces; however, their study does not include flow issues related to underground layers without free boundaries [28]. Jarrar et al. investigated the geometric tortuosity in saturated porous media using a 3D synchrotron microcomputed tomography imaging method and showed a laboratory method to extract the geometric tortuosity [29]. The main goal of this study is to investigate the potential of SPH in modeling and to characterize porous media and the possibility of using the SPH method as a complementary numerical tool alongside laboratory methods, as in the studies presented by Jarrar et al. [29]. On the other hand, it is possible to use the method for either extracting the hydraulic tortuosity of porous media produced by X-ray computed tomography (CT) images or characterizing packed systems made by particles with a specific geometric shape. It is noteworthy that we conducted a study to investigate SPH to characterize properties of porous media and to investigate basic properties, such as fluid velocity, permeability, streamlines, and tortuosity, in three models of uniform and randomly distributed non-uniform periodic porous media with an array of circular, square, and diamond-shaped cylinders in different distributions on the pore scale. The application of the SPH method to study fluid flow modeling through porous media with uniform and non-uniform, simple, and complex geometries is shown, and its characterization based on SPH formulation is investigated. Given the particle-based scheme of the SPH method, it allows to extract the time history for particles and calculate the system transfer rate. Interesting results were observed in relation to the effect of cylinder geometry on velocity profiles and streamlines. They show the possibility of using the SPH method to conduct dynamic characterization studies of underground flow. In this regard, the results were evaluated to provide practical relationships.
2. Smoothed Particle Hydrodynamics Method
2.1. Basics and Formulation
The original and classic formulation of the SPH method has been proposed for use by Monaghan to study fluid dynamics [11]. The simulation domain in the SPH is represented by a discrete set of particles. Based on the SPH method, properties of each particle are approximate and values of their functions and derivatives in discrete formulation are determined based on the information of neighboring particles [30]. For further details, see Appendix A. In general, in this study, the formulation used in the studies by Tartakovsky and Meakin [2] and especially Holmes et al. [18], presented to model flows with low Reynolds numbers in a porous media using the SPH method, was applied. In this study, incompressible fluid flow is considered by using a linear equation of state (EOS) as Equation (1), proposed by Morris et al. [14] to determine pressure at each particle and time step:
where is the reference density and c is the artificial sound speed. Morris et al. proposed that the artificial sound speed term, c, should be chosen according to desired maximum density fluctuation, generally around 1% [14]. It means that c can show the degree of incompressibility that is scaled for the system. The Navier–Stokes equations are the basis of CFD studies on incompressible fluid flow, and in this study, the discrete momentum equations used are defined as Equation (2) with respect to symmetric property:
where m is mass, U is velocity, N is the total number of particles, P is pressure, n is particle number density, W is the kernel function, μ is viscosity, r is position, g is gravitational acceleration, f is the applied external force, and i and j are indices of neighboring particles and particles, respectively. The concept of placing a certain average number of particles within smoothing area is another problem related to the formulation, which in this study, was used as a smoothing length by distributing it in a uniform hexagonal grid and taking into account the area radius [31,32]. The Cubic B-spline kernel function was used as the most widely used kernel function in SPH studies [33]:
where R is dimensionless relative distance, h is smoothing length, and αd is also the kernel function constant. Moreover, cell-linked list (CCL) was used to implement the neighboring particle search algorithm and the explicit velocity-Verlet integration algorithm was used to perform time iteration calculations of the formulation [34]. With this method, the position of each particle updates during simulation, and the time evolution of the system can be observed. The calculated time step, Δt, should satisfy the following conditions to obtain a stable solution [2,15]:
where |Fi| is the magnitude of force acting on particle i. For creating a periodic porous media, periodic boundary conditions were utilized in all modeling processes. For applying no-slippage boundary conditions on solid walls, the concept of artificial velocity of solid particles proposed by Holmes et al. [18] was used. Considering the possibility of the effects of creating tensile instability as a result of fluid flow through the solid geometry investigated in this study, the concept of artificial pressure presented in the study by Monaghan [35] was therefore used to eliminate the effects of tensile instability. Furthermore, all the equations of properties in the modeling performed in this study were used for generalization and applicability in a variety of dimensionless scales according to Table 1.

Table 1.
Dimensionless parameters.
In all modeling processes, water fluid with the properties of surface density of 1000 (kg/m2), viscosity of 1 (cP), and artificial sound speed of 0.0024 (m/s) in a symmetric system of particles in a hexagonal grid with 10,000 particles, with the same distribution in both directions of the modeling domain with dimensions of LxD = LyD = 1.0, was used. Since fluid flow inside porous media is generally of laminar type, all modeling processes were performed under laminar flow conditions with Re ≤ 30. To compare obtained results from SPH and exact values, the square relative error norm has been used based on Equation (5):
2.2. Testing and Verification: Fluid Flow around a Circular Cylinder
Although fluid flow modeling through a capillary tube is often used as the main performance test of SPH formulation associated with viscous and gravitational forces [14,36,37], fluid flow around a circular cylinder is one of fundamental issues in the study of viscosity force and fluid flow performance, which has been studied by various researchers such as Morris et al. [14] and Pereira et al. [19]. This problem was first proposed and modeled using the SPH method by Morris et al. [14], as represented in Figure 1. In this study, the problem of fluid flow around a circular cylinder with the geometry presented in Figure 1 was made. A total of 9000 fluid particles at dimensions of LxD = LyD = 1.0 inside the modeling domain, with a diameter of dD = 0.2 for the circular cylinder, were considered. A constant pressure difference of ΔPD = 105 was applied to all fluid particles in order to create a fluid flow in steady-state conditions. According to most studies, average particles of 36 and 64 are selected in the smoothing area [38]. Modeling was performed up to 25,000 time steps.
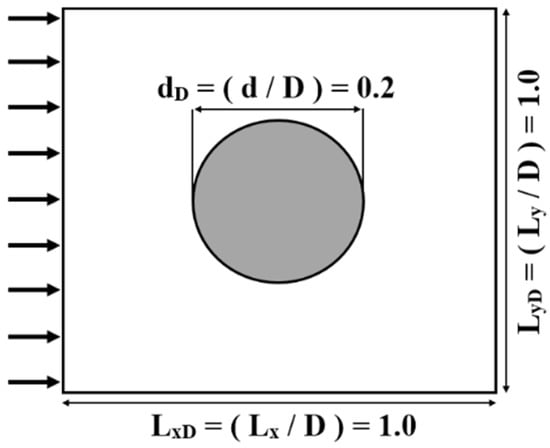
Figure 1.
Fluid flow problem around a single circular cylinder.
Figure 2 shows the particle position and velocity distribution profile in four consecutive time steps (tD = 3.32, 6.65, 9.97, and 27.70). There was a good agreement between our results and those obtained by Pereira et al. [19]. Particle distribution indicates kinetic evolution of particles and achievement of stable and, of course, disordered conditions due to performance of the viscosity force. Moreover, performance of the concept of artificial pressure to eliminate the effects of tensile instability created in transient stages of the system, due to the presence of a circular cylinder in center of flow domain, observed in the time step of 3000, was shown. The velocity profile showed the presence of a low-velocity area close to zero in the central section of the flow and around a circular cylinder due to friction between the fluid and solid walls and occurrence of a no-slippage boundary phenomenon on solid walls. Furthermore, an increase in velocity of the fluid particles while passing through the cross section of xD = 0.5 was observed due to shrinkage of the fluid cross section. For quantitative comparison, velocity of particles in two cross sections of xD = 0.5 and xD = 1.0, according to Figure 3, for average particle numbers of 36 and 64 in the smoothing area was extracted and compared with the results obtained by Morris et al. [14]. Consistency of the results as well as correct performance of the calibration method showed little effect on the selection of parameters dependent on the kernel function, such as smoothing length and number of particles within smoothing radius.
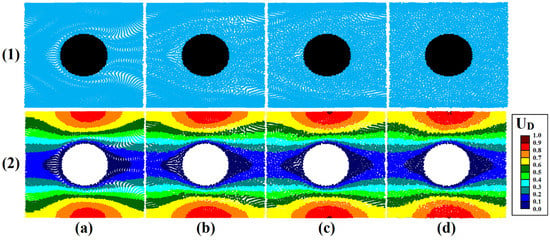
Figure 2.
Dimensionless position (1) and velocity (2) for fluid flow around a circular cylinder (Test 2) at four consecutive time steps, (a) tD = 3.32, (b) tD = 6.65, (c) tD = 9.97, (d) tD = 27.70.
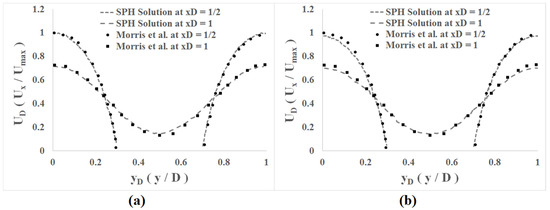
Figure 3.
Comparison of dimensionless velocity profile in SPH solution and Morris et al. [14] at two vertical cross sections with (a) 36 particles in the smoothing area and (b) 64 particles in the smoothing area.
The coefficient of friction, showing the resistance of porous media to flow, can be extracted in dimensionless form. The drag force is calculated simultaneously with modeling as net force is applied by fluid particles to the cylinder grid using K = Fd/4πμU. For further investigation, modeling fluid flow around a circular cylinder was repeated in various diameters in the 0.25–0.94. Table 2 shows a comparison made between computational values obtained in this study and the results obtained in the study by Holmes et al. [18]. The results showed a good agreement with the main study related to the formulation used in this study. In addition, the calculated square relative error norm for all modeling is about 4.25%, below 5%.

Table 2.
Comparison of friction coefficient (K).
3. Investigation of Fluid Flow through Periodic Uniform Porous Media
For characterizing porous media and investigating basic properties, such as fluid velocity, permeability, streamlines, and tortuosity using the SPH method, three models of uniform periodic porous media with an array of circular, square, and diamond-shaped cylinders in three different distributions at the pore scale were used, as presented in Figure 4. As mentioned above, the use of periodic boundary conditions allows the modeling of a single cell from a periodic porous media, and then, it should be extended to the entire periodic porous media. The cylinders were distributed in models No. 1 and 2 in a square grid and model No. 3 in a hexagonal grid. The parameters provided above were used for all models to achieve better comparison.
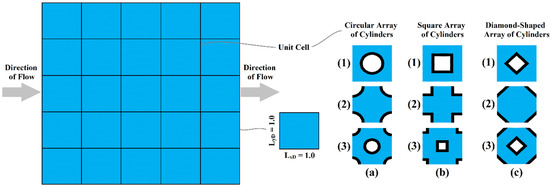
Figure 4.
Modeling domains as periodic uniform porous media based on an array of cylinders: (a) circular, (b) square, (c) diamond-shaped (Model 1: distribution of cylinders in a square grid and positioned periodic center as center of cylinder; Model 2: distribution of cylinders in a square grid and positioned periodic center as center of pore; Model 3: distribution of cylinders in a hexagonal grid and positioned periodic center as center of cylinder).
The array of cylinders was considered to be in the porosity range of 30–95%. All properties, such as porosity, mean apparent velocity (weighted average with particle density), and streamlines (using particle history and tracking algorithm) were calculated directly using statistical mechanics. Real velocity was calculated from the following equation: u = ϕU. Permeability was obtained from the Darcy’s law k = −μu/∇P. For measuring tortuosity, a direct calculation equation presented in the study by Duda et al. [4] in the form of Equation (6) was used:
where λ represents length of the streamline and w is the weighted average index. In this study, indices including w = 1 (arithmetic average), w = 1/t (weighted average type 1)—where t is the time spent by particle on streamline—and w = U/λ (weighted average type 2)—where U is average velocity in streamline—were used.
3.1. Fluid Flow through Uniform Circular Array of Cylinders
Fluid flow through the uniform circular array of cylinders was modeled using a time-step size of ΔtD = 6 × 10⁻⁴ in 25,000 time steps under laminar conditions (i.e., Re < 17). Table 3 presents the characterization and related properties of fluid flow, such as time to reach steady -tate condition, average apparent and actual velocities, permeability, and tortuosity for the circular array of cylinders in a porosity range of 30–95%. Models No. 1 and 2 differ from each other only in tortuosity due to the existence of different flow paths, and other properties have the same characterization. Model No. 3 shows lower permeability and higher tortuosity despite reaching fast stable conditions compared to models No. 1 and 2. Permeability in models No. 1 and 2 is almost two times the permeability of model No. 3 at the same porosity. According to the results, tortuosity with an arithmetic mean is calculated by more than two weighted average methods that are almost identical. Distribution in a hexagonal grid halves permeability and increases non-linear tortuosity relative to square distribution in flow through a circular array of cylinders.

Table 3.
Flow characterization of uniform circular array of cylinders.
Figure 5 shows the spatial profile along with streamlines and particle velocities in time step 25,000 for the models of the circular array of cylinders in a porosity interval of 70% at the pore scale. Nearly zero velocities were observed at the contact surface of the fluid and solid wall. Streamlines are obtained using time history and particle-tracking algorithms as a measure of identifying low or high tortuosity. Model No. 1 represents a pore throat, and model No. 2 represents a pore. The increase in velocity when the fluid particle enters throat and the decrease in velocity when entering the pore are quite evident. Convergence of streamlines by increasing velocity along with their divergence by decreasing velocity is also observed. Model No. 3 shows simultaneous flow in the pore and throat and a uniform velocity distribution with the same relative distance between streamlines along the pore and throat.
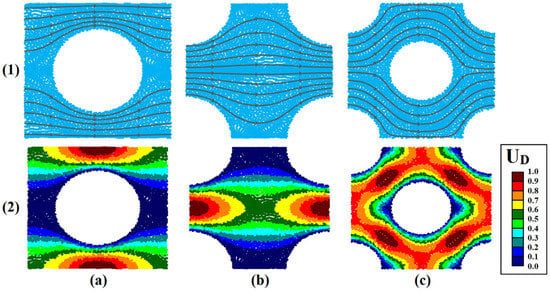
Figure 5.
Dimensionless position (1) and velocity (2) for flow through uniform circular array of cylinders at time step 25,000; (a) Model 1, (b) Model 2, (c) Model 3.
3.2. Fluid Flow through Uniform Square Array of Cylinders
Fluid flow through the uniform square array of cylinders was modeled like the previous array with a time-step size of ΔtD = 6 × 10⁻⁴ in 25,000 time steps under laminar conditions (i.e., Re < 17). Table 4 shows the characterization and related properties of fluid flow for the square array of cylinders in a porosity range of 30–95% for models No. 1 and 2 and in a range of 60–95% for model No. 3. Again, models No. 1 and 2 show similar characterization properties, except for tortuosity, due to different flow paths. Comparing the results at identical porosities showed the effect of the reduction of sharp edges on permeability along with an increase in tortuosity in model No. 3. Moreover, in models No. 1 and 2, an increase in average velocity (apparent and real) and permeability is observed due to the presence of sharp edges in the square array of cylinders compared to the circular array of cylinders. However, tortuosity is also decreased due to the stagnation of most fluid particles in places outside flowing paths. In model No. 3, a decrease in average velocity and permeability is observed simultaneously with an increase in tortuosity.

Table 4.
Flow characterization of uniform square array of cylinders.
Figure 6 shows the spatial profile along with streamlines and particle velocities in time step 25,000 for the square array of cylinders in 70% of the porosity range for models No. 1 and 2, and 80% of the porosity range for model No. 3. Return flow paths are observed in model No. 1. More inclination of flow paths to direct path is observed in models No. 1 and 2 than the circular array of cylinders. Model No. 3 also reduces the intensity of uniform velocity distribution in the pore and throat. The effects of the sharp edges of the square cylinder on the decrease in velocity and immobility of particles are quite evident.
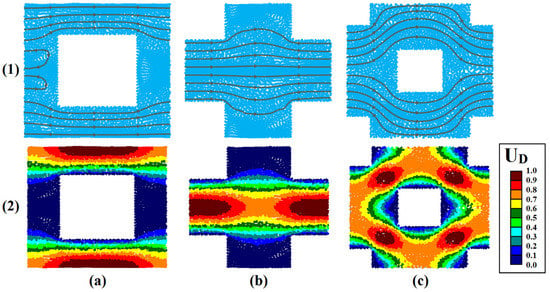
Figure 6.
Dimensionless position (1) and velocity (2) for flow through uniform square array of cylinders at time step 25,000; (a) Model 1, (b) Model 2, (c) Model 3.
3.3. Fluid Flow through Uniform Diamond-Shaped Array of Cylinders
Fluid flow through the uniform diamond-shaped array of cylinders was modeled with modeling parameters similar to the previous arrays, i.e., with a time-step size of ΔtD = 6 × 10⁻⁴ in 25,000 time steps under laminar conditions (i.e., Re < 17). Table 5 shows the characterization and related properties of fluid flow for the diamond-shaped array of cylinders in 60–95% of porosity range for models No. 1 and 2 and 30–95% of porosity range for model No. 3. In models No. 1 and 2, the diamond-shaped array of cylinders shows a decrease in characterization properties, such as average velocity, permeability, and tortuosity, compared to the circular and square arrays of cylinders. However, the increase in average velocity, permeability, and tortuosity is observed in model No. 3 compared to the circular array of cylinders as opposed to the square array of cylinders. There is also a high difference between average velocity, permeability, and tortuosity in model No. 3 compared to the square array of cylinders.

Table 5.
Flow characterization of uniform diamond-shaped array of cylinders.
Figure 7 shows the spatial profile along with streamlines and particle velocities in time step 25,000 for the diamond-shaped array of cylinders in a porosity range of 80% for models No. 1 and 2 and a porosity range of 70% for model No. 3. The tendency of more flow paths to the direct path is reduced in models No. 1 and 2 compared to the square array of cylinders, and a behavior similar to that of the circular array of cylinders can be observed. The intensity of uniform velocity distribution in the pore and throat and maintaining the distance between streamlines in model No. 3 is increased compared to the circular array of cylinders. The effects of the sharp edges of the diamond-shaped cylinder on reducing the velocity and immobility of the particles were reduced, and the volume of fluid particles at rest state was also reduced. Convergence behavior of streamlines by increasing velocity along with their divergence by decreasing velocity is also observed.
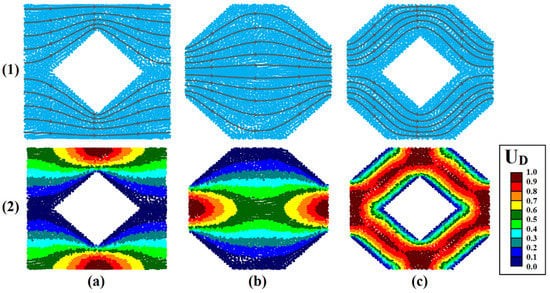
Figure 7.
Dimensionless position (1) and velocity (2) for flow through uniform diamond-shaped array of cylinders at time step 25,000; (a) Model 1, (b) Model 2, (c) Model 3.
4. Investigation of Fluid Flow through Periodic Non-Uniform Porous Media
After investigation of fluid flow through uniform porous media, characterization of fluid flow through non-uniform porous media was made by randomly distributing circular, square, and diamond-shaped cylinders at pore-scale was performed. For characterizing non-uniform porous media and investigating its properties using the SPH method, three models of non-uniform periodic porous media with random distributions of the circular, square, and diamond-shaped arrays of cylinders at the pore scale were made and used as presented in Figure 8. For the creation of non-uniformly porous media models, three types of single-size cylinders were randomly distributed within a unit cell as a modeling domain. The mono-diameter probability distribution function was used. Cylinders with radius rD = 0.0126 for the creation of porous media with an array of circular cylinders and also cylinders with xD = 0.0112 to create an array of square and diamond-shaped cylinders were used. The array of cylinders was considered in the porosity range of 48–95% and eight models. Other parameters, modeling conditions, and formulas for properties calculations are considered to be the same, with uniform models for better results comparison. Moreover, to better compare, the location of cylinders is considered the same in all non-uniform models.
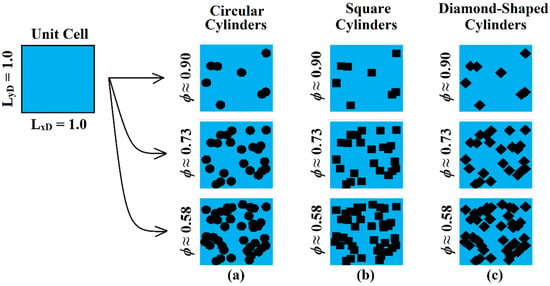
Figure 8.
Modeling domains as periodic non-uniform porous media based on the array of cylinders in three desired porosities in the range of 48–95%; (a) circular, (b) square, (c) diamond-shaped.
Fluid flow through the non-uniform array of cylinders was modeled using a time-step size of ΔtD = 6 × 10⁻⁴ in 25,000 time steps under laminar conditions (i.e., Re < 5). Table 6 presents the characterization and related properties of fluid flow, such as the time to reach steady-state condition, average apparent and actual velocities, permeability, and tortuosity for three types of non-uniform arrays of cylinders in a porosity range of 48–95%. According to the results, increasing the size of the modeling domain and decreasing the size of cylinders (i.e., decreasing resolution) reduces the effects of the shape and geometry of cylinders and achieves the same results. As shown in Table 6, characteristic values for steady-state time, fluid flow velocity, permeability, and tortuosity for all sets of circular, square, and diamond-shaped arrays of cylinders are similar. However, this difference was evident for uniform models with high-resolution. There is also a trend of non-linear changes for characterization parameters relative to porosity. Permeability changes occur at very high porosities. Therefore, the tortuosity changes and increases sharply in low porosity, and the flow path becomes very tortuous. Again, it is seen in the uniform models that tortuosity with arithmetic mean is calculated by more than two weighted averages with almost identical methods. A comparison of the results obtained for non-uniform models with model No. 3 of uniform models shows that the random and non-uniform distribution of cylinders reduces fluid velocity and permeability in non-uniform models compared to uniform models. Moreover, the tortuosity in uniform models is larger than its values in non-uniform models in corresponding porosities.

Table 6.
Flow characterization of non-uniform porous media made by circular array of cylinders.
Figure 9 and Figure 10 show spatial profiles along with streamlines and particle velocities in time step 25,000 for three models of circular, square, and diamond-shaped arrays of cylinders in two porosities of 73 and 90% at the pore scale. An increase in velocity when fluid particles enter into pore throats and a decrease in velocity when particles enter into pores are quite evident, as is the case in the uniform models. The convergence of streamlines by increasing velocity and their divergence by decreasing velocity is also observed. The model shows a simultaneous flow in the pore and throat and a uniform velocity distribution with the same relative distance between the streamlines along the pore and throat. The effects of the sharp edges of the square and diamond-shaped cylinders on velocity reduction and immobility of particles are quite evident. According to Figure 9 and Figure 10, for three non-uniforms made by an array of circular, square, and diamond-shaped cylinders, changes in the trend of streamlines, convergence, and divergence of streamlines due to velocity fluctuations, and the same velocity profiles, are observed. Moreover, the change in flow direction is quite obvious by increasing the number of cylinders and decreasing porosity. Due to the random distribution of a cylinder in the fluid flow path, the possibility of flow blocking and strong effects on tortuosity are observed.
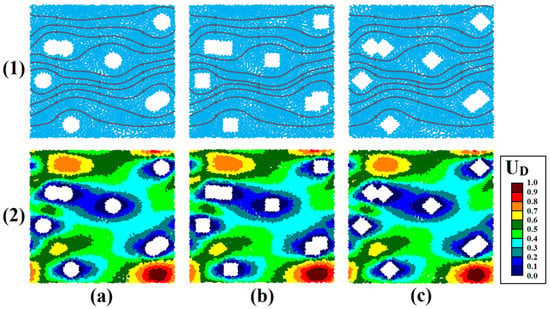
Figure 9.
Dimensionless position (1) and velocity (2) for flow through a randomly distributed non-uniform circular array of cylinders with ϕ = 0.9 at time step 25,000; (a) circular, (b) square, (c) diamond-shaped.
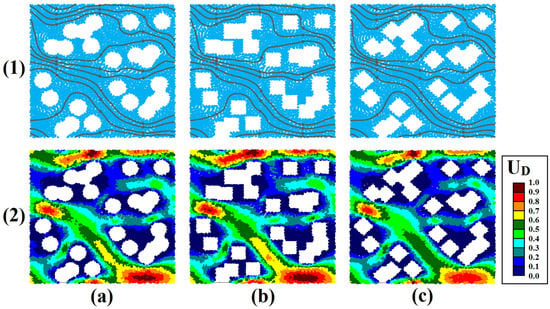
Figure 10.
Dimensionless position (1) and velocity (2) for flow through a randomly distributed non-uniform circular array of cylinders with ϕ = 0.73 at time step 25,000; (a) circular, (b) square, (c) diamond-Shaped.
5. Permeability–Porosity Relationships
The results of each study should be applicable to different problems. Therefore, in characterizing fluid flow through porous media, permeability–porosity relationships are of special importance for application in problems. Figure 11 shows a porosity-based permeability diagram for all the uniform and non-uniform modeled cylinder arrays. As shown in Figure 11, permeability changes nonlinearly by increasing porosity for both uniform and non-uniform cases.
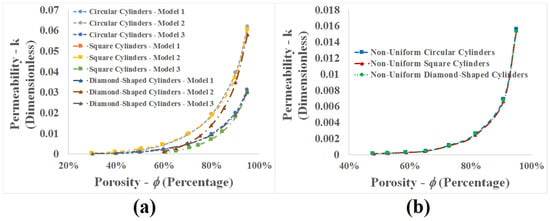
Figure 11.
Dimensionless permeability vs. porosity for circular, square, and diamond-shaped array of cylinders; (a) uniform, (b) non-uniform.
In this study, an attempt was made to extract and present permeability–porosity relationships related to the results of characterizing fluid flow through uniform and non-uniform periodic porous media with the circular, square, and diamond-shaped arrays of cylinders for practical usage. For this purpose, a curve-fitting method with a quadratic polynomial function according to Equation (7) was used. Table 7 shows the coefficients of the polynomial function for the permeability of the porous media as a function of porosity. Reinvestigation showed that relationships regarding the permeability of the porous media are calculated with a square relative error norm of less than 1%:

Table 7.
Coefficients for permeability–porosity relationship.
6. Tortuosity–Porosity Relationships
In this study, the direct calculation equation proposed by Duda et al. [4] in the form of Equation (6) was used based on three indices (w = 1, 1/t, U/λ as mentioned before). Here, it was tried to investigate the performance of indicators in the calculation of tortuosity. The calculated results showed that computational values of the two types of weighted averages are almost the same. Allen and Sun [8] in recent modeling investigated the tortuosity of fluid flow through uniform circular and square arrays of cylinders using CFD. For evaluating the computational performance of the indices, tortuosity in the fluid flow, through uniform circular and square arrays of cylinders, in this study was compared with the results obtained in the study by Allen and Sun [8]. Figure 12 shows a comparison of tortuosity as a function of porosity. According to Figure 12, arithmetic averaging provides larger values than the weighted average. There was an agreement between the results of the weighted average and those obtained in the study by Allen and Sun [8]. It can be said that using a weighted average (with time or velocity) (Equation (6)) provides better results than arithmetic averaging.
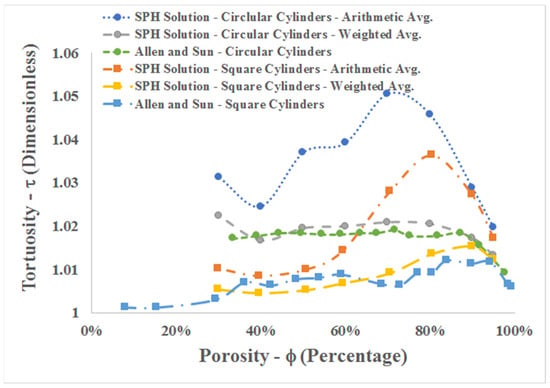
Figure 12.
Comparison of tortuosity in models 1 and 2 of a circular and square array of cylinders with [8].
As mentioned earlier, several studies have investigated and presented tortuosity–porosity relationships in fluid flow through uniform and non-uniform porous media. First, Koponen et al. presented a simple linear relationship (τ = 1 + 0.8(1 − ϕ)) for calculating tortuosity in the 50–100% porosity range [39]. Then, Duda et al. [4] modeled fluid flow through free and randomly distributed overlapping squares aimed at investigating tortuosity and presenting a tortuosity–porosity relationship (τ = 1 + p(1 − ϕ)1/2) with the shape factor (p) in the porosity range of 36.7–99%. They showed that tortuosity can be calculated by a non-linear equation, where the coefficient p is dependent on the geometry of porous media and influenced by solid particle size. Distribution of cylinders according to model No. 3 in the uniform porous media investigated in this study can represent a porous media. Moreover, there is a randomly distributed non-uniform periodic array of cylinders close to the real porous media that can be used to investigate the tortuosity–porosity relationship. The results showed that the tortuosity–porosity relationship was never linear.
Figure 13 shows a comparison of tortuosity in model No. 3 of the uniform circular, square, and diamond-shaped arrays of cylinders with linear and non-linear equations with p = 0.5. Non-linear behavior of tortuosity is observed as a function of porosity. The values also showed that tortuosity in the circular and square arrays of cylinders is almost the same. On the other hand, the same trend is observed in computational tortuosity with the SPH method in model No. 3 of the circular, square, and diamond-shaped arrays of cylinders along with a non-linear equation. Therefore, in this study, the correlation of tortuosity with a non-linear equation was investigated and the shape factor (p), depending on the geometry of the porous media for model No. 3 of the circular, square, and diamond-shaped arrays of cylinders, was determined. Using a curve-fitting method, the shape factor (p) can be determined in accordance with modeling performed in this study. Thus, a value of 0.32 was obtained for the circular and square arrays of cylinders, and 0.38 was achieved for the diamond-shaped array of cylinders with an average relative square error of less than 1%. Figure 14 shows a comparison between computational tortuosity with the SPH method in model No. 3 of the uniform circular, square, and diamond-shaped arrays of cylinders with a non-linear equation and the values obtained for the shape factor (p).
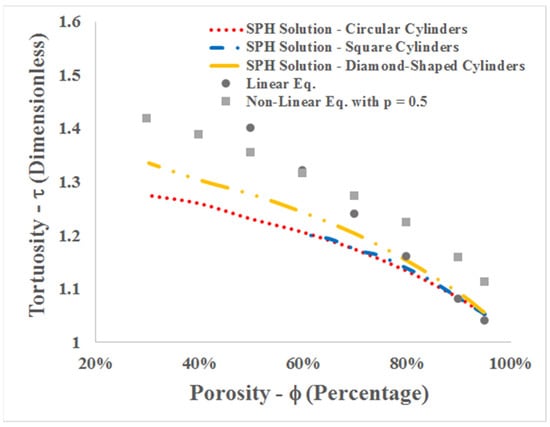
Figure 13.
Comparison of tortuosity in model 3 of the array of cylinders with linear and non-linear equations.

Figure 14.
Curve fitting of tortuosity with proportional shape factor for the uniform array of cylinders; (a) circular, (b) square, (c) diamond-shaped.
Figure 15 shows a comparison between computational tortuosity with the SPH method in the non-uniform randomly distributed circular, square, and diamond-shaped arrays of cylinders with a non-linear equation and the average obtained for the shape factor (p) of about 0.2 for all cases. As mentioned earlier, by increasing the size of the modeling domain and decreasing the size of cylinders (i.e., decreasing resolution), shape effects of various cylinders are reduced and the tortuosity and shape factor (p) results are closer to each other. Figure 15 shows it can be concluded that it is not possible to fit the curve with a square relative error norm of less than 1% due to data scatter. However, a reasonable range of shape factors (p) with a square relative error norm of less than 5% can be obtained for all cases of circular, square, and diamond-shaped arrays of cylinders. The calculated shape factor (p) range for all the non-uniform models is 0.15–0.25. The shape factor (p) 0.2 has a minimum squared relative error norm. By comparing the results between two models, it can be concluded that tortuosity and shape factor (p) in non-uniform models are less than in uniform models. Moreover, both properties tend to be small by reducing the size of cylinders.

Figure 15.
Curve fitting of tortuosity with proportional shape factor for the randomly distributed non-uniform array of cylinders; (a) circular, (b) square, (c) diamond-shaped.
7. Conclusions
Characterization of fluid flow through uniform and periodic porous media from the circular, square, and diamond-shaped arrays of cylinders using SPH modeling, mostly aimed at developing the study performed by Holmes et al. [18], once again demonstrates key advantages of the SPH method including its simple formulation based on statistical mechanics and the ability to extract results directly, the simplicity of applying the particle-tracking algorithm, the possibility of performing calculations of properties during modeling, the high adaptability of the method in a variety of conditions, and the ability to model complex systems. The results showed that it is possible to use the SPH method to characterize ideal porous media produced by the packing method of regular particles or real media extracted by X-ray computed tomography (CT) images without conducting any flow experiments. The SPH method can be used for the primary characterization of the new porous media and the calculation of permeability and tortuosity for other applications. Through using dimensionless variables, the dependence of SPH formulation on the selection of numerical modeling factors, such as smoothing length, distance between particles, and the number of particles within the smoothing radius, was reduced. Non-linear behavior for all characterization parameters versus porosity is observed in all models. Using weight averaging to calculate direct tortuosity is better than applying the time history of SPH particles.
SPH can also be used to model pore and throat flow behavior with complex geometries and to derive relationships of characteristic properties such as permeability–porosity, tortuosity–porosity, and proportional shape factor (p). Increasing the modeling domain size and decreasing the size of cylinders (i.e., decreasing resolution) reduces the effects of the shape and geometry of cylinders and achieves the same results. According to the results of flow modeling through the uniform circular, square, and diamond-shaped arrays of cylinders, despite solid particles distributed in a square grid within porous media, the geometry of solid particles is suggested to be similar to a square cylinder. However, the geometry of solid particles is recommended to be similar to diamond-shaped cylinders for distributing solid particles in a hexagonal grid. The distribution of solid particles in a hexagonal grid within porous media halves permeability (transmissibility of porous media) and increases tortuosity exponentially. Tortuosity in diamond-shaped geometry is more than in circular and solid geometries and has a high shape factor. The results of flow modeling through randomly distributed non-uniform models showed that it is easy to use SPH to study fluid flow through porous media with complex geometry. Moreover, the random and non-uniform distribution of cylinders within porous media reduces fluid velocity, permeability, tortuosity, and shape factor (p) compared to the uniform models. Permeability changes in mediums with higher porosity are evident exponentially, and the intensity of the changes decreases with porosity reduction. In addition, tortuosity in uniform models is larger than its values in non-uniform models at corresponding porosities.
Author Contributions
Conceptualization, M.M. and M.R.; methodology, M.M. and M.R.; software, M.M.; validation, M.M. and M.R.; formal analysis, M.M.; investigation, M.M. and M.R.; resources, M.M.; data curation, M.M.; writing—original draft preparation, M.M.; writing—review and editing, M.R.; visualization, M.M.; supervision, M.R.; project administration, M.R. All authors have read and agreed to the published version of the manuscript.
Funding
This research received no external funding.
Conflicts of Interest
The authors declare no conflict of interest.
Appendix A
SPH approximations for field quantities such as density and velocity develop from the exact integral interpolant of a field:
where A(r) is a field quantity determined at the position r, δ is the Dirac delta function, and (r − r’) is the relative distance R around position r. Equation (A1) defines a value at some specific location, r, as being a singularity on a known continuous field. Equation (A1) can be approximated by:
where W(R,h) is a smoothing function. Now, field quantity A(r) is determined through a weighted interpolation of surrounding field values. This weighting is characterized by the smoothing length h. The kernel W must approximate a Gaussian satisfying condition, as follows:
Moreover, the contribution of field values outside of some finite support domain tends toward zero due to the nature of a normal function such as Gaussian. For numerical efficiency, it is convenient to impose a compact support on the smoothing function where only values within some specified bound are considered to have non-negligible effect:
The parameter k depends on the type of smoothing function and is chosen to ensure that an adequate proportion of the function resides in each support domain, to ensure the error associated with such an assumption is small. By discretizing the fluid volume into a finite number of particles, Equation (A2) can be approximated by the summation interpolant:
where smoothing length h is generally set as the initial particle spacing, mj and are the mass and density of particle j at position rj, and the fraction mj/ accounts for the approximate volume of space each particle represents to maintain consistency between the continuous Equation (A2) and the discrete Equation (A5) forms of the field expression. Correspondingly, the gradient of A is given:
Authors such as Tartakovsky and Meakin [2] have suggested a variation to Equations (A5) and (A6), where a particle number density term, ni, is used in place of fraction /mi, where
Thus, the field quantity of density for each particle in ri position is calculated by the particle approximation method:
Equation (A10) conserves mass exactly, much like the summation density approach of conventional SPH. Use of a particle number density variant of the SPH formulation is typically motivated by the need to accommodate multiple fluid phases of significantly differing densities [2,22,40]. According to Equation (A10), the particle number density is equal to the inverse of the volume occupied by each particle. Therefore, the volume of each particle and, consequently, the particle number density are part of the modeling input information.
References
- Vald´es-Parada, F.J.; Porter, M.L.; Wood, B.D. The role of tortuosity in upscaling. Transp. Porous Media 2011, 88, 1–30. [Google Scholar] [CrossRef]
- Tartakovsky, A.M.; Meakin, P. Pore scale modeling of immiscible and miscible fluid flows using smoothed particle hydrodynamics. Adv. Water Resour. 2006, 29, 1464–1478. [Google Scholar] [CrossRef]
- Matyka, M.; Khalili, A.; Koza, Z. Tortuosity-porosity relation in porous media flow. Phys. Rev. E 2008, 78, 026306. [Google Scholar] [CrossRef]
- Duda, A.; Koza, Z.; Matyka, M. Hydraulic tortuosity in arbitrary porous media flow. Phys. Rev. E 2011, 84, 1–8. [Google Scholar] [CrossRef]
- Latief, F.D.E.; Fauzi, U. Kozeny-Carman and empirical formula for the permeability of computer rock models. Int. J. Rock Mech. Min. Sci. 2012, 50, 117–123. [Google Scholar] [CrossRef]
- Hyman, J.D.; Smolarkiewicz, P.K.; Larrabee Winter, C. Pedotransfer functions for permeability: A computational study at pore scales. Water Resour. Res. 2013, 49, 2080–2092. [Google Scholar] [CrossRef]
- Ebrahimi Khabbazi, A.; Ellis, J.S.; Bazylak, A. Developing a new form of the Kozeny-Carman parameter for structured porous media through Lattice-Boltzmann modeling. Comput. Fluids 2013, 75, 35–41. [Google Scholar] [CrossRef]
- Allen, R.; Sun, S. Computing and comparing effective properties for flow and transport in computer-generated porous media. Geofluids 2017, 4517259. [Google Scholar] [CrossRef]
- Lucy, L.B. A numerical approach to the testing of the fission hypothesis. Astron. J. 1977, 82, 1013–1024. [Google Scholar] [CrossRef]
- Gingold, R.A.; Monaghan, J.J. Smoothed particle hydrodynamics: Theory and application to non-spherical stars. Mon. Not. R. Astron. Soc. 1977, 181, 375–389. [Google Scholar] [CrossRef]
- Monaghan, J.J. Smoothed particle hydrodynamics. Annu. Rev. Astron. Astrophys. 1992, 30, 543–574. [Google Scholar] [CrossRef]
- Monaghan, J.J. Simulating free surface flows with SPH. J. Comput. Phys. 1994, 110, 399–406. [Google Scholar] [CrossRef]
- Grenier, N.; Le Touzé, D.; Antuono, M.; Colagrossi, A. An Improved SPH Method for Multi-Phase Simulations. 2009. Available online: https://core.ac.uk/download/pdf/37833645.pdf (accessed on 15 June 2022).
- Morris, J.P.; Fox, P.J.; Zhu, Y. Modeling low Reynolds number incompressible flows using SPH. J. Comput. Phys. 1997, 136, 214–226. [Google Scholar] [CrossRef]
- Zhu, Y.; Fox, P.J.; Morris, J.P. A pore-scale numerical model for flow through porous media. Int. J. Numer. Anal. Methods Geomech. 1999, 23, 881–904. [Google Scholar] [CrossRef]
- Zhu, Y.; Fox, P.J. Smoothed particle hydrodynamics model for diffusion through porous media. Transp. Porous Media 2001, 43, 441–471. [Google Scholar] [CrossRef]
- Zhu, Y.; Fox, P.J. Simulation of pore-scale dispersion in periodic porous media using smoothed particle hydrodynamics. J. Comput. Phys. 2002, 182, 622–645. [Google Scholar] [CrossRef]
- Holmes, D.W.; Williams, J.R.; Tilke, P. Smooth particle hydrodynamics simulations of low Reynolds number flows through porous media. Int. J. Numer. Anal. Methods Geomech. 2011, 35, 419–437. [Google Scholar] [CrossRef]
- Pereira, G.G.; Prakash, M.; Cleary, P.W. SPH modelling of fluid at the grain level in a porous medium. Appl. Math. Model. 2011, 35, 1666–1675. [Google Scholar] [CrossRef]
- Golparvar, A.; Zhou, Y.; Wu, K.; Ma, J.; Yu, Z. A comprehensive review of pore scale modeling methodologies for multiphase flow in porous media. Adv. Geo-Energy Res. 2018, 2, 418–440. [Google Scholar] [CrossRef]
- Su, J.; Wang, L.; Gu, Z.; Zhang, Y.; Chen, C. Advances in pore-scale simulation of oil reservoirs. Energies 2018, 11, 1132. [Google Scholar] [CrossRef]
- Liu, M.B.; Liu, G.R. Smoothed Particle Hydrodynamics (SPH): An Overview and Recent Developments. Arch. Comput. Methods Eng. 2010, 17, 25–76. [Google Scholar] [CrossRef]
- Kunz, P.; Zarikos, I.M.; Karadimitriou, N.K.; Huber, M.; Nieken, U.; Hassanizadeh, S.M. Study of multi-phase flow in porous media: Comparison of SPH simulations with micro-model experiments. Transp. Porous Media 2015, 114, 581–600. [Google Scholar] [CrossRef]
- Sivanesapillai, R.; Falkner, N.; Hartmaier, A.; Steeb, H. A CSF-SPH method for simulating drainage and imbibition at pore-scale resolution while tracking interfacial areas. Adv. Water Resour. 2016, 95, 212–234. [Google Scholar] [CrossRef]
- Sivanesapillai, R.; Steeb, H. Fluid Interfaces during viscous-dominated primary drainage in 2D micromodels using pore-scale SPH simulations. Geofluids 2018, 2018, 8269645. [Google Scholar] [CrossRef]
- Liu, J.; Zhang, T.; Sun, S. Study of the imbibition phenomenon in porous media by the smoothed particle hydrodynamic (SPH) method. Entropy 2022, 24, 1212. [Google Scholar] [CrossRef]
- Bai, B.; Wang, Y.; Rao, D.; Bai, F. The effective thermal conductivity of unsaturated porous media deduced by pore-scale SPH simulation. Front. Earth Sci. 2022, 10, 943853. [Google Scholar] [CrossRef]
- Wu, S.; Rubinato, M.; Gui, Q. SPH simulation of interior and exterior flow field characteristics of porous media. Water 2020, 12, 918. [Google Scholar] [CrossRef]
- Jarrar, Z.A.; Al-Raoush, R.I.; Hannun, J.A.; Alshibli, K.A. New model for estimating geometric tortuosity of variably saturated porous media using 3D synchrotron microcomputed tomography imaging. Soil Sci. Soc. Am. J. 2021, 85, 1867–1879. [Google Scholar] [CrossRef]
- Liu, G.R. Smoothed Particle Hydrodynamics (SPH) Formulation; Coarse Note; Department of Mechanical Engineering, National University of Singapore: Singapore, 2000. [Google Scholar]
- Morris, J.P. A study of the stability properties of smooth particle hydrodynamics. Publ. Astron. Soc. Aust. 1996, 13, 97–102. [Google Scholar] [CrossRef]
- Kelager, M. Lagrangian Fluid Dynamics Using Smoothed Particle Hydrodynamics; Graduate Project; Department of Computer Science, University of Copenhagen: Copenhagen, Denmark, 2006. [Google Scholar]
- Monaghan, J.J.; Lattanzio, J.C. A refined particle method for astrophysical problems. Astron. Astrophys. 1985, 149, 135–143. [Google Scholar]
- Allen, M.P.; Tildesley, D.J. Computer Simulation of Liquids; Oxford University Press: Oxford, UK, 2001; Volume 81. [Google Scholar]
- Monaghan, J.J. SPH without a tensile instability. J. Comput. Phys. 2000, 159, 290–311. [Google Scholar] [CrossRef]
- Takeda, H.; Miyama, S.M.; Sekiya, M. Numerical simulation of viscous flow by smoothed particle hydrodynamics. Prog. Theor. Phys. 1994, 92, 939–960. [Google Scholar] [CrossRef]
- Sigalotti, L.D.G.; Klapp, J.; Sira, E.; Melean, Y.; Hasmy, A. SPH simulations of time-dependent Poiseuille flow at low Reynolds numbers. J. Comput. Phys. 2003, 191, 622–638. [Google Scholar] [CrossRef]
- Pirovano, M. Accurate Real-Time Fluid Dynamics Using Smoothed Particle Hydrodynamics and CUDA. Master’s Thesis, Politecnico di Milano, Milano, Italy, 2010. [Google Scholar]
- Koponen, A.; Kataja, M.; Timonen, J. Tortuous flow in porous media. Phys. Rev. E 1996, 54, 406–410. [Google Scholar] [CrossRef]
- Hu, X.Y.; Adams, N.A. A multi-phase SPH method for macroscopic and mesoscopic flows. J. Comput. Phys. 2006, 213, 844–861. [Google Scholar] [CrossRef]
Publisher’s Note: MDPI stays neutral with regard to jurisdictional claims in published maps and institutional affiliations. |
© 2022 by the authors. Licensee MDPI, Basel, Switzerland. This article is an open access article distributed under the terms and conditions of the Creative Commons Attribution (CC BY) license (https://creativecommons.org/licenses/by/4.0/).