Abstract
The efficiency of an industrial park’s operations is an indicator of how well the park can serve the companies located there. These supports include support for environmental water resources and business operations. In this study, a model for measuring water resources management efficiency is developed at the conceptual level using the management mindset of relative efficiency and management by objectives, and a modified Delphi method is used to determine the feasibility of a measurement model for water resources management efficiency. Furthermore, DEA data envelopment analysis was used to analyze the overall operational efficiency of the park. The results of the study showed that the model developed in this study for measuring water resources efficiency is of practical use. In addition, water resource management efficiency can be used as an indicator to assist in the determination of the operating efficiency of the industrial park when it is derived from the DEA analysis. In this study, among the 31 industrial parks in Taiwan, the operating efficiency values were classified into four categories, and the results show that the operating efficiency of most of the industrial parks need to be improved.
1. Introduction
Water is a resource necessary for human life and socio-economic progress [1]. However, water is considered to be a limited resource [2]. Water scarcity [3] and water pollution are the two major crises in global water management [4]. However, global water scarcity poses a great threat to the future development of societies and economies [5]. Industrial parks, areas heavily dependent on water, are spaces in which enterprises converge for production, similar to residential spaces, and are important urban functional spaces [6]. The strategic planning of industrial parks and the effectiveness of their management are key factors affecting their level of economic, social and environmental performance [7].
Internationally, the management of industrial parks is trending towards a transformation into eco-industrial parks [7]. Enterprise clusters are a mainstream approach to promoting regional economic development and they play an important role in optimizing redevelopment [8]. In China, for example, the rapid development of industrial parks in China, such as Shekou Industrial Zone in Shenzhen and the Zhongguancun Science and Technology Park and Suzhou Industrial Park, has played an important role in leading China’s economy to an era of prosperity since its economic reform and opening over 40 years ago [9]. Thus, the operational efficiency of industrial parks is of paramount importance. In recent years, the amount of unused industrial land in China has been increasing, which may have led to a series of urban problems that hinder sustainable urban development [10].
Research on industrial parks has focused on the area of sustainability, enabling the performance of industrial parks and their return on investment to be assessed and compared [11]. However, most sustainability-related research focuses on the environment in the Environmental, Social and Governance (ESG) domain [12]. The best way to identify the operational efficiency of an industrial park is to design a set of economic and non-economic variables that are of practical use and take into account the economic and non-economic aspects of sustainable development. Since the outbreak of COVID-19, the importance of traditional or basic industries has been recognized around the world. For example, the assembly of mask machines and the production of their key components are a living example of the capacity of traditional industries in an economy that was difficult to find in the early stages of the outbreak [13].
The purposes of this study are (1) to create a novel and practical model for measuring the operational efficiency of industrial parks, (2) to validate the new model developed in this study by using industrial parks managed by government departments in Taiwan, and (3) to use the results of the analysis of industrial parks in Taiwan as an important reference for investment in Taiwan.
2. Literature Review
2.1. Industry Cluster
The study of industrial agglomeration began in the late 19th century with the British economist Marshall, who found that clusters of industries could facilitate knowledge sharing and technology diffusion among firms, leading to the prosperity of industries in cities [14]. In the case of manufacturing industries, they will first be concentrated in the more developed centres in pursuit of higher corporate profits, thus creating a spatial pattern [15,16]. In addition to its economic benefits, manufacturing agglomeration is also an important driver of urban spatial transformation and upgrading [17]. Subsequently, studies on the spatial effects of agglomeration economies have also been increasingly common [18,19].
In the 1980s and 1990s, Europe witnessed the fruitful economic results of industrial clusters of technology parks [20]. The rapid development of the Chinese economy over the past 30 years has led to the emergence of manufacturing industries in China as a result of investment and the establishment of factories in the country, driving changes in production locations and reshaping the geographic clustering of the Chinese economy [21]. Technological parks offer a cluster effect by bringing together upstream, midstream and downstream manufacturers, professional suppliers and equipment manufacturers in the park space and collaborating with intermediaries to produce industries [22]. The clustering of industries in technology parks increases the employment rate of the local space and the construction of the parks, and has the effect of generating higher output and tax revenues than in traditional industrial areas [23].
Rapid economic development can have both positive and negative effects. Studies show that industrial clusters can attract the attention and resources needed to reduce the rate of environmental pollution and incentivize enterprises to apply cleaner production technologies [24]. However, scholars have suggested that after industrial agglomeration reaches a certain level of development, enterprises will generate serious environmental pollution and environmental pollutants [25]. This suggests that the environmental impacts of industrial agglomeration need to be reviewed on a regular basis in order to avoid irreversible environmental pollution. Industry clusters are affected by environmental pollution and environmental policies [26]. Increasing reduced emissions productivity would support the pollution heaven hypothesis [27]. The higher the level of contamination damage, the lower the cluster stability [28].
2.2. Industry Park
The success of the Hsinchu Science Park, an industrial park in the Hsinchu area of northern Taiwan, where Taiwan’s high-tech industries are concentrated, comes from the regional development of technology clusters [29]. Successful technology parks are built and maintained by the government, universities, and private organizations, each with its own role to play [30]. The establishment and successful operation of the Hsinchu Science Park has led to the prosperous development of the entire electronic information industry in Taiwan [31].
An industrial park is a multi-functional vehicle that offers many functions, such as manufacturing, services, science, research and training, and provides a full range of services to enterprises and employees. Efficiently operated industrial parks create employment opportunities, increase the value added of land and reduce the wealth gap in society [11]. Industrial clustering, in turn, affects industrial development and helps to increase the value of industrial land [32]. The choice of location and the dissatisfaction of enterprises with the management services of industrial estates also affect the price of industrial land [32].
Eco-industrial parks (EIPs) have attracted the interest of many scholars as a way to promote the circular economy [33,34,35]. In many countries, eco-industrial parks, in which companies share materials and resources and can optimize economic and environmental performance, are emerging [36]. Eco-industrial parks can also reduce resource waste and pollution and increase economic benefits, thereby reducing global impacts [35]. Industrial parks are one of the leading factors influencing the layouts of manufacturing industries [14]. The relative performance of the industrial parks is also an important factor in the field of industry management. In the case of industrial zones in China, where land is state-owned, an increase in the size of industrial land leases could create greater fiscal revenue potential for local governments [37]. Ref. [6] used a time-series analysis tool to systematically sort out the planning standards of industrial parks in China from 1985 to 2021, and the study covered the development history of industrial zones in China from land-oriented, to industry-oriented, and more recently, to people-oriented.
The Analytic Hierarchy Process (AHP) and Fuzzy Logic (FL) were implemented for accessing the industrial impact on water sustainability using official statistics from El Bajío, Guanajuato State, Mexico [38]. Applying the [38] model to analyze the efficiency of water management in industrial parks requires a large amount of data, but whether these data can be obtained outside of Mexico is a test of practical application. In China, state-level high-tech enterprises will not only reduce the pollution intensity of the local area, but also the pollution intensity of the surrounding area [39]. This means that the more technological the industrial park is, the lower the relative pollution it causes. However, the focus of this research is not high-tech industry, therefore, when studying the operational efficiency of industrial parks, the study must also be combined with non-financial indicators to enable a comprehensive analysis.
2.3. Water Resource Management
Water is one of the essential resources for human survival and development [40]. It provides essential ecosystem services and, at the same time, is relevant to human well being and constrains sustainable regional development [41]. Forty percent of the world’s population faces a shortage of freshwater, and this proportion is expected to increase to 67% by 2050 [42]. The limited and uneven distribution of freshwater resources has led to a water crisis in many regions, and this problem is becoming more pronounced as the demand for water increases for industrial, agricultural and domestic use [43,44]. To achieve sustainability and efficiency in the use of available resources, the UN Sustainable Development Goals (SDGs) are the main guidelines to be considered [45]. The UN General Assembly has implemented Sustainable Development Goals (SDGs) for 2015–2030 to address global challenges, including air pollution, energy and food security and water scarcity [46].
In recent years, many governments have been faced with the enormous problem of increasing global warming [47]. Energy management issues are one of the topics of interest to researchers [48]. Water-related, sewage and sludge treatment issues lead to CO2 emissions [49], which, in turn, affects climate change. This sort of anthropogenic climate change affects water resources and water demand, including water for irrigation [50]. Sustainable use of water resources is essential to overcome this problem [51,52]. The relatively stable supply of recycled water, which is less affected by climate and seasonal changes, has become the preferred strategy in many countries [53,54,55]. Developed countries, such as the United States and Israel, have achieved a recycled water utilization rates of over 70%, while the current rate in most countries is still small (for example, mainland China is only around 10%) [56,57]. The basic water quality discharge target values for industrial water are higher than those for other water uses. This is to ensure the safety of industrial reuse; higher treatment requirements need to be imposed on water reclamation plants [58]. The design of the wastewater treatment process first needs to meet the legal requirements for the quality of the wastewater to be discharged into the river. This means that some of the organic matter carried by the wastewater is released into the environment as an output from the plant [59]. From the point of view of resource sustainability, the recovery of water from waste water is an important aspect [2]. The most direct and important service, whether from groundwater or surface water, is the supply of water for domestic and productive use. The value of water services is reflected in the price of water [60]. In order to assess the economic rationale for investing in pumped storage power stations, a very precise method is used to cover the uncertainties associated with the electricity market [61].
Ref. [62] highlights the importance of water management and protection in addressing critical water resource issues related to scarcity and sustainability. Ref. [63] developed a potential framework for water resources management. Ref. [64] emphasizes that such a framework depends on national water policies. Water efficiency is a multi-input and multi-output issue [65], and data envelopment analysis (DEA) is a non-parametric approach that can be used without assuming production functions and setting relevant weights [66]. DEA has advantages when dealing with multiple input/output problems [67]. Because of the deterioration of the aquatic ecosystems as a result of rapid economic development, previous evaluations of the aquatic ecosystem have generally focused on the economic and ecological environment [68]. Ref. [69] evaluates the sustainability of corporate water use, with indicators including environmental, economic, social and resource indicators. Water footprints have been emphasized by academic scholars, including concepts, methods and applications for better management of water resources and water ecology [70,71].
In China, for example, chemical oxygen demand (COD) emissions and ammonia nitrogen (NH3) emissions fell significantly by 2.99% in response to the government’s environmental investment policy [72]. This shows that investment policies are closely related to the efficiency of water management. If the government can have a better understanding of the efficiency of water resources management at the management level, it will be assist the government in formulating investment policies for industrial parks in the future.
ESG principles represent a framework system (Figure 1) that includes environmental (E), social (S) and governance (G) factors [73]. ESG factors help to measure the sustainability and social impact of business activities [74]. Previous studies on ESG have focused on the issue of investment [75]. The water-related aspects of this study fall within the environmental aspects of ESG. In summary, there is a wide range of research on water resources, but little research on the efficiency of water resources application.
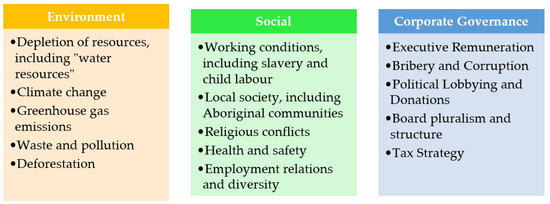
Figure 1.
Framework system for ESG principles [73].
2.4. Operating Efficiency
Many scholars have conducted studies on the planning standards of industrial parks [6,76,77,78], including local parks, logistics parks, agricultural parks, cultural and creative parks and other specialized parks. They have also examined the significance of the planning and development of the parks as well as the technical progress of the park management and service standards. The modern environment is characterized by the belief that every inch of land is precious. In China, the standardization of land planning and policy reform of industrial parks have brought development opportunities and demands for industrial parks [79].
The four key performance measures (Figure 2): park management performance, environmental performance, social performance and economic performance comprise the key framework for evaluating international eco-industrial parks [80]. The key framework of international eco-industrial parks can be used as a method to assess the performance of industrial parks and as a basis to enhance their performance [7]. Tian et al. [81] studied the performance of eco-industrial parks in China. A set of related indicators, including resource consumption, economic development and waste emissions, was applied in the performance assessment process. In their study, the indicators focused on consumption and pollutant production; absolute energy consumption, freshwater consumption, industrial wastewater production and solid waste production increased in all the industrial parks studied, while the average emission intensity (tons of pollutants per million investment) decreased for the four indicators. In sum, the study of industrial parks requires that attention be paid to both economic and non-economic factors, as well as to consumption and pollution, especially in the area of water resources.
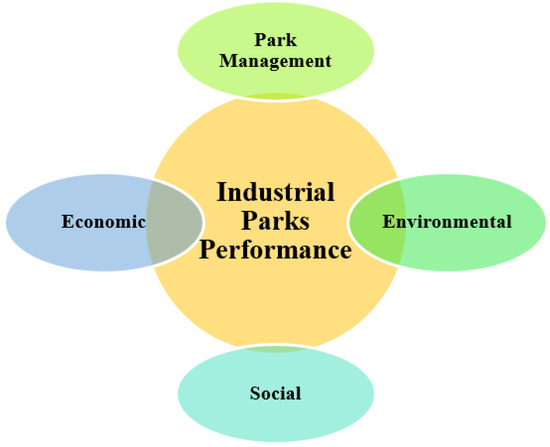
Figure 2.
The four dimensions of industrial park management performance.
The DEA method can calculate the distance from each decision-making unit (DMU) to the boundary and is used to evaluate the relative efficiency of a single DMU [82]. The DEA method can deal with single or multiple input variables and output variables at the same time, enabling an understanding of the reasons for DMU inefficiencies by analyzing the results.
The theory of DEA originates from the concept of deterministic nonparametric frontiers proposed by Farrel (1957) and uses a mathematical planning model to calculate the efficiency frontier, which forms the basis of DEA theory. Ref. [82] had three basic assumptions in his theory.
- (1)
- The Productive Frontier is made up of the most efficient DMUs, with other inefficient units located outside this frontier.
- (2)
- Production technology is Constant Return to Scale (CRTS), i.e., an increase of one unit of input gives the same rate of output.
- (3)
- The leading edge of production is convex and the slope of each point is less than or equal to zero.
Farrell based his concept on Plato’s concept of optimal fit, believing that manufacturers will produce two kinds of efficiency in production due to the influence of input allocation and cost price, namely: technical efficiency (TE) of actual input and output conversion and allocative efficiency (AE) of optimal factor allocation combination. When these two efficiencies are combined, the manufacturer’s total cost efficiency (CE) can be obtained. The relationship between the three types of efficiency is as follows:
CE = TE × AE
Farrell assumes that a production function y = f(x1, x2), as shown in Figure 3, assumes that two inputs (x1 and x2) are used to produce an output (y) at a fixed scale remuneration, and if the actual output y* of the manufacturer is equal to its potential maximum level y, then the firm is technically efficient, and vice versa. AA’ is the most efficient equivalent output curve for producing one unit of output, and point D is the actual input combination point of the manufacturer’s production of one unit of output. Point E and point D use the same scale of features, but point E uses x1 and x2 only the OE/OD of point D, representing the difference in production technology between the best possible combination and the actual input combination, therefore, Farrell defines the technical efficiency of point D into the surface as:
Technical efficiency (TE) = OE/OD.
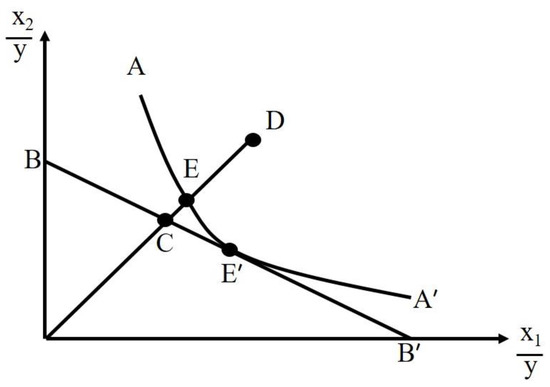
Figure 3.
Technical efficiency and configuration efficiency of Farrell model.
The technical efficiency value is between 0 and 1, and the manufacturer’s technical efficiency value of 1 indicates technical efficiency, for example: point E that falls on the equal yield curve.
Although point E is located on the equal production curve, technical efficiency is not achieved at the lowest cost. The lowest cost combination point occurs at point E’, which is tangent to the equal production curve AA’ and the equal cost line BB’. Although points E and E’ have the same technical efficiency, the production cost of point E’ is OC, which is lower than the production cost of point E OE. Therefore, the allocation efficiency of the input side of point D is defined as: allocation efficiency (AE) = OC/OE; the allocation efficiency value is also between 0 and 1.
Total cost efficiency is the product of technical efficiency and configuration efficiency, and its relationship can be expressed as follows:
As shown in Figure 2, the total cost efficiency value is 1 only at the point where the equal yield line and the equal cost line are tangent.
DEA is a good research tool for evaluating resource and environmental efficiency [83,84,85]. DEA tools have been widely used for infrastructure, regulatory and management improvements in water and wastewater systems [86]. DEA can perform correlation operations under the assumption of Constant Returns to Scale (CRS) [87] or Variable Returns to Scale (VRS) [88].
In the DEA–BCC model (Banker, Charnes and Cooper, the three scholars who proposed this model, named it after the first letter of their surnames) [89], the overall efficiency value of technical efficiency (TE) is calculated as the product of scale efficiency (SE) and pure technical efficiency (PTE) [89]. DEA has been applied in many studies to assess the efficiency of water use [83,84,85,90,91,92,93,94,95]. However, these studies are limited to the operational efficiency values, and few studies have integrated the analysis of non-operational efficiency values. To address this research gap, this research integrates the efficiency of water resources with the operational efficiency of industrial parks.
3. Research Methods
Measuring the operational efficiency of an industrial park requires a measuring model that includes the establishment of metrics and associated variables. In this section, we explain how we (1) construct the development of indicators for measuring the operational efficiency of industrial areas, (2) evaluate the efficiency of water resources management and (3) develop and apply a production function model for the operational efficiency of industrial areas. Figure 4 below shows the flow of the three main stages of the study.
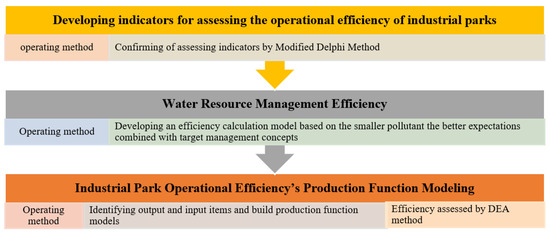
Figure 4.
Flow of the three main stages of this study.
3.1. Developing Operational Efficiency Indicators
This study used the four performance components of the industrial park performance study [81] as the key reference to examine the operational efficiency of industrial parks. Seven experts with research and practical experience were selected to fill out the questionnaire. Their academic and work experience is shown in Table 1 below.

Table 1.
List of the seven experts with research and practical experience were selected this study.
In order to increase the efficiency of communication with experts, this study used the Modified Delphi Method to identify the indicators. The four performance dimensions of Park Management, Environmental, Social and Economic were used as the theoretical basis for this study, and the six indicators listed in Table 2 below were agreed upon by the experts in the first round.
Table 2.
List of indicators corresponding to the four performance dimensions of the industrial park and this study.
3.2. Efficiency of Water Resources Management
In this study, water resource management efficiency is considered one of the indicators for measuring the operational efficiency of industrial zones. In addition, since in practice, the discharge of wastewater in each industrial park must meet the standard set by the government, the difference between the discharge of wastewater and the target value [96] in each industrial park should be taken into consideration in setting the measurement model of water resource management efficiency. The efficiency of the water resource management (EWRM) measurement model and its description are as follows:
Score EWRM = Score C + Score H + Score T
Score EWRM ≤ 1,
0 ≤ Score C ≤ 1, Score C: The score from Conductivity of water
0 ≤ Score H ≤ 1, Score H: The score from Hydrogen ion concentration of water
0 ≤ Score T ≤ 1, Score T: The score from Temperature of water
The calculation is illustrated by setting the target value as an average (average = target) and dividing the Achievement Level (AL) into nine levels, illustrating the scores corresponding to each level as follows:
1.00 = AL1: C, H or T more than 60% lower than the target
0.95 = AL2: C, H or T lower than the target 40.01–60%
0.90 = AL3: C, H or T lower than the target 20.01–40%
0.85 = AL4: C, H or T lower than the target 5.01–20%
0.80 = AL5: C, H or T equivalent to the target ±5%
0.75 = AL6: C, H or T higher than the target 5.01–20%
0.70 = AL7: C, H or T higher than the target 20.01–40%
0.65 = AL8: C, H or T higher than the target 40.01–60%
0.60 = AL9: C, H or T over 60% higher than target
An example of a water resource management efficiency value calculation is shown in Table 3.
Table 3.
Example of calculation of water resource management efficiency values.
3.3. Industrial Park Operational Efficiency Model and the Evaluation Methodology
In Section 3.1 a total of five indicators were developed, one output variable and four input variables. This section will explain the production function model consisting of these five variables and the way in which DEA is used to evaluate the operational efficiency of an industrial park.
3.3.1. Identifying Output and Input Items and Build Production Function Models
In this study, each indicator is represented by its abbreviation and set as either an output variable or an input variable. The variable descriptions are presented in Table 4 below and the production function model is given in Equation (4).
Park T = Park N + Park L + Park E + Park C
Park T ≤ 1
Table 4.
Summary table of output and input variables for the measurement model.
3.3.2. Identifying Output and Input Items and Build Production Function Models
The above section illustrates the application of DEA to measure the operational efficiency of an industrial park. This section illustrates the application of DEA to measure the efficiency of industrial area operations. After selecting the study population and setting the purpose of the analysis, the evaluation unit is selected and input and output-related variables are selected and examined. Then, correlation analysis is applied to determine whether the input- and output-related variables are homogeneous. In addition, after the initial DEA trial of inputs and outputs, sensitivity analysis is used to confirm the availability of indicators and DMUs. Finally, the results of the analysis can be used to conduct (1) aggregate analysis, (2) input-output analysis and (3) reference set analysis. The application process of the DEA method in this study is illustrated in Figure 5 below.
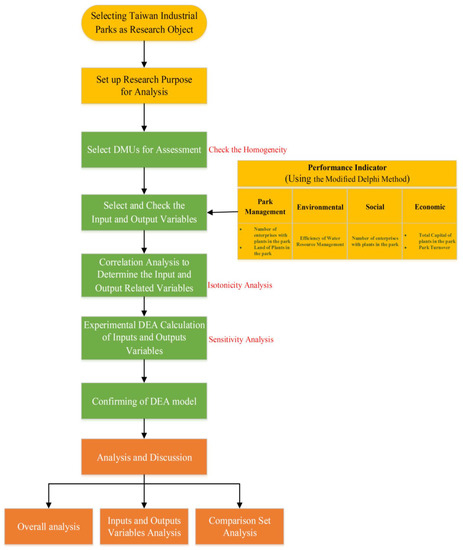
Figure 5.
The operational procedure of the DEA used in this study.
4. Case Study
4.1. Developing Operational Efficiency Indicators
Taiwan has a land area of about 36,000 square kilometres. This study divides Taiwan into four geographic regions: North, Central, South and East. Figure 6 shows the location of these regions. Table 5 gives a list of industrial zones in Taiwan that are non-technological and have independent wastewater treatment facilities. The 31 industrial zones in Table 5 are homogeneous in the following ways: (1) they are all industrial zones developed by the Industrial Development Bureau of the Ministry of Economic Affairs of Taiwan and are under the direct control of the Industrial Development Bureau; (2) they all house non-technological industries and (3) they all have independent wastewater treatment facilities.
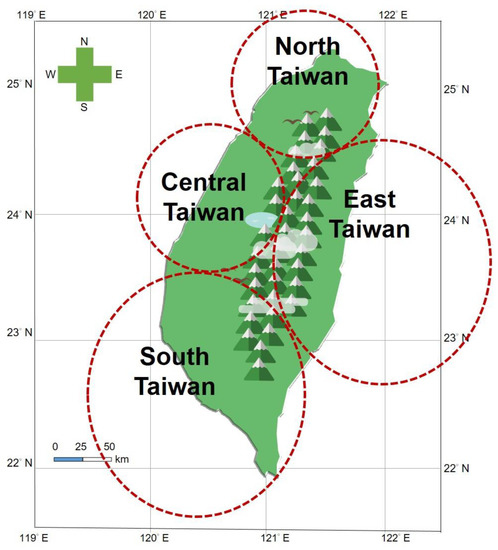
Figure 6.
Location of the Taiwan Industrial Parks.
Table 5.
List of industrial areas targeted in this study.
4.2. Overview of Study Variables and Relevance Analysis
4.2.1. Overview of the Basic Values of the Variables Related to Water Resources Management Efficiency
The data source for calculating the efficiency of water resources management in this study was the “Water Quality Information of Effluent from Industrial Areas” on the Open Platform of Taiwan Regional Government Data, which was opened on 16 April 2021. In this study, the one-year average values of the three indicators for the 31 industrial areas in Table 6 (see Equation (3)) were used to compile water quality information for each industrial area for the period from 16 April 2021 to 15 April 2022. The basic statistical values of the three indicators are shown in Table 6 below.
Table 6.
Summary of basic values of water quality indicators for the parks in this study.
4.2.2. Summary of Basic Values of Operating Efficiency-Related Variables in Industrial Areas
Referring to Equation (4), based on the data revealed in the 2022 Annual Report on Industrial Zone Development Management issued by the Industrial Zone of the Ministry of Economic Affairs of Taiwan, the basic values of the variables used in this study are summarized in Table 7 below.
Table 7.
Summary of basic values of input and output variables for the subjects of this study.
4.2.3. Correlation between Output Variables and Input Variables in Industrial Area Operating Efficiency
In order to ensure the homogeneity between output variables and input variables, it is necessary to check their correlation. This study used Pearson correlation analysis to check the correlation between one output variable and four input variables (Table 8). The correlation between the total revenue of the park and the number of factory owners, land and employees in the park were all positive, and the total revenue of the park and the total capital of the park were also correlated, which indicated that the capital of the park enterprises was correlated with the revenue of the park, but this correlation was not significant.
Table 8.
Correlation analysis of output variables with input variables.
In this study, the correlation between the water management efficiency values and the four input variables of the 31 parks was not significant, as shown in Table 9, but the correlation between the water management efficiency and the number of enterprises, land area, number of employees and corporate capital of the parks was significant. In practice, this means that there is no significant correlation between the discharge quality of the parks and the input variables at the economic level of these parks. Only the size of the industrial park shows a significant negative correlation with the efficiency of water management, which, in practice, means that the smaller the land area of the park, the higher the value of water management efficiency, which is to be expected.
Table 9.
Correlation analysis of water resources management efficiency values with input variables.
4.3. Sensitivity Analysis
In order to ensure that the DMUs and variables under study do not have particularly high variability in the analysis results due to the presence or absence of certain DMUs, a sensitivity analysis was conducted. In this study, after calculating the Technical Efficiency (TE) values of 31 DMUs and the number of references for each DMU, the TE value of DMU7 before the sensitivity test was 1, and it had the highest number of references. Thus, the analysis variables of the original DMU7 were removed. There were 30 DMUs after the sensitivity test and the TE of each DMU before and after the sensitivity analysis and the number of times it was referenced are shown in Table 10 below. For example, since DMU8 and DMU9, which both have a TE value of 1, have the highest number of references, the effect between the study subjects and the variables set in this study was determined by sensitivity analysis.
Table 10.
Pre- and post-test DMU TE values and number of times each was referenced for sensitivity analysis in this study.
4.4. Overall Analysis
The total discharge of each park is summed up by the discharge of each enterprise in the park, and this study was conducted to evaluate the operational efficiency of each park, not to evaluate the efficiency of individual enterprises.
The Deap 2.1 software calculates the TE (Technical Efficiency from CRS DEA), PTE (Pure Technical Efficiency from VRS DEA) and SE (Scale Efficiency is TE/PTE) efficiency values of 31 DMUs. Table 11 shows that three have an efficiency value of 1, namely DMU7, DMU8 and DMU9, while 27 have an efficiency value of less than 1, indicating that the efficiency of the park needs to be improved.
Table 11.
TE, PTE and SE efficiency values for the 31 DMUs.
4.5. Individual Analysis
When the non-economic efficiency of the 31 DMUs is examined from an economic perspective, only DMU7, DMU8, DMU9 and DMU27 have a relative efficiency value of 1. When the non-economic efficiency of these four DMUs is examined in conjunction with the Score EWRM of the Environmental Water Resources topic, the TE relative efficiency of DMU9 and DMU27, for example, is 1. Both DMU9 and DMU27 have a TE relative efficiency value of 1, with DMU9′s Score EWRM of 0.8333 higher than average, but DMU27′s Score EWRM of 0.6833 much lower than the average. This shows that the water management efficiency of DMU27 is lower than average, meaning that the park is facing more challenges on the ESG indicators and other issues. This also provides a more complete reference for companies who wish to invest in the park.
Among the industrial parks, nine industrial zones are decreasing in size, namely DMU3, DMU4, DMU10, DMU13, DMU17, DMU19, DMU21, DMU25 and DMU31. The management service centre should pay special attention to whether there is a continuous withdrawal of enterprises from the park, and should provide timely management of the park’s incoming enterprises, to grasp their needs and provide them with immediate assistance.
Figure 7 also shows that the 13 DMUs with water management efficiency values below the average target are: DMU3, DMU6, DMU10, DMU11, DMU16, DMU18, DMU19, DMU21, DMU22, DMU27, DMU28, DMU30 and DMU31. These 13 industrial areas all discharge wastewater in compliance with the discharge standards, but are more environmentally unfriendly than the other parks. However, the level of environmental unfriendliness is higher than that of the other industrial parks. The enterprises and the service centres of these industrial parks should understand that environmental friendliness is a matter of comparison, and that only by comparing with other industrial parks can we know our shortcomings and make continuous improvement.
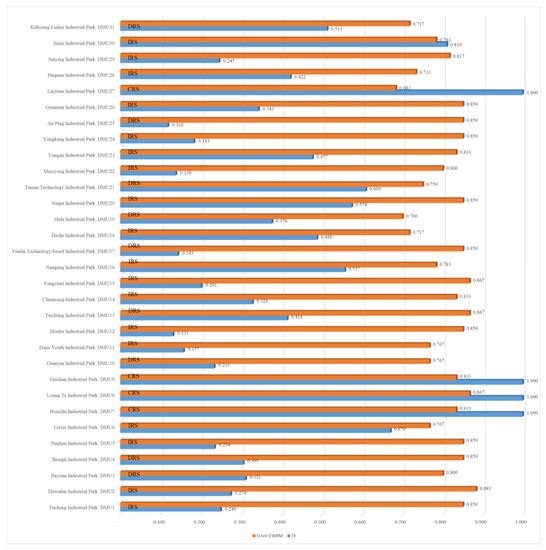
Figure 7.
Score EWRM and TE efficiency values for the 31 DMUs.
4.6. Comparative Set Analysis
Operational efficiency values can be reinforced by the concept of clustering. This study refers to Norman and Stoker [97] for the classification of DMU efficiency values, which divides the evaluation of DMU operational efficiency into four groups: Robustly Efficient Units (TE is 1 and peer reference more than 3 times), Marginally Efficient Units (TE is 1 and peer reference is or less than 3 times), Marginally Inefficient Units (TE is bigger than 0.8 or less than 1) and Distinctly Inefficient Units (TE is less than 0.8).
According to the summary table of the operating efficiency values and the number of references for each DMU in Table 10, the three DMUs with an operating efficiency of 1 and which are referenced over 3 times are: DMU7, DMU8, and DMU27. These three are classified as Robustly Efficient Units. The 31 DMUs were categorized according to the comparative set analysis, as shown in Table 12.
Table 12.
Classification of efficiency strength by DMU.
5. Conclusions
5.1. Conclusions and Suggestions
5.1.1. Conclusions
This study develops a model for measuring the efficiency of water resources management, and uses 31 industrial zones in Taiwan as its target population to measure the operational efficiency of industrial zones and their water resources management efficiency. While the traditional focus on economic efficiency is important, it is critical that business owners and investors give attention to the importance of ESG areas, such as water management. The old days of focusing only on economic efficiency are over, and it is now possible to inform the stakeholders of the park about the non-economic aspects of the park and their impact. Overall, the average relative efficiency of the DMUs must be improved.
Efficiency in water management is important, and how well a company does its job as a global citizen can be reflected in the way it manages its business on a daily basis. If more industrial estates were to set their targets to exceed the required industrial estate average, this would create a virtuous cycle of water improvement, which would have a significant impact on the efficiency of water management. It is also recommended that government authorities disclose information on the ESG of industrial parks in a timely manner, and through the sharing of comparative information between industrial parks, stakeholders in the parks can be made more aware of the economic and non-economic aspects and impacts, which will have a positive effect on the competitiveness of the industries therein.
5.1.2. Suggestions
It is suggested that future research could extend the application of this research to technology-based or eco-integrated parks and consider more indicators in the ESG field to measure the sustainable operational efficiency of the parks in a more comprehensive manner so that the issue of sustainability of enterprises and the planet will continue to be of concern to all sectors.
This study suggested that industrial park managers should collect and make public the data values of water quality monitoring programs in their parks, especially BOD, SS and COD, which are important indicators for wastewater monitoring. In addition, the water consumption, recycled percentage and effluent discharge of industrial parks are also important information for the research of water resources and ecological environments. The research suggests that industrial parks can produce more friendly environments for public evaluation and research.
5.2. Limitations of the Study
Although the study achieved its objectives, limitations due to time and resource constraints and difficulties in obtaining data remain.
- This study only focuses on 31 manufacturing industrial zones in Taiwan, not on technology parks and other ecological parks.
- In applying the knowledge of the ESG domain, only the efficiency value of water resources management in the E environment dimension is used to investigate the efficiency of non-economic aspects.
- In this study, a model for evaluating the efficiency of water resources management was successfully constructed; the input variables in the model can be flexibly extended in the evaluation model with the data collection situation. The existing model uses three input variables, which have some shortcomings, mainly due to the limited resources and the inability to collect large-scale data values of indicators for water quality monitoring projects in industrial parks. According to the Environmental Protection Administration Executive Yuan for Taiwan, there should be 12 indicators for water quality monitoring projects, namely: (1) Biochemical Oxygen Demand, BOD; (2) Suspended Solids, SS; (3) Chemical Oxygen Demand, COD; (4) Temperature; (5) Turbidity; (6) pH; (7) Dissolved Oxygen, DO; (8) Electrical Conductivity, EC; (9) Ammonia Nitrogen; (10) Total Kjeldahl Nitrogen, TKN; (11) Phosphorus; and (12) River Pollution Index, RPI.
5.3. Management Implications
For industrial parks established and managed by the government, the role of the government has been elevated from the management level in the past to the service level. In addition to adhering to the same government policies, enterprises in industrial parks also need soft services from industrial zones. The assessment of the park’s operational efficiency is an important basis for the Park Service Centre’s evaluation of the needed services, such as whether the park is in a state of increasing or decreasing returns to scale, or whether the park’s operational efficiency and its non-economic water resources management are efficient. In addition, investors who will soon move into an industrial park will be concerned with both the operational efficiency of the park’s industrial chain and the non-economic aspects of ESG, which can be of great help in reducing global warming and improving environmental protection.
Author Contributions
Conceptualization, C.-Y.C. and W.T.; methodology, W.T.; validation, C.-Y.C. and W.T.; formal analysis, W.T.; investigation, W.T.; resources, C.-Y.C.; data curation, W.T.; writing—original draft preparation, W.T.; writing—review and editing, C.-Y.C. and W.T.; visualization, W.T.; supervision, C.-Y.C.; project administration, W.T. All authors have read and agreed to the published version of the manuscript.
Funding
This research received no external funding.
Institutional Review Board Statement
Not applicable.
Informed Consent Statement
Not applicable.
Data Availability Statement
Not applicable.
Conflicts of Interest
The authors declare no conflict of interest.
Abbreviations
| WRM | Water Resource Management |
| DEA | Data Envelopment Analysis |
| ESG | Environmental, Social and Governance |
| EIPs | Eco-Industrial Parks |
| SDGs | Sustainable Development Goals |
| DMU | Decision Making Unit |
| DMUs | Decision Making Units |
| CRS | Constant Returns to Scale |
| VRS | Variable Returns to Scale |
| TE | Technical Efficiency |
| SE | Scale Efficiency |
| PTE | Pure Technical Efficiency |
| IRS | Increasing Returns to Scale |
| DRS | Decreasing Returns to Scale |
| BOD | Biochemical Oxygen Demand |
| SS | Suspended Solids |
| COD | Chemical Oxygen Demand |
| DO | Dissolved Oxygen |
| EC | Electrical Conductivity |
| TKN | Total Kjeldahl Nitrogen |
| RPI | River Pollution Index |
References
- Doeffinger, T.; Hall, J.W. Water Stress and Productivity: An Empirical Analysis of Trends and Drivers. Water Resour. Res. 2020, 56, e2019WR025925. [Google Scholar] [CrossRef]
- Wu, T.; Song, H.; Wang, J.; Friedler, E. Framework, Procedure, and Tools for Comprehensive Evaluation of Sustainable Stormwater Management: A Review. Water 2020, 12, 1231. [Google Scholar] [CrossRef]
- Intaraburt, W.; Sangsanont, J.; Limpiyakorn, T.; Ruangrassamee, P.; Suttinon, P.; Suwannasilp, B.B. Feasibility Study of Water Reclamation Projects in Industrial Parks Incorporating Environmental Benefits: A Case Study in Chonburi, Thailand. Water 2022, 14, 1172. [Google Scholar] [CrossRef]
- Yang, T.; Zhu, Y.; Li, Y.; Zhou, B. Achieving win-win policy outcomes for water resource management and economic development: The experience of Chinese cities. Sustain. Prod. Consum. 2021, 27, 873–888. [Google Scholar] [CrossRef]
- Cotterill, S.; Bracken, L.J. Assessing the Effectiveness of Sustainable Drainage Systems (SuDS): Interventions, Impacts and Challenges. Water 2020, 12, 3160. [Google Scholar] [CrossRef]
- Tumilar, A.S.; Milani, D.; Cohn, Z.; Florin, N.; Abbas, A. A Modelling Framework for the Conceptual Design of Low-Emission Eco-Industrial Parks in the Circular Economy: A Case for Algae-Centered Business Consortia. Water 2021, 13, 69. [Google Scholar] [CrossRef]
- van Beers, D.; Tyrkko, K.; Flammini, A.; Barahona, C.; Susan, C. Results and Lessons Learned from Assessing 50 Industrial Parks in Eight Countries against the International Framework for Eco-Industrial Parks. Sustainability 2020, 12, 10611. [Google Scholar] [CrossRef]
- Chen, S.C.; Huang, C.Y.; Lee, D.S. Integrating the Diamond Model and PDSA to Explore the Sustainable Competitiveness of Industrial Clusters-Mask Machine Alliance in Taiwan during COVID-19. J. JINWEN Univ. Sci. Technol. 2021, 31, 1–14. (In Chinese) [Google Scholar]
- Ng, K.M. Strategic Planning of China’s First Special Economic Zone: Shenzhen City Master Plan (2010–2020). Plan. Theory Pract. 2011, 12, 638–642. [Google Scholar] [CrossRef]
- Zhang, M.; Liu, H.; Su, Y.; Zhou, X.; Li, Z.; Chen, C. Assessment and Decomposition of Regional Land Use Efficiency of the Service Sector in China. Land 2022, 11, 1911. [Google Scholar] [CrossRef]
- Vabuolytė, V.; Burinskienė, M.; Sousa, S.; Petrakovska, O.; Trehub, M.; Tiboni, M. Increase in the Value Added of Land Due to the Establishment of Industrial Parks. Sustainability 2021, 13, 8541. [Google Scholar] [CrossRef]
- Alexakis, D.E. Meta-Evaluation of Water Quality Indices. Application into Groundwater Resources. Water 2020, 12, 1890. [Google Scholar] [CrossRef]
- Chen, S.-C.; Lee, D.-S.; Huang, C.-Y. Evaluating the Sustainable Operating Performance of Electronics Industry Groups: Taiwanese Firms in Mainland China. Sustainability 2021, 13, 12030. [Google Scholar] [CrossRef]
- Luo, L.; Zheng, Z.; Luo, J.; Jia, Y.; Zhang, Q.; Wu, C.; Zhang, Y.; Sun, J. Spatial Agglomeration of Manufacturing in the Wuhan Metropolitan Area: An Analysis of Sectoral Patterns and Determinants. Sustainability 2020, 12, 8005. [Google Scholar] [CrossRef]
- Baldwin, R.E.; Krugman, P. Agglomeration, Integration and Tax Harmonization. Eur. Econ. Rev. 2004, 48, 1–23. [Google Scholar] [CrossRef]
- Moses, L.N. Location and the Theory of Production. Q. J. Econ. 1958, 72, 259–272. [Google Scholar] [CrossRef]
- Henderson, J.V. Marshall’s scale economies. J. Urban Econ. 2003, 53, 1–28. [Google Scholar] [CrossRef]
- Mori, T.; Smith, T.E. On the spatial scale of industrial agglomerations. J. Urban Econ. 2015, 89, 1–20. [Google Scholar] [CrossRef]
- Andersson, M.; Klaesson, J.; Larsson, J.P. How local are spatial density externalities? Neighbourhood effects in agglomeration economies. Reg. Stud. 2016, 50, 1082–1095. [Google Scholar] [CrossRef]
- Hobbs, K.G.; Link, A.N.; Scott, J.T. Science and technology parks: An annotated and analytical literature review. J. Technol. Transf. 2017, 42, 957–976. [Google Scholar] [CrossRef]
- He, C.; Zhu, S. Evolutionary Economic Geography in China; Springer: Singapore, 2019. [Google Scholar]
- Gerschenkron, A. Economic Backwardness in Historical Perspective—The Political Economy Reader: Markets as Institutions; Routledge: London, UK, 1962; pp. 211–228. [Google Scholar]
- Castells, M. Technopoles of the World: The Making of 21st Century Industrial Complexes; Routledge: London, UK, 2014. [Google Scholar]
- Liu, Q.L.; Wang, Q. How China achieved its 11th Five-Year Plan emissions reduction target: A structural decomposition analysis of industrial SO2 and chemical oxygen demand. Sci. Total Environ. 2017, 574, 110–1116. [Google Scholar] [CrossRef]
- Xiao, Z.Y.; Shen, Z.C. The temporal and spatial evolution of population & industrial agglomeration and environmental pollution and the relevance analysis. J. Arid Resour. Environ. 2019, 33, e8. [Google Scholar]
- Elbers, C.; Withagen, C. Environmental policy, population dynamics and agglomeration. Contrib. Econ. Anal. Policy 2003, 3. [Google Scholar] [CrossRef]
- Hamaguchi, Y. Polluting firms’ location choices and pollution havens in an R&D-based growth model for an international emissions trading market. J. Int. Trade Econ. Dev. 2021, 30, 625–642. [Google Scholar]
- Lange, A.; Quaas, M.F. Economic geography and the effect of environmental pollution on agglomeration. BE J. Econ. Anal. Policy 2007, 7, 1724. [Google Scholar] [CrossRef]
- Chen, F.-H.; Liu, H.-R. Evaluation of Sustainable Development in Six Transformation Fields of the Central Taiwan Science Park. Sustainability 2021, 13, 4336. [Google Scholar] [CrossRef]
- Löfsten, H.; Lindelöf, P. Science Parks and the Growth of New Technology-Based Firms—Academic-Industry Links, Innova-tion and Markets. Res. Policy 2002, 31, 859–876. [Google Scholar] [CrossRef]
- Lee, W.-H.; Yang, W.-T. The cradle of Taiwan high technology industry development—Hsinchu Science Park (HSP). Technovation 2000, 20, 55–59. [Google Scholar] [CrossRef]
- Lin, S.W.; Ben, T.M. Impact of Government and Industrial Agglomeration on Industrial Land Prices: A Taiwanese Case Study. Habitat Int. 2009, 33, 412–418. [Google Scholar] [CrossRef]
- Martín Gómez, A.M.; Aguayo González, F.; Marcos Bárcena, M. Smart eco-industrial parks: A circular economy implementation based on industrial metabolism. Resour. Conserv. Recycl. 2018, 135, 58–69. [Google Scholar] [CrossRef]
- Alabaeva, N.S.; Velitskaya, S.V.; Malahova, O.S.; Koroliova, C.P. Development of eco-industrial parks in Russia and abroad. J. Econ. Bus. 2019, 6, 19–22. [Google Scholar]
- Al-Quradaghi, S.; Zheng, Q.P.; Elkamel, A. Generalized framework for the design of eco-industrial parks: Case study of end-of-life vehicles. Sustainability 2020, 12, 6612. [Google Scholar] [CrossRef]
- Mousqué, F.; Boix, M.; Négny, S.; Montastruc, L.; Genty, L.; Domenech, S. Optimal On-Grid Hybrid Power System for Eco-Industrial Parks Planning and Influence of Geographical Position. In Proceedings of the 28th European Symposium on Computer Aided Process Engineering, Graz, Austria, 10–13 June 2018; Elsevier Masson SAS: Issy-les-Moulineaux, France, 2018; Volume 43, ISBN 9780444642356. [Google Scholar]
- Zhang, L.; Nian, Y.; Pi, J.; Zhou, Y. Land policy, land supply structure and housing prices. China J. Econ. 2017, 4, 91–118. [Google Scholar]
- Flores Casamayor, H.; Morales Martínez, J.L.; Mora-Rodríguez, J.; Delgado-Galván, X. Assessing Industrial Impact on Water Sustainability in El Bajío, Guanajuato State, Mexico. Sustainability 2021, 13, 6161. [Google Scholar] [CrossRef]
- Jiang, W.; Cao, K.; Jin, L.; Cheng, Y.; Xu, Q. How Do China’s Development Zones Affect Environmental Pollution under Government Domination. Sustainability 2022, 14, 3790. [Google Scholar] [CrossRef]
- Mendoza Gómez, M.; Tagle-Zamora, D.; Morales Martínez, J.L.; Caldera Ortega, A.R.; Mora Rodríguez, J.d.J.; Delgado-Galván, X. Water Supply Management Index: Leon, Guanajuato, Mexico. Water 2022, 14, 919. [Google Scholar] [CrossRef]
- Zhu, H.; Zhu, J.; Zou, Q. Comprehensive Analysis of Coordination Relationship between Water Resources Environment and High-Quality Economic Development in Urban Agglomeration in the Middle Reaches of Yangtze River. Water 2020, 12, 1301. [Google Scholar] [CrossRef]
- Li, W.; Xi, Y.; Wu, F.; Masoud, M.; Liu, S. Green development performance of water resources and its economic-related determinants. J. Clean. Prod. 2019, 239, 118048. [Google Scholar] [CrossRef]
- Gassert, F.; Luck, M.; Landis, M.; Reig, P.; Shiao, T. Aqueduct Global Maps 2.1: Constructing Decision-Relevant Global Water Risk Indicators; World Resources Institute: Washington, DC, USA, 2014. [Google Scholar]
- Service, R.F. Desalination freshens up. Science 2006, 313, 1088–1090. [Google Scholar] [CrossRef]
- United Nations Department of Economic and Social Affairs. Sustainable Development. Available online: https://sdgs.un.org/goals (accessed on 22 July 2022).
- Liu, J.; Mooney, H.; Hull, V.; Davis, S.J.; Gaskell, J.; Hertel, T.; Lubchenco, J.; Seto, K.C.; Gleick, P.; Kremen, C.; et al. Systems integration for global sustainability. Science 2015, 347, 1258832. [Google Scholar] [CrossRef]
- Zand, M.; Nasab, M.A.; Hatami, A.; Kargar, M.; Chamorro, H.R. Using adaptive fuzzy logic for intelligent energy management in hybrid vehicles. In Proceedings of the 2020 28th Iranian Conference on Electrical Engineering (ICEE), Tabriz, Iran, 4–6 August 2020; IEEE: Piscataway, NJ, USA, 2020; pp. 1–7. [Google Scholar]
- Zand, M.; Nasab, M.A.; Sanjeevikumar, P.; Maroti, P.K.; Holm-Nielsen, J.B. Energy management strategy for solid-state transformer-based solar charging station for electric vehicles in smart grids. IET Renew. Power Gener. 2020, 14, 3843–3852. [Google Scholar] [CrossRef]
- Masuda, S.; Sano, I.; Hojo, T.; Li, Y.Y.; Nishimura, O. The comparison of greenhouse gas emissions in sewage treatment plants with different treatment processes. Chemosphere 2018, 193, 581–590. [Google Scholar] [CrossRef] [PubMed]
- Rehana, S.; Rajulapati, C.R.; Ghosh, S.; Karmakar, S.; Mujumdar, P. Uncertainty Quantification in Water Resource Systems Modeling: Case Studies from India. Water 2020, 12, 1793. [Google Scholar] [CrossRef]
- Hoekstra, A.; Chapagain, A.; Van Oel, P. Advancing Water Footprint Assessment Research: Challenges in Monitoring Progress towards Sustainable Development Goal 6. Water 2017, 9, 438. [Google Scholar] [CrossRef]
- Song, J.; Yin, Y.; Xu, H.; Wang, Y.; Wu, P.; Sun, S. Drivers of domestic grain virtual water flow: A study for China. Agric. Water Manag. 2020, 239, 106175. [Google Scholar] [CrossRef]
- Du, Y.; Lv, X.-T.; Wu, Q.-Y.; Zhang, D.-Y.; Zhou, Y.-T.; Peng, L.; Hu, H.-Y. Formation and control of disinfection byproducts and toxicity during reclaimed water chlorination: A review. J. Environ. Sci. 2017, 58, 51–63. [Google Scholar] [CrossRef]
- Salgot, M.; Folch, M. Wastewater treatment and water reuse. Curr. Opin. Environ. Sci. Health 2018, 2, 64–74. [Google Scholar] [CrossRef]
- Racar, M.; Dolar, D.; Farkas, M.; Milcic, N.; Spehar, A.; Kosutic, K. Rendering plant wastewater reclamation by coagulation, sand filtration, and ultrafiltration. Chemosphere 2019, 227, 207–215. [Google Scholar] [CrossRef]
- Li, Q.; Wang, W.; Jiang, X.; Lu, D.; Zhang, Y.; Li, J. Analysis of the potential of reclaimed water utilization in typical inland cities in northwest China via system dynamics. J. Environ. Manag. 2020, 270, 110878. [Google Scholar] [CrossRef]
- Cherchi, C.; Kesaano, M.; Badruzzaman, M.; Schwab, K.; Jacangelo, J.G. Municipal reclaimed water for multi-purpose applications in the power sector: A review. J. Environ. Manag. 2019, 236, 561–570. [Google Scholar] [CrossRef]
- Revollar, S.; Meneses, M.; Vilanova, R.; Vega, P.; Francisco, M. Eco-Efficiency Assessment of Control Actions in Wastewater Treatment Plants. Water 2021, 13, 612. [Google Scholar] [CrossRef]
- Jorge, C.; Almeida, M.d.C.; Covas, D. Performance Assessment System for Energy Efficiency in Wastewater Systems. Water 2021, 13, 1807. [Google Scholar] [CrossRef]
- Seidl, C.; Wheeler, S.A.; Zuo, A. High turbidity: Water valuation and accounting in the Murray-Darling Basin. Agric. Water Manag. 2020, 230, 105929. [Google Scholar] [CrossRef]
- Nasab, M.A.; Zand, M.; Padmanaban, S.; Bhaskar, M.S.; Guerrero, J.M. An efficient, robust optimization model for the unit commitment considering renewable uncertainty and pumped-storage hydropower. Comput. Electr. Eng. 2022, 100, 107846. [Google Scholar] [CrossRef]
- Zhang, B.; Meng, Z.; Zhang, L.; Sun, X.; Hayat, T.; Alsaedi, A.; Ahmad, B. Exergy-based systems account of national resource utilization: China 2012. Resour. Conserv. Recycl. 2018, 132, 324–338. [Google Scholar] [CrossRef]
- Huang, X.; Hua, W.; Dai, X. Performance Evaluation of Watershed Environment Governance—A Case Study of Taihu Basin. Water 2022, 14, 158. [Google Scholar] [CrossRef]
- Lee, M.; Kim, H.; Lee, J.Y.; Yang, J.E.; Lim, C. A Shift Towards Integrated and Adaptive Water Management in South Korea: Building Resilience Against Climate Change. Water Resour. Manag. 2022, 36, 1611–1625. [Google Scholar] [CrossRef]
- Hu, J.; Wang, S.; Yeh, F.Y. Total-factor water efficiency of regions in China. Resour. Policy 2006, 31, 217–230. [Google Scholar] [CrossRef]
- Li, M.; Long, K. Direct or Spillover Effect: The Impact of Pure Technical and Scale Efficiencies of Water Use on Water Scarcity in China. Int. J. Environ. Res. Public Health 2019, 16, 3401. [Google Scholar] [CrossRef]
- Geng, Q.; Ren, Q.; Nolan, R.H.; Wu, P.; Yu, Q. Assessing China’s agricultural water use efficiency in a green-blue water perspective: A study based on data envelopment analysis. Ecol. Indic. 2019, 96, 329–335. [Google Scholar] [CrossRef]
- Deng, G.; Li, L.; Song, Y. Provincial water use efficiency measurement and factor analysis in China: Based on SBM-DEA model. Ecol. Indic. 2016, 69, 12–18. [Google Scholar] [CrossRef]
- Zhang, L.; Luan, X.; Chen, X.; Zhang, S.; Liang, Y.; Cui, Z. Water Footprint Inventory Construction of Cathode Copper Products in a Chinese Eco-Industry. Sustainability 2022, 14, 5962. [Google Scholar] [CrossRef]
- Muratoglu, A. Applications and Response Formulations of Water Footprint Methodology for Conservation of Water Resources. Imp. Encycl. Conserv. 2021, 360–370. [Google Scholar] [CrossRef]
- Muratoglu, A. Water Footprint: Concept and Methodology. Imp. Encycl. Conserv. 2021, 351–359. [Google Scholar] [CrossRef]
- She, Y.; Liu, Y.; Deng, Y.; Jiang, L. Can China’s Government-Oriented Environmental Regulation Reduce Water Pollution? Evidence from Water Pollution Intensive Firms. Sustainability 2020, 12, 7841. [Google Scholar]
- EBA. EBA Report on Management and Supervision of ESG Risks for Credit Institutions and Investment Firms. Available online: https://www.eba.europa.eu/sites/default/documents/fifiles/document_library/Publications/Reports/2021/1015656/EBA%20Report%20on%20ESG%20risks%20management%20and%20supervision.pdf (accessed on 22 July 2022).
- EBA. Environmental Social and Governance Disclosures. Available online: https://www.eba.europa.eu/sites/default/documents/files/document_library/Publications/Consultations/2021/Consultation%20on%20draft%20ITS%20on%20Pillar%20disclosures%20on%20ESG%20risk/963626/Factsheet%20-%20ESG%20disclosures.pdf (accessed on 22 July 2022).
- Daugaard, D. Emerging new themes in environmental, social and governance investing: A systematic literature review. Account. Financ. 2020, 60, 1501–1530. [Google Scholar] [CrossRef]
- Yan, S. Basic Functions and Normative Development of Logistics Park. Qual. Stand. 2006, 8, 17–21. [Google Scholar]
- Zhang, S.; Hou, Y.; Gu, C. Research on the Development and Countermeasures of Jiangsu Cultural and Creative Industry Park. China Stand. 2013, 12, 105–108. [Google Scholar]
- An, J.; Liang, Y.; Yang, R.; Zhai, H. Research on Standardized Construction and Evaluation Path of Modern Ecological Circular Agriculture Park. China Stand. 2018, 1, 64–68. [Google Scholar]
- Duan, J.; Lu, Q. New Process of Group Standards. Urban Plan. 2019, 43, 33–39. [Google Scholar]
- United Nations Industrial Development Organization; World Bank Group; Deutsche Gesellschaft für Internationale Zusammenarbeit. An International Framework for Eco-Industrial Parks; World Bank: Washington, DC, USA, 2017. [Google Scholar]
- Tian, J.; Liu, W.; Lai, B.; Li, X.; Chen, L. Study of the performance of eco-industrial park development in China. J. Clean. Prod. 2014, 64, 486–494. [Google Scholar] [CrossRef]
- Farrell, M.J. The measurement of productive efficiency. J. R. Stat. Soc. 1957, 120, 253–281. [Google Scholar] [CrossRef]
- Hsieh, J.-C.; Ma, L.-H.; Chiu, Y.-H. Assessing China’s Use Efficiency of Water Resources from the Resampling Super Data Envelopment Analysis Approach. Water 2019, 11, 1069. [Google Scholar] [CrossRef]
- Mardani, A.; Edmundas, K.Z.; Dalia, S.; Ahmad, J.; Masoumeh, K. A comprehensive review of data envelopment analysis (DEA) approach in energy efficiency. Renew. Sustain. Energy Rev. 2017, 70, 1298–1322. [Google Scholar] [CrossRef]
- Mardani, A.; Streimikiene, D.; Balezentis, T.; Saman, M.Z.M.; Nor, K.M.; Khoshnava, S.M. Data envelopment analysis in energy and environmental economics: An overview of the state-of-the-art and recent development trends. Energies 2018, 11, 2002. [Google Scholar] [CrossRef]
- Ablanedo-Rosas, J.H.; Guerrero Campanur, A.; Olivares-Benitez, E.; Sánchez-García, J.Y.; Nuñez-Ríos, J.E. Operational Efficiency of Mexican Water Utilities: Results of a Double-Bootstrap Data Envelopment Analysis. Water 2020, 12, 553. [Google Scholar] [CrossRef]
- Charnes, A.; Cooper, W.W.; Rhodes, E. Measuring the efficiency of decision making units. Eur. J. Oper. Res. 1978, 2, 429–444. [Google Scholar] [CrossRef]
- Banker, R.D.; Charnes, A.; Cooper, W.W. Some Models for Estimating Technical and Scale Inefficiencies in Data Envelopment Analysis. Manag. Sci. 1984, 30, 1078–1092. [Google Scholar] [CrossRef]
- Yang, H.; Pollitt, M. Incorporating both undesirable outputs and uncontrollable variables into DEA: The performance of Chinese coal-fired power plants. Eur. J. Oper. Res. 2009, 197, 1095–1105. [Google Scholar] [CrossRef]
- Cao, Y.; Zhang, W.; Ren, J. Efficiency Analysis of the Input for Water-Saving Agriculture in China. Water 2020, 12, 207. [Google Scholar] [CrossRef]
- Ali, M.K.; Klein, K.K. Water use efficiency and productivity of the irrigation districts in Southern Alberta. Water Resour. Manag. 2014, 28, 2751–2766. [Google Scholar] [CrossRef]
- Azad, M.A.S.; Ancev, T.; Hernández-Sancho, F. Efficient water use for sustainable irrigation industry. Water Resour. Manag. 2015, 29, 1683–1696. [Google Scholar] [CrossRef]
- Li, W.; Zuo, Q.; Jiang, L.; Zhang, Z.; Ma, J.; Wang, J. Evaluation of Regional Water Resources Management Performance and Analysis of the Influencing Factors: A Case Study in China. Water 2022, 14, 574. [Google Scholar] [CrossRef]
- Gungor-Demirci, G.; Lee, J.; Keck, J. Assessing the performance of a California water utility using two-stage data envelopment analysis. J. Water Res. Plan. Manag. 2018, 144, 1943–5452. [Google Scholar] [CrossRef]
- Kamarudin, N.; Ismail, W.R. Establishment of performance indicators for Malaysian water utilities with the presence of undesirable output. J. Teknol. 2016, 78, 99–105. [Google Scholar] [CrossRef]
- Chen, C.-G.; Cheng, W.-Y.; Chen, S.-C. The establishment of cost-effectiveness, objective oriented LSP performance measurement. In Proceedings of the IIE Annual Conference and Expo 2007—Industrial Engineering’s Critical Role in a Flat World—Conference Proceedings, Nashville, TN, USA, 19–23 May 2007. [Google Scholar]
- Norman, M.; Stoker, B. Data Envelopment Analysis: The Assessment of Performance; John Wiley & Sons: New York, NY, USA, 1991. [Google Scholar]


Publisher’s Note: MDPI stays neutral with regard to jurisdictional claims in published maps and institutional affiliations. |
© 2022 by the authors. Licensee MDPI, Basel, Switzerland. This article is an open access article distributed under the terms and conditions of the Creative Commons Attribution (CC BY) license (https://creativecommons.org/licenses/by/4.0/).