Exploring the Individual Travel Patterns Utilizing Large-Scale Highway Transaction Dataset
Abstract
1. Introduction
2. Literature Review
3. Data Source
4. Methodology
4.1. K-Means Model
- Randomly select K points as the initial cluster centroids from the whole sample. K was determined in advance.
- Calculate the Euclidean distance between cluster centroids and other sample, then assign the sample to the cluster with the closest centroids. The Euclidean distance can be expressed as Equation (2).
- 3.
- Recalculate the positions of K cluster centroids when the new clusters are generated.
- 4.
- Repeat Steps 2 and 3 until the cluster centroids no longer change. The objective function of K-means algorithm is expressed as Equation (3).
4.2. Fuzzy C-Means Model
- Randomly select K points as the initial cluster centroids from the whole sample.
- Calculate the cluster centroid using Equation (6).
- 3.
- Update the membership as Equation (7).
- 4.
- Repeat the steps 2 and 3 until the value no longer decrease.
4.3. Self-Organizing Map (SOM) Model
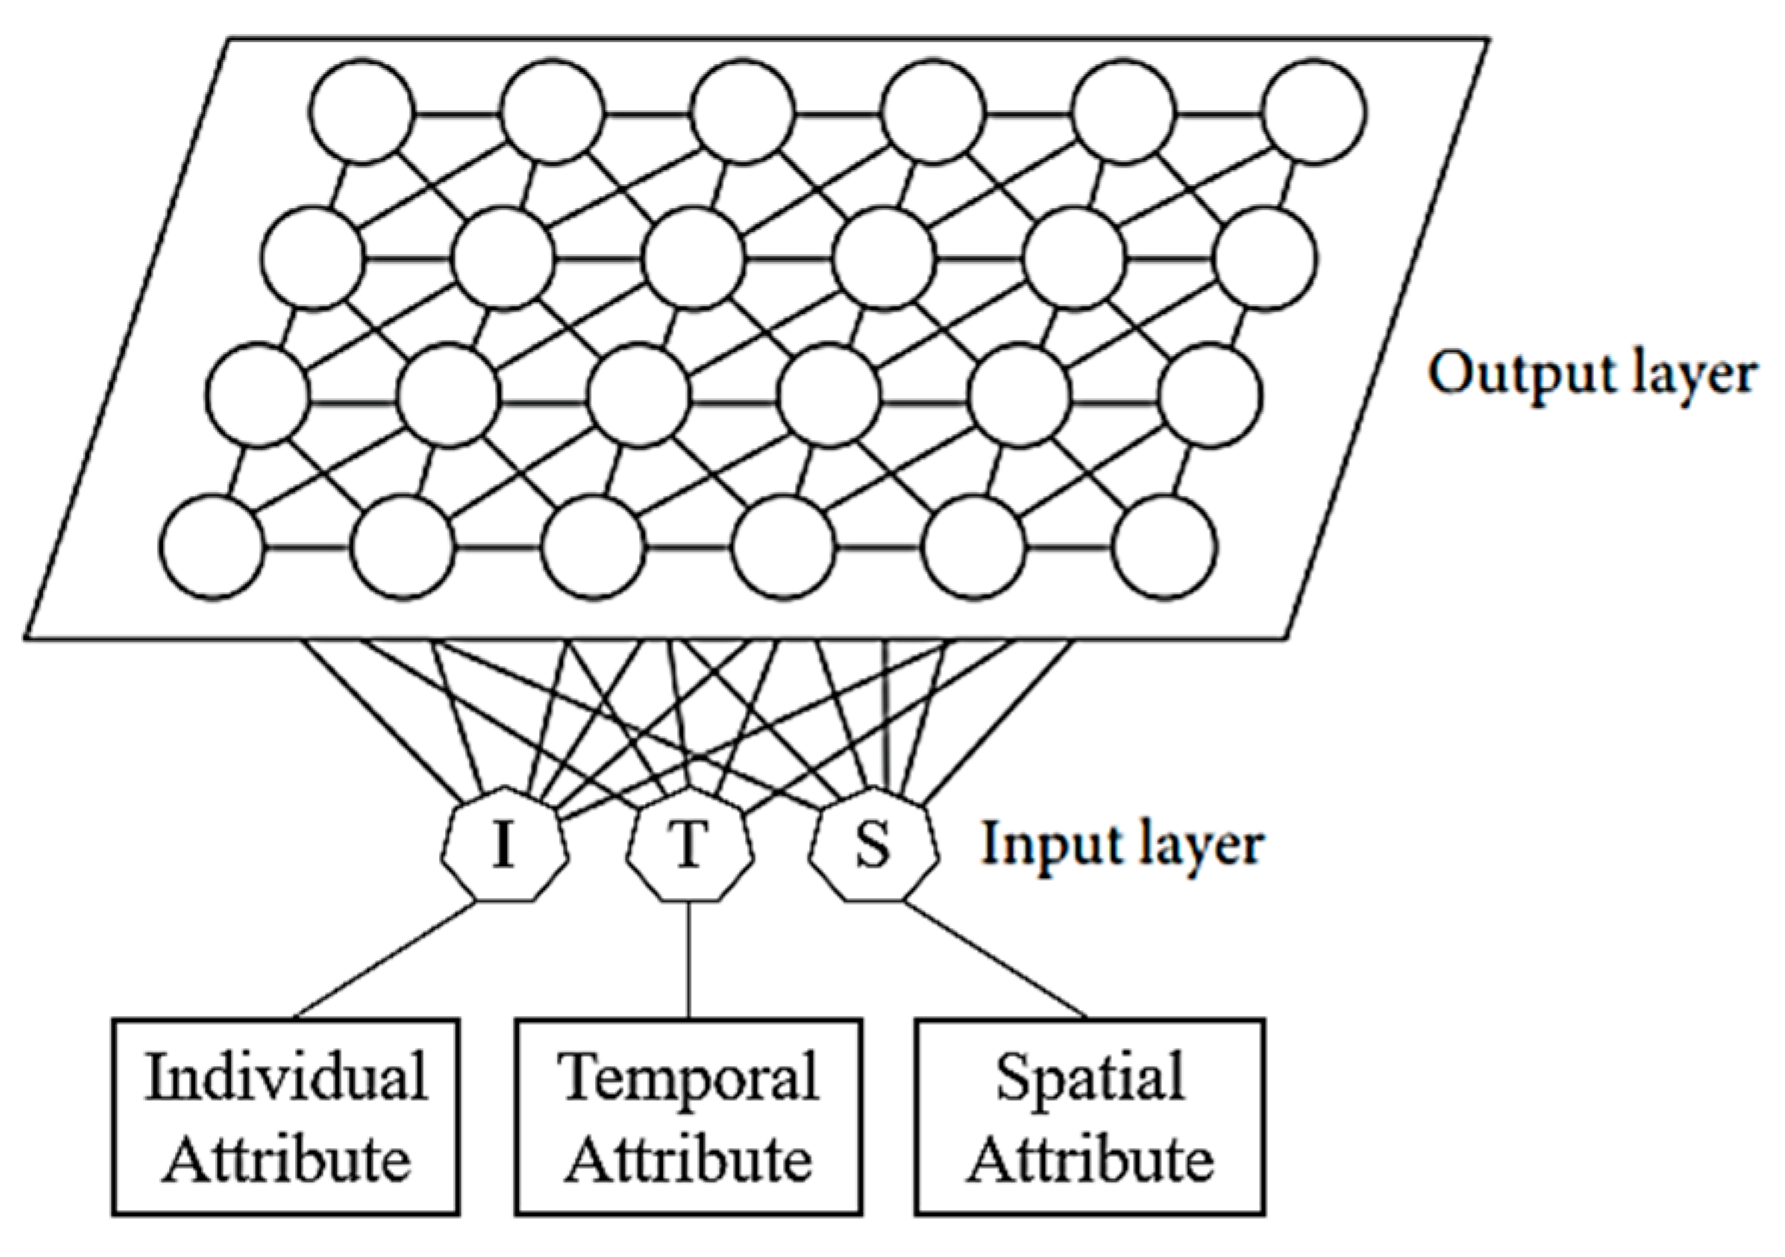
- The individual, temporal, and spatial attributes were extracted as the input layer. Each node is initialized randomly with the parameters and weights.
- Randomly select the sample and compute the distance to each output node, while the node with shortest distance is defined as the winning node. The distance is expressed as,
- 3.
- The node adjacent to node was updated and activated. Recalculate the weight between and adjacent nodes, in terms of the Equation (9).
- 4.
- The parameters for each node are updated by the gradient descent, as Equation (11) shows.
- 5.
- Repeat step 2 until the iteration reach the final convergence.
4.4. Model Performance Evaluation
5. Results and Discussion
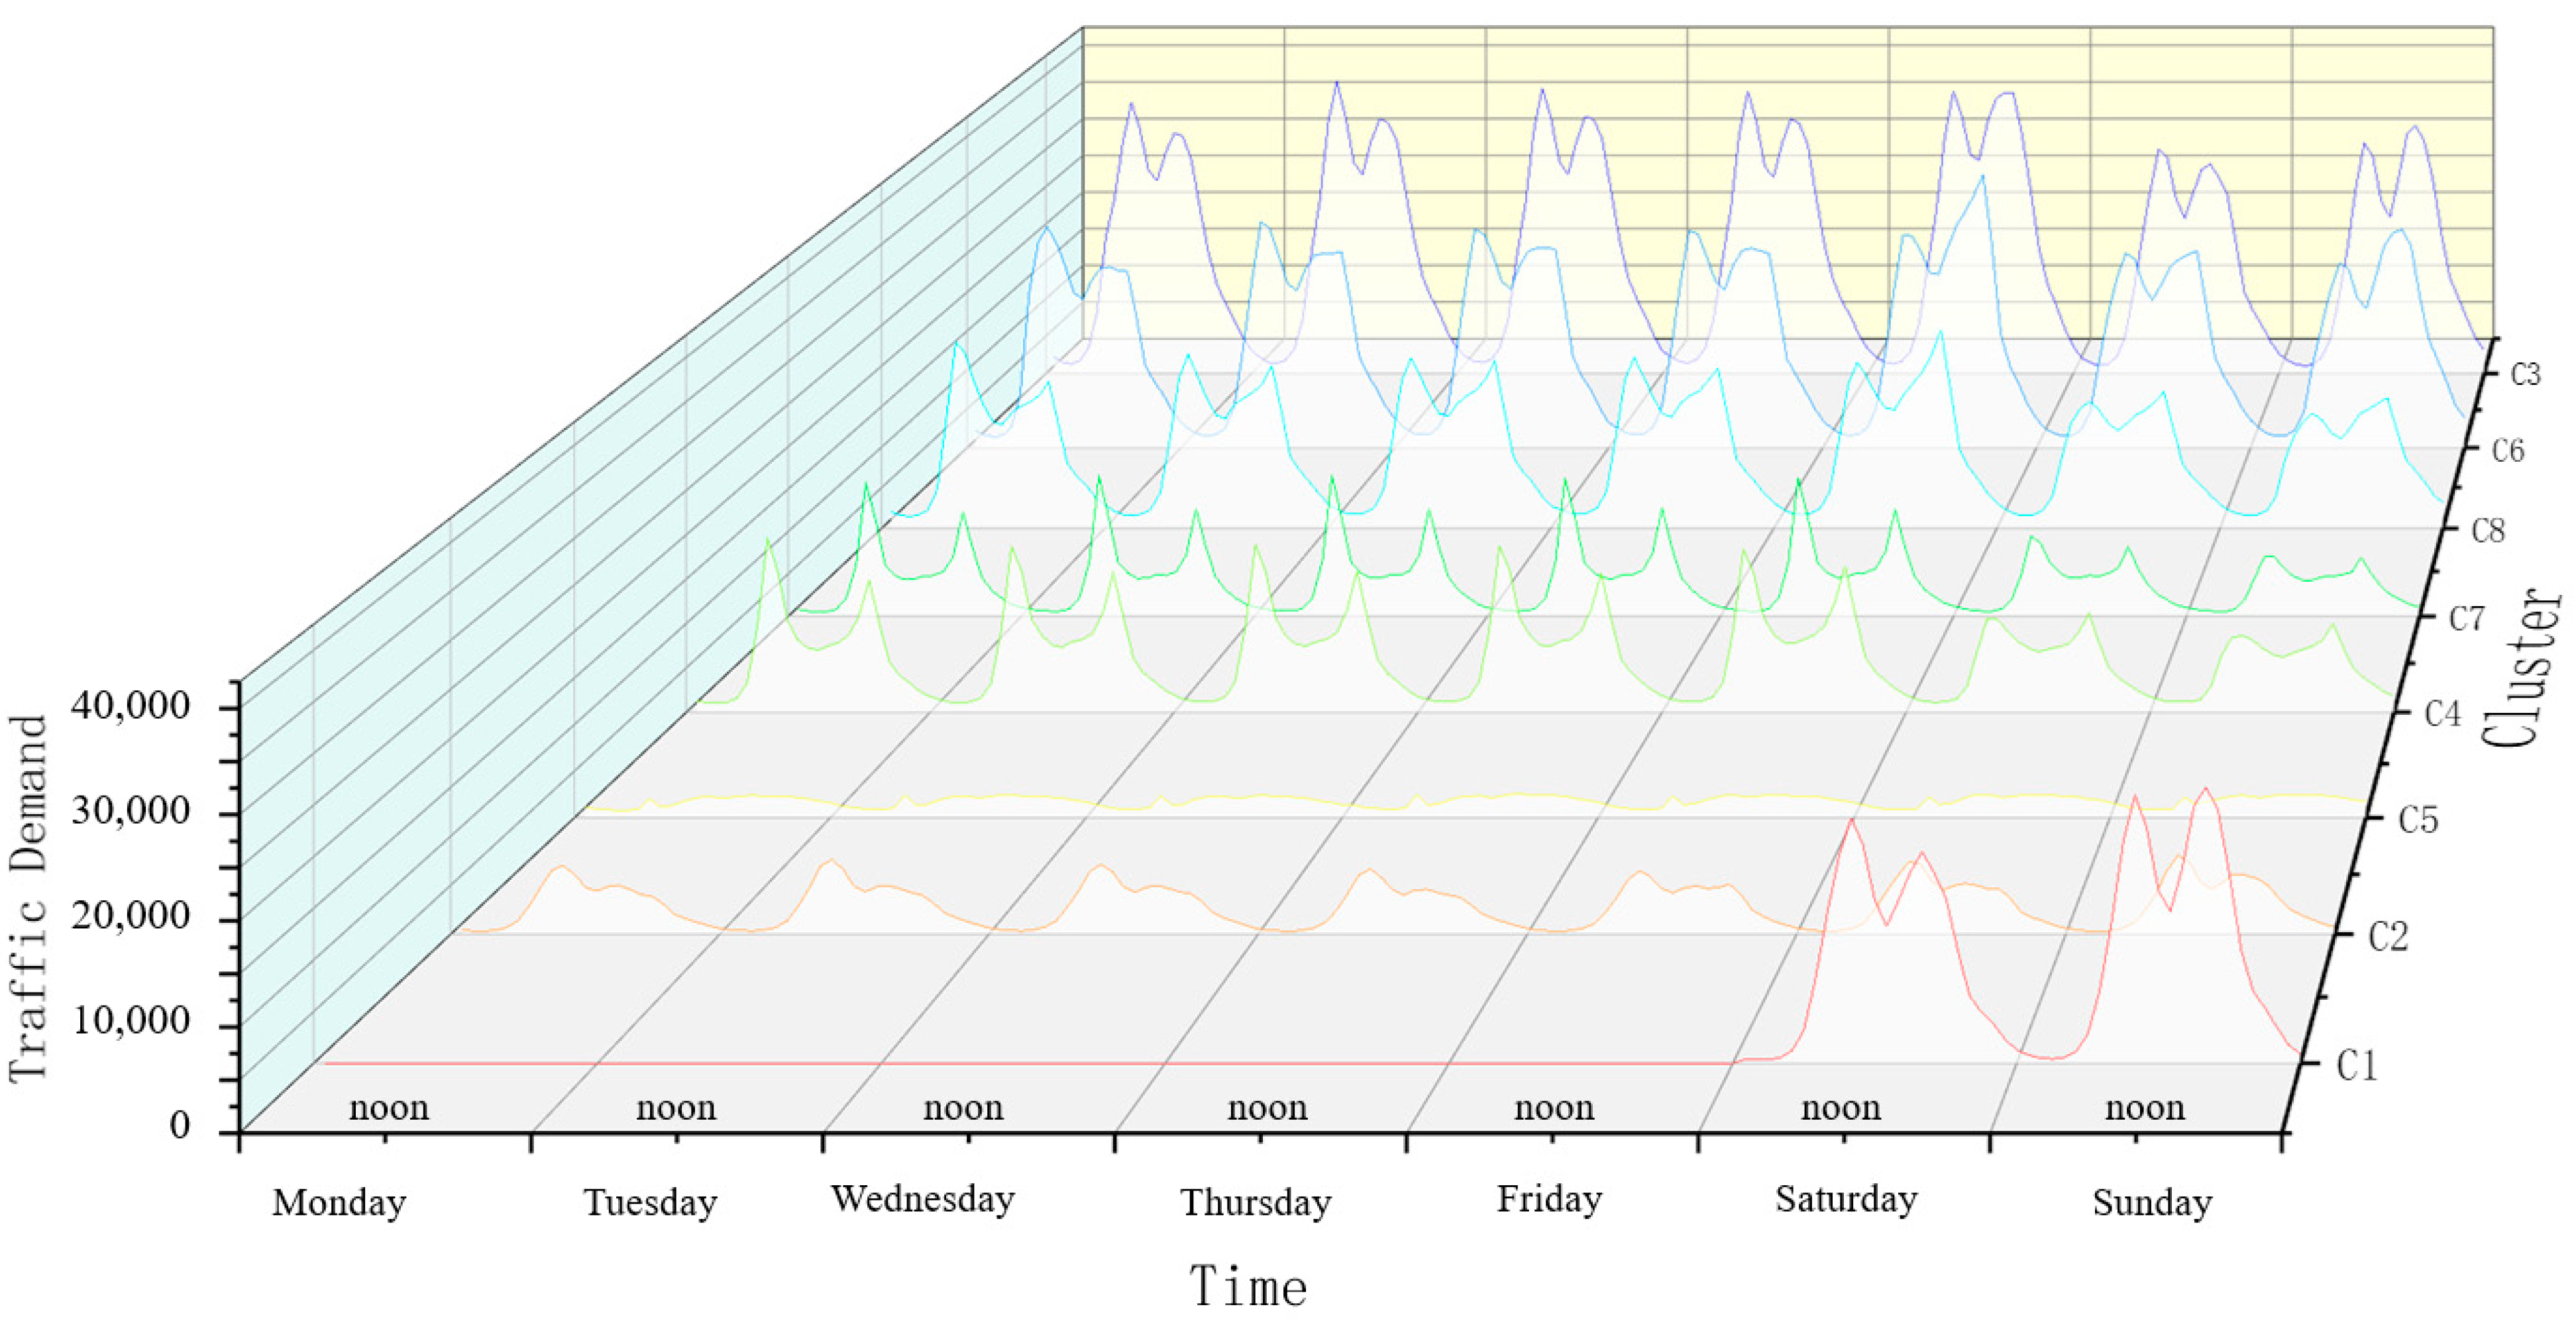
- Cluster 1: Travelers enter the highway only once.
- Cluster 2: Travelers enter the highway only on weekends.
6. Conclusions
Author Contributions
Funding
Institutional Review Board Statement
Informed Consent Statement
Data Availability Statement
Acknowledgments
Conflicts of Interest
References
- China Business Intelligence. The market analysis of ETC in China 2021. 2021. Available online: https://www.163.com/dy/article/GAP7JV57051481OF.html (accessed on 4 September 2022).
- EastMoney. The Spread of ETC in China. 2021. Available online: http://finance.eastmoney.com/a/202103281861734043.html (accessed on 4 September 2022).
- Richards, K.A.; Jones, E. Customer relationship management: Finding value drivers. Ind. Mark. Manag. 2008, 37, 120–130. [Google Scholar] [CrossRef]
- Soltani, Z.; Navimipour, N.J. Customer relationship management mechanisms: A systematic review of the state of the art literature and recommendations for future research. Comput. Hum. Behav. 2016, 61, 667–688. [Google Scholar] [CrossRef]
- Tsai, C.F.; Hu, Y.H.; Lu, Y.H. Customer segmentation issues and strategies for an automobile dealership with two clustering techniques. Expert Syst. 2015, 32, 65–76. [Google Scholar] [CrossRef]
- Cheng, Y.H.; Huang, T.Y. High speed rail passenger segmentation and ticketing channel preference. Transp. Res. Part A Policy Pract. 2014, 66, 127–143. [Google Scholar] [CrossRef]
- Akhtar, M.; Moridpour, S. A review of traffic congestion prediction using artificial intelligence. J. Adv. Transp. 2021, 2021, 8878011. [Google Scholar] [CrossRef]
- Cao, W.; Wang, J. Research on traffic flow congestion based on Mamdani fuzzy system. AIP Conf. Proc. 2019, 2073, 020101. [Google Scholar]
- Wen, F.; Zhang, G.; Sun, L.; Wang, X.; Xu, X. A hybrid temporal association rules mining method for traffic congestion prediction. Comput. Eng. 2019, 130, 779–787. [Google Scholar] [CrossRef]
- Adetiloye, T.; Awasthi, A. Multimodal big data fusion for traffic congestion prediction. In Multimodal Analytics for Next-Generation Big Data Technologies and Applications; Seng, K.P., Ang, L., Liew, A.W.-C., Gao, J., Eds.; Springer: Berlin, Germany, 2019; Volume 2022, pp. 319–335. [Google Scholar]
- Kong, X.; Xu, Z.; Shen, G.; Wang, J.; Yang, Q.; Zhang, B. Urban traffic congestion estimation and prediction based on floating car trajectory data. Future Gener. Comput. Syst. 2016, 61, 97–107. [Google Scholar] [CrossRef]
- Yang, Q.; Wang, J.; Song, X.; Kong, X.; Xu, Z.; Zhang, B. Urban traffic congestion prediction using floating car trajectory data. In Proceedings of the International Conference on Algorithms and Architectures for Parallel Processing, Zhangjiajie, China, 18–20 November 2015; pp. 18–30. [Google Scholar]
- Fu, X.; Xu, C.; Liu, Y.; Chen, C.H.; Hwang, F.J.; Wang, J. Spatial heterogeneity and migration characteristics of traffic congestion—A quantitative identification method based on taxi trajectory data. Phys. A Stat. Mech. Its Appl. 2022, 588, 126482. [Google Scholar] [CrossRef]
- Nadeem, K.M.; Fowdur, T.P. Performance analysis of a real-time adaptive prediction algorithm for traffic congestion. J. Inf. Commun. Technol. 2018, 17, 493–511. [Google Scholar] [CrossRef]
- Huang, Z.; Xia, J.; Li, F.; Li, Z.; Li, Q. A peak traffic congestion prediction method based on bus driving time. Entropy 2019, 21, 709. [Google Scholar] [CrossRef]
- Li, S.; Zhang, J.; Zhong, G.; Ran, B. A Simulation Approach to Detect Arterial Traffic Congestion Using Cellular Data. J. Adv. Transp. 2022, 2022, 8811139. [Google Scholar] [CrossRef]
- Yan, X.; Song, C.; Pei, T.; Wang, X.; Wu, M.; Liu, T.; Shu, H.; Chen, J. Revealing spatiotemporal matching patterns between traffic flux and road resources using big geodata-A case study of Beijing. Cities 2022, 2022, 103754. [Google Scholar] [CrossRef]
- Han, S.H.; Lu, S.X.; Leung, S.C.H. Segmentation of telecom customers based on customer value by decision tree model. Expert Syst. Appl. 2012, 39, 3964–3973. [Google Scholar] [CrossRef]
- Kim, S.-Y.; Jung, T.-S.; Suh, E.-H.; Hwang, H.-S. Customer segmentation and strategy development based on customer lifetime value: A case study. Expert Syst. Appl. 2006, 31, 101–107. [Google Scholar] [CrossRef]
- Benitez, I.; Quijano, A.; Diez, J.L.; Delgado, I. Dynamic clustering segmentation applied to load profiles of energy consumption from Spanish customers. Int. J. Electr. Power Energy Syst. 2014, 55, 437–448. [Google Scholar] [CrossRef]
- Wu, R.-S.; Chou, P.-H. Customer segmentation of multiple category data in e-commerce using a soft-clustering approach. Electron. Commer. Res. Appl. 2011, 10, 331–341. [Google Scholar] [CrossRef]
- Ernawati, E.; Baharin, S.S.K.; Kasmin, F. A review of data mining methods in RFM-based customer segmentation. J. Phys. Conf. Ser. 2021, 1869, 012085. [Google Scholar] [CrossRef]
- Lajimi, H.F.; Majidi, S. Supplier segmentation: A systematic literature review. J. Supply Chain. Manag. Sci. 2021, 2, 138–158. [Google Scholar]
- Smith, W.R. Product differentiation and market segmentation as alternative marketing strategies. Mark. Manag. 1995, 4, 63. [Google Scholar] [CrossRef]
- Chiang, W.-Y. Discovering customer value for marketing systems: An empirical case study. Int. J. Prod. Res. 2017, 55, 5157–5167. [Google Scholar] [CrossRef]
- Ngai, E.W.; Xiu, L.; Chau, D.C. Application of data mining techniques in customer relationship management: A literature review and classification. Expert Syst. Appl. 2009, 36, 2592–2602. [Google Scholar] [CrossRef]
- Qian, C.; Yang, M.; Li, P.; Li, S. Application of customer segmentation for electronic toll collection: A case study. J. Adv. Transp. 2018, 2018, 3635107. [Google Scholar] [CrossRef]
- Tabianan, K.; Velu, S.; Ravi, V. K-Means Clustering Approach for Intelligent Customer Segmentation Using Customer Purchase Behavior Data. Sustainability 2022, 14, 7243. [Google Scholar] [CrossRef]
- Christy, A.J.; Umamakeswari, A.; Priyatharsini, L.; Neyaa, A. RFM ranking—An effective approach to customer segmentation. J. King Saud Univ.-Comput. Inf. Sci. 2021, 33, 1251–1257. [Google Scholar] [CrossRef]
- Zong, Y.; Pan, E. A SOM-Based Customer Stratification Model. Wirel. Commun. Mob. Comput. 2022, 2022, 7479110. [Google Scholar] [CrossRef]
- Alkhayrat, M.; Aljnidi, M.; Aljoumaa, K. A comparative dimensionality reduction study in telecom customer segmentation using deep learning and PCA. J. Big Data 2020, 7, 1–23. [Google Scholar] [CrossRef]
- Kodinariya, T.M.; Makwana, P.R. Review on determining number of Cluster in K-Means Clustering. Int. J. 2013, 1, 995. [Google Scholar]


| Field | Data type | Description |
|---|---|---|
| Transaction ID | Int | The Transaction ID of records |
| Vehicle plate | Var | Vehicle plate number, unique |
| Entry Station ID | Var | The station ID when vehicle enter highway |
| Entry Time | Date | The datetime when vehicle enter highway |
| Exit Station ID | Var | The station ID when vehicle enter highway |
| Exit Time | Date | The datetime when vehicle enter highway |
| Transaction Fee | Float | Fee for highway toll |
| Other fields | … | … |
| Attribute | Mean | St. Dev. | Min | Max |
|---|---|---|---|---|
| Trip Frequency | 5.15 | 8.32 | 1 | 678 |
| Total Fee (CNY) | 431.6 | 1471.87 | 0 | 33,554.4 |
| Travel Day | 3.35 | 4.17 | 1 | 31 |
| Weekday Trip | 3.78 | 6.57 | 0 | 50.5 |
| Peak-hour Trip | 1.47 | 3.24 | 0 | 26.7 |
| Repeated Rate | 0.55 | 0.30 | 0.05 | 1 |
| Sample number | 8,904,690 |
| Evaluation Metric | K-Means | Fuzzy C-Means | SOM |
|---|---|---|---|
| SSE | 5493.71 | 6336.51 | 4990.15 |
| Silhouette Coefficient | 0.38 | 0.42 | 0.45 |
| DB Index | 0.91 | 0.90 | 0.77 |
| Mean Value. | C1 | C2 | C3 | C4 | C5 | C6 | C7 | C8 |
|---|---|---|---|---|---|---|---|---|
| Trip Frequency | 2.535 | 1 | 3.283 | 36.501 | 15.06 | 9.304 | 67.246 | 19.739 |
| Total Fee (CNY) | 113.78 | 137.17 | 218.75 | 1349.88 | 11903.14 | 670.71 | 1991.95 | 1009.36 |
| Travel Day | 1.466 | 1 | 2.253 | 20.269 | 11.332 | 6.299 | 26.903 | 12.405 |
| Weekday Trip | 0 | 0.725 | 2.541 | 28.844 | 11.078 | 7.033 | 53.02 | 15.33 |
| Peak-hour Trip | 0 | 0.184 | 0.535 | 8.706 | 1.784 | 1.724 | 15.772 | 3.964 |
| Repeated Rate | 0.467 | 1 | 0.421 | 0.396 | 0.301 | 0.315 | 0.415 | 0.32 |
| Passenger Vehicle% | 94.86% | 84.95% | 87.37% | 72.78% | 12.10% | 70.87% | 77.75% | 71.21% |
| Freight Vehicle% | 5.09% | 14.78% | 12.53% | 27.13% | 87.89% | 29.05% | 22.13% | 28.71% |
| Vehicle Number | 809,527 | 2,276,295 | 3,884,026 | 134,857 | 90,752 | 1,169,870 | 50,265 | 389,098 |
| Vehicle Proportion | 9.19% | 25.85% | 44.11% | 1.53% | 1.03% | 13.29% | 0.57% | 4.42% |
Publisher’s Note: MDPI stays neutral with regard to jurisdictional claims in published maps and institutional affiliations. |
© 2022 by the authors. Licensee MDPI, Basel, Switzerland. This article is an open access article distributed under the terms and conditions of the Creative Commons Attribution (CC BY) license (https://creativecommons.org/licenses/by/4.0/).
Share and Cite
Jia, J.; Shao, M.; Cao, R.; Chen, X.; Zhang, H.; Shi, B.; Wang, X. Exploring the Individual Travel Patterns Utilizing Large-Scale Highway Transaction Dataset. Sustainability 2022, 14, 14196. https://doi.org/10.3390/su142114196
Jia J, Shao M, Cao R, Chen X, Zhang H, Shi B, Wang X. Exploring the Individual Travel Patterns Utilizing Large-Scale Highway Transaction Dataset. Sustainability. 2022; 14(21):14196. https://doi.org/10.3390/su142114196
Chicago/Turabian StyleJia, Jianmin, Mingyu Shao, Rong Cao, Xuehui Chen, Hui Zhang, Baiying Shi, and Xiaohan Wang. 2022. "Exploring the Individual Travel Patterns Utilizing Large-Scale Highway Transaction Dataset" Sustainability 14, no. 21: 14196. https://doi.org/10.3390/su142114196
APA StyleJia, J., Shao, M., Cao, R., Chen, X., Zhang, H., Shi, B., & Wang, X. (2022). Exploring the Individual Travel Patterns Utilizing Large-Scale Highway Transaction Dataset. Sustainability, 14(21), 14196. https://doi.org/10.3390/su142114196


