Abstract
The large size of a glazed component allows greater access to natural light inside and a wider view of the outdoors while protecting the inside from extreme weather conditions. However, glazed components make buildings energy inefficient compared to opaque components if not designed suitably, and sometimes they create glare discomforts too. In order to protect against excessive natural light and direct sunlight and for privacy, dynamic shading devices are integrated into the glazed façade. In this study, the impact of various glazing and shading design parameters has been investigated by performing uncertainty and sensitivity analyses. The uncertainty analysis indicates that the variance coefficients for the source energy use, lighting energy use, useful daylight illuminance (UDI), and shade-deployed time fraction are in the ranges of 15.04–30.47, 39.05–45.06, 40.57–49.92, and 19.35–52%, respectively. The dispersion in the energy and indoor visual performance is evident by the large variation in the source energy consumption and UDI (500–2000), which vary in the ranges of 250–450 kWh/(m2-year) and 5–90%. Furthermore, a sensitivity analysis identified the window-to-wall ratio (WWR), aspect ratio (ASR), glazing type (Gt), absorptance of the wall (Aw), and shade transmittance (ST) as major influences of the parameters. Each of the identified parameters has a different proportionate impact depending on the façade orientation and performance parameters.
1. Introduction
In recent years, highly glazed façade office buildings have gained a great deal of attention and are now being developed throughout the world. Larger glazed façades are being preferred by modern office buildings in order to offer a sophisticated and enticing appearance, to allow higher access to natural light indoors, and to minimize indoor artificial lighting requirements. Moreover, the glazed façade provides a wider view of the outdoors while shielding occupants from the outdoor environment’s harmful effects. Despite many benefits of a transparent façade, it is the weakest insulation component [1] and has a risk of an increased heat loss/gain from/to the building [2,3,4]. The heat gain/loss eventually increases the energy consumption in an HVAC system that is used to regulate the indoor thermal environment. The heat loss even in low-energy glazed façade buildings can be up to 40% [5]. However, the impact of the glazed component on the energy consumption varies greatly with the building type and size. The impact can be lesser in multi-story stone buildings but higher in skyscrapers [6,7]. Hence, the continuous development of buildings with an increased size of the glazed façade will certainly significantly increase the overall building energy consumption share from its current value in the global final energy consumption, which is approximately 30–40% [8,9]. Moreover, an increase in greenhouse gases (GHGs) emissions due to highly glazed buildings and its impact on climate change cannot be ignored as the space-cooling demand is expected to be triple by 2050 [10]. The demand for air-conditioned floor space will further increase the electricity consumption and GHG emissions in the building sector [11] as the commercial activities are expected to be increased between 2012 and 2040, which will lead to an average 1.6% annual increase in the building energy demand [10]. In recent years, various energy-efficient glazing and window options, including thermochromic [12], electrochromic [13], double-skin façade [14], double-pane [15] and triple-pane windows [16], fixed [17] and dynamic shading devices [18], etc., have been explored to minimize the heating and cooling energy usage, particularly in highly glazed buildings. Also, the policy makers, building designers, developers, and researchers have increased their focus on designing and developing energy-efficient glazed façades along with other energy-reducing approaches in buildings [19,20,21,22,23,24]. However, designing a glazed component that improves the energy and indoor visual performance is highly desirable but complicated. Moreover, recent research shows that the development of highly energy-efficient and well-daylit-illuminated buildings can only be ensured if the sizing of the glazed façade, thermo-optical properties of the glazing and shading, control strategies for shading and artificial lighting, and shading types are selected suitably and appropriately [4,25,26,27]. Considerable energy savings can be achieved in heating, cooling, and lighting energy consumption by applying automatically controlled dynamic shading integrated with controllable artificial lighting in the buildings, irrespective of the climatic conditions [28]. In our recent study, the energy-saving potentials through various combinations of glazing, dynamic internal roller shading, and the glazed area have been assessed and presented for office buildings in a cold climate [4]. The energy and visual performances of glazed façades are essentially required to be evaluated in an integrated manner by considering the combined impact of the glazing integrated with shadings and other building parameters.
Here in this study, the glazed component represents a combination of glass panes and the associated shading attachments. The shading attachments can be placed internally, externally, or in-between the glass panes in a glazed façade and used to avoid the excessive natural light and direct sunlight and offer a comfortable visual indoor environment with privacy for the occupants [25,29]. There are different types of shading attachments, e.g., a roller shade, venetian blind, plated shade, and cellular shade, which are used in general. The issue of a discomfort glare in the indoor space can be lessened/eliminated completely and efficiently if a dynamic shading device is employed at the internal side of the glass pane to clog the excessive daylight/direct sun rays [30]. Researchers have considered interior shading attachments (including an interior roller shade) with glazed components and investigated their effects on the buildings’ energy performance and illuminance level in the indoor area. Recently, the impact of internally placed roller shadings on the energy performance and indoor visual environment has been investigated for various sizes of a glazed façade with different types of glazing [26,31]. Moreover, the effect of the internally placed dynamic roller shading of different properties of shade fabric regulated by four different controlling schemes has been assessed in terms of the energy consumption, indoor daylight illuminance, and discomfort glare [31]. More recently, the effect of eight different shading controls, including the static and dynamic frequencies on the visual and energy performance of the office building, have been assessed [32]. The balance between the indoor visual comfort and the energy consumption of the building have been assessed for varying properties of glazing and interior roller shades by taking the control strategy and window size into consideration [33].
These shading attachments are required to be auto-controlled using the appropriate triggers (e.g., glare, temperature, radiation, illuminance, temperature, etc.). The effect of some of the different types of shading-controlled conditions on the energy performance of an office room was studied recently [34]. Moreover, indoor thermal and visual environmental conditions have been regulated by employing different options of shading and glazing [30,35,36]. Also, the consumption, thermal, and indoor light environments are significantly influenced by adjustment strategies for the shading and ventilation of the glazed element [37]. It has to be noted that the energy and indoor visual performances of the building are dependent on a number of variables, including the glazing and shading properties, size of the glazed façade, control strategies of shading and interior artificial lighting, building aspect ratio, and optical properties of interior surfaces, and obviously on the climate of the location. Hence, the selection of each of the influencing parameters is vital for creating energy-efficient building stocks and the sustainability of the cities. The research literature highlights a few methods [38], including a multi-criteria assessment [19], that have been proposed to assist in the process of decision making by the building engineers for selecting the most influencing design parameters. The proposed methods include the uncertainty and sensitivity analyses of the design parameters and energy performance optimization of the buildings [39]. The uncertainty method is used to assess the inconsistency in the performance of the buildings due to different uncertain design parameters [37]. On the other hand, significant/influential design parameters that regulate the energy performance and indoor visual comfort in the buildings are identified and prioritized by performing a sensitivity analysis [40]. A thorough analysis of the global uncertainty and sensitivity assists in the apt identification of the major influencing parameters/properties of the glazing and shading for designing a dynamic glazed façade that not only enhances the energy performance of the office building but also provides a better indoor-illuminating environment [26]. Both the methods have been practiced effectively for years, in many areas of scientific research and engineering, to increase the effectiveness and efficiencies of the systems, technologies, and processes [37,41,42,43,44,45,46,47]. The uncertainty analysis is generally performed using the Monte Carlo (MC) process. However, for the sensitivity analysis, different approaches, e.g., the Morris approach [48], sampling-based approach [49], sequential bifurcation approach [50], factorial approach [51], and ANOVA approach [38], are available and used extensively by the researchers and engineers for assessing the effect of different design variables on the energy performance of the buildings. Further, few other local and global sensitivity assessment approaches have been explained in Ref. [52], and their advantages and disadvantages regarding the thermal performance assessment of buildings have been reported in Ref. [53]. The compiled work indicated that the global approach is highly reliable, but the high computational requirement is the only disadvantage of the method. The approach collects facts for a portion of the input variables in a broad range [47]. Regardless of the various studies on the assessment of the significant design parameters of glazed components in buildings, the results may not be applied uniformly in all climatic conditions for all types of buildings. Here, all the climate types mean the climate types classified by Köppen and Geiger. Their classification divides the climates into five main climate groups and various subgroups. The detail of their classification can be learned from Ref. [54]. Further, it can be learned from the literature discussed above that the design variables for designing a glazed façade integrated with a dynamic internally placed roller shade for an office building in the subtropical hot desert climate, BWh (as per Köppen and Geiger classification), has hardly been cited yet. Therefore, it can be worth investigating the crucial design parameters and their proportionate contribution in energy and indoor visual performances for a glazed façade integrated with an internally placed roller shade. The results of the study are certainly and highly beneficial for building designers, developers, building engineers, and researchers, as well as for policy makers to create high-performance building stocks and sustainable cities.
The study aims to scrutinize the significant design parameters that govern the energy and indoor visual performance of office buildings particularly in a subtropical hot desert climate. Therefore, efforts have been made to investigate the proportionate impacts of the different parameters of a glazed component on the total energy consumption, lighting energy consumption, and indoor visual comfort (in the form of the useful daylight illuminance and shading-deployment time fraction). The uncertainty and sensitivity analyses have been performed to assess the contribution of each of the studied design parameters of the glazed component on the energy and indoor visual performance of the office buildings. The results of the study will be equally applicable and effective for both a newly proposed building to be constructed and for retrofitting in the existing buildings.
2. Materials and Methods
In this study, two-step procedure has been adopted to arrive on the appropriate glazed façade design choices by performing range of discrete solutions. The first step in the procedure is to investigate the uncertainties arising in the performance parameters for a range of design parameters. However, if the first step is unable to determine the sources of the uncertainties in the selected input design variables, second step for the sensitivity analysis is encouraged to be performed. The method allows estimating the first-order and total effect sensitivity indices and reveals contribution of each design parameter for the building performance parameters.
2.1. Step-I: Uncertainty Evaluation
In the energy-efficient building design assay, uniform distribution is prevalently utilized for portraying the distribution of the different design parameters [55]. The selected sampling strategy is applied using the Monte Carlo (MC) approach to synthesize the input variables through probability density functions. In this study, the Latin Hypercube Sampling (LHS) strategy is employed to stratify the samples [56] for better coverage of all parts of the factor distribution of input variables and appropriateness of the strategy in the context of building energy simulation. The LHS splits each input variable and divides the range of the variable into m equally probable intervals (m > 2). Leastwise, one random observation is made within every interval. Further, the recommended executions (n) are ≥3/2 times of the total input variables (p) [57].
Dispersion and uncertainty in the results are assessed by the values of variation coefficient (υ). The coefficient of variation is a statistical measure of the dispersion of results and represents the ratio of standard deviation to the mean of results. Following mathematical equations are used to estimate the mean (μ) and standard deviation (σ) values:
2.2. Step-II: Sensitivity Evaluation
For sensitivity analysis, we have considered the variance-based extended Fourier amplitude sensitivity testing (eFAST) method [58] as it is generally preferred for assessing the complex problems of energy and heat transfer in buildings and is improved version of classic FAST method [59]. In addition, among the available sensitivity assessment approaches, variance-based approaches are competent to grapple with the non-monotonic and non-linear models. Moreover, the method takes the effect of interactions among the input variables into account during the assessment process. The extended FAST is one of the highly effectual variance-based methods that features a rapid convergence. Unlike classic FAST method, the extended FAST method allows estimation of the first-order sensitivity index (Si) and the total-order effect sensitivity index (STi)) for quantifying the contribution of each input variable to the total variance by employing the same set of samples. The first-order and total effect sensitivity indices are expressed in terms of variance (Var) and expected value (E) of an output Y for input variables (i.e., X1, X2, …, Xk) as:
The input variable’s uncertainties effect on the output results is expressed by the first-order sensitivity index. The values of the first-order index remain between 0 and 1. For additive system, the sum of all first-order sensitivity indices remains equal to 1. The first-order index can moderately explain the impact of input variables on the change in the output. For non-additive model, the value of Si remains less than 1. Therefore, particularly in the case of non-additive models, total effect sensitivity index is assessed for obtaining comprehensive information regarding the impact of a particular input variable on the change in the output parameter. The total effect sensitivity index represents sum of all indices, including first-order and other higher-order sensitivity indices corresponding to the parameters that are being investigated. In this study, the sample set of the input variables for sensitivity analysis has been generated in a statistical tool SimLab2.2 [57] by applying the extended FAST method.
The totality of the total effect sensitivity always remains greater than 1 for non-additive model and 1 for perfectly additive model. The comparative values of first-order and total effect sensitivity indices explain whether the model is additive or non-additive. Equal values of both the indices indicate that the model is additive. However, for non-additive model, the value of total effect index has to be larger than the first-order index. Also, higher value of total effect index implies interactions within the input variables. Moreover, obtaining a lower value of first-order sensitivity index does not mean that the value of input variable is inevitably fixed anywhere in the given range. Hence, assessment of total effect sensitivity index recommended for fixing the values of input variables. Infinitesimal values of total effect sensitivity index for the input variables indicate that the variables are not affecting the output.
2.3. Simulation Tool for Estimation of Energy and Indoor Visual Performance Parameters
In this study, we have used EnergyPlus to perform simulation of dynamic glazed façade integrated building. EnergyPlus is one of the whole-building energy simulation and performance assessment software and being utilized extensively by building energy simulation community because it has advanced features, including renewable energy components, required in building energy simulation [60] for modeling the energy and water consumption in buildings [61]. The tool utilizes best features and capabilities of two older building energy simulation programs, i.e., DOE-2 and BLAST, which were developed under the sponsorship of US Department of Energy and Department of Defense, respectively. Moreover, the tool is found to be most suitable for this study, as it has several essential features required for modeling advanced fenestration, roller shade and its controlling options, artificial lighting controls, and integration of daylighting components and estimation of shade-deployment time fraction [62,63]. The daylight distribution at the work plane is estimated by the split-flux method in the tool [64]. The effect of the interior surfaces’ reflectance is taken into account by the method while calculating the indoor daylight illuminance. The split-flux method produces indoor illuminance values in comparable range (<20% difference) [65] that are produced by the most powerful Daysim\Radiance program for daylight modeling. Also, both the programs(i.e., Radiance/Daysim and EnergyPlus) use one sky model (i.e., the sky diffuse irradiance and illuminance on tilted surface model) developed by Perez et al. [66] for estimating the external illuminance. Moreover, EnergyPlus tool performs the daylighting and thermal simulations in integrated manner. The values of input variables generated externally by the SimLab 2.2 have been used in the EnergyPlus tool with help of jEplus 1.6 tool [67] for parametric run.
2.4. Roller Shade Model in EnergyPlus
Shading is a separate layer of either drapery, roller shade, or blind; however, the optical and thermal properties of the dynamic glazed component (including glazing and roller shade) collectively influence total energy consumption and indoor visual environment of the glazed office buildings. In this study, a case of interior roller shade has been considered with varying optical and thermal properties. EnergyPlus uses Winkelmann method [68] for estimating the window luminance, considering the effect of shade in place. In the calculation, the shade is assumed to be perfect diffuser. The transmittance, reflectance, and absorptance of front and back of the shade are assumed to be equal and independent of incidence angle. The air flow through the glazing and shade, particularly for interior shade, carries the heat absorbed by shading and glazing and affects indoor air temperature. The effect of natural airflow between the shade and glazing is taken into account by the simulation tool and estimated as described in Ref. [69]. Also, shade is automatically deployed during simulation in case of exceeded glare from its specified limit.
2.5. Climate of the Case Study Location
Amritsar has been selected as a case study location. Amritsar is the second largest city in the Indian province of Punjab and houses over one million people. It is situated (latitude: 31°22′ N and longitude: 74°31′ E) at an elevation 234 m above the sea level and 217 km northwest of state capital Chandigarh, 455 km northwest of the national capital New Delhi. According to the Indian national building code (NBC), the city falls under composite climate (Bureau of Indian Standard 2016) [70]. The city has been classified as subtropical hot desert as BWh, by Köppen. The city experiences mainly four seasons, i.e., winter, summer, monsoon, and post monsoon, which fall between December and March; April and June; July and September; and October to November, respectively. Figure 1 shows the diurnal average temperature and global horizontal radiation variation for the whole year. The average annual temperature of the city is observed to be around 25 °C most of the time throughout the year. Therefore, cooling is predominantly demanded. Also, in Figure 1, the average daily horizontal global radiation can be observed to be varied in the range of 0.10 to approx. 0.35 kWh/m2. Further, Figure 2 shows the total solar energy received yearly during different hours by eight differently oriented vertical surfaces. East–south surface receives maximum radiation at 11:00 a.m. and the value of the solar energy stays above 150 kWh/(m2-year) during 9:00 a.m.–12:00 noon. East, north–east, and east–south surfaces receive annual hourly solar energy in the ranges 50–200 kWh/(m2-year), 50–100 kWh/(m2-year), and approx. 50–225 kWh/(m2-year), respectively, and these surfaces face sun mainly in pre-noon hours. The west–north, west, and south–west surfaces face sun mainly in the post-noon hours and receive the annual hourly solar energy in the ranges of approx. 50–100 kWh/(m2-year), 50–150 kWh/(m2-year), and approx. 50–180 kWh/(m2-year), respectively. The north surface mainly receives diffuse radiation, while the south surface faces sun most of the time during the day.
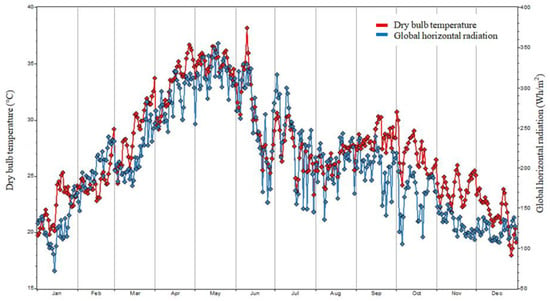
Figure 1.
Variation of daily dry-bulb temperature and global horizontal radiation of Amritsar.
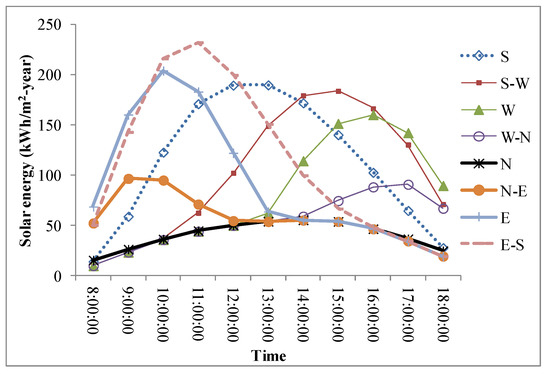
Figure 2.
Annual hourly solar energy intercepted by different vertical surfaces at Amritsar.
The study utilizes meteorological hourly time-series data arranged in TMY2 file format. ISHRAE [71] measures the meteorological parameters that were made available to EnergyPlus users.
2.6. Reference Case and Input Parameters
A standard room of 16 m2 area considered for the analyses has been assumed to be situated at an intermediate floor of a multi-story office building. Only glazed façade is assumed to be exposed to the outdoor environment. All other surfaces, i.e., floor, roof, and walls, are assumed opaque and adiabatic. These surfaces are intermediate surfaces and shared with adjacent similar office rooms at same room temperature. For the purpose of comparative performance, base-cases scenario in which an office room of size 4 × 4 × 3 m and having one wall of 30% glazed area of size 2.0 × 1.8 m. The glazed façade was assumed to be exposed to outdoor environment. The input values of the glazed frame and opaque wall used in the simulation are given in Table 1. All other surfaces have been kept as those of standard room. The glazing used in the base case was clear single glass pane, p1 (as given in Table 5). For other cases simulated in this study, the room aspect ratio and window-to-wall ratio have been varied for a fixed floor area.

Table 1.
Input parameters for glazing frame and opaque wall.
2.7. Input for Indoor Illuminance Level and Useful Daylight Illuminance Assessment
The recommended work plane illuminance (i.e., 500 lux) at the work plane (0.8 m above the floor) in the office spaces has been set in the simulations. The continuous dimmable system has been assumed to be integrated with the indoor lighting that compensate the daylight illuminance to maintain recommended illuminance level on the work plane [35]. A photo sensor has been assumed to be integrated with the continuous dimmer, which is placed in the center of office room at the work plane. Further, the floor of the office room has been divided into a grid of 10 × 10 points to produce daylight illuminance map by the EnergyPlus. The map represents the mean value of the illuminance measured at the center of each elementary square in the grid plane. The produced map is further used for estimating the useful daylight illuminance (UDI) values. In this study, a separate illuminance map is produced for each daylight hour; however, values of UDIs presented in this paper are cumulative and only for office hours, i.e., 9:00 a.m. to 5:00 p.m.
2.8. Controls for Indoor Thermal Environment
The room has been assumed to be air-conditioned and indoor air temperature maintained at 24 °C in summer and 22 °C in winter, between 9:00 a.m. and 5:00 p.m. (office hours) system. The cooling and heating temperatures for non-office hours have been fixed 30 and 18 °C in summer and winter, respectively. An HVAC system with single direct expansion-type cooling coil and an electric heater have been assumed to be integrated in building for cooling and heating, i.e., to maintain the desirable indoor temperatures. The coefficient performance (COP) of the cooling unit (includes direct expansion cooling coil, and condensing unit having electric compressor and condensing fan) and efficiency of the electrical heating coil located directly in the air loop have been assumed to be 3.5 and 1, respectively, throughout the simulation [4].
2.9. Indoor Lighting and Glare Control and Assessment
It should be noted that a dynamic glazed façade building having lighting control system associated with the daylighting system can reduce primary energy demand up to 60% compared to static glazed façade [73]. For the simulation purpose, the indoor artificial lightings in the office room have been assumed to be controlled by an ideal continuous dimmer, behaving as shown in Figure 3 [74]. The real dimmer may show a different correlation depending on the type of ballast used for indoor lighting and manufacturer of the ballast [75]. They are of high frequency, and fluctuation in operation is barely noticeable and less disturbing. The undesirable discomfort glare is an issue that arises due to highly bright light source (i.e., glazed component). There are different indices used to explain the glare and perception of the occupants. The daylight glare index (DGI) is one of the widely accepted indices in the literature that represents intensity of the quality/glare of the daylight. Table 2 shows Hopkinson scale [76] that defines perception of the occupants for different values of DGI. The scale recommends 22 as upper limit of the DGI. The index is a function of size and location of the luminance of the source of glare (glazed component), view direction of the occupant, and luminance of background [76]. Method developed by Hopkinson [77] is used in the EnergyPlus tool to estimate the DGI [64]. The glare is estimated if source is visible to occupant sitting in the normal position. In this study, view angle facing the glazed façade has been taken for estimating the DGI in all simulated cases.
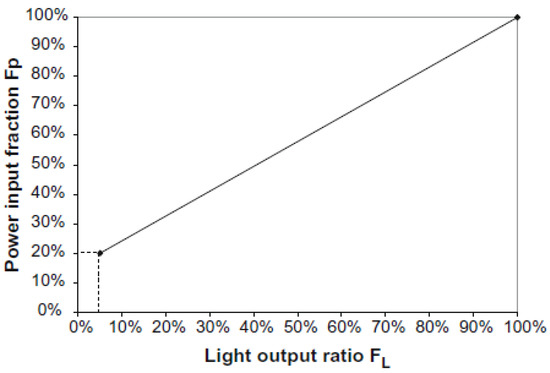
Figure 3.
Relationship between fraction of input power and output light ratio an ideal high-frequency dimmer [74].

Table 2.
Hopkinson scale of daylight glare index (DGI) [76].
2.10. Internal Heat Gain
The recommended values of the sensible heat gain, equipment load factor, and density of the occupant during the office hours that have been used in the simulation process are 5.4 W/m2, 76 W, and 0.11 p/m2, respectively [31]. These values are also equivalent to those recommended by Energy Conservation Building Code (ECBC) of India [72]. The power density for illuminating the office space effectively (i.e., to provide an average 500-lux illuminance) by using the artificial light completely is 11.8 W/m2 [72]. In addition, a variable heat gain from the luminaries has been taken into consideration according to the use of the artificial lighting in order to compensate daylight illuminance to meet the recommended indoor illuminance level.
2.11. Design Input Variables and Simulation Cases
Thermo-optical properties of glazing [78,79,80] and shade material [31], size of the glazed component [81,82], shading types and control strategies for artificial lighting and shade deployment [31], aspect ratio of the office room, absorptance of internal surfaces, orientation of glazed façade, and many other parameters are critical to energy and indoor visual performances of the glazed façade office buildings. Therefore, impact of the properties and parameters has to be assessed systematically. The design variables and their ranges considered in this study are listed in Table 3.

Table 3.
Detail of selected input design variables.
Orientation of the glazed façade is critical for energy and indoor visual performances of the office buildings. Therefore, total eight differently oriented glazed façade office rooms, which include four major orientations and four in between the major orientations, i.e., (N, N–E, E, E–S, S, S–W, W, and W-N), have been simulated in this study. Further, total 10 glazing types (A-J), as listed in Table 4, have been used. All of these glazing types have been arranged in double panes with a 12.7 mm air gap and cover a reasonable range of thermal and optical properties of glass panes suitable for building applications. As the properties of glass have strong relationship with each other and hence considering in a group as discrete distribution is more appropriate over considering each property separately. The solar optical and thermal properties, which are estimated at normal incidence, for groups of double-pane glazing and for individual panes in groups, are given in Table 4 and Table 5, respectively. WINDOW 6 tool, developed by Berkeley Lab [83], has been used for calculating the solar optical and thermal properties listed in Table 4 and Table 5. The glazing types given in Table 5 are available in the WINDOW tool’s database and have been manufactured by different glass sheet manufacturers as well as also being used practically. However, values given in Table 5 have been used as input to the EnergyPlus tool and its internal algorithm calculates the combined values of thermal and solar optical properties for the double-pane glazing, which may differ from the values listed in Table 4. The simulations have been performed for each of the values within the range, and the energy and indoor visual performance parameters have been assessed for each of the cases generated by LHS and extended FAST strategies. The input parameters have been used to generate total 150 and 800 cases for each façade orientations for uncertainly and sensitivity analyses, respectively. The simulation cases have been generated using SimLab 2.2, statistical software.

Table 4.
Combined thermo-optical properties of glazing types [84].

Table 5.
Glass pane properties of all double-pane glazing types [84].
2.12. Building Energy and Indoor Visual Performances Assessment Criteria
Different performance matrices, i.e., source energy consumption, lighting energy use, useful daylight illuminance, and shade-deployment time fraction, have been selected for assessing the performance of office building with varying parameters. The source energy represents the raw fuel consumed powering building. The source energy incorporates all losses in transmission, delivery, and production of the electricity supplied to the building. The overall energy performance of the buildings is suitably expressed and compared by the total source energy consumption. The total source energy consumption includes energy consumed in cooling, heating, fan, and indoor artificial lighting and office equipment. In this study, we have calculated the energy consumptions for cooling, heating lighting, fan, and equipment as well as total energy consumptions for all the simulated cases. However, total energy and lighting energy consumptions have been used in the analysis as these two are mainly considered in the process of decision making on the design parameters of buildings. Further, the UDI and shading-deployed time fraction/shading on time fraction have been used to assess the indoor visual performance of all the cases. The UDI explains the quantity and quality of availability of the daylight illuminance in office space while shading on time fraction informs about the availability of the outside view.
Further, indoor visual performance of all simulated cases has been assessed using UDI in the office space and shading-deployed time fraction, which provide information availability of the useful natural light and outdoor view. Few researchers have reported daylight autonomy (DA), which is another one of the assessment criteria for indoor visual performance of the buildings. The DA represents total time fraction in the year when the daylight illuminance available on the work plane is above 500 lux. However, the DA does not provide the information on the contribution of daylight in reducing the artificial lighting energy use when the indoor daylight illuminance remains below the minimum required illuminance level (i.e., 500 lux) and dimmer-controlled artificial lights are used to supply the additional required illuminance in the indoor. Moreover, daylight illuminance may cause glare if exceeds a certain limit. Hence, the issue of the glare cannot be addressed by the DA index. Therefore, in this study, UDI is reported as an indoor visual performance assessment parameter. Initially, Mardaljevic and confreres [85] have proposed UDI, which measures frequency of occurrence of daylight illuminance within the range of 100–2000 lux. Moreover, unlike DA, the UDI includes factors that express the tendency of visual discomfort occurrence for the occupants. From the perspective of visual comfort and energy performance, the received daylight to indoor space should be glare free and adequate to eliminate the artificial lighting use. Moreover, the index should provide the information clearly on the capability of reducing artificial lighting use if it cannot be eliminated by the received daylight illuminance to the indoor. Therefore, the UDI was further categorized into following bins [33]: (i) 100–500 lux; (ii) 500–1000 lux; and (iii) 1000–2000 lux. Using these bins, the assessment can be performed in a more systematic way. In this paper, we have presented results for UDI by combining the last two bins into a single bin (i.e., 500–2000 lux). The illuminance in this newly defined bin can suitably meet the recommended illuminance level on the work plane without any use of the artificial lighting use, and the daylight available in this bin does not cause glare issue. The indoor visual and energy performance parameters described above have been estimated for each of the simulated cases.
2.13. Validation of Simulation Model and Reliability of the Results
Results’ accuracy of every component in EnergyPlus is ensured before final inclusion in the tool. The validation of the components is performed against reliable experimental data. However, it is essential to verify the EnergyPlus model suitably for the proposed study. In this study, values of UDI, lighting, and total source energy have been verified with the similar study performed by Shen and Tzempelikos [33] for south glazed façade. The model used by Shen and Tzempelikos [33] has been validated with the full-scale experimental results and the detail of the roller shade model is given in ref. [86]. Hence, the results generated by the validated model are quite acceptable. However, there may be some uncertainties and unpredictability involved in the results due to different methods used by two different simulation models. Unlike split-flux method in EnergyPlus, their model is based on the one-bounce ray tracing along with radiosity method for estimating final luminous existence at different surfaces in the indoors from horizontal direct and diffuse solar radiation values. Moreover, the heat-transfer calculation uses improved version of finite difference thermal network method. There may be some unpredictability and uncertainty in the results from two different models due to indicated different estimation methods. Statistical parameters, such as mean bias error (MBE), root mean square error (RMSE), and percent root mean square error (PRMSE), have been calculated to represent uncertainties and unpredictability. The values of these parameters are calculated as follows:
where n is number of cases simulated for each roller shade type, X’ and X represent values estimated by EnergyPlus and Shen and Tzempelikos models, respectively.
The EnergyPlus model has been developed for office building using the input values from ref. [33] and values of lighting energy, total source energy consumption, and UDI calculated for climate of Chicago. The south glazed façade office having glazing type I as defined in ref. [33] simulated in bare glazing and with shade fabrics 3, 5, and 7% reflectance.
Figure 4 shows that the values of lighting energy consumption, total source energy consumption, and UDI estimated by two different models are in a similar pattern. The values estimated by the EnergyPlus model are in good agreement with the values estimated by the model used by Shen and Tzempelikos [33]. Further, the estimated values of MBE, RMSE, and PRMSE for lighting energy, source energy, and UDI are listed in Table 6.

Figure 4.
Comparative performance of EnergyPlus with Shen and Tzempelikos model in terms of (a) lighting energy consumption; (b) total source energy consumption and (c) UDI.

Table 6.
EnergyPlus model performance.
Larger values of PRMSE for lighting energy consumption have been estimated, which may be the result of different indoor luminance estimation method and utilizing feedback from multiple points for artificial lighting in ref. [33], unlike one reference point feedback control in EnergyPlus model. Moreover, variation in the values for total energy consumption can be anticipated for the effect of variation in the use of artificial lighting to maintain the illuminance level on the work plane. Hence, the variation in artificial lighting use influences the heating and cooling load and eventually total energy consumption.
3. Results and Discussions
3.1. Uncertainty and Sensitivity
Table 7 shows the estimated values of the mean, coefficient of variations, and standard deviation for the energy consumptions and the UDI (500–2000 lux) for differently glazed façade-oriented offices. These values have been estimated from 150 simulated cases for each façade orientation. The cases have been generated using the MC-LHS method by using the ranges for eight input variables (i.e., the design parameters). It can be seen that the values of the variation coefficient for the total energy consumption, lighting energy use, and UDI vary between 15.04–30.47, 39.05–45.06, and 40.57–49.92% respectively. The max values of the coefficient estimated for the shade-deployed time fraction, UDI, lighting energy use, and total source energy consumption are approx. 52, 49.92, 45, and above 30%. Significantly, large values of the coefficient of variations indicate large dispersions in the output results. Through all eight differently façade-orientated offices, the maximum and minimum values of the coefficient of variation for the total source energy consumption have been estimated for the east–south and north façade oriented, respectively. The south, south–west, and west façade show the least variation with each other. The east façade performs almost similar to the east–south and the variation coefficient for the north–east is very close to the value for the west–north façade. For the lighting energy, the variation coefficients have been estimated as the lowest for the east façade office and highest for the south façade office room. The values are in the narrow range of approx. 39–42% for all the façade-oriented offices except the south- and south–west-oriented rooms. For the UDI, the east–south and north show the maximum and minimum values of the coefficient, respectively. The façades north–east and west–north show values closer to the north façade and remain below 42%. The coefficient has been estimated as approx. similar for the west and east façades. The comparative values of the coefficient of variation for the shading-deployed time fraction are plotted in Figure 5. The highest (52%) value of the coefficient can be seen for the north façade, while the lowest (19.35%) is for the south–west. The values of the coefficient are above 30% for the east-, north–east-, west–north-, and south-oriented façades and below 30% for the other studied façade orientations.

Table 7.
Values of mean, standard deviation, and variation coefficient for source energy, lighting energy use, and useful daylight illuminance (UDI) of the investigated four main- and four submain-oriented façade office rooms.
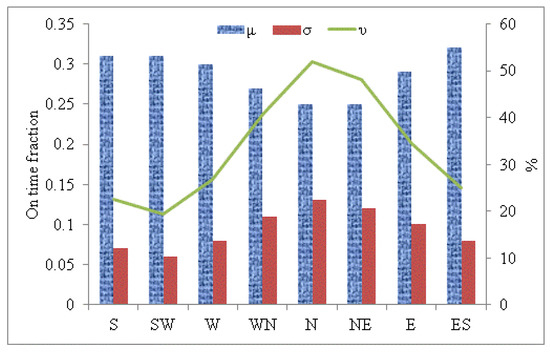
Figure 5.
Variation of coefficient, mean, and standard deviation of shade-deployment time fraction for different façade orientations.
Figure 6 represents the probability density distribution of the total source energy consumptions for all eight differently oriented façade rooms. Some of the curves can be observed as highly right skewed which indicates a high-energy inefficiency over the other simulated cases. The variation in the steepness of each curve indicates a significant difference in the variance that can be confirmed from the values in Table 7. For instance, the density curve for the north façade is steeper, and the source energy consumption is highly concentrated in a narrow range between 250 and 450 kWh/(m2-year) while the mode lies near to 350 kWh/(m2-year). The steepness of the curve is a little less for the façades oriented north–east and west–north and the source energy consumption is majorly distributed around 300–500 and 300–550 kWh/(m2-year), respectively. The east–south-oriented façade shows the most flattened probability–distribution curve that indicates a broader range of the total source energy consumption around the median value. The pattern of the source energy consumption is almost similar for façades oriented south, south–west, west, and east. Further, the base-case energy consumptions are represented by vertical lines for the comparison purpose only for each façade-orientated office room. The variation in the base-case source energy consumption with the façade orientation appears as a result of the variation of the thermal heat gain/loss mainly from the glazed component. The higher heat gain through the south façade during the winter season can lower the heating demand. Also, a lower heat gain in the summer from the south façade due to the high elevation of the sun lowers the cooling demand. A similar but variable effect can occur in other office rooms having a glazed façade in a different orientation. Moreover, the deployment of shading due to exceeded glare may reduce the heat gain and eventually lower the cooling energy consumption.
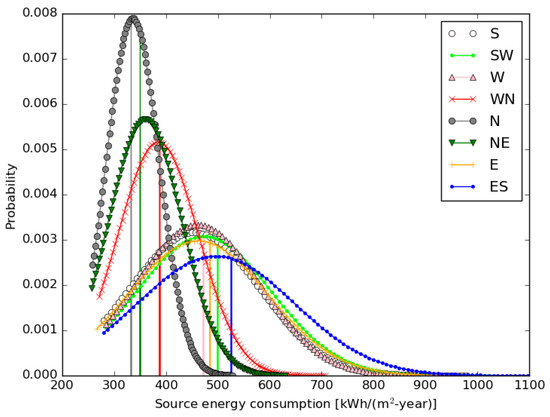
Figure 6.
Probability density function distribution of the source energy consumption for the office room having differently oriented glazed façades.
Figure 7 shows the probability density curves for the indoor artificial lighting energy consumptions of each studied façade-oriented office. The vertical line indicates the lighting energy consumption for the base-case scenario, which is static for all façade orientations and least irrespective of orientation. The minimum value for the base case is a result of the sufficiently high availability of daylight in a room most of the time due to the clear single-pane glazing without any shading. The probability for different values of the lighting energy consumption varies with the cases; however, they remain higher than the base case. The value of the other cases varies between around 20 kWh/(m2-year) and over 70 kWh/(m2-year). The curves in the plot are a little right skewed, which indicates undesirable energy-inefficient cases. For the east–south façade, the lighting energy consumption falls majorly between 20 and 50 kWh/(m2-year); however, the minimum and maximum values are close to 15 kWh/(m2-year) and over 60 kWh/(m2-year), respectively. In the case of a south façade office, the curve is a little less steep, and the median is observed considerably left than the east–south façade. For the south façade, the energy consumption majorly lies around 20 and 45 kWh/(m2-year). Further, the curves are flattened for the west and east façades compared to the other façades and the lighting energy consumptions are almost similar in the range between 20 and 55 kWh/(m2-year) for the majority of cases. The least steep probability curves can be seen in Figure 6 for the offices oriented west–north, north, and north–east, and the curves are skewed significantly to the right.
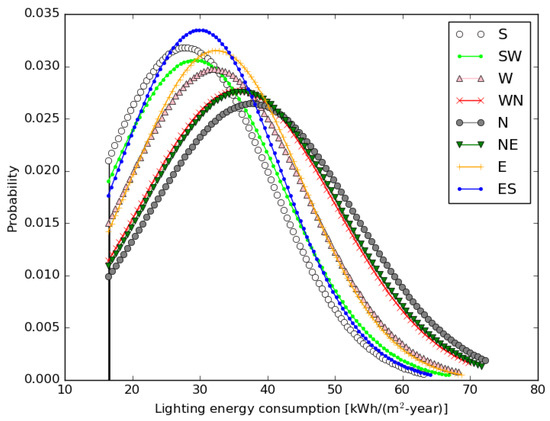
Figure 7.
Probability density function distribution of lighting consumption for offices of different façade orientations.
Figure 8 illustrates the UDI (500–2000) probability density function plots for all the simulated differently oriented façade offices. The values vary between less than 5% and close to 90%. The most flattened curve can be observed for the north-oriented façade office and the UDI values fall in a highly broad range from almost 0 to 90%. A higher value is highly desirable, and a lower value increases the artificial lighting consumption. The steepest curve in the graph is observed for the east–south-façade-oriented office. The majority distribution of the UDI values is between 15 and 55%. In the case of the other façades, the median is observed to be shifted to the right and the curves are a little right skewed. In the case of the UDI values, the median and majority distribution are preferred to be on the right side of the 50% or more, which are highly desirable conditions for naturally daylit offices. However, the automatic deployment of roller shading in the case of exceeding glare values from the recommended level may limit the natural light access. Further, the vertical lines represent the UDI values in the base-case scenarios for the respective façade-oriented office rooms. The cases over the base-case UDI probability values are highly desirable.
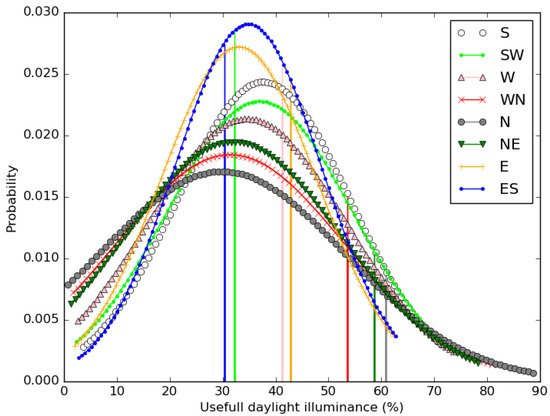
Figure 8.
Probability density function distribution of useful daylight illuminance (500–2000)(%) for offices of different façade orientations.
Figure 9 shows the distributions for the time fraction of the interior roller shade to be deployed. The shade-deployment time fraction varies between 0 and close to 0.45. The zero value means that the façade has never been shaded and 0.45 means the façade has been deployed 45% of the time in the case of exceeded glare. The probability curves for all the studies of the façade orientations can be observed to be skewed left, which is undesirable. For some of the façades, the values fall in the higher side of the range, i.e., in between 0.25 and 0.45. The south–west façade shows the steepest curve, followed by the south, west, east–south, and east, as well as the west–north; however, the skewness follows the reverse order. The offices with the glazed façade in the west–north, north, and north–east show significantly flattened curves and the probability distribution lies largely in a broader range between 0.1 and 0.4. A broader range of the probability distribution indicates a significantly large value of the variance of the coefficient that can also be observed in Table 7 for the north and north–east façades.
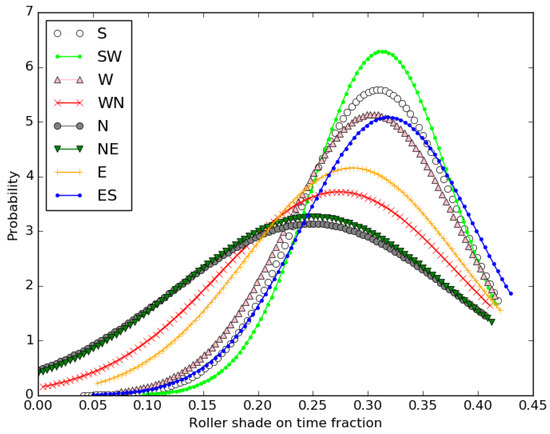
Figure 9.
Probability density function distribution of shade-deployed time fraction for offices of different façade orientations.
A significantly large variation in the probability distribution of the energy performance parameters (i.e., the source energy and lighting energy consumptions) and the indoor visual comfort parameters (i.e., the UDI and shade-deployment time fraction) clearly indicate a substantial disbanding in the performance of glazed façades. Moreover, an indicative disbanding in the coefficient of variation compels a further examination of the dominating design variables, which play a decisive role in fixing the energy and indoor visual performances of glazed façade office buildings. Hence, the delivery of befitting values of the glazed façade design parameters at the early stage of building design is highly important to make sure the energy and visual performance are in the desirable range. Therefore, the influential design variables of dynamic glazed façades are required to be analyzed through a sensitivity analysis.
An adequately large sample size (i.e., 800 samples) has been generated for the parametric sensitivity analysis as the input for each façade orientation using the extended FAST process. The energy and indoor visual performances simulations have been conducted in the EnergyPlus tool for each of the sample cases for all the façade orientations. Further, the sensitivity indices have been assessed for each case using the SimLab statistical tool. For the easy identification of major influential parameters, the contribution of each parameter, in the cumulative first-order and total effect sensitivity indices, has been presented in percentage. Figure 10 shows the impact of each design parameter in the first-order and total effect sensitivity indices. The largest value of the indices confirms that the window-to-wall ratio (WWR) has the highest influence on the source energy consumption followed by the glazing type (Gt) and thereafter the room aspect ratio (ASR), irrespective of the façade orientation. The impact of the other parameters, i.e., the absorptance of the floor, wall, and ceiling and the reflectance and transmittance of the shade fabric, is almost of equal and limited proportions and does not exceed over 5%. However, the ranking of these least impactful parameters varies with the orientation of the façade. It should be noted that the first-order index values remain within the limit of 2% for all the other parameters. Further, the total effect index analysis exhibits the impact of the surface absorptance for the wall, ceiling, and floor in the range of 3–7% and within the limit of 4% for the shade optical properties. The major influencing parameters are still the WWR, Gt, and ASR, and their proportionate impacts are approx. 35–50, 20–25, and 12–17%, respectively, for all orientations. The absorptance of the ceiling can be observed in the four highly impactful parameters for all the façade orientations. Figure 11 shows the proportionate impact of the first- and total-order sensitivity indices for all the designed parameters on the lighting energy consumption. The relative percentages of the first-order indices clearly indicate that the WWR is the most significant parameter followed by the shade fabric transmittance (ST) and absorptance of the wall (Aw). The first-order relative percentage impact of the WWR, ST, and Aw varies between 50–60, 25–35, and 5–12%, respectively. The cumulative impact of all the other parameters remains between 6 and 10%. The proportion impacts, demonstrated by the total effect index, of the WWR, ST, and Aw are in the ranges of approx. 38–46, 25–35, and 7–13%, respectively. The impact of all the other parameters remains in the range of 1–5% individually. The estimated impacts of each parameter are quite understandable and expected as the lighting energy consumption significantly depends on the availability of natural light indoors. A larger-sized glazed façade allows a higher amount of natural light that reduces the artificial lighting demand significantly. Further, the transmittance of the shade fabric controls the access of natural light to the indoors, and therefore the artificial light is highly influenced by the shade fabric transmittance. Moreover, the absorptance of the vertical indoor surfaces significantly influences the lighting energy consumption, which is clearly observable from the results. A high absorptance means a low reflectance that leads to a lower illuminance at the work plane and eventually demands a higher artificial lighting requirement and vice versa.
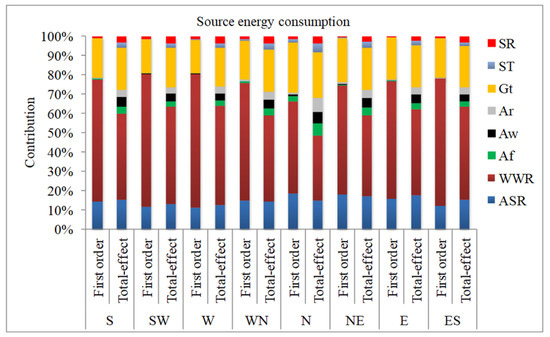
Figure 10.
Contribution of different design variables in first-order and total effect sensitivity indices for the source energy consumption.
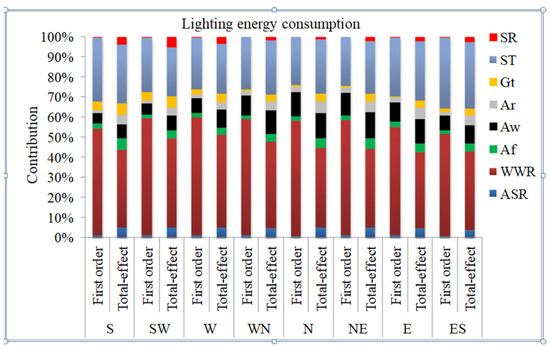
Figure 11.
Contribution of different input variables in the first-order and total effect sensitivity indices for the lighting energy consumption.
There is a substantial difference in the influence of each design parameter with the façade orientation, probably the result of the amount of solar energy received annually by the respective façade at different sunshine hours (see Figure 2). Moreover, the duration and incidence angle of the sun faced by each of the façades are different and lead to variation in the indoor daylight illuminance and eventually the occurrence of the glare. Such a variation in the sunlight pattern intercepted by the different façades creates a complex relation between the indoor artificial lighting energy and the source energy consumptions. The source energy consumption is completely governed by the heating, cooling, fan, and lighting energy demand. However, the cooling energy increases with increasing lighting energy use (particularly in the cooling period) and vice versa is true for the heating period (in the heating period). Hence, the values of the design parameters are suggested to be selected by accounting the source energy consumption, which actually represents the building energy performance and may influence the selection of the design parameters significantly.
Further, the indoor visual performance is another crucial aspect in designing energy-efficient, well-daylit, and sustainable buildings, particularly for office applications. Therefore, while selecting the design parameters, performance parameters, such as the adequacy of the indoor daylighting and a view to the outdoors, are required to be ensured. Figure 12 illustrates the contribution of different design parameters in the first-order and total effect indices for differently oriented façade offices for the UDI (500–2000). Comparatively, the proportion for the first-order and total effect order indices of the design parameters allude to the influence on the studied performance parameters, which is certainly helpful in the decision-making process. Hence, the parameters of the high contribution of the proportion are required to be given higher priority. Figure 12 clearly indicates that the WWR, ASR, Gt, ST, and Aw are the most significant parameters that influence the indoor visual performance of the office building. The proportion impact of the WWR varies between 50 and 85% for the different façade orientations and it became the most influential design parameter. The second and third ranks interchangeably vary between the ASR and ST with the façade orientations. The fourth impactful parameter is the Aw that contributes between 2 and 15% of the total impact. The proportionate impact of all the other parameters for all the façade orientations has been estimated to be below 5%. In terms of the total effect index analysis, the WWR is identified as the most significant parameter for the UDI, irrespective of the façade orientation, and the proportion impact of the parameter remains in the range of 40–55%. The second, third, and fourth rankings of the parameters interchangeably vary among the ASR, Aw, ST, and Gt with the façade orientations. The portion impact of these parameters varies between 5 and 20%. The contribution of the other parameters remains in the range of 2–5%. The analysis clearly demands a careful selection of the design parameters for a desirable UDI value for each of the façade orientations.
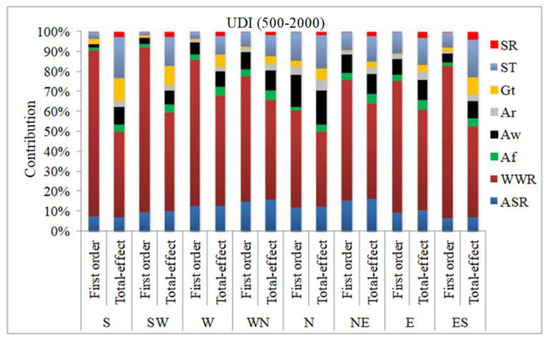
Figure 12.
Contribution of different design variables in first and total sensitivity indices for useful daylight illuminance (500–2000).
Another aspect in decision making for desirable visual comfort is the view to the outdoors. It is highly preferable to have glazed façades that provide a continuous outdoor view to make the occupants’ eyes feel comfortable and relaxed. Hence, a minimum shading time fraction is utterly desirable. However, excess daylight/sunlight leads to glare issue and shading is deployed. Previously, in this study, the variation of the shaded fraction time has been discussed and presented (see Figure 9). Figure 13 represents the contribution of the design parameters on the shading-deployed time fraction in the sensitivity indices. The most significantly contributing parameter identified in both, i.e., the first-order and total effect indices, is the Gt which has the highest proportion contribution in the range of 48–60 and 33–41%, respectively. In terms of the first-order index, the second and third major influencing parameters are the WWR and Aw, respectively. All the other parameter’s contributions are not more than 5%. Further, the Gt is still the most influencing parameter in the total effect index analysis; however, the contribution reduced to 33–41%. The second, third, and fourth significant identified parameters are the WWR, ASR, and Aw, and their proportion contributions have been estimated in the range of 21–25, 11–14, and 7–12%, respectively. Here, one can notice that the ASR has not been identified as a major contributing factor in the first-order index analysis, but in the total effect analysis, it has become the third most influencing factor. Therefore, the total-order index sensitivity analysis is extremely important for identifying the appropriate influencing parameters. The other parameters, i.e., the Af, Ar, ST, and SR, only contribute in the range of 3–6% in terms of the total-order index.
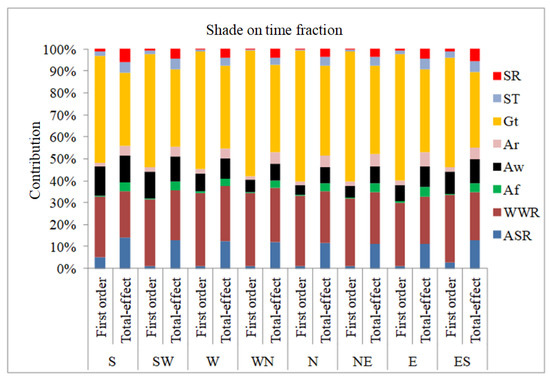
Figure 13.
Contribution of different design variables in first-order and total effect sensitivity indices for shade-deployed time fraction.
3.2. Impact of Highly Influential Design Parameters on the Source Energy Consumption
The scattered plot in Figure 14 illustrates the relationship patterns between the highly influential design parameters and the source energy consumption for the south and the north façades. One can observe a significant variation in the desirable value of the WWR, but the energy consumption randomly varies with the Ar and ASR, irrespective of the façade orientation. This random distribution indicates the influence of the other design parameters and the requirement of the prudential selection of the Ar and ASR along with other parameters. Further, a considerable variation in the source energy consumptions can be observed for the south and north façades. The dark blue dots represent the lowest energy consumption that can be attained only if all identified, most influential design parameters are chosen judiciously; otherwise, there are substantial chances of getting highly energy-inefficient building designs. Increasing source energy consumption with increasing WWR is anticipated as there is higher access to heat and solar energy upon increasing the size of the glazed façade. Moreover, as the direct solar radiation is hardly intercepted by the north façade, that makes the north-oriented room comparatively less sensitive to the WWR. The red dashed lines show the base-case source energy consumption. The values over the base-case line indicate the inefficient one and below the line are the desirable cases.
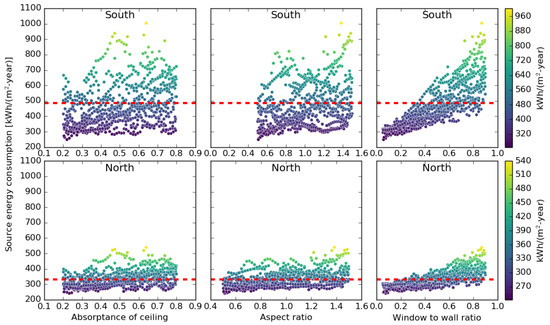
Figure 14.
Variation of the source energy consumption with the absorptance of ceiling (Ar), aspect ratio (ASR), and window-to-wall ratio (WWR) for south- and north-façade-oriented office room.
Figure 15 also clearly shows rightly skewed and a little higher flattened probability density curves for the different types of glazing in the west façade that indicate a high risk and high probability of inefficiency in the performance of the building designs. The dashed vertical black line represents the base-case source energy consumption for the west façade office room. The probability for each of the glazing types falling over the base-case value is considered an energy-inefficient case. This helps in making a decision in selecting the design parameters. The surface observes more solar intensity in the summer season compared to the other surfaces. The probability curves for glazing types A and B are highly skewed to the right and highly flattened. For glazing type A, the curve is extended over 1000 kWh/(m2-year), while glazing types G and I show well-steeped probability curves in the narrow range (250–500 kWh/(m2-year)) of the source energy consumptions. However, the left tail of the curve can be observed to be extended toward the minimum value of the source energy consumption for glazing E. Also, the correlation of the thermal and optical properties of the glazing type, listed in Table 4, can easily be established with the variation in the source energy consumption. The higher energy consumption values are evident for the higher solar and thermal heat gain because of the higher values of the SHGC and the thermal transmittance (U-value) of the glazing. The deviation in the relationship patterns between the energy consumption and glazing properties (i.e., the SHGC and U-value) indicate a dependency on the other factors too. For instance, a higher value of the glazed façade’s visual transmittance would lead to high illuminance indoors that eventually may produce glare. The exceeded glare limits force the shade deployment on the glazed façade. The deployment of an internal roller shade only controls the illuminance, but the solar and thermal gains are absorbed by the shade material and are eventually transferred to the indoors and lead to higher cooling demand. Also, the blocking of illuminance, sometimes, may require artificial lighting that again increases the cooling demand. Hence, for the functioning of a dynamic glazing system that includes glazing, auto-control shading is very complex, and the effect is complex. Therefore, adequate attention must be given at the design stage of a glazed façade and buildings. Inapt glazing properties and other parameters may lead to the highly inefficient glazed façade office rooms. Hence, depending on the performance matrix (i.e., the total energy consumption, lighting energy consumption, or UDI), the design parameters should be prioritized for selecting their values. For instance, if the total energy consumption is considered as a performance parameter, the size of the glazed component should be the first preference to choose for optimization; the glazing type and aspect ratio should be the second and third choices. Thereafter, depending on the orientation of the glazed façade, the values of the absorptance for the internal surfaces of the roof, floor, and walls should be selected.
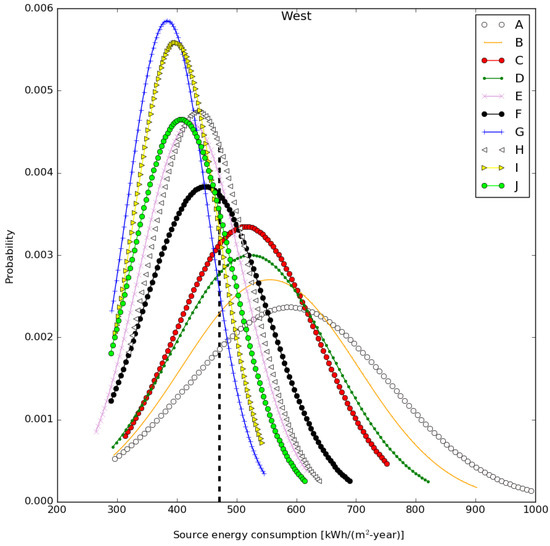
Figure 15.
Distribution of the source energy consumption in office room for different glazing types.
4. Conclusions
The MC-LHS and variance-based extended FAST methods have been used for assessing the uncertainty in the energy and visual performances of the office building and to identify the most influential design parameters in order to reduce uncertainty. The method provides information about the sensitive parameters accurately by searching the entire parameters space. A validated model of the whole-building simulation tool, EnergyPlus, has been used to estimate the performance matrices for a large sample size of eight design parameters of interior roller shade-integrated glazed façade office rooms oriented in four main and four sub-directions in a composite climate.
The estimated values of the performance matrices, i.e., the source energy consumption, lighting energy consumption, UDI, and shade on time fraction, vary in the ranges of approx. 250–1100 kWh/(m2-year), around 15–72 kWh/(m2-year), 0–90%, and 0–0.43, respectively. A significant variation in the matrices was also identified with respect to the façade orientations.
The uncertainties in the source energy and lighting energy consumptions, UDI, and shade-deployment fraction time have been identified as the maximum for the east–south, south, east–south, and north façade offices, respectively, while the minimum is for the north-, south-, north-, and south–west-façade-oriented rooms, respectively. Large uncertainties are evident by the large dispersion in the performance matrices.
Further, the sensitivity analysis shows that both the energy and visual performances (except the shade on time fraction) are most sensitive to the window-to-wall ratio (WWR), irrespective of the façade orientation. For the source energy consumption, the second and third most influential parameters are the Gt and aspect ratio (ASR); however, the shade transmittance (ST) and reflectance (SR) are identified as the least significantly influential. Further, for the shade-deployment time fraction (i.e., the time fraction for which access to the outdoor view is blocked), the glazing type (Gt) has been identified as the most influential parameter. The other parameters that regulate the shade deployment are the WWR, ASR, Aw, and Ar. The results indicate that the order of influence of the design parameters varies with respect to the façade orientation for the other performance matrices too. The variation in the sensitivity indices and the order of influence of the design parameters demand the prudential selection of their values in order to keep the performance matrices in the desirable range.
Inappropriate values of the design parameters may result in over 100–400% energy inefficiency in the overall energy performance, approx. a 3.5–4.5 times higher lighting energy consumption in the office building depending on the orientation of the glazed façade. Further, the indoor visual performance results show extremely poor (UDI below 10%) then desirable conditions (UDI closer to 90%). Also, the view to the outdoors may get blocked undesirably for a larger period of time (shade deployment time over 40% of the office hours). Furthermore, the comparative results indicate that all design values cannot be accepted from an energy performance viewpoint.
Hence, the findings from this study may provide highly useful insights for building designers, owners, policy makers, and other stakeholders in the decision-making process at the early stage of development of energy-efficient and well-daylit interior roller-shade-integrated glazed façade office buildings. However, the applicability of the results is limited to the office building in a composite climate and the glare-based control of the interior roller shade deployment. The order of impact of the design parameters may significantly vary for other climate and building types, shading types, and shade-deployment strategies. Therefore, separate assessments for the indicated deviations are suggested to be performed.
Author Contributions
Conceptualization, R.S. (Ramkishore Singh); methodology, R.S. (Ramkishore Singh); software, R.S. (Rajesh Singh); validation, S.T. (Samar Thapa), S.S. (Shane Sheoran), and A.S. (Atul Sharma); formal analysis, S.T.; investigation, R.S. (Ramkishore Singh); resources, C.P. (Chander Prakash); data curation, R.S. (Ramkishore Singh) and S.T.; writing—original draft preparation, R.S. (Ramkishore Singh); writing—review and editing, C.P., K.K.S. (Kuldeep Kumar Saxena) and R.S. (Rajesh Singh); visualization, R.S. (Ramkishore Singh) and S.S.; supervision, D.B. (Dharam Buddhi); project administration, R.S. (Ramkishore Singh). All authors have read and agreed to the published version of the manuscript.
Funding
This research received no external funding.
Institutional Review Board Statement
Not applicable.
Informed Consent Statement
Not applicable.
Data Availability Statement
Not applicable.
Conflicts of Interest
The authors declare no conflict of interest.
References
- Tan, Y.; Peng, J.; Curcija, D.C.; Hart, R.; Jonsson, J.C.; Selkowitz, S. Parametric study of the impact of window attachments on air conditioning energy consumption. Sol. Energy 2020, 202, 136–143. [Google Scholar] [CrossRef]
- Ulpiani, G. Overheating phenomena induced by fully-glazed façades: Investigation of a sick building in Italy and assessment of the benefits achieved via fuzzy control of the AC system. Sol. Energy 2017, 158, 572–594. [Google Scholar] [CrossRef]
- Ulpiani, G.; Benedettelli, M.; di Perna, C.; Naticchia, B. Overheating phenomena induced by fully-glazed façades: Investigation of a sick building in Italy and assessment of the benefits achieved via model predictive control of the AC system. Sol. Energy 2017, 157, 830–852. [Google Scholar] [CrossRef]
- Singh, R.; Lazarus, I.J.; Kishore, V.V.N. Effect of internal woven roller shade and glazing on the energy and daylighting performances of an office building in the cold climate of Shillong. Appl. Energy 2015, 159, 317–333. [Google Scholar] [CrossRef]
- Feist, W.; Schnieders, J.; Dorer, V.; Haas, A. Re-inventing air heating: Convenient and comfortable within the frame of the Passive House concept. Energy Build. 2005, 37, 1186–1203. [Google Scholar] [CrossRef]
- Saroglou, T.; Theodosiou, T.; Givoni, B.; Meir, I.A. A study of different envelope scenarios towards low carbon high-rise buildings in the Mediterranean climate-can DSF be part of the solution? Renew. Sustain. Energy Rev. 2019, 113, 109237. [Google Scholar] [CrossRef]
- Saroglou, T.; Meir, I.; Theodosiou, T. Quantifying Energy Consumption in Skyscrapers of Various Heights. Procedia Environ. Sci. 2017, 38, 314–321. [Google Scholar] [CrossRef]
- Qian, D.; Li, Y.; Niu, F.; O′Neill, Z. Nationwide savings analysis of energy conservation measures in buildings. Energy Convers. Manag. 2019, 188, 1–18. [Google Scholar] [CrossRef]
- Tian, W.; Song, J.; Li, Z.; de Wilde, P. Bootstrap techniques for sensitivity analysis and model selection in building thermal performance analysis. Appl. Energy 2014, 135, 320–328. [Google Scholar] [CrossRef]
- Singh, R.; Kishore, V.V.N. Introduction to Energy-Efficient Building Development and Sustainability. In Sustainability through Energy-Efficient Buildings, 1st ed.; Shukla, A., Sharma, A., Eds.; CRC Press: Boca Raton, FL, USA, 2018; pp. 1–31. [Google Scholar]
- Patel, N.; Buddhi, D. Analysis on Energy-Efficient HVAC System for Buildings BT-Recent Trends in Thermal Engineering; Kumar, R., Pandey, A.K., Sharma, R.K., Norkey, G., Eds.; Springer: Singapore, 2022; pp. 213–218. [Google Scholar]
- Arnaoutakis, G.E.; Katsaprakakis, D.A. Energy Performance of Buildings with Thermochromic Windows in Mediterranean Climates. Energies 2021, 14, 6977. [Google Scholar] [CrossRef]
- Fathi, S.; Kavoosi, A. Effect of electrochromic windows on energy consumption of high-rise office buildings in different climate regions of Iran. Sol. Energy 2021, 223, 132–149. [Google Scholar] [CrossRef]
- Saroglou, T.; Theodosiou, T.; Givoni, B.; Meir, I.A. Studies on the optimum double-skin curtain wall design for high-rise buildings in the Mediterranean climate. Energy Build. 2020, 208, 109641. [Google Scholar] [CrossRef]
- Xamán, J.; Pérez-Nucamendi, C.; Arce, J.; Hinojosa, J.; Álvarez, G.; Zavala-Guillén, I. Thermal analysis for a double pane window with a solar control film for using in cold and warm climates. Energy Build. 2014, 76, 429–439. [Google Scholar] [CrossRef]
- Rodriguez-Ake, A.; Xamán, J.; Hernández-López, I.; Sauceda, D.; Carranza-Chávez, F.J.; Zavala-Guillén, I. Numerical study and thermal evaluation of a triple glass window under Mexican warm climate conditions. Energy 2021, 239, 122075. [Google Scholar] [CrossRef]
- Joshi, M.; Buddhi, D.; Singh, R. Effect of overhang shade on the solar heat gain through window in composite climate in Mid-Westtern India. J. Sci. Ind. Res. 2022, 81, 3906. [Google Scholar]
- Singh, R.; Lazarus, I.J. Energy and daylighting performances of highly glazed buildings. In Proceedings of the 14th International Conference of IBPSA-Building Simulation, Hyderabad, India, 7–9 December 2015. [Google Scholar]
- Moghtadernejad, S.; Chouinard, L.E.; Mirza, M.S. Multi-criteria decision-making methods for preliminary design of sustainable facades. J. Build. Eng. 2018, 19, 181–190. [Google Scholar] [CrossRef]
- Singh, R.; Buddhi, D.; Vatin, N.I.; Prakash, C.; Dixit, S.; Khera, G.S.; Solovev, S.A.; Ilyashenko, S.B.; John, V. Life Cycle Saving Analysis of an Earth-Coupled Building without and with Roof Evaporative Cooling for Energy Efficient Potato Storage Application. Energies 2022, 15, 4076. [Google Scholar] [CrossRef]
- Iken, O.; Fertahi, S.E.-D.; Dlimi, M.; Agounoun, R.; Kadiri, I.; Sbai, K. Thermal and energy performance investigation of a smart double skin facade integrating vanadium dioxide through CFD simulations. Energy Convers. Manag. 2019, 195, 650–671. [Google Scholar] [CrossRef]
- Cuce, E.; Young, C.-H.; Riffat, S.B. Thermal performance investigation of heat insulation solar glass: A comparative experimental study. Energy Build. 2015, 86, 595–600. [Google Scholar] [CrossRef]
- Cuce, E.; Riffat, S.B. A state-of-the-art review on innovative glazing technologies. Renew. Sustain. Energy Rev. 2015, 41, 695–714. [Google Scholar] [CrossRef]
- Kumar, A.; Sharma, S.; Goyal, N.; Singh, A.; Cheng, X.; Singh, P. Secure and energy-efficient smart building architecture with emerging technology IoT. Comput. Commun. 2021, 176, 207–217. [Google Scholar] [CrossRef]
- Gomes, M.D.G.; Santos, A.; Rodrigues, A.M. Solar and visible optical properties of glazing systems with venetian blinds: Numerical, experimental and blind control study. Build. Environ. 2014, 71, 47–59. [Google Scholar] [CrossRef]
- Shen, H.; Tzempelikos, A. Sensitivity analysis on daylighting and energy performance of perimeter offices with automated shading. Build. Environ. 2013, 59, 303–314. [Google Scholar] [CrossRef]
- Frontini, F.; Kuhn, T.E. The influence of various internal blinds on thermal comfort: A new method for calculating the mean radiant temperature in office spaces. Energy Build. 2012, 54, 527–533. [Google Scholar] [CrossRef]
- Tzempelikos, A.; Athienitis, A.K. The impact of shading design and control on building cooling and lighting demand. Sol. Energy 2007, 81, 369–382. [Google Scholar] [CrossRef]
- Al Touma, A.; Ouahrani, D. Shading and day-lighting controls energy savings in offices with fully-Glazed façades in hot climates. Energy Build. 2017, 151, 263–274. [Google Scholar] [CrossRef]
- Grynning, S.; Time, B.; Matusiak, B. Solar shading control strategies in cold climates-Heating, cooling demand and daylight availability in office spaces. Sol. Energy 2014, 107, 182–194. [Google Scholar] [CrossRef]
- Tzempelikos, A.; Shen, H. Comparative control strategies for roller shades with respect to daylighting and energy performance. Build. Environment 2013, 67, 179–192. [Google Scholar] [CrossRef]
- Garcia, D.D.L.R.; Pereira, F.O.R. Method application and analyses of visual and thermal-energy performance prediction in offices buildings with internal shading devices. Build. Environ. 2021, 198, 107912. [Google Scholar] [CrossRef]
- Shen, H.; Tzempelikos, A. Daylighting and energy analysis of private offices with automated interior roller shades. Sol. Energy 2012, 86, 681–704. [Google Scholar] [CrossRef]
- Liu, M.; Wittchen, K.B.; Heiselberg, P.K. Development of a simplified method for intelligent glazed façade design under different control strategies and verified by building simulation tool BSim. Build. Environ. 2014, 74, 31–38. [Google Scholar] [CrossRef]
- Bellia, L.; De Falco, F.; Minichiello, F. Effects of solar shading devices on energy requirements of standalone office buildings for Italian climates. Appl. Therm. Eng. 2013, 54, 190–201. [Google Scholar] [CrossRef]
- Sanati, L.; Utzinger, M. The effect of window shading design on occupant use of blinds and electric lighting. Build. Environ. 2013, 64, 67–76. [Google Scholar] [CrossRef]
- Wang, R.; Lu, S.; Feng, W. Impact of adjustment strategies on building design process in different climates oriented by multiple performance. Appl. Energy 2020, 266, 114822. [Google Scholar] [CrossRef]
- Mechri, H.E.; Capozzoli, A.; Corrado, V. USE of the ANOVA approach for sensitive building energy design. Appl. Energy 2010, 87, 3073–3083. [Google Scholar] [CrossRef]
- Zhu, L.; Zhang, J.; Gao, Y.; Tian, W.; Yan, Z.; Ye, X.; Sun, Y.; Wu, C. Uncertainty and sensitivity analysis of cooling and heating loads for building energy planning. J. Build. Eng. 2021, 45, 103440. [Google Scholar] [CrossRef]
- Heiselberg, P.; Brohus, H.; Hesselholt, A.; Rasmussen, H.; Seinre, E.; Thomas, S. Application of sensitivity analysis in design of sustainable buildings. Renew. Energy 2009, 34, 2030–2036. [Google Scholar] [CrossRef]
- Yu, W.; Harris, T. Parameter uncertainty effects on variance-based sensitivity analysis. Reliab. Eng. Syst. Saf. 2009, 94, 596–603. [Google Scholar] [CrossRef]
- Tomlin, A.S. The use of global uncertainty methods for the evaluation of combustion mechanisms. Reliab. Eng. Syst. Saf. 2006, 91, 1219–1231. [Google Scholar] [CrossRef]
- Saltelli, A.; Andres, T.; Homma, T. Sensitivity analysis of model output. Performance of the iterated fractional factorial design method. Comput. Stat. Data Anal. 1995, 20, 387–407. [Google Scholar] [CrossRef]
- Kannan, R. Uncertainties in key low carbon power generation technologies – Implication for UK decarbonisation targets. Appl. Energy 2009, 86, 1873–1886. [Google Scholar] [CrossRef]
- De Wit, S.; Augenbroe, G. Analysis of uncertainty in building design evaluations and its implications. Energy Build. 2002, 34, 951–958. [Google Scholar] [CrossRef]
- Aliberti, G.; Palmiotti, G.; Salvatores, M.; Kim, T.; Taiwo, T.; Anitescu, M.; Kodeli, I.; Sartori, E.; Bosq, J.; Tommasi, J. Nuclear data sensitivity, uncertainty and target accuracy assessment for future nuclear systems. Ann. Nucl. Energy 2006, 33, 700–733. [Google Scholar] [CrossRef]
- Tian, W.; De Wilde, P. Uncertainty and sensitivity analysis of building performance using probabilistic climate projections: A UK case study. Autom. Constr. 2011, 20, 1096–1109. [Google Scholar] [CrossRef]
- Morris, M.D. Factorial Sampling Plans for Preliminary Computational Experiments. Technometrics 1991, 33, 161–174. [Google Scholar] [CrossRef]
- Saltelli, A.; Ratto, M.; Andres, T.; Campolongo, F.; Cariboni, J.; Gatelli, D.; Saisana, M. Global Sensitivity Analysis. The Primer, 1st ed.; John Wiley & Sons: London, UK, 2004. [Google Scholar]
- Bettonvil, B.; Kleijnen, J.P. Searching for important factors in simulation models with many factors: Sequential bifurcation. Eur. J. Oper. Res. 1997, 96, 180–194. [Google Scholar] [CrossRef]
- Fürbringer, J.-M.; Roulet, C. Comparison and combination of factorial and Monte-Carlo design in sensitivity analysis. Build. Environ. 1995, 30, 505–519. [Google Scholar] [CrossRef]
- Saltelli, A.; Tarantola, S.; Compolongo, F.; Ratto, M. Sensitivity Analysis in Practice: A Guide to Assessing Scientific Models; John Wiley & Sons: London, UK, 2004. [Google Scholar]
- Tian, W. A review of sensitivity analysis methods in building energy analysis. Renew. Sustain. Energy Rev. 2013, 20, 411–419. [Google Scholar] [CrossRef]
- Kottek, M.; Grieser, J.; Beck, C.; Rudolf, B.; Rubel, F. World map of the Köppen-Geiger climate classification updated. Meteorol. Z. 2006, 15, 259–263. [Google Scholar] [CrossRef]
- Wang, R.; Lu, S.; Feng, W. A three-stage optimization methodology for envelope design of passive house considering energy demand, thermal comfort and cost. Energy 2020, 192, 116723. [Google Scholar] [CrossRef]
- Mckay, M.D.; Beckman, R.J.; Conover, W.J. A comparison of three methods of selecting values of input variables in the analysis of output from a computer code. Technometrics 1979, 21, 239–245. [Google Scholar]
- JRC. Joint Research Center; European Commission: Brussels, Belgium, 2008. [Google Scholar]
- Saltelli, A.; Tarantola, S.; Chan, K.P.-S. A Quantitative Model-Independent Method for Global Sensitivity Analysis of Model Output. Technometrics 1999, 41, 39–56. [Google Scholar] [CrossRef]
- Cukier, R.I.; Levine, H.B.; Shuler, K.E. Nonlinear sensitivity analysis of multiparameter model systems. J. Comput. Phys. 1978, 26, 1–42. [Google Scholar] [CrossRef]
- EnergyPlus. 2015. Available online: www.eere.energy.gov/buildings/energyplus (accessed on 5 September 2021).
- Fumo, N.; Mago, P.; Luck, R. Methodology to estimate building energy consumption using EnergyPlus Benchmark Models. Energy Build. 2010, 42, 2331–2337. [Google Scholar] [CrossRef]
- Bojić, M.; Djordjević, S.; Malesević, J.; Miletić, M.; Cvetković, D. A simulation appraisal of a switch of district to electric heating due to increased heat efficiency in an office building. Energy Build. 2012, 50, 324–330. [Google Scholar] [CrossRef]
- Seo, D.; Ihm, P.; Krarti, M. Development of an optimal daylighting controller. Build. Environ. 2011, 46, 1011–1022. [Google Scholar] [CrossRef]
- EnergyPlus. EnergyPlus Engineering Reference; The US Department of Energy: Washington, DC, USA, 2013. [Google Scholar]
- Ramos, G.; Ghisi, E. Analysis of daylight calculated using the EnergyPlus programme. Renew. Sustain. Energy Rev. 2010, 14, 1948–1958. [Google Scholar] [CrossRef]
- Perez, R.; Pierre, I.; Seals, R.; Michalsky, J. Modeling daylight availability and irradiance components from direct and global irradiance. Sol. Energy 1990, 44, 271–289. [Google Scholar] [CrossRef]
- Zhang, Y.; Korolija, I. Performing complex parametric simulations with jEPlus. In Proceedings of the SET2010-9th International Conference on Sustainable Energy Technologies, Shanghai, China, 24–27 August 2010. [Google Scholar]
- Winkelmann, F.C. Daylighting Calculation in DOE-2. Lawrence Berkeley Laboratory, University of California: Berkeley, CA, USA, 1983. [Google Scholar]
- ISO 15099:2003 Thermal performance of windows, doors and shading devices—Detailed calculations. Available online: https://www.iso.org/standard/26425.html (accessed on 10 October 2021).
- BIS. Available online: https://www.bis.gov.in/index.php/standards/technical-department/national-building-code/ (accessed on 10 October 2021).
- Lawrie; Linda, K.; Crawley, D.B. Development of Global Typical Meteorological Years (TMYx). Available online: http://climate.onebuilding.org (accessed on 12 October 2022).
- ECBC. Energy Conservation Building Code: User Guide; Bureau of Energy Efficiency: New Delhi, India, 2009. [Google Scholar]
- Liu, M.; Bjarne, K.; Kvols, P. Control strategies for intelligent glazed façade and their influence on energy and comfort performance of office buildings in Denmark. Appl. Energy 2015, 145, 43–51. [Google Scholar] [CrossRef]
- Li, D.H.W.; Cheung, K.L.; Wong, S.L.; Lam, T.N.T. An analysis of energy-efficient light fittings and lighting controls. Appl. Energy 2010, 87, 558–567. [Google Scholar] [CrossRef]
- Doulos, L.; Tsangrassoulis, A.; Topalis, F. Quantifying energy savings in daylight responsive systems: The role of dimming electronic ballasts. Energy Build. 2008, 40, 36–50. [Google Scholar] [CrossRef]
- Piccolo, A.; Simone, F. Effect of switchable glazing on discomfort glare from windows. Energy Build. 2009, 44, 1171–1180. [Google Scholar] [CrossRef]
- Hopkinson, R.G. Glare from Daylighting in Buildings. Appl. Ergon. 1972, 3, 206. [Google Scholar] [CrossRef]
- Tulsyan, A.; Dhaka, S.; Mathur, J.; Yadav, J.V. Potential of energy savings through implementation of Energy Conservation Building Code in Jaipur city, India. Energy Build. 2013, 58, 123–130. [Google Scholar] [CrossRef]
- Tian, C.; Chen, T.; Yang, H.; Chung, T. A generalized window energy rating system for typical office buildings. Sol. Energy 2010, 84, 1232–1243. [Google Scholar] [CrossRef]
- Hee, W.J.; Alghoul, M.A.; Bakhtyar, B.; Elayeb, O.; Shameri, M.A.; Alrubaih, M.S.; Sopian, K. The role of window glazing on daylighting and energy saving in buildings. Renew. Sustain. Energy Rev. 2015, 42, 323–343. [Google Scholar] [CrossRef]
- Tzempelikos, A.; Athienitis, A.K.; Karava, P. Simulation of façade and envelope design options for a new institutional building. Sol. Energy 2007, 81, 1088–1103. [Google Scholar] [CrossRef]
- Motuziene, V.; Juodis, E.S. Simulation based complex energy assessment of office building fenestration. J. Civ. Eng. Manag. 2010, 16, 345–351. [Google Scholar] [CrossRef]
- Berkeley Lab WINDOW 6. Available online: https://windows.lbl.gov/software/window (accessed on 10 January 2018).
- Singh, R.; Lazarus, I.J.; Kishore, V.V.N. Uncertainty and sensitivity analyses of energy and visual performances of office building with external venetian blind shading in hot-dry climate. Appl. Energy 2016, 184, 155–170. [Google Scholar] [CrossRef]
- Nabil, A.; Mardaljevic, J. Useful daylight illuminances: A replacement for daylight factors. Energy Build. 2006, 38, 905–913. [Google Scholar] [CrossRef]
- Chan, Y.-C.; Tzempelikos, A.; Konstantzos, I. A systematic method for selecting roller shade properties for glare protection. Energy Build. 2015, 92, 81–94. [Google Scholar] [CrossRef]
Publisher’s Note: MDPI stays neutral with regard to jurisdictional claims in published maps and institutional affiliations. |
© 2022 by the authors. Licensee MDPI, Basel, Switzerland. This article is an open access article distributed under the terms and conditions of the Creative Commons Attribution (CC BY) license (https://creativecommons.org/licenses/by/4.0/).