
Flash Flood Hazard Mapping Using Remote Sensing and GIS Techniques in Southwestern Saudi Arabia


Abstract
1. Introduction
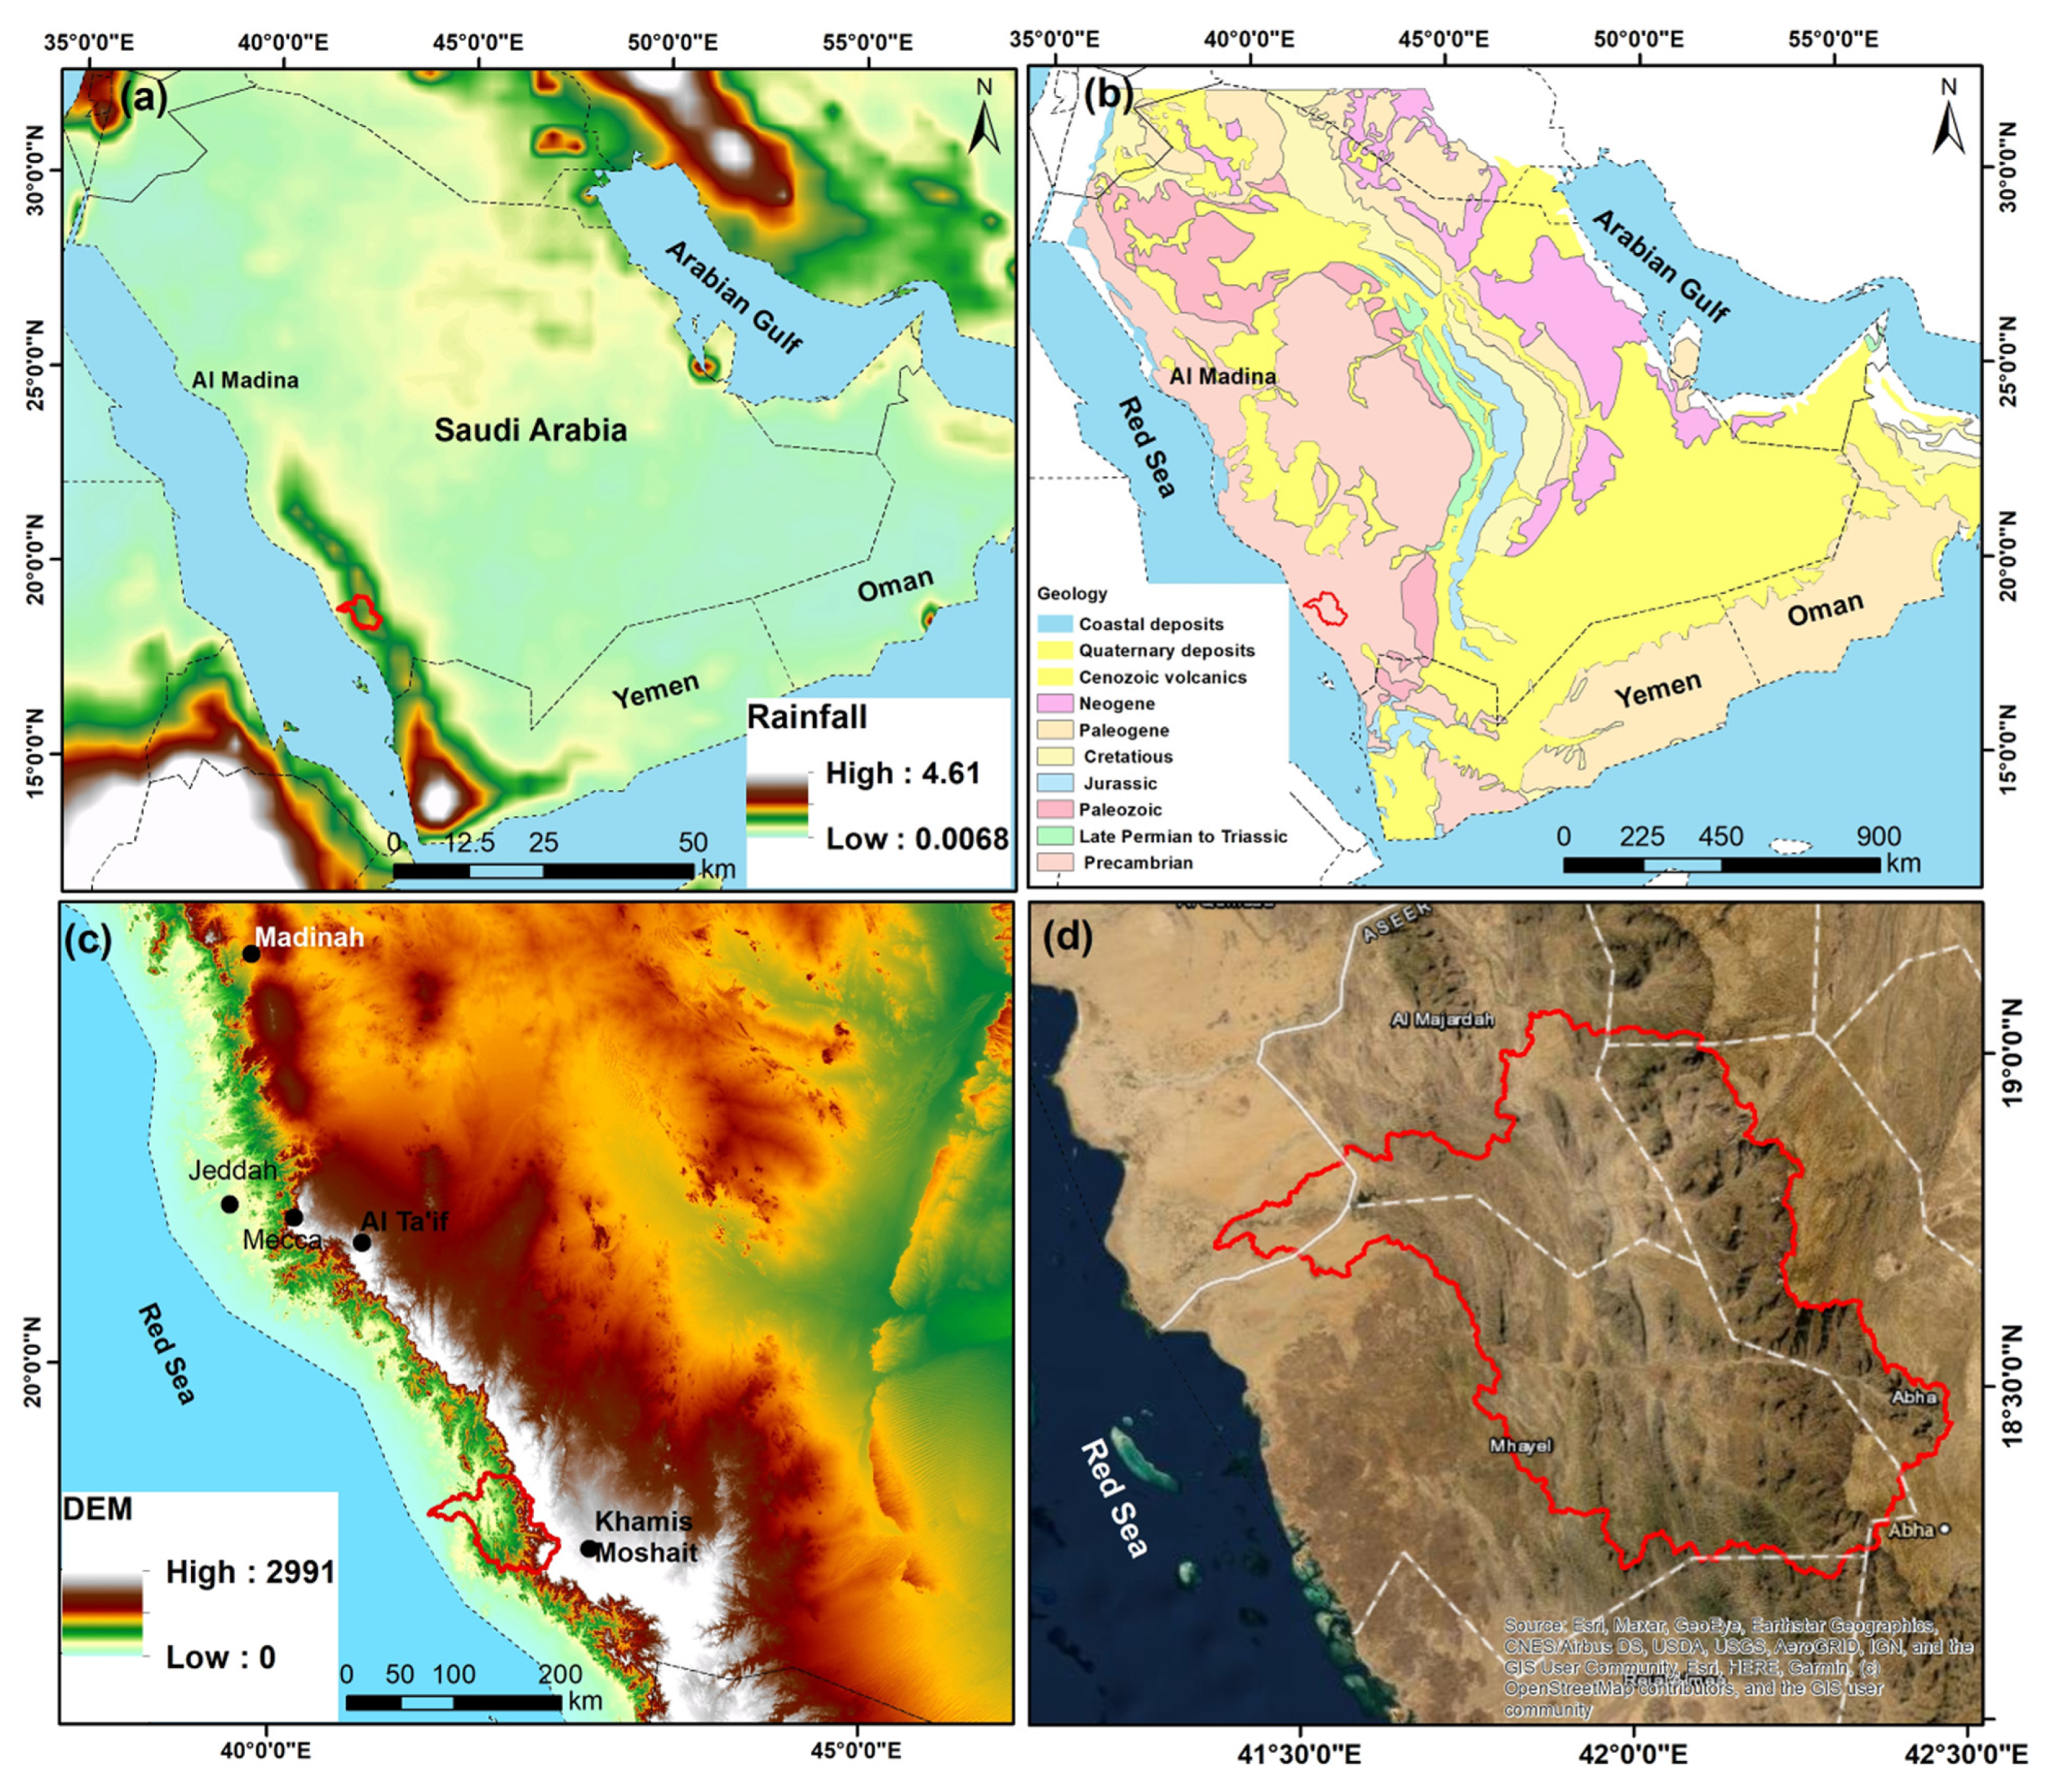
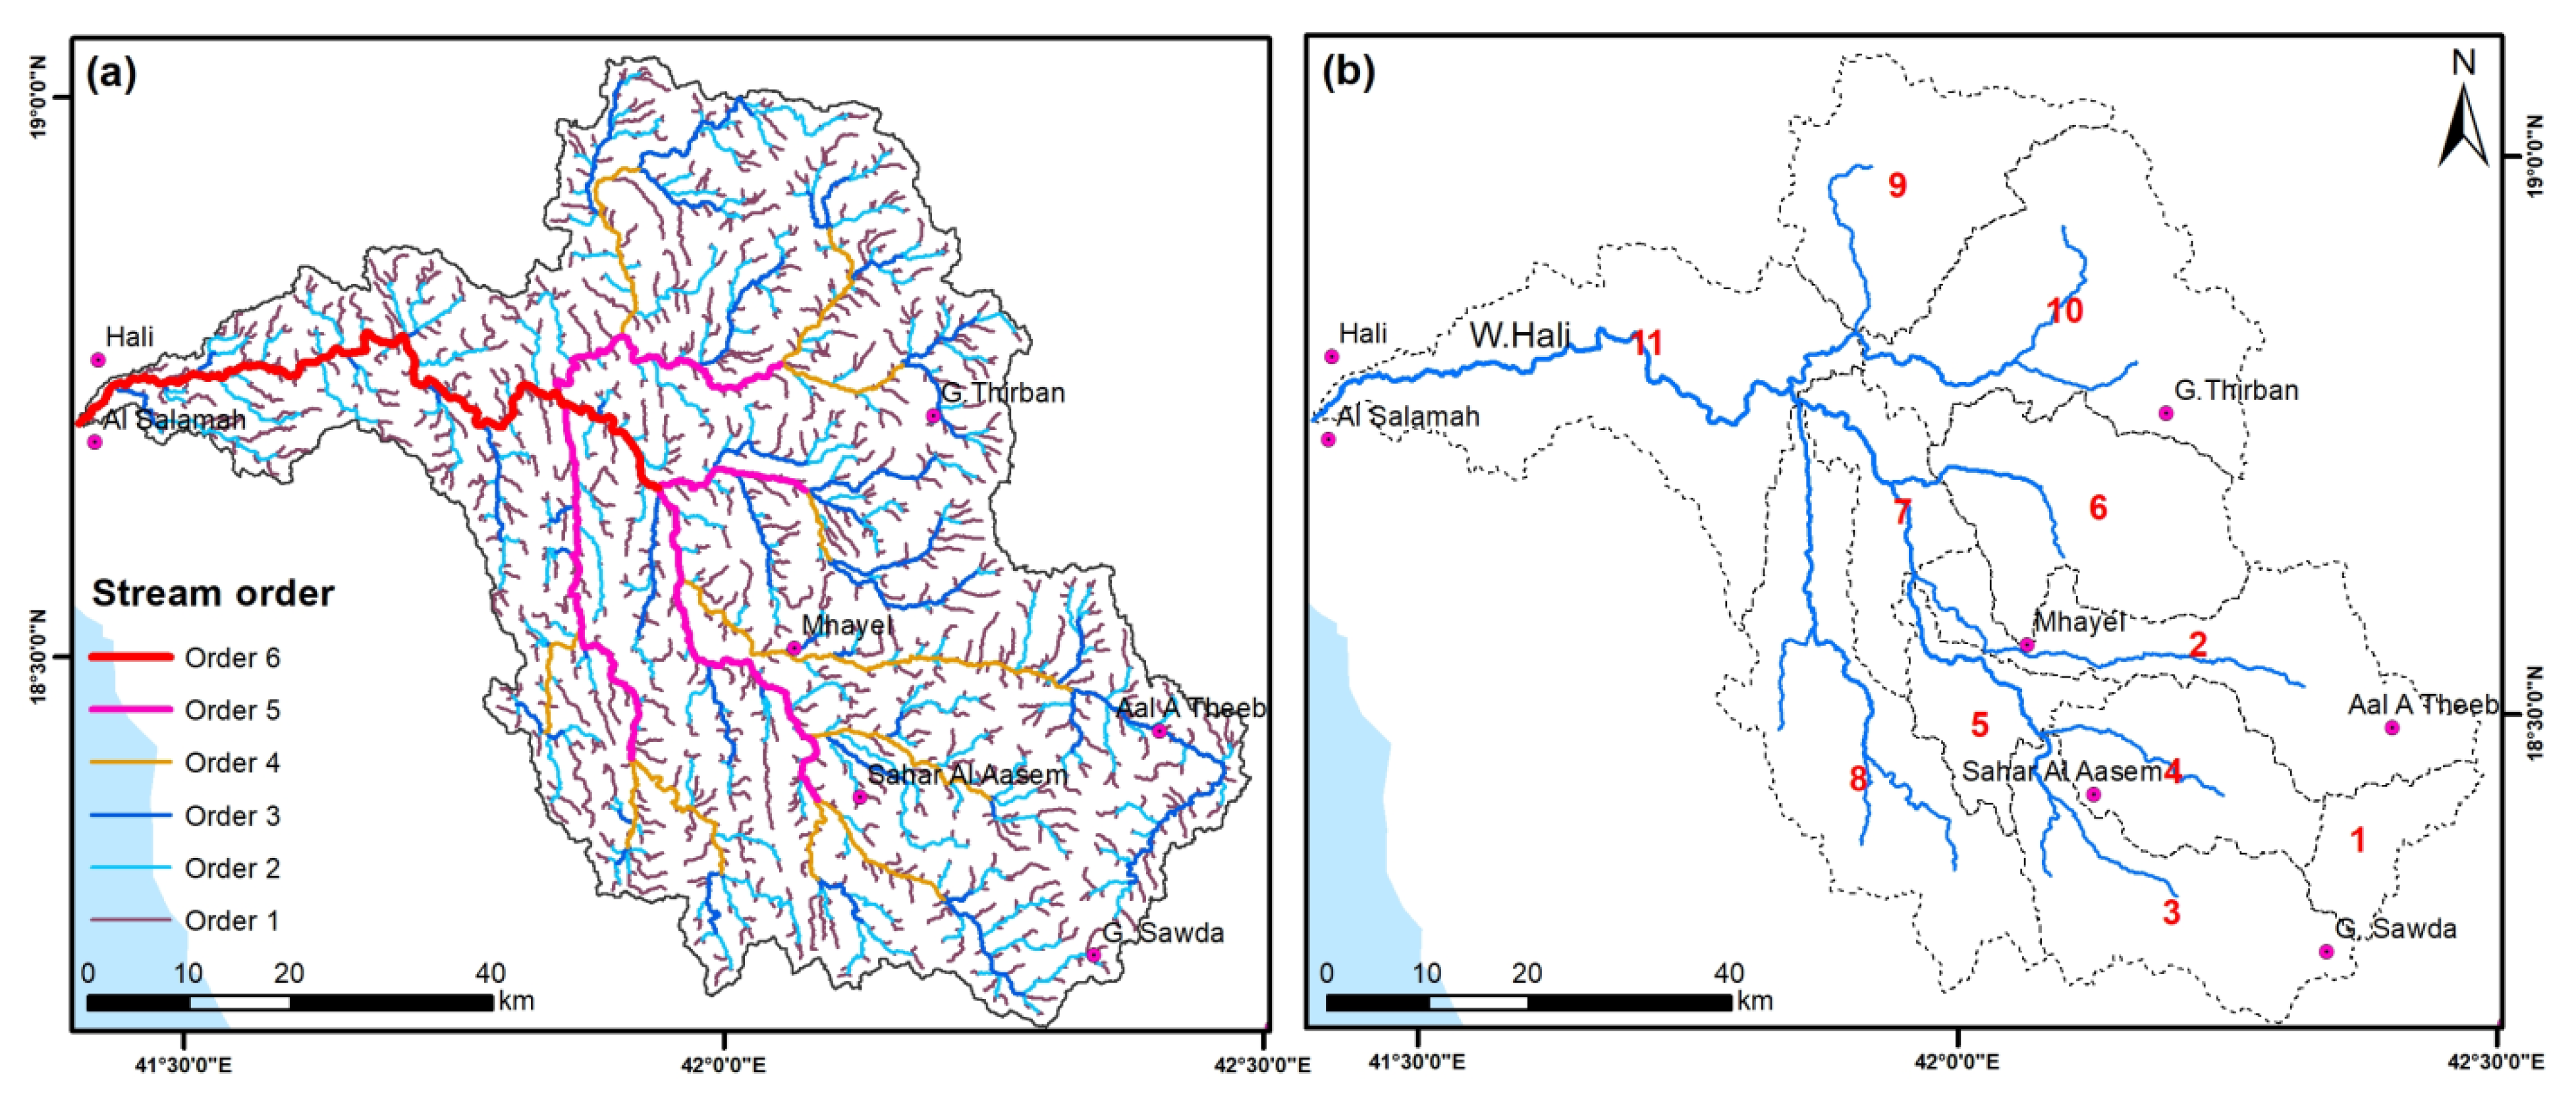
2. Study Area
3. Data Used and Methods
4. Results
4.1. Factors Influencing Flash Flood Hazards
4.1.1. Elevation
4.1.2. Slope
4.1.3. Surface Curvature
4.1.4. Topographic Wetness Factor (TWI)
4.1.5. Stream Power Index (SPI)
4.1.6. Rainfall Intensity
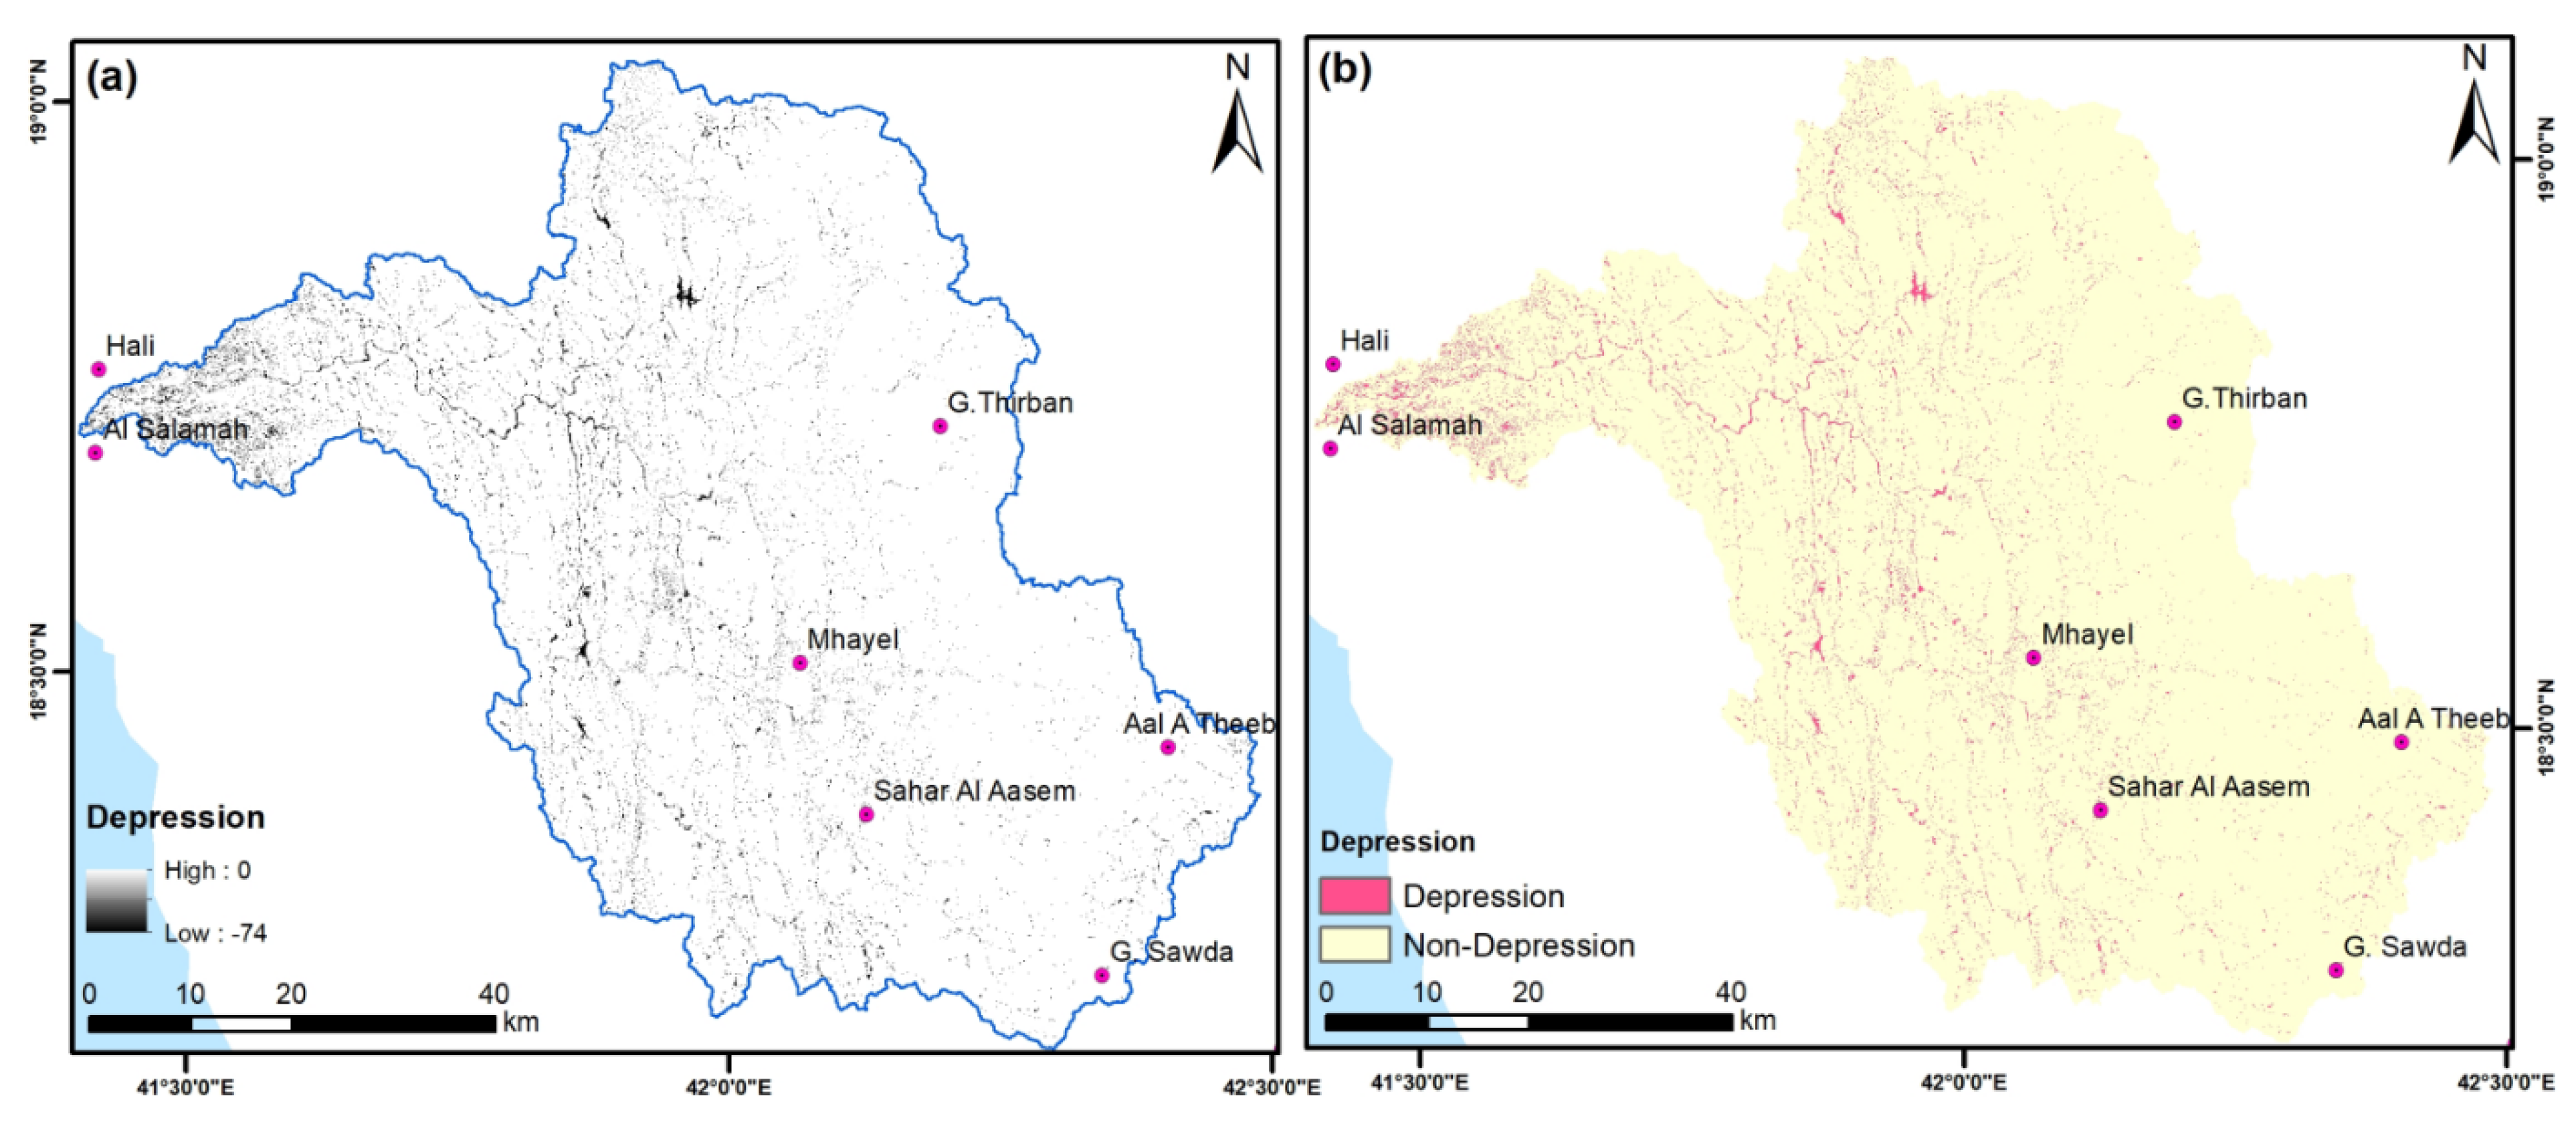
4.1.7. Depressions
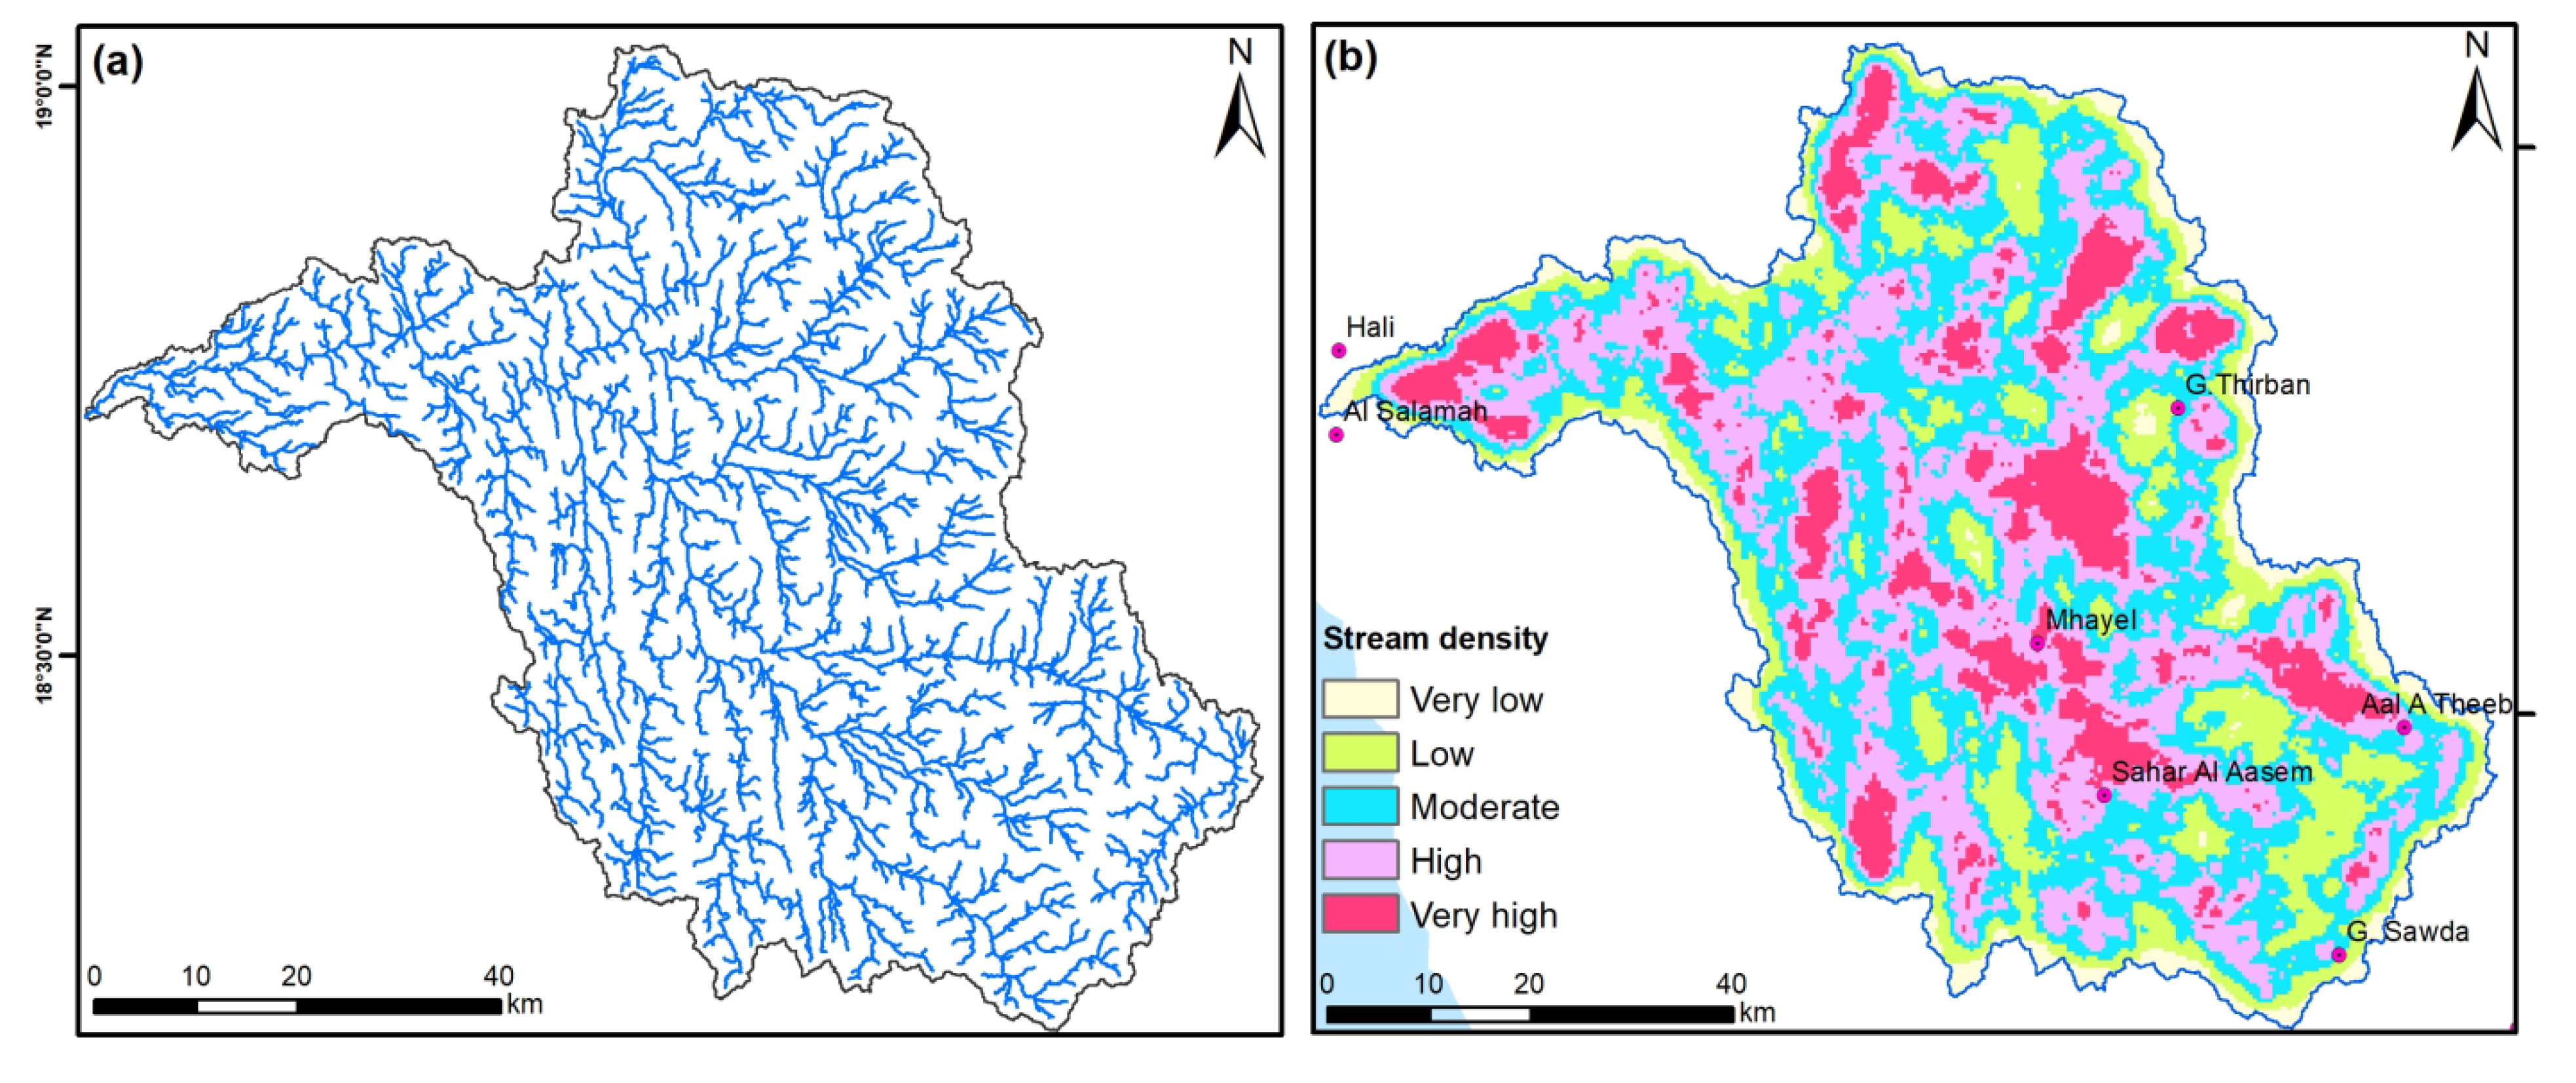
4.1.8. Drainage Density
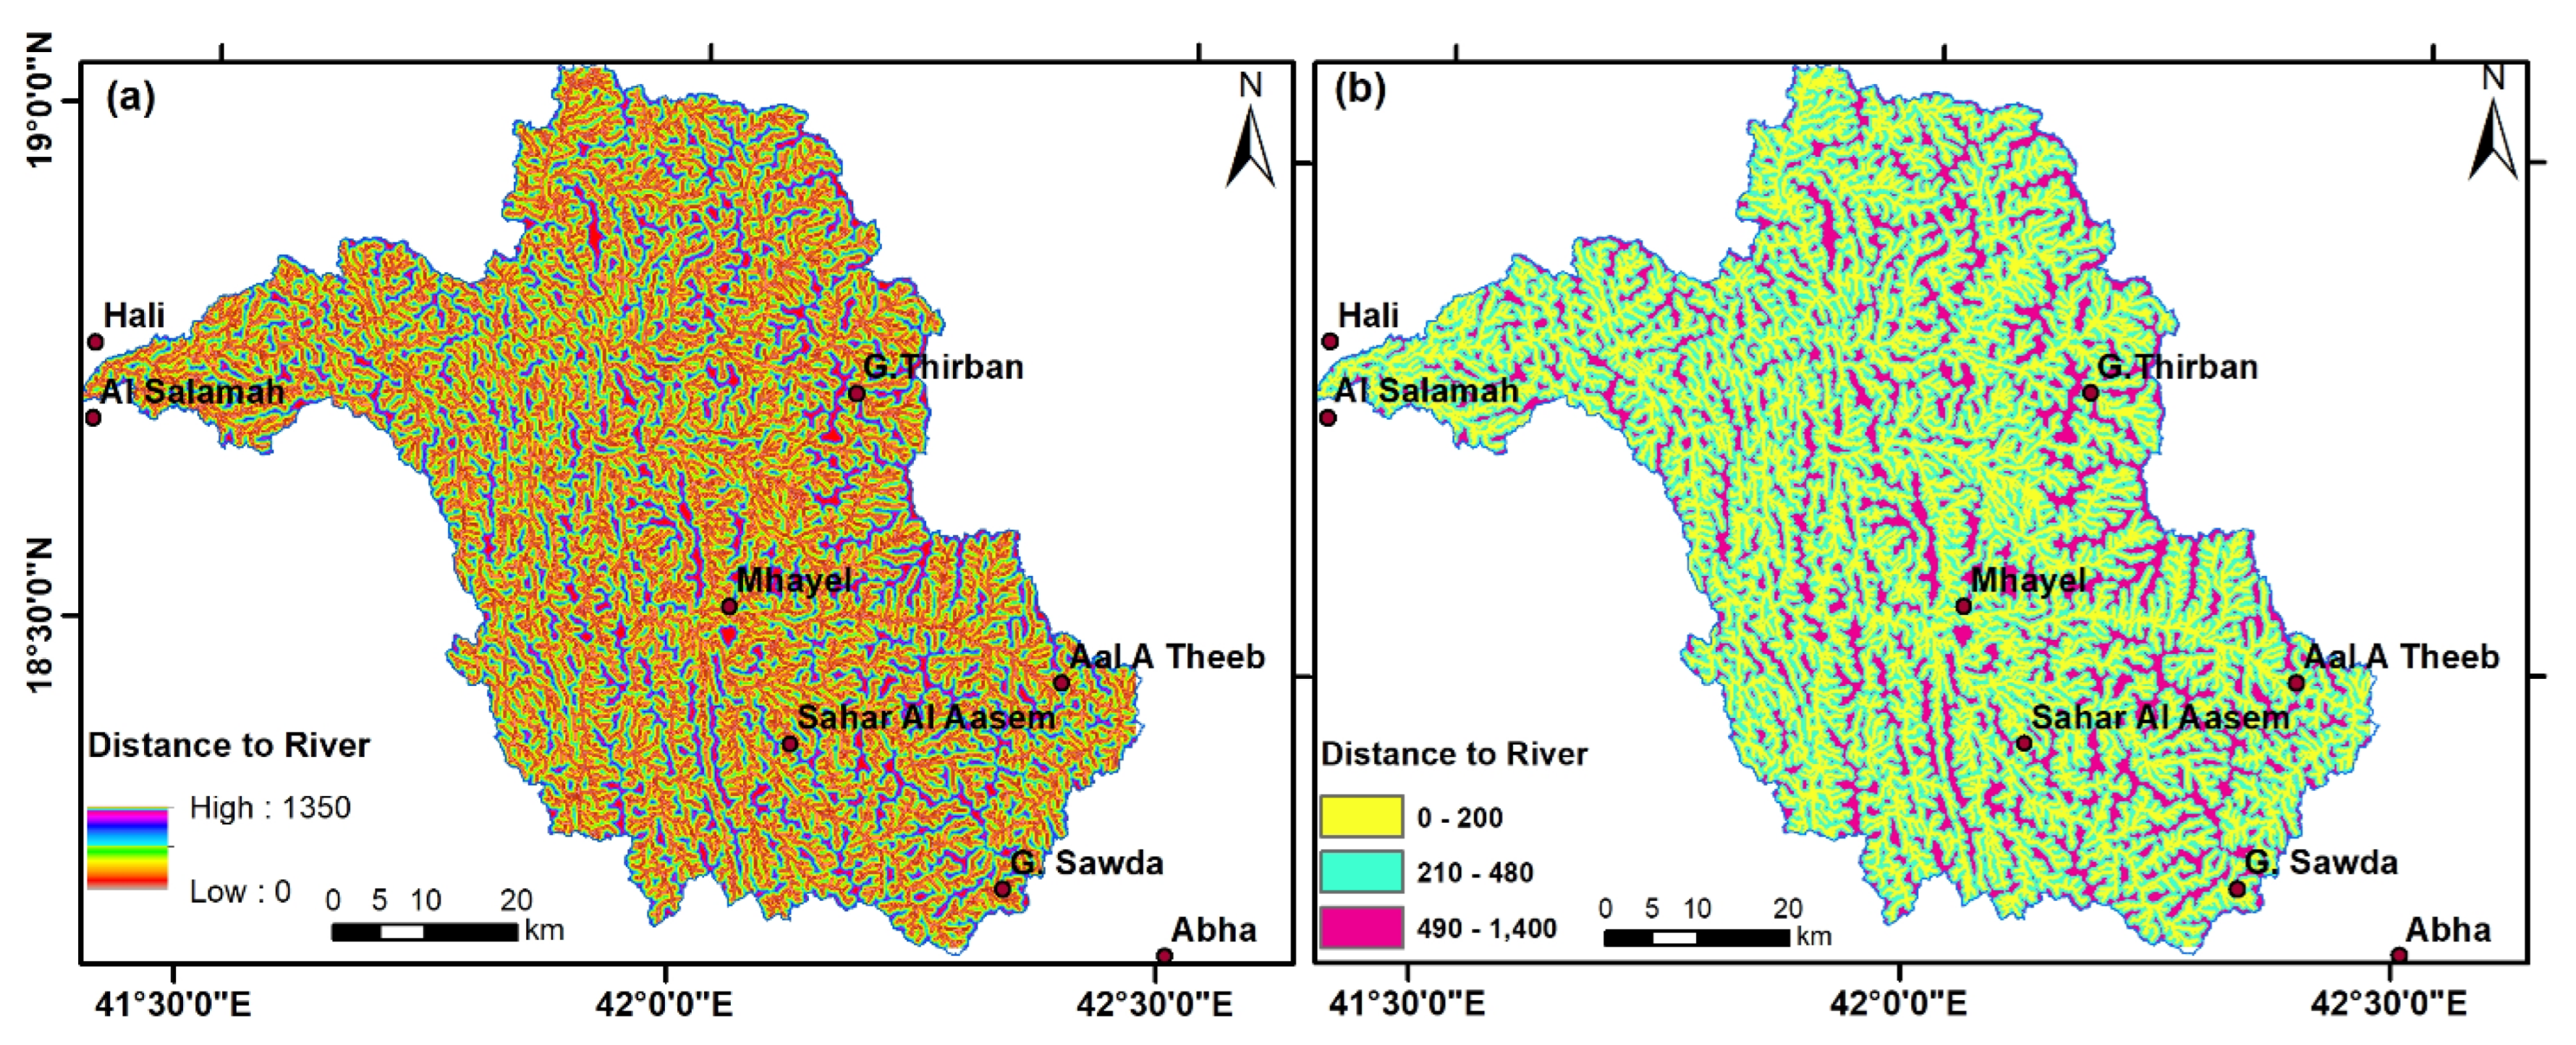
4.1.9. Distance to River
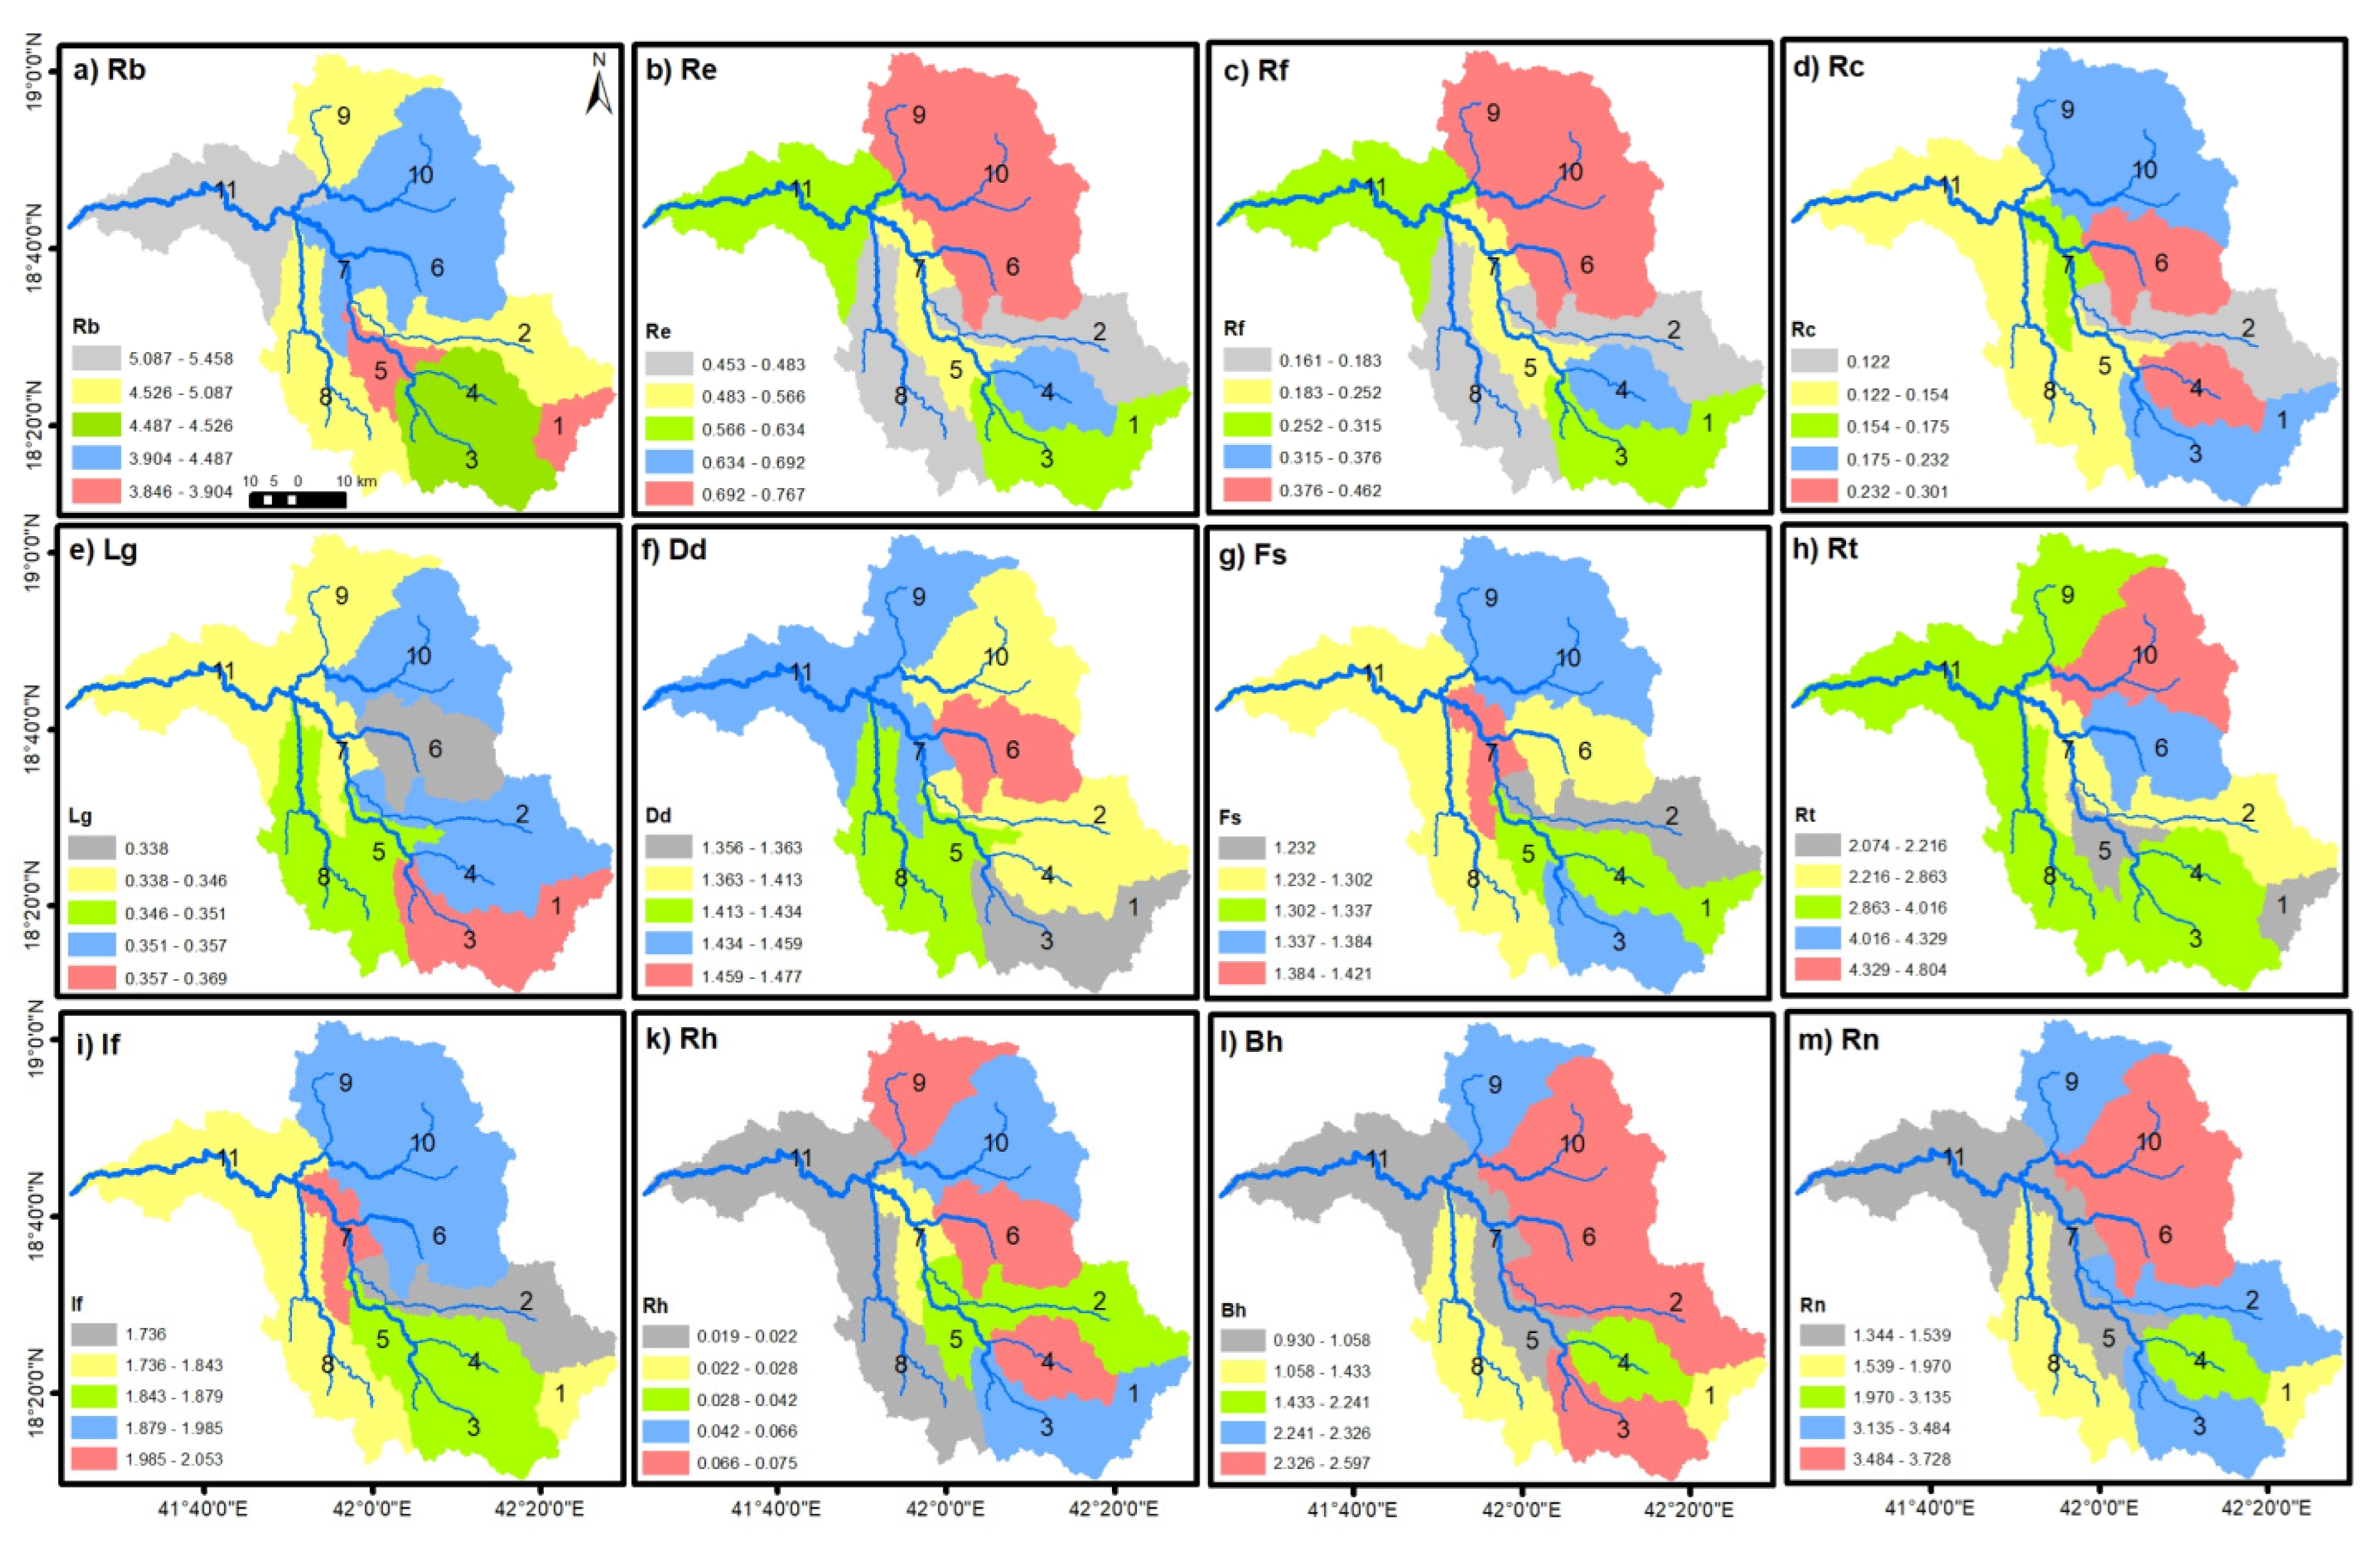
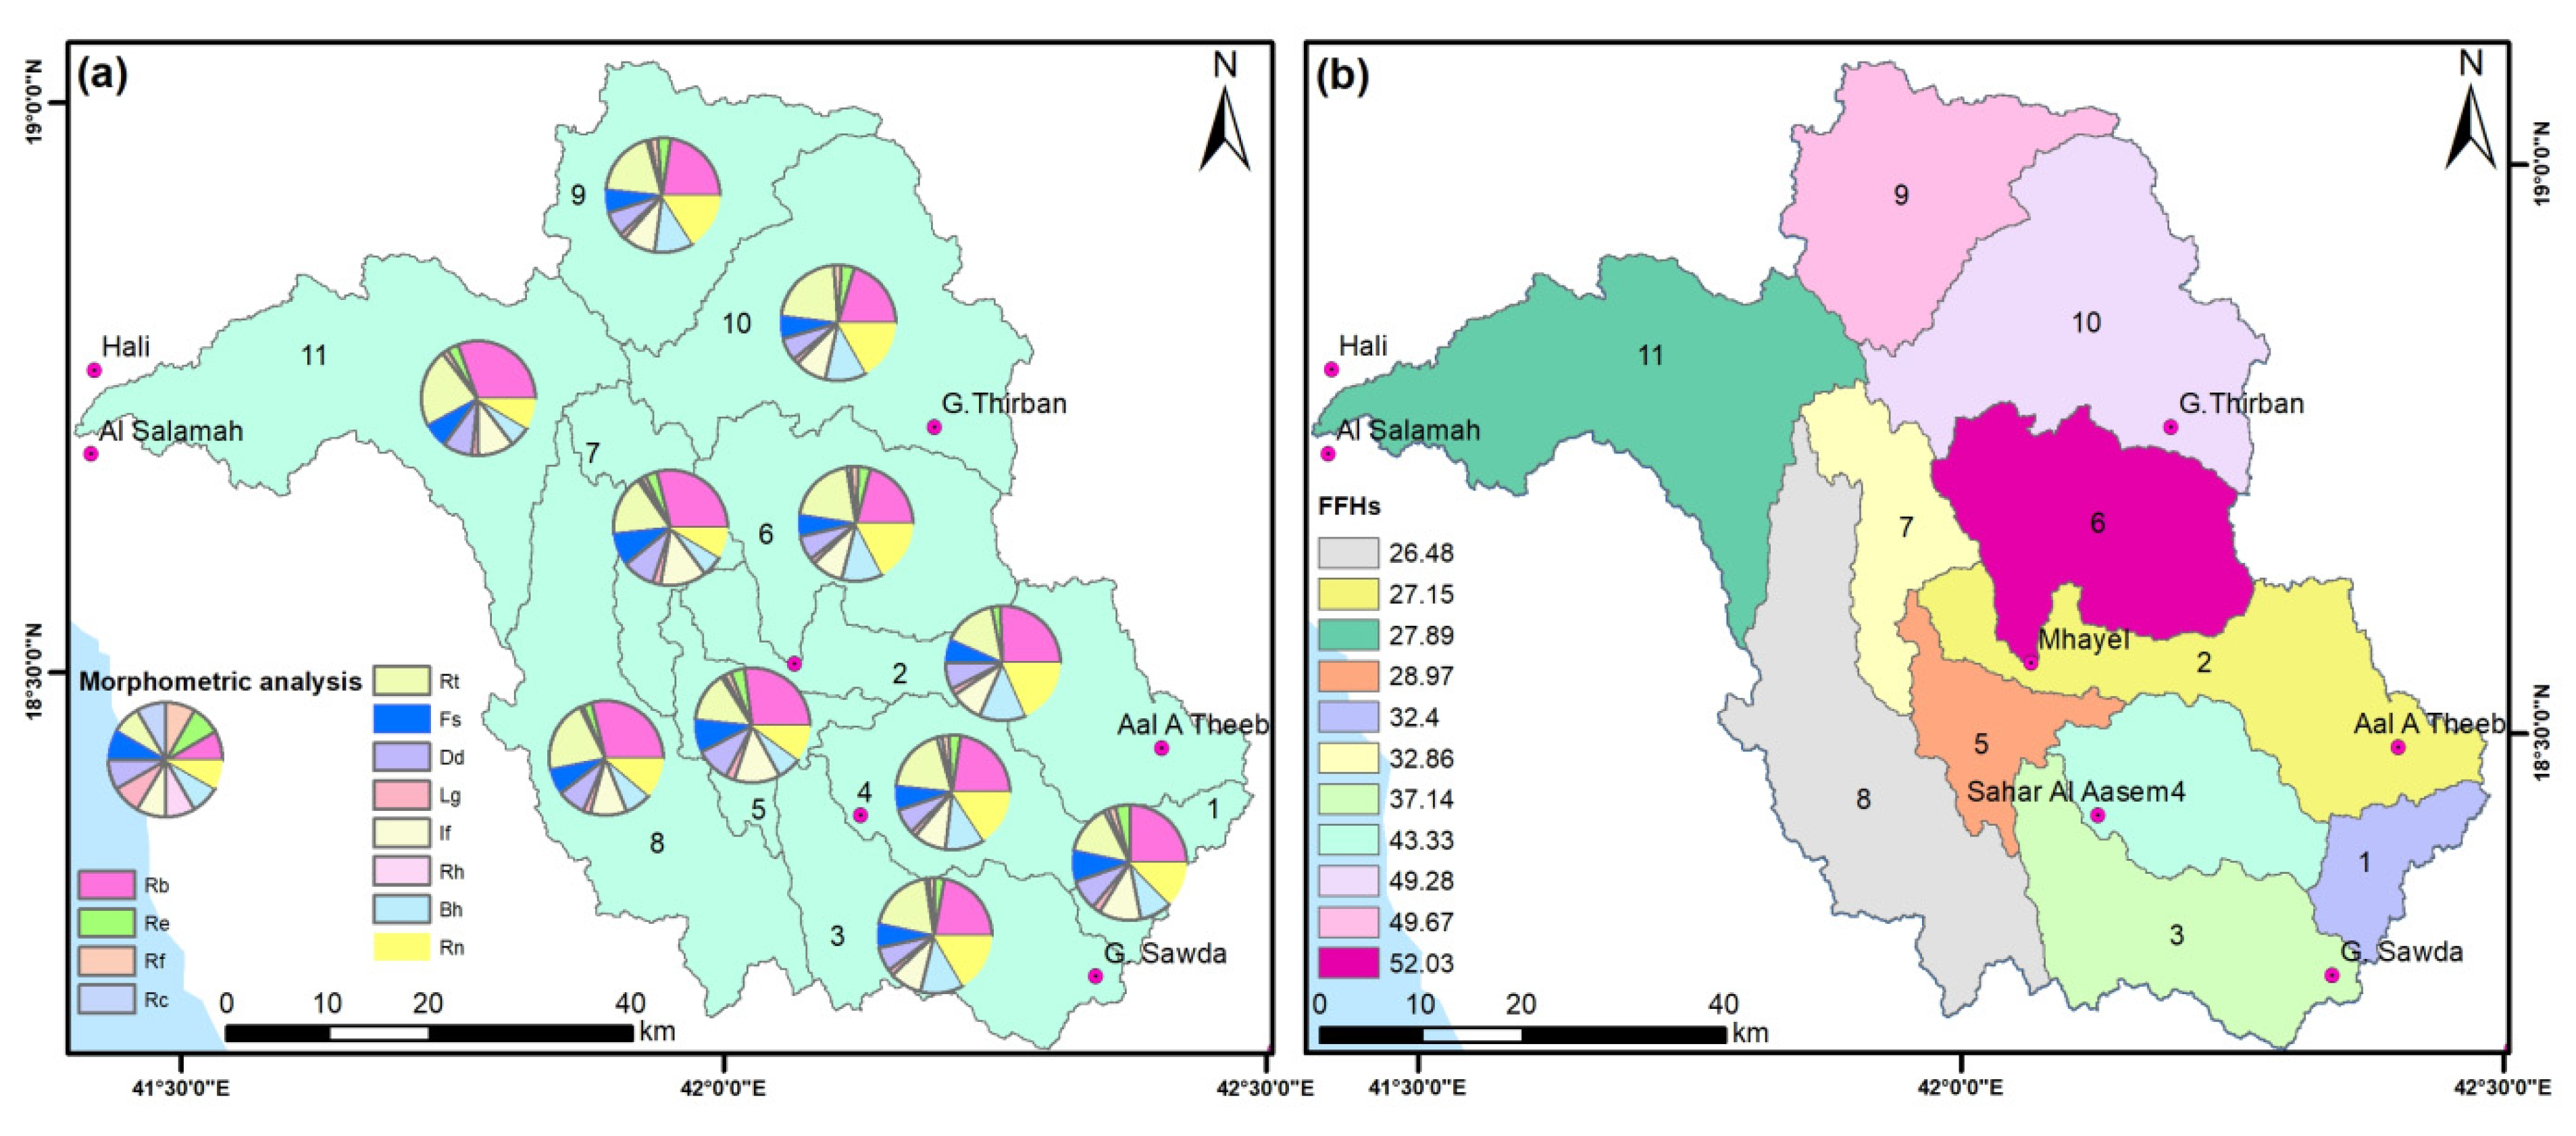
4.1.10. Runoff-Based Morphometric Characteristics
5. Flash Flood Hazard Map
6. Discussion
7. Conclusions
Author Contributions
Funding
Institutional Review Board Statement
Informed Consent Statement
Acknowledgments
Conflicts of Interest
References
- Schanze, J. Food Risk Management—A Basic Framework. In Flood Risk Management: Hazards, Vulnerability and Mitigation Measures; Schanze, J., Zeman, E., Marsalek, J., Eds.; Springer: Berlin/Heidelberg, Germany, 2006; pp. 1–20. [Google Scholar]
- Şen, Z.; Khiyami, H.; Al-Harthy, S.; Al-Ammawi, F.; Al-Balkhi, A.; Al-Zahrani, M.; Al-Hawsawy, H. Flash flood inundation map preparation for wadis in arid regions. Arab. J. Geosci. 2013, 6, 3563–3572. [Google Scholar] [CrossRef]
- Doocy, S.; Daniels, A.; Packer, C.; Dick, A.; Kirsch, T.D. The human impact of earthquakes: A historical review of events 1980–2009 and systematic literature review. PLoS Curr. 2013, 5, 1–9. [Google Scholar] [CrossRef] [PubMed]
- Abdalla, F.; El Shamy, I.; Bamousa, B.; Mansour, M.; Mohamed, A.; Tahoon, M. Flash Floods and Groundwater Recharge Potentials in Arid Land Alluvial Basins, Southern Red. Sea Coast, Egypt. Int. J. Geosci. 2014, 5, 971–982. [Google Scholar] [CrossRef]
- Zhang, D.; Quan, J.; Zhang, H. Flash flood hazard mapping: A pilot case study in Xiapu River Basin, China. Water Sci. Eng. 2015, 8, 195–204. [Google Scholar] [CrossRef]
- Elkhrachy, I. Flash Flood Hazard Mapping Using Satellite Images and GIS Tools: A case study of Najran City, Kingdom of Saudi Arabia (KSA). Egypt. J. Remote Sens. Space Sci. 2015, 18, 261–278. [Google Scholar] [CrossRef]
- Abdelkareem, M. Targeting flash flood potential areas using remotely sensed data and GIS techniques. Nat. Hazards J. 2017, 85, 19–37. [Google Scholar] [CrossRef]
- Waqas, H.; Lu, L.; Tariq, A.; Li, Q.; Baqa, M.F.; Xing, J.; Sajjad, A. Flash Flood Susceptibility Assessment and Zonation Using an Integrating Analytic Hierarchy Process and Frequency Ratio Model for the Chitral District, Khyber Pakhtunkhwa, Pakistan. Water 2021, 13, 1650. [Google Scholar] [CrossRef]
- Abdelkareem, M.; Al-Arifi, N. The use of remotely sensed data to reveal geologic, structural, and hydrologic features and predict potential areas of water resources in arid regions. Arab. J. Geosci. 2021, 14, 1–15. [Google Scholar] [CrossRef]
- Collier, C.G. Flash flood forecasting: What are the limits of predictability? Q. J. Meteorol. Soc. 2007, 133, 3–23. [Google Scholar] [CrossRef]
- Carpenter, T.M.; Sperfslage, J.A.; Georgakakos, K.P.; Sweeney, T.; Fread, D.L. National threshold runoff estimation utilizing GIS in support of operational flash flood warning systems. J. Hydrol. 1999, 224, 21–44. [Google Scholar] [CrossRef]
- Charlton, R.; Fealy, R.; Moore, S.; Sweeney, J.; Murphy, C. Assessing the impact of climate change on water supply and flood hazard in Ireland using statistical downscaling and hydrological modeling techniques. Clim. Chang. 2006, 74, 475–491. [Google Scholar] [CrossRef]
- Scheuer, S.; Haase, D.; Volk, M. Integrative assessment of climate change for fast-growing urban areas: Measurement and recommendations for future research. PLoS ONE 2017, 12, e0189451. [Google Scholar] [CrossRef] [PubMed]
- Khosravi, K.; Pourghasemi, H.R.; Chapi, K.; Bahri, M. Flash flood susceptibility analysis and its mapping using different bivariate models in Iran: A comparison between Shannon’s entropy, statistical index, and weighting factor models. Environ. Monit. Assess. 2016, 188, 1–21. [Google Scholar] [CrossRef] [PubMed]
- Ullah, K.; Zhang, J. GIS-based flood hazard mapping using relative frequency ratio method: A case study of Panjkora River Basin, eastern Hindu Kush, Pakistan. PLoS ONE 2020, 15, e0229153. [Google Scholar] [CrossRef]
- Papaioannou, G.; Efstratiadis, A.; Vasiliades, L.; Loukas, A.; Papalexiou, S.M.; Koukouvinos, A.; Tsoukalas, I.; Kossieris, P. An operational method for flood directive implementation in ungauged urban areas. Hydrology 2018, 5, 24. [Google Scholar] [CrossRef]
- Rahmati, O.; Darabi, H.; Haghighi, A.T.; Stefanidis, S.; Kornejady, A.; Nalivan, O.A.; Tien Bui, D. Urban flood hazard modeling using self-organizing map neural network. Water 2019, 11, 2370. [Google Scholar] [CrossRef]
- Hong, Y.; Abdelkareem, M. Integration of remote sensing and a GIS-based method for revealing prone areas to flood hazards and predicting optimum areas of groundwater resources. Arab. J. Geosci. 2022, 15, 1–14. [Google Scholar] [CrossRef]
- Al-Juaidi, A.E.; Nassar, A.M.; Al-Juaidi, O.E. Evaluation of flood susceptibility mapping using logistic regression and GIS conditioning factors. Arab. J. Geosci. 2018, 11, 765. [Google Scholar] [CrossRef]
- Zhao, G.; Pang, B.; Xu, Z.; Yue, J.; Tu, T. Mapping flood susceptibility in mountainous areas on a national scale in China. Sci. Total Environ. 2018, 615, 1133–1142. [Google Scholar] [CrossRef]
- Darabi, H.; Choubin, B.; Rahmati, O.; Haghighi, A.T.; Pradhan, B.; Kløve, B. Urban flood risk mapping using the GARP and QUEST models: A comparative study of machine learning techniques. J. Hydrol. 2019, 569, 142–154. [Google Scholar] [CrossRef]
- Costache, R. Flash-flood potential index mapping using weights of evidence, decision trees models and their novel hybrid integration. Stoch. Environ. Res. Risk Assess. 2019, 33, 1375–1402. [Google Scholar] [CrossRef]
- Billi, P.; Alemu, Y.T.; Ciampalini, R. Increased frequency of flash floods in Dire Dawa, Ethiopia: Change in rainfall intensity or human impact? Nat. Hazards 2015, 76, 1373–1394. [Google Scholar] [CrossRef]
- Bathrellos, G.D.; Karymbalis, E.; Skilodimou, H.D.; Gaki-Papanastassiou, K.; Baltas, E.A. Urban flood hazard assessment in the basin of Athens Metropolitan city, Greece. Environ. Earth Sci. 2016, 75, 319. [Google Scholar] [CrossRef]
- Malik, S.; Pal, S.C. Application of 2D numerical simulation for rating curve development and inundation area mapping: A case study of monsoon dominated Dwarkeswar River. Int. J. River Basin Manag. 2020, 18, 1–11. [Google Scholar] [CrossRef]
- Wang, Y.; Hong, H.; Chen, W.; Li, S.; Pamucar, D.; Gigovic, L.; Drobnjak, S.; Tien Bui, D.; Duan, H. A hybrid GIS multi-criteria decision-making method for flood susceptibility mapping at Shangyou, China. Remote Sens. 2018, 11, 62. [Google Scholar] [CrossRef]
- Yariyan, P.; Janizadeh, S.; Van Phong, T.; Nguyen, H.D.; Costache, R.; Van Le, H.; Pham, B.T.; Pradhan, B.; Tiefenbacher, J.P. Improvement of Best First Decision Trees Using Random subspace and Dagging Ensembles for Flood Probability Mapping. Water Resour. Manag. 2020, 34, 1–17. [Google Scholar] [CrossRef]
- Vojtek, M.; Vojteková, J. Flood susceptibility mapping on a national scale in Slovakia using the analytical hierarchy process. Water 2019, 11, 364. [Google Scholar] [CrossRef]
- Saaty, T.L. The Analytic Hierarchy Process: Planning, Priority Setting, Resource Allocation; McGraw-Hill: New York, NY, USA, 1980. [Google Scholar]
- Abdelkareem, M.; Al-Arifi, N.; Abdalla, F.; Mansour, A.; El-Baz, F. Fusion of Remote Sensing Data Using GIS-Based AHP-Weighted Overlay Techniques for Groundwater Sustainability in Arid Regions. Sustainability 2022, 14, 7871. [Google Scholar] [CrossRef]
- Danumah, J.H.; Odai, S.N.; Saley, B.M.; Szarzynski, J.; Thiel, M.; Kwaku, A.; Kouame, F.K.; Akpa, L.U. Flood risk assessment and mapping in Abidjan district using multi-criteria analysis (AHP) model and geoinformation techniques, (cote d’ivoire). Geoenviron. Disasters 2016, 3, 10. [Google Scholar] [CrossRef]
- Yin, H.; Shi, Y.; Niu, H.; Xie, D.; Wei, J.; Lefticariu, L.; Xu, S. A GIS-based model of potential groundwater yield zonation for a sandstone aquifer in the Juye Coalfield, Shangdong, China. J. Hydrol. 2017, 557, 434–447. [Google Scholar] [CrossRef]
- Arulbalaji, P.; Padmalal, D.; Sreelash, K. GIs and AHP techniques Based Delineation of Groundwater Potential Zones: A case study from southern Western Ghats, India. Sci. Rep. 2019, 9, 2082. [Google Scholar] [CrossRef] [PubMed]
- Sahu, U.; Wagh, V.; Mukate, S.; Kadam, A.; Patil, S. Applications of geospatial analysis and analytical hierarchy process to identify the groundwater recharge potential zones and suitable recharge structures in the Ajani-Jhiri watershed of north Maharashtra, India. Groundw. Sustain. Dev. 2022, 17, 100733. [Google Scholar] [CrossRef]
- Priya, U.; Iqbal, M.A.; Abdus Salam, M.; Nur-E-Alam, M.; Uddin, M.F.; Islam, A.T.; Sarkar, S.K.; Imran, S.I.; Eh Rak, A. Sustainable Groundwater Potential Zoning with Integrating GIS, Remote Sensing, and AHP Model: A Case from North-Central Bangladesh. Sustainability 2022, 14, 5640. [Google Scholar] [CrossRef]
- Peel, M.C.; Finlayson, B.L.; McMahon, T.A. Updated world map of the Koppen € Geiger climate classification. Hydrol. Earth Syst. Sci. 2007, 11, 1633–1644. [Google Scholar] [CrossRef]
- Youssef, A.M.; Abu-Abdullah, M.M.; Abu AlFadail, E.; Skilodimou, H.D.; Bathrellos, G.D. The devastating flood in the arid region a consequence of rainfall and dam failure: Case study, Al-Lith flood on 23th November 2018, Kingdom of Saudi Arabia. Z. Für Geomorphol. 2021, 63, 115–136. [Google Scholar] [CrossRef]
- Youssef, A.M.; Pradhan, B.; Sefry, S.A. Flash flood susceptibility assessment in Jeddah city (Kingdom of Saudi Arabia) using bivariate and multivariate statistical models. Environ. Earth Sci. 2016, 75, 12. [Google Scholar] [CrossRef]
- Subyani, A.M. Hydrologic behavior and flood probability for selected arid basins in Makkah area, western Saudi Arabia. Arab. J. Geosci. 2011, 4, 817–824. [Google Scholar] [CrossRef]
- Alshehri, F.; Sultan, M.; Karki, S.; Alwagdani, E.; Alsefry, S.; Alharbi, H.; Sahour, H.; Sturchio, N. Mapping the Distribution of Shallow Groundwater Occurrences Using Remote Sensing-Based Statistical Modeling over Southwest Saudi Arabia. Remote Sens. 2020, 12, 1361. [Google Scholar] [CrossRef]
- Sulaiman, A.; Elawadi, E.; Mogren, S. Gravity interpretation to image the geologic structures of the coastal zone in al Qunfudhah area, southwest Saudi Arabia. Geophys. J. Int. 2018, 2143, 1623–1632. [Google Scholar] [CrossRef]
- O’Callaghan, J.F.; Mark, D.M. The extraction of drainage networks from digital elevation data. Comput. Vis. Graph. Image Process. 1984, 28, 323–344. [Google Scholar] [CrossRef]
- Strahler, A.N. Quantitative analysis of watershed geomorphology. Trans. Amer. Geophys. Union. 1957, 38, 913–920. [Google Scholar] [CrossRef]
- Strahler, A.N. Quantitative Geomorphology of Drainage Basins and Channel Networks. In Handbook of Applied Hydrology; Chow, V.T., Ed.; McGraw Hill Book Company: New York, NY, USA, 1964; Section 4II. [Google Scholar]
- Eastman, J.R.; Jin, W.; Kyem, A.K.P.; Toledano, J. Raster procedure for multi-criteria/multi-objective decisions. Photogramm. Eng. Remote Sens. 1995, 61, 539–547. [Google Scholar]
- Kia, M.B.; Pirasteh, S.; Pradhan, B.; Mahmud, A.R.; Sulaiman, W.N.A.; Moradi, A. An artificial neural network model for flood simulation using GIS: Johor River Basin, Malaysia. Environ. Earth Sci. 2012, 67, 251–264. [Google Scholar] [CrossRef]
- Das, S. Geospatial mapping of flood susceptibility and hydro-geomorphic response to the floods in Ulhas basin, India. Remote Sens. Appl. Soc. Environ. 2019, 14, 60–74. [Google Scholar] [CrossRef]
- Liuzzo, L.; Sammartano, V.; Freni, G. Comparison between Different Distributed Methods for Flood Susceptibility Mapping. Water Resour. Manag. 2019, 33, 3155–3173. [Google Scholar] [CrossRef]
- Botzen, W.; Aerts, J.; van den Bergh, J. Individual preferences for reducing flood risk to near zero through elevation. Mitig. Adapt. Strateg. Glob. Chang. 2013, 18, 229–244. [Google Scholar] [CrossRef]
- Tehrany, M.S.; Pradhan, B.; Jebur, M.N. Flood susceptibility mapping using a novel ensemble weights-of-evidence and support vector machine models in GIS. J. Hydrol. 2014, 512, 332–343. [Google Scholar] [CrossRef]
- Zhu, Q.; Abdelkareem, M. Mapping groundwater potential zones using a knowledge-driven approach and GIS analysis. Water 2021, 13, 579. [Google Scholar] [CrossRef]
- Rahman, M.; Ningsheng, C.; Islam, M.M.; Dewan, A.; Iqbal, J.; Washakh, R.M.A.; Shufeng, T. Flood Susceptibility Assessment in Bangladesh Using Machine Learning and Multi-criteria Decision Analysis. Earth Syst. Environ. 2019, 3, 585–601. [Google Scholar] [CrossRef]
- Masoudian, M. The Topographical Impact on Effectiveness of Flood Protection Measures. Ph.D. Thesis, Faculty of Civil Engineering, Kassel University, Kassel, Germany, 2009. Available online: https://books.google.co.jp/books?hl=zh-TW&lr=&id=JQuc15e5ukEC&oi=fnd&pg=PA72&dq=The+Topographical+Impact+on+Effectiveness+of+Flood+Protection+Measures.+Ph.D.+Thesis.+Faculty+of+Civil+Engineering,+Kassel+University:+Kassel,+Germany,+2009&ots=f-N5ezRQFV&sig=nOMXpD6Fr0yR42qedBCZdIPxS9M#v=onepage&q&f=false (accessed on 10 December 2013).
- Bapalu, G.V.; Sinha, R. GIS in Flood Hazard Mapping: A Case Study of Kosi River Basin, India. 2005. Available online: https://www.researchgate.net/profile/Rajiv-Sinha-2/publication/200004867_GIS_in_Flood_Hazard_Mapping_a_case_study_of_Kosi_River_Basin_India/links/0046353bd6f9186023000000/GIS-in-Flood-Hazard-Mapping-a-case-study-of-Kosi-River-Basin-India.pdf (accessed on 8 November 2014).
- Benjmel, K.; Amraoui, F.; Boutaleb, S.; Ouchchen, M.; Tahiri, A.; Touab, A. Mapping of groundwater potential zones in crystalline terrain using remote sensing, GIS techniques, and multicriteria data analysis (case of the Ighremregion, western Anti-Atlas, Morocco). Water 2020, 12, 471. [Google Scholar] [CrossRef]
- Pham, B.T.; van Phong, T.; Nguyen, H.D.; Qi, C.; Al-Ansari, N.; Amini, A.; Ho, L.S.; Tuyen, T.T.; Yen, H.P.H.; Ly, H.; et al. A Comparative Study of Kernel Logistic Regression, Radial Basis Function Classifier, Multinomial Naïve Bayes, and Logistic Model Tree for Flash Flood Susceptibility Mapping. Water 2020, 12, 239. [Google Scholar] [CrossRef]
- Cao, C.; Xu, P.; Wang, Y.; Chen, J.; Zheng, L.; Niu, C. Flash Flood Hazard Susceptibility Mapping Using Frequency Ratio and Statistical Index Methods in Coalmine Subsidence Areas. Sustainability 2016, 8, 948. [Google Scholar] [CrossRef]
- Janizadeh, S.; Avand, M.; Jaafari, A.; Phong, T.; Bayat, M.; Ahmadisharaf, E.; Prakash, I.; Pham, P.; Lee, S. Prediction Success of Machine Learning Methods for Flash Flood Susceptibility Mapping in the Tafresh Watershed, Iran. Sustainability 2019, 11, 5426. [Google Scholar] [CrossRef]
- Jebur, M.N.; Pradhan, B.; Tehrany, M.S. Optimization of landslide conditioning factors using very high-resolution airborne laser scanning (lidar) data at catchment scale. Remote Sens. Environ. 2014, 152, 150–165. [Google Scholar] [CrossRef]
- Moore, I.D.; Grayson, R.B.; Ladson, A.R. Digital terrain modelling: A review of hydrological, geomor- phological, and biological applications. Hydrol. Process. 1991, 5, 3–30. [Google Scholar] [CrossRef]
- Brooks, H.E.; Stensrud, D.J. Climatology of heavy rain events in the United States from hourly precipitation observations. Mon. Weather Rev. 2000, 128, 1194–1201. [Google Scholar] [CrossRef]
- Nyarko, B.K. Application of a rational model in GIS for flood risk assessment in Accra. J. Spatial Hydrol. 2002, 2, 1–14. [Google Scholar]
- Paul, G.C.; Saha, S.; Hembram, T.K. Application of the GIS-Based Probabilistic Models for Mapping the Flood Susceptibility in Bansloi Sub-basin of Ganga-Bhagirathi River and Their Comparison. Remote Sens. Earth Syst. Sci. 2019, 2, 120–146. [Google Scholar] [CrossRef]
- Mukherjee, I.; Singh, U.K. Delineation of groundwater potential zones in a drought-prone semi-arid region of East India using GIS and analytical hierarchical process techniques. Catena 2020, 194, 104681. [Google Scholar] [CrossRef]
- Mahmood, S.; Atta-ur, Rahman. Flash flood susceptibility modeling using geo-morphometric and hydrological approaches in Panjkora Basin, Eastern Hindu Kush, Pakistan. Environ. Earth Sci. 2019, 78, 43. [Google Scholar] [CrossRef]
- Islam, M.M.; Sado, K. Flood hazard assessment in Bangladesh using NOAA AVHRR data with geographical information system. Hydrol. Process. 2000, 14, 605–620. [Google Scholar] [CrossRef]
- Sharma, T.P.P.; Zhang, J.; Khanal, N.R.; Prodhan, F.A.; Nanzad, L.; Zhang, D.; Nepal, P. A Geomorphic Approach for Identifying Flash Flood Potential Areas in the East Rapti River Basin of Nepal. ISPRS Int. J. Geo-Inf. 2021, 10, 247. [Google Scholar] [CrossRef]
- Bui, D.; Ngo, P.; Pham, T.; Jaafari, A.; Minh, N.; Hoa, P.; Samui, P. A novel hybrid approach based on a swarm intelligence optimized extreme learning machine for flash flood susceptibility mapping. Catena 2019, 179, 184–196. [Google Scholar] [CrossRef]
- Miraki, S.; Zanganeh, S.H.; Chapi, K.; Singh, V.P.; Shirzadi, A.; Shahabi, H.; Pham, B.T. Mapping groundwater potential using a novel hybrid intelligence approach. Water Resour. Manag. 2019, 33, 281–302. [Google Scholar] [CrossRef]
- Chorley, R.; Malm, D.; Pogorzelski, H. A new standard for estimating basin shape. Am. J. Sci. 1957, 255, 138–141. [Google Scholar] [CrossRef]
- Withanage, N.S.; Dayawansa, N.D.K.; De Silva, R.P. Morphometric analysis of the Gal Oya river Basin using spatial data derived from GIS. Trop. Agric. Res. 2014, 26, 175–188. [Google Scholar] [CrossRef]
- Safarina, A.B.; Karnisah, I.; Permana, A.S. Study of the effect of river basin morphology change on threshold parameters in cimahi flood early warning system. In Proceedings of the 11th Aceh International Workshop and Expo on Sustainable Tsunami Disaster Recovery, Banda Aceh, Indonesia, 10–12 October 2018. [Google Scholar]
- Schumn, S.A. Evaluation of drainage systems and slopes in badlands at Perth Amboy, New Jersy. Bull. GeolSoc. Am. 1956, 67, 597–646. [Google Scholar] [CrossRef]
- Miller, V.C. A Quantitative Geomorphic Study of Drainage Basin Characteristics on the Clinch Mountain Area, Virginia and Tennessee, Project NR 389–402. In Technical Report 3; Department of Geology, ONR, Columbia University: New York, NY, USA, 1953. [Google Scholar]
- Horton, R.E. Drainage-basin characteristics. Trans. Am. Geophys. Union 1932, 13, 350–361. [Google Scholar] [CrossRef]
- Faniran, A. The index of drainage intensity—A provisional new drainage factor. Aust. J. Sci. 1968, 31, 328–330. [Google Scholar]
- Davis, J.C. Statics and Data Analysis in Geology; Wiley: New York, NY, USA, 1975. [Google Scholar]
- Abdalla, F.; Al-Turki, A.; Al Amri, A. Evaluation of Groundwater Resources in the Southern Tihama Plain, Saudi Arabia. Arabian Journal of Geosciences– published by Springer Berlin/Heidelberg. Arab. J. Geosci. 2015, 8, 3299–3310. [Google Scholar] [CrossRef]
- Santangelo, N. Geomorphological Contribution to Flash Floods Hazard Evaluation: Examples from Campania (Southern Italy). J. Environ. Sci. Allied Res. 2019, 2, 44–50. [Google Scholar]
- Elewa, H.H.; Qaddah, A.A. Groundwater potentiality mapping in the Sinai Peninsula, Egypt, using remote sensing and GIS-watershed-based modeling. Hydrogeol. J. 2011, 19, 613–628. [Google Scholar] [CrossRef]
- Abdelkareem, M.; Abdalla, F. Revealing potential areas of water resources using integrated remote-sensing data and GIS-based analytical hierarchy process. Geocarto Int. 2021, 1–25. [Google Scholar] [CrossRef]


| Elev | Slope | Curvature | TWI | SPI | Rainfall | Dep | Dd | DR | Runoff | Criteria Weight | max | |
|---|---|---|---|---|---|---|---|---|---|---|---|---|
| Elev | 1.0 | 1.4 | 2.3 | 1.4 | 2.3 | 1.8 | 1.8 | 1.2 | 1.0 | 2.3 | 0.15 | 10.00 |
| Slope | 0.7 | 1.0 | 1.7 | 1.0 | 1.7 | 1.3 | 1.3 | 0.8 | 0.7 | 1.7 | 0.11 | 10.00 |
| curvature | 0.4 | 0.6 | 1.0 | 0.6 | 1.0 | 0.8 | 0.8 | 0.5 | 0.4 | 1.0 | 0.06 | 10.00 |
| TWI | 0.7 | 1.0 | 1.7 | 1.0 | 1.7 | 1.3 | 1.3 | 0.8 | 0.7 | 1.7 | 0.11 | 10.00 |
| SPI | 0.4 | 0.6 | 1.0 | 0.6 | 1.0 | 0.8 | 0.8 | 0.5 | 0.4 | 1.0 | 0.06 | 10.00 |
| Rainfall | 0.6 | 0.8 | 1.3 | 0.8 | 1.3 | 1.0 | 1.0 | 0.7 | 0.6 | 1.3 | 0.09 | 10.00 |
| Dep | 0.6 | 0.8 | 1.3 | 0.8 | 1.3 | 1.0 | 1.0 | 0.7 | 0.6 | 1.3 | 0.09 | 10.00 |
| Dd | 0.9 | 1.2 | 2.0 | 1.2 | 2.0 | 1.5 | 1.5 | 1.0 | 0.9 | 2.0 | 0.13 | 10.00 |
| DR | 1.0 | 1.4 | 2.3 | 1.4 | 2.3 | 1.8 | 1.8 | 1.2 | 1.0 | 2.3 | 0.15 | 10.00 |
| Runoff | 0.4 | 0.6 | 1.0 | 0.6 | 1.0 | 0.8 | 0.8 | 0.5 | 0.4 | 1.0 | 0.06 | 10.00 |
| Sum | 6.7 | 9.4 | 15.7 | 9.4 | 15.7 | 11.8 | 11.8 | 7.8 | 6.7 | 15.7 | 1.00 | 100.00 |
| Thematic Layer | Normalized Layer Weight (Wi) | Detailed Features/Sub-Classes | Rank | Normalized Layer Weight (Wi) | Area (%) |
|---|---|---|---|---|---|
| Elevation (7) | 0.149 | 18–473 | 5 | 0.33 | 36.6 |
| 473–855 | 4 | 0.27 | 29.3 | ||
| 855–1344 | 3 | 0.2 | 16.55 | ||
| 1344–1992 | 2 | 0.13 | 10.49 | ||
| 1992–2991 | 1 | 0.07 | 7.06 | ||
| Slope (5) | 0.106 | 0–5 | 1 | 0.07 | 32.71 |
| 5 to 15 | 2 | 0.13 | 27.28 | ||
| 15–25 | 3 | 0.2 | 21.56 | ||
| 25–30 | 4 | 0.27 | 8.29 | ||
| 30–66.50 | 5 | 0.33 | 10.16 | ||
| Drainage density (6) | 0.128 | 0.180–0.719 | 1 | 0.07 | 6.69 |
| 0.719–0.960 | 2 | 0.13 | 17.95 | ||
| 0.960–1.137 | 3 | 0.2 | 31.26 | ||
| 1.137–1.311 | 4 | 0.27 | 31.33 | ||
| 1.311–1.879 | 5 | 0.33 | 12.77 | ||
| Depressions (4) | 0.085 | 0 | 1 | 0.25 | 2.99 |
| 0 to–0.74 | 3 | 0.75 | 97.01 | ||
| TWI (5) | 0.106 | 3.66–6.71 | 1 | 0.1 | 42.45 |
| 6.71–8.57 | 2 | 0.2 | 32.82 | ||
| 8.57–11.08 | 3 | 0.3 | 17.65 | ||
| 11.08–18.92 | 4 | 0.4 | 7.09 | ||
| SPI (3) | 0.064 | 0–1500 | 1 | 0.17 | 97.12 |
| 1500–5000 | 2 | 0.33 | 1.93 | ||
| 5000–363,232 | 3 | 0.5 | 0.94 | ||
| Rainfall (4) | 0.085 | 0.285–0.466 | 1 | 0.1 | 10.04 |
| 0.466–0.586 | 2 | 0.2 | 25.08 | ||
| 0.586–0.667 | 3 | 0.3 | 41.02 | ||
| 0.667–0.803 | 4 | 0.4 | 23.86 | ||
| Curvature (3) | 0.064 | 6.9–0 (convex) | 2 | 0.33 | 16.26 |
| 0 (flat) | 3 | 0.5 | 37.8 | ||
| 0 to–7.09 (concave) | 1 | 0.17 | 45.93 | ||
| Runoff (3) | 0.064 | 26.48 to 28.97 | 1 | 0.04761905 | 2280.985 |
| 32.40 to 32.86 | 2 | 0.0952381 | 397.985 | ||
| 37.42 | 3 | 0.14285714 | 470.156 | ||
| 43.33 | 4 | 0.19047619 | 336.571 | ||
| 49.28 to 49.67 | 5 | 0.23809524 | 1224.784 | ||
| 52.034 | 6 | 0.28571429 | 512.26 | ||
| Distance to River (7) | 0.149 | 0 to 200 | 3 | 0.5 | 48.18 |
| 200 to 484 | 2 | 0.33 | 36.1 | ||
| 484 to 1350 | 1 | 0.17 | 15.73 |
| Basin_NO | U | Nu | Lu | A | P | Lb | W | Rb | Re | Rf | Rc | Rt | Fs | Dd | Lg | If | Bh | Rh | Rn |
|---|---|---|---|---|---|---|---|---|---|---|---|---|---|---|---|---|---|---|---|
| 1 | 4 | 199 | 202.745 | 148.797 | 89.82 | 21.722 | 12.351 | 3.846 | 0.634 | 0.315 | 0.232 | 2.216 | 1.337 | 1.363 | 0.367 | 1.822 | 1.433 | 0.066 | 1.953 |
| 2 | 5 | 688 | 787.277 | 558.568 | 240.3 | 58.914 | 24.146 | 4.872 | 0.453 | 0.161 | 0.122 | 2.863 | 1.232 | 1.409 | 0.355 | 1.736 | 2.472 | 0.042 | 3.484 |
| 3 | 6 | 643 | 637.404 | 470.156 | 165.6 | 40.864 | 16.883 | 4.505 | 0.599 | 0.282 | 0.215 | 3.883 | 1.368 | 1.356 | 0.369 | 1.854 | 2.498 | 0.061 | 3.387 |
| 4 | 6 | 447 | 470.783 | 336.571 | 118.62 | 29.921 | 18.621 | 4.526 | 0.692 | 0.376 | 0.301 | 3.768 | 1.328 | 1.399 | 0.357 | 1.858 | 2.241 | 0.075 | 3.135 |
| 5 | 5 | 265 | 285.64 | 200.726 | 127.8 | 28.230 | 20.168 | 3.904 | 0.566 | 0.252 | 0.154 | 2.074 | 1.320 | 1.423 | 0.351 | 1.879 | 1.010 | 0.036 | 1.437 |
| 6 | 6 | 667 | 756.687 | 512.260 | 154.08 | 34.252 | 26.107 | 4.487 | 0.746 | 0.437 | 0.271 | 4.329 | 1.302 | 1.477 | 0.338 | 1.923 | 2.524 | 0.074 | 3.728 |
| 7 | 5 | 354 | 360.188 | 249.188 | 133.92 | 33.506 | 13.804 | 4.476 | 0.532 | 0.222 | 0.175 | 2.643 | 1.421 | 1.445 | 0.346 | 2.053 | 0.930 | 0.028 | 1.344 |
| 8 | 6 | 887 | 990.004 | 690.323 | 244.26 | 61.344 | 17.609 | 5.087 | 0.483 | 0.183 | 0.145 | 3.631 | 1.285 | 1.434 | 0.349 | 1.843 | 1.374 | 0.022 | 1.970 |
| 9 | 5 | 655 | 702.135 | 481.326 | 163.08 | 32.902 | 23.761 | 4.775 | 0.752 | 0.445 | 0.227 | 4.016 | 1.361 | 1.459 | 0.343 | 1.985 | 2.326 | 0.071 | 3.393 |
| 10 | 6 | 1029 | 1050.382 | 743.459 | 214.2 | 40.112 | 38.863 | 4.475 | 0.767 | 0.462 | 0.204 | 4.804 | 1.384 | 1.413 | 0.354 | 1.955 | 2.597 | 0.065 | 3.669 |
| 11 | 5 | 1053 | 1209.444 | 831.368 | 266.04 | 55.065 | 41.119 | 5.458 | 0.591 | 0.274 | 0.148 | 3.958 | 1.267 | 1.455 | 0.344 | 1.843 | 1.058 | 0.019 | 1.539 |
| WadiHali | 6 | 1472 | 3600.665 | 5222.742 | 645.48 | 121.541 | 94.133 | 4.553 | 0.671 | 0.354 | 0.158 | 2.280 | 0.282 | 0.689 | 0.725 | 0.194 | 2.973 | 0.024 | 2.050 |
| Basin_NO | Rb | Lg | Re | Rf | Rc | Rt | Fs | Dd | If | Bh | Rh | Rn | S of Hazard Degree | Hazard Degree |
|---|---|---|---|---|---|---|---|---|---|---|---|---|---|---|
| 1 | 5.000 | 1.244 | 3.303 | 3.051 | 3.462 | 1.208 | 3.238 | 1.225 | 2.087 | 2.207 | 4.359 | 2.021 | 32.404 | 2 |
| 2 | 2.454 | 2.855 | 1.000 | 1.000 | 1.000 | 2.157 | 1.000 | 2.770 | 1.000 | 4.700 | 2.634 | 4.590 | 27.159 | 1 |
| 3 | 3.367 | 1.000 | 2.859 | 2.602 | 3.098 | 3.651 | 3.878 | 1.000 | 2.488 | 4.762 | 4.011 | 4.427 | 37.142 | 3 |
| 4 | 3.312 | 2.497 | 4.044 | 3.856 | 5.000 | 3.483 | 3.041 | 2.418 | 2.533 | 4.146 | 5.000 | 4.004 | 43.333 | 4 |
| 5 | 4.856 | 3.301 | 2.446 | 2.208 | 1.735 | 1.000 | 2.874 | 3.217 | 2.798 | 1.192 | 2.190 | 1.156 | 28.973 | 1 |
| 6 | 3.410 | 5.000 | 4.727 | 4.662 | 4.342 | 4.304 | 2.490 | 5.000 | 3.361 | 4.825 | 4.913 | 5.000 | 52.034 | 6 |
| 7 | 3.438 | 4.020 | 2.004 | 1.811 | 2.185 | 1.835 | 5.000 | 3.955 | 5.000 | 1.000 | 1.614 | 1.000 | 32.862 | 2 |
| 8 | 1.921 | 3.660 | 1.390 | 1.299 | 1.533 | 3.282 | 2.126 | 3.582 | 2.344 | 2.065 | 1.229 | 2.051 | 26.482 | 1 |
| 9 | 2.694 | 4.437 | 4.814 | 4.768 | 3.365 | 3.846 | 3.734 | 4.394 | 4.139 | 4.350 | 4.698 | 4.437 | 49.676 | 5 |
| 10 | 3.441 | 2.967 | 5.000 | 5.000 | 2.834 | 5.000 | 4.226 | 2.881 | 3.765 | 5.000 | 4.271 | 4.901 | 49.285 | 5 |
| 11 | 1.000 | 4.313 | 2.758 | 2.504 | 1.582 | 3.761 | 1.738 | 4.262 | 2.343 | 1.307 | 1.000 | 1.327 | 27.896 | 1 |
Publisher’s Note: MDPI stays neutral with regard to jurisdictional claims in published maps and institutional affiliations. |
© 2022 by the authors. Licensee MDPI, Basel, Switzerland. This article is an open access article distributed under the terms and conditions of the Creative Commons Attribution (CC BY) license (https://creativecommons.org/licenses/by/4.0/).
Share and Cite
Alarifi, S.S.; Abdelkareem, M.; Abdalla, F.; Alotaibi, M. Flash Flood Hazard Mapping Using Remote Sensing and GIS Techniques in Southwestern Saudi Arabia. Sustainability 2022, 14, 14145. https://doi.org/10.3390/su142114145
Alarifi SS, Abdelkareem M, Abdalla F, Alotaibi M. Flash Flood Hazard Mapping Using Remote Sensing and GIS Techniques in Southwestern Saudi Arabia. Sustainability. 2022; 14(21):14145. https://doi.org/10.3390/su142114145
Chicago/Turabian StyleAlarifi, Saad S., Mohamed Abdelkareem, Fathy Abdalla, and Mislat Alotaibi. 2022. "Flash Flood Hazard Mapping Using Remote Sensing and GIS Techniques in Southwestern Saudi Arabia" Sustainability 14, no. 21: 14145. https://doi.org/10.3390/su142114145
APA StyleAlarifi, S. S., Abdelkareem, M., Abdalla, F., & Alotaibi, M. (2022). Flash Flood Hazard Mapping Using Remote Sensing and GIS Techniques in Southwestern Saudi Arabia. Sustainability, 14(21), 14145. https://doi.org/10.3390/su142114145