Article

Research on Green Total Factor Productivity Enhancement Path from the Configurational Perspective—Based on the TOE Theoretical Framework

1
School of Management, Zhengzhou University, Zhengzhou 450001, China
2
School of Information Management, Zhengzhou University, Zhengzhou 450001, China
*
Author to whom correspondence should be addressed.
Sustainability 2022, 14(21), 14082; https://doi.org/10.3390/su142114082
Submission received: 28 September 2022 / Revised: 21 October 2022 / Accepted: 26 October 2022 / Published: 28 October 2022

Abstract

:
Increasing Green Total Factor Productivity (GTFP) is the strategy to overcome resource and environmental limitations and achieve green and sustainable regional economic development. This study introduces the Technology–Organization–Environment (TOE) theoretical framework and the Fuzzy set Qualitative Comparative Analysis (fsQCA) method into the study of GTFP. We use the fsQCA method to empirically explore the linkage matching patterns of multiple conditions such as technology, organization, and environment in the TOE framework for influencing GTFP from a configurational perspective using 30 Chinese provinces and cities as case studies. This study provides new concepts and methodologies for GTFP-related research. The study’s findings indicate that: (1) There are two paths to generating high GTFP: the type of organizational management and the type of technical support. The two paths produce non-high GTFP, namely, a type of organizational management deficit and environmental support deficiency and a type of organizational management imbalance and technological support deficiency, respectively. This research verifies the existence of causal asymmetry in the GTFP phenomena. (2) In addition, there are substitutes between combinations of organizational conditions and technical conditions and between technical conditions and environmental conditions under specific circumstances. This discovery broadens the scope of how the TOE framework can be used to explain “causal complexity” and, in some ways, resolves the theoretical conundrum it now faces. (3) According to the sub-regional study, GTFP improvement tactics have substantial spatial distribution characteristics, with China’s eastern and central regions achieving them through organizational management and technical support strategies. Only the organizational management type is prevalent in the western region. This study is useful for the local planning of GTFP enhancement paths in each Chinese province to achieve a win–win situation between economic development and environmental conservation, as well as to provide empirical evidence for nations in a similar situation to China.

1. Introduction

A significant and pressing worldwide issue humanity is currently experiencing is climate change. After the Paris Agreement created the general foundation for the global climate change regime post-2020, Green Total Factor Productivity (GTFP) has simultaneously become the key to achieving economic growth and environmental protection. The notion of GTFP dates back to the middle to late 20th century when Chung initially advocated that the function of undesirable outputs, such as pollution emissions, in economic development should be examined [1]. The GTFP is an objective measure of the quality of green and sustainable development since it reflects the environmental protection efforts of economically developing nations. China has incorporated GDP energy consumption and CO2 emissions as one of the primary binding metrics for economic and social growth in the 14th Five Year Plan and the 2035 Vision to demonstrate its ambition and will to strengthen emission reduction [2].
China’s economy has grown significantly since the reform and opening up. Behind this accomplishment, however, China faces a problem shared by many developing nations: an old economy model with high inputs, consumption, pollution, and emissions. The cost of this problem has left many places with environmental contamination, overcapacity, and resource loss [3]. According to China’s Statistical Bulletin of National Economic and Social Development for 2021, 35.7% of the 339 monitored cities at the prefecture level and above did not meet air quality standards throughout the year. Non-clean energy consumption, such as coal and crude oil, accounted for 74.50% of total energy consumption [4]. In response, the Chinese government demonstrated that enhancing regional GTFP is a prerequisite for achieving coordinated development that is of higher quality, more sustainable, and more efficient [5].
On the one hand, the Chinese government has advocated for a policy of innovation-driven high-quality economic development to minimize pollution, increase production efficiency, and boost economic development via technical innovations. On the other hand, many laws and regulations on energy conservation and emission reduction have been enacted to encourage firms with high pollution and energy consumption to change and upgrade to a green development route. As a result of the implementation of these policies, China’s GTFP has been enhanced; however, due to the disparities in regional resources and economic development levels, China’s GTFP has not been significantly enhanced, and there are vast regional disparities between provinces [6]. Therefore, determining how to increase GTFP in various places has become an urgent issue that must be resolved.
There are two primary types of current GTFP research: one focuses on the measurement and spatiotemporal evolution of GTFP. The majority of the measures are derived from stochastic frontier analysis (SFA) [7] and nonparametric data envelopment analysis (DEA) [8]. However, traditional DEA models largely disregard the influence of non-radial relaxation variables and are inadequate for dealing with non-desired outputs; consequently, current researchers favor the Malmquist–Luenberger (ML) productivity index based on a Slacks-based Measure (SBM) directional distance function [9] or SBM-GML [10] for GTFP measurement. The spatiotemporal evolution focuses primarily on the GTFP trend over a period of time (e.g., ten years) and the spatial trend. For instance, Xiao [11] examined the development of China’s industrial green total factor productivity from 2003 to 2018 and identified a “growth–stabilization–growth–decline” pattern. Spatial analysis reveals that the Gini coefficient of industrial GTFP in the east and west areas increases annually. At the same time, the difference between the central and western regions diminishes, and the difference between the northeast regions grows.
The second component is the investigation of the factors affecting GTFP and the enhancement path. Various factors, such as industrial structure [12], economic environment [13], openness to the outside world [14,15], innovation level [16], Internet development [17], and environmental regulation [18] influence the enhancement of GTFP, according to academics. (1) Adjusting the industrial structure reallocates input elements across sectors. For instance, Li [12] discovered that optimizing and upgrading the industrial structure to the tertiary industry will boost energy consumption efficiency and, subsequently, GTFP. (2) Economic structure and growth direction are influenced by the flow of human capital, the concentration of high-tech companies, and the region’s energy consumption, all of which affect the regional gross total factor productivity (GTFP). Riti developed a model based on the environmental Kuznets theory to verify the relationship between CO1 emissions and economic growth and discovered that the China scenario has an environmental Kuznets curve [13]. (3) Opening up to the outside world involves both “bringing in” and “going out”; “coming in” refers to the introduction of foreign wealth, technology, and culture. To “go out” refers to the export of national capital, technology, and culture. Driffield’s empirical examination of FDI and OFDI in the U.K. reveals that most foreign investment in the U.K. originates from nations with a comparable degree of development as the UK, resulting in new technological developments. Its OFDI, on the other hand, moves domestic output with the low value-added outside, thereby creating room and resources for high-tech research and contributing to productivity improvements [15]. Wang confirms this using a spatial econometric model for the Chinese region and discovers that subject to policy limitations, FDI positively affects the GTFP of local and surrounding regions [14]. This result is comparable with Driffield’s findings. (4) The development, dissemination, and implementation of new technologies can optimize the flow and combination of materials, minimize pollution emissions, improve the treatment rate of pollutants, and promote environmental protection in the production process [19]. Zhu used DEA to dissect GTFP and concluded that technological advancement is GTFP growth’s primary driving force [16]. This position as an inventive driving force is especially important in the clean production business [20]. (5) The evolution of the Internet drives the dissemination and application of new ideas and technology by facilitating the integration of resources. Using a threshold regression model and a fixed effects model, Li determined that there is a significant double threshold effect of human capital on GTFP and that the Internet cannot promote GTFP in regions with insufficient human capital; this promotion effect will only occur when human capital reaches a certain level [9]. (6) Institutional restrictions can impact the course of businesses and whether or not they adopt green technology that is ecologically friendly. Using regression testing, Loganathan discovered that green taxes have a negative influence when GTFP is low and high but have a beneficial role when GTFP is in the middle range [18]. However, most current research focuses on the effect of a single component on GTFP [21], and there is no consensus regarding how these effects affect GTFP. This is because: first, the different research scopes and entry points lead to differences in the discussed GTFP influencing factors and their effects and influence mechanisms, such as differences in regional resource endowments and development levels leading to different paths of regional GTFP enhancement; second, the majority of studies focus on the net effect of influencing factors on GTFP or simply introduce interaction terms to analyze the effect of each factor on GTFP interaction; and third, regional resource endowments and development levels lead to different paths of regional GTFP enhancement. However, there is evidence that the influence of the factors mentioned earlier on GTFP cannot be isolated and that each component influences or mediates some other aspects [21]. Interactions between factors and individual differences can affect the direction and magnitude of the effects of factors on GTFP [22].
In order to address the issues mentioned earlier, this paper provides an integrated analysis framework for GTFP based on the TOE theoretical framework, which combines the elements influencing GTFP into three dimensions: technology, organization, and environment, building on previous research on the factors influencing GTFP. Moreover, this paper presents the fsQCA method for examining GTFP improvement routes. Due to the causal complexity of social problems, the application of fsQCA compensates for neglecting many contemporaneous causal linkages among distinct elements in previous studies. Furthermore, the combination of TOE theory and the fsQCA method not only accounts for the logical framework among the selected elements but also expands the application of the TOE framework in explaining “causal complexity” via fsQCA. The current challenge of the theory, namely, the link between technology, organization, and environment in TOE, via which the matching pattern impacts the overall level, has been partially resolved.
In summary, this study will employ the fsQCA technique, introduce the TOE theoretical framework, and use 30 provinces (municipalities and autonomous regions) in China as instances, based on the configurational perspective and retrospective logic, through phenomenon (GTFP and its influencing factors of the status quo), trace the results (high and low GTFP) configuration of reason, and whether a single factor will cause the bottleneck of GTFP, to answer the core conditions affecting GTFP in different regions, the key reasons hindering the progress of GTFP, and the multiple paths to enhance regional GTFP serve as a guide for each Chinese region to build a customized path to improve GTFP. It also offers actual evidence for countries in conditions comparable with China’s.

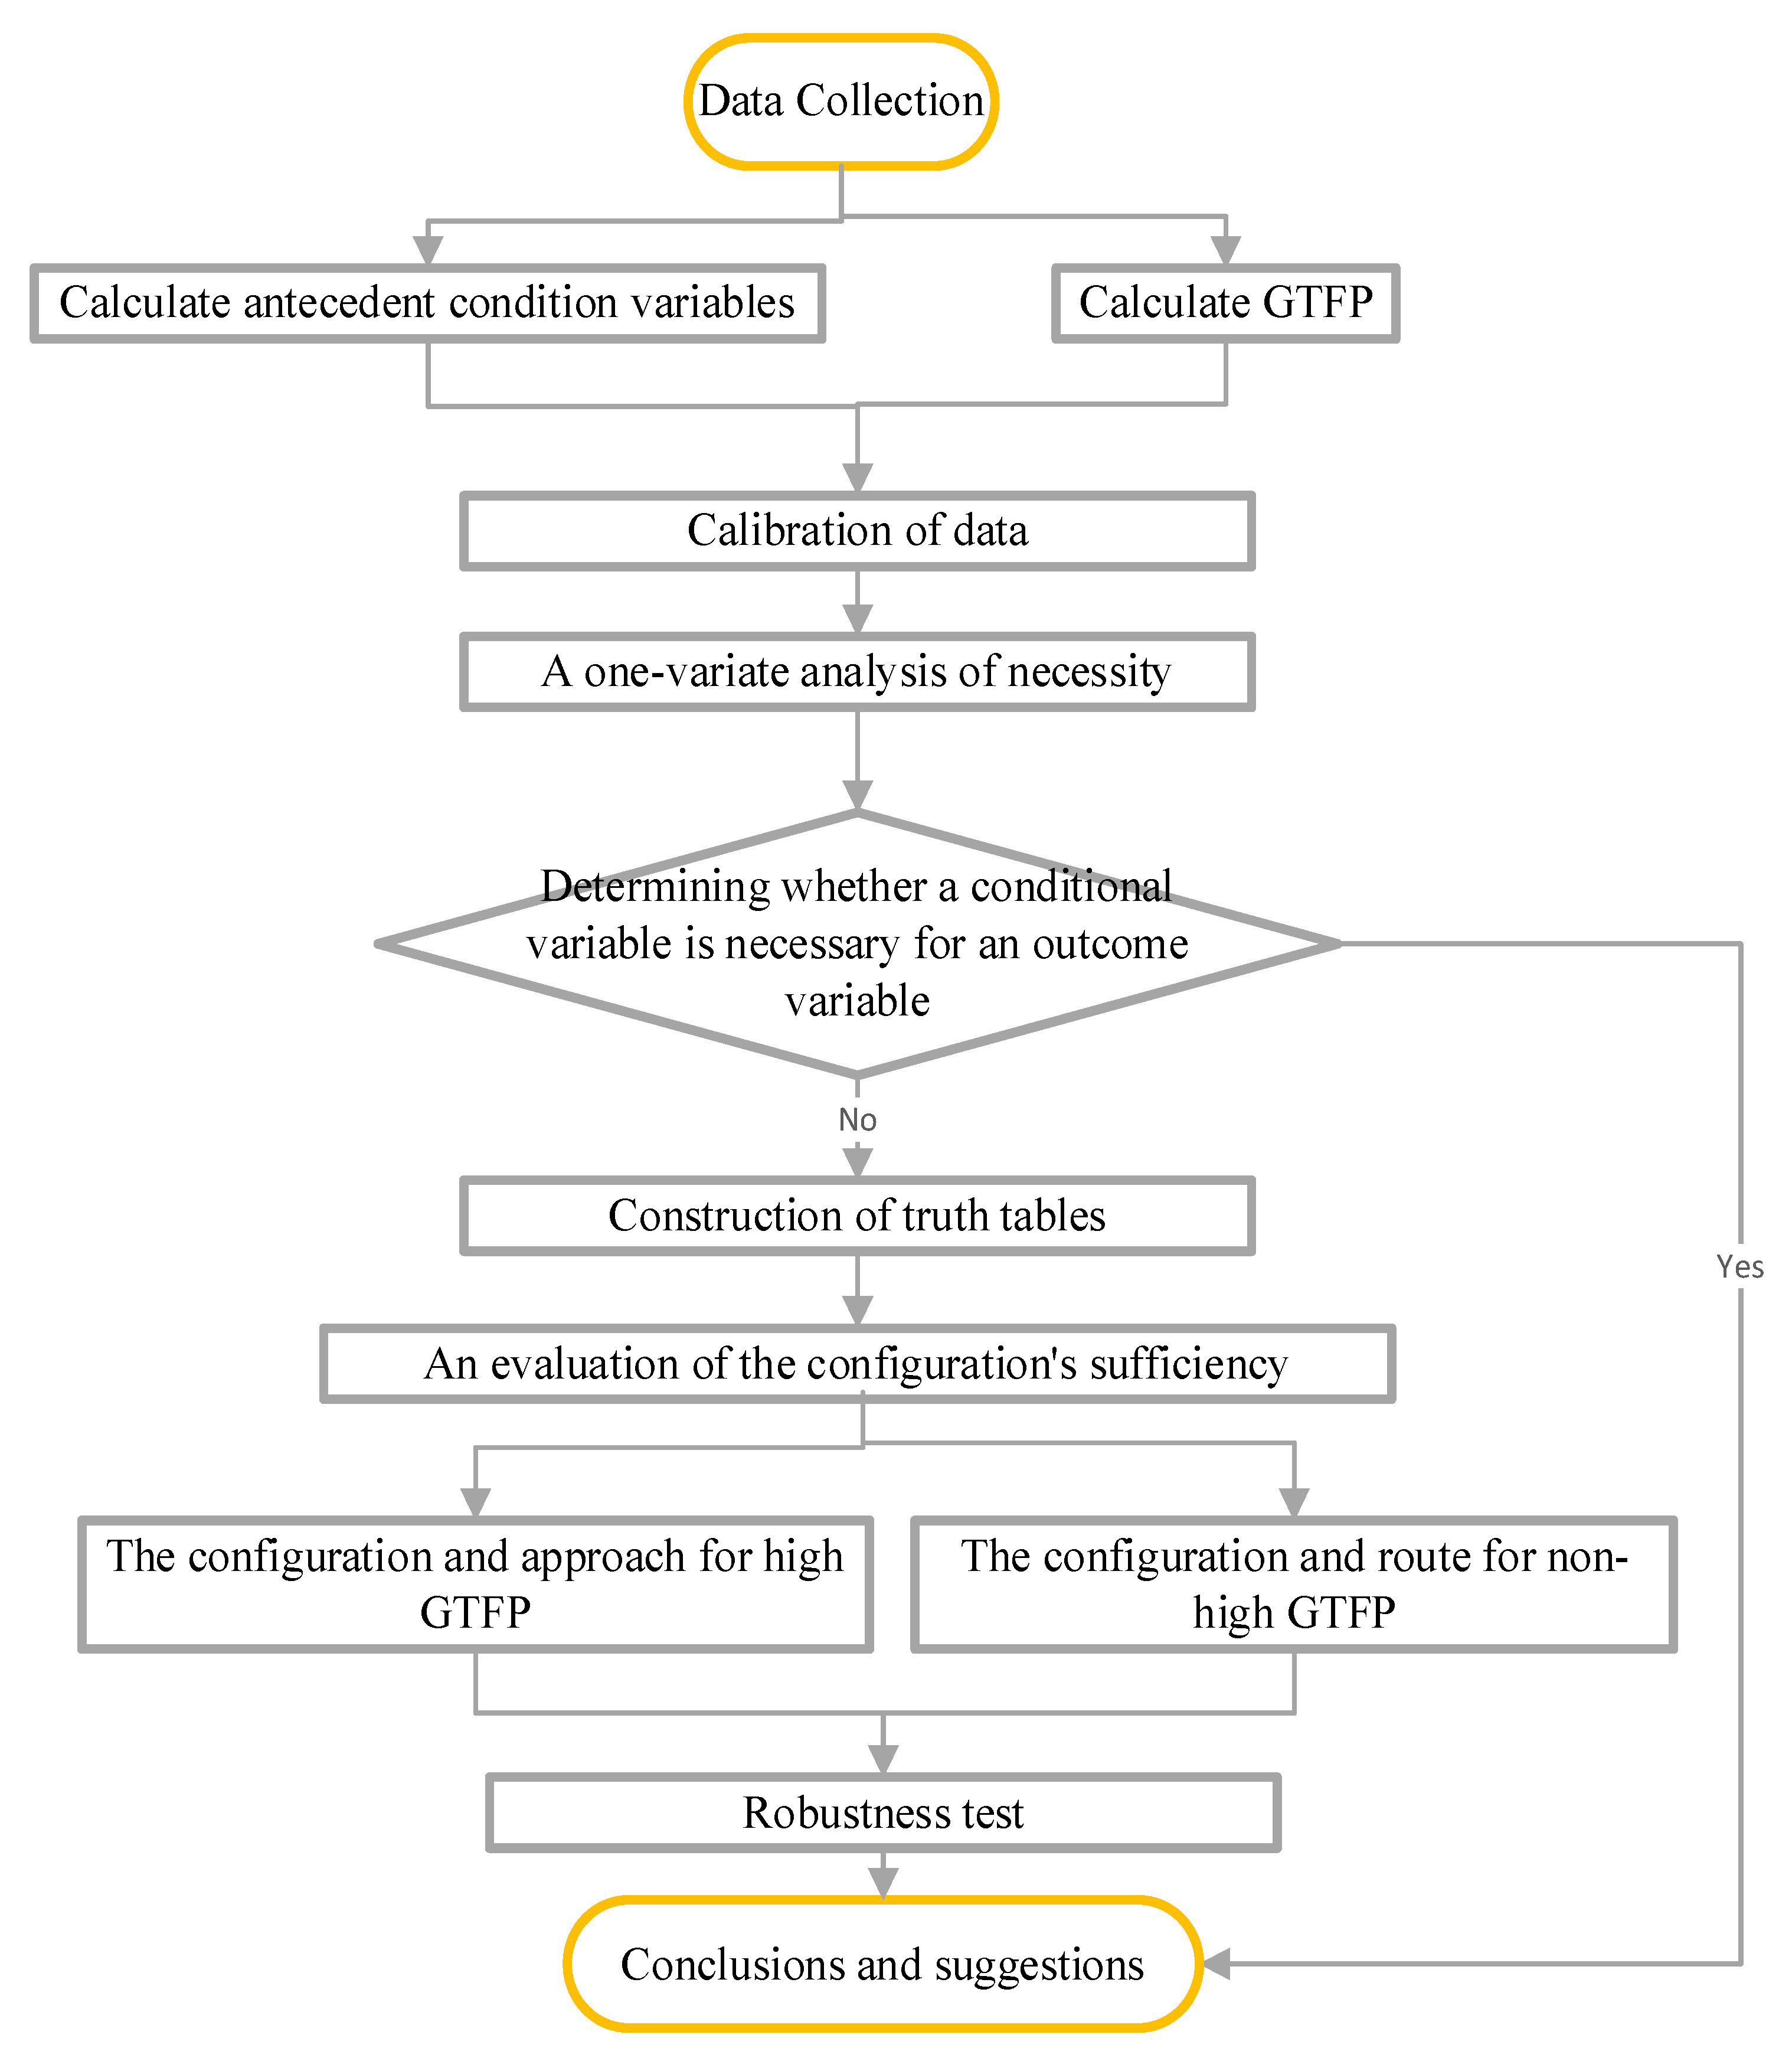
2. Materials and Methods

2.1. Research Techniques

A technique called fsQCA compares the effects of various combinations of antecedent variables on outcome variables in a defined number of cases to combine “case-oriented” qualitative analysis and “quantitative-oriented” quantitative analysis. It uncovers the intricate causal connections between variables and broadens the affiliation between various sets [23]. In general, fsQCA aims to identify the causal link between each antecedent condition and the outcome variable and to examine which configuration combinations of the antecedent condition can contribute to desired outcomes and which combinations result in undesirable outcomes. The fsQCA method is utilized in this study for the following reasons: (1) small and medium-sized samples can be used with fsQCA. This research contains 30 examples, a small sample size, and fsQCA is more accurate. (2) fsQCA focuses on the intricate causal relationships among numerous variables and follows the antecedent combinations that generate the result of the outcome, which is the effect this study is trying to produce. In order to synthesize real-world experience into more pertinent and realistic findings and to offer academic support for the growth of various provinces, the fsQCA is adopted in this work.

2.2. Theoretical Framework for TOE

Using settings for technology implementation, the TOE theoretical framework provides a thorough analysis approach. The theoretical model strongly emphasizes the influence of multi-level technology application contexts, such as technology application scenarios, the degree of organizational fit with technology applications, and organizational needs on the efficacy of technology applications [24]. Three tiers of these application context aspects are taken into account by TOE theory: technology, organization, and environment. The technical components comprise technical resources and competencies, which impact the particular consequences of technology within the company [25]. The organizational level considers elements, including the organization’s size, resources, structure, and institutional arrangements [26]. Market structure, outside pressure, and other organizational environments for applying technology are environmental influences [27]. The theory has been widely applied in the study of urban governance [28], e-government [29], industry growth [30], and other aspects.
Six antecedent circumstances that have an impact on GTFP at the technical, organizational, and environmental levels are outlined in this research.
(1)
Technical Conditions. This covers the two secondary conditions of information construction and innovation capacity. Continuous innovation is necessary for technological advancements. Innovation influences the volume, structure, and efficiency of inputs and outputs as a critical strategy for improving the effectiveness of resource allocation, factor flow, and combination [31]. It is a significant impetus for the advancement of GTFP [32]. New technologies and processes improve GTFP by reducing energy use and pollution emissions per unit of output. Another way is by replacing or transforming old processes, high-pollution, and high-energy-consumption enterprises through the widespread application of new energy and other scientific and technological innovations, fostering the growth of green industries and improving GTFP [16].
The level of information development affects how widely green technology is used. On the one hand, relying on the developed information network to break the time and space constraints and information shackles assists businesses in avoiding risks, lowering operating costs, increasing work and production efficiency, assisting in resource sharing, advancing technology, and advancing the GTFP. On the other hand, traditional manufacturing has been encouraged to implement supply-side reform by the Internet’s emergence of new industries, technology, and business models. Enterprises have significantly increased resource allocation effectiveness and decreased resource waste and environmental pollution through personalized, intelligent, and scientific flexible production. These impacts, however, may not always be linear, and a process of influence that first blocks and then encourages may exist [33]. This is because other variables could interact with it [17].
(2)
Organizational Conditions. This consists of two secondary criteria: the organization’s industrial structure and environmental regulation. The organization’s green environment will direct and control specific organizational behavior. Environmental rules can direct businesses to create environmentally friendly green technologies, allowing for ongoing improvement of GTFP while considering the economy’s and environment’s balanced growth. There are several perspectives on how environmental regulations affect GTFP. One is the “compliance cost effect,” which contends that regulations increase the price of pollution control, stifle technological innovation, and reduce green productivity. The second is the “Porter hypothesis,” which contends that some environmental regulations can force high-polluting businesses to innovate technologically and encourage local businesses to lead in developing environmentally friendly green technologies. The compensating effect of innovation will offset the high R&D costs and encourage businesses to increase their investment in research and energy conservation, and emission reduction [34,35].
The effectiveness of resource use, the standard of environmental protection, and the course of economic development are all influenced by industrial structure. Traditional high-emission industries have been forced by the advanced industrial structure to gradually transition into environmentally friendly low-carbon industries, effectively slowing the rise in pollution, spurring investment in technology research and development, encouraging the replacement of outmoded equipment, significantly reducing environmental pollution, and encouraging the improvement of GTFP [36]. The improvement of resource utilization efficiency and production efficiency through the rational allocation of resource factors is achieved by paying attention to the degree of coupling between production factor input and output, focusing on the effective use of production factors across industries and rationalizing industrial structure.
(3)
Environment Conditions. This specifically covers the degree of openness and economic status as secondary variables. They apply green technologies, implementing green policies, and promoting green concepts inside a company, which all impact the macro environment. The regional GTFP is affected by the flow of various production elements, industrial structure and concentration, and energy consumption. The economic level reflects output and living standards, consumption levels, and capital accumulation of the local population [37]. Early in the economic cycle, rapid economic growth necessitates a low threshold for environmental constraints. The support of significant financial resources accelerates technological advancement, offsetting the detrimental effects on the environment and fostering an improvement in regional GTFP. When economic growth reaches a certain point, resource scarcity and environmental degradation problems become more severe. Because of the current state of technology, economic growth is unable to fully offset these issues, which leads to a decline in GTFP.
Opening up to the outside world has provided China’s economic development with a large environment, enormous resources, and new opportunities and is a primary driving force for economic progress. When a country is opening up to the outside world, if the majority of the foreign investment involved in import and export trade is absorbed into high technology, low energy consumption, low pollution, and high-quality industries, it can produce a technology spillover and demonstrate effects through the introduction of advanced technology and management experience; bring progress in technology, management, and innovation ability for local enterprises; and promote technological advancement and quality of life in the country [31]. If the industries involved in import and export trade and foreign investment absorbed are mostly low-tech, high-energy-consumption, high-pollution, and low-quality industries, the host country will be subjected to increased pollution as a result of the transfer of pollution from the aforementioned foreign industries. This will not only fail to improve the host country’s environmental performance, it will also cause the regional GTFP to decline as the local natural environment deteriorates and environmental management costs rise [38].
In summary, this paper develops a TOE theoretical framework model that considers six antecedent factors influencing GTFP. According to the configurational theory, each conditioning element interacts and synergistically influences one another rather than acting independently. The synergistic effects among conditions can either reinforce or counteract one another. Numerous academic investigations have also shown that the interactions between the factors mentioned above and subject variations change the direction [21,39] and consequences [40,41] of their interactions on GTFP. As a result, the fsQCA approach is used in this paper to include six secondary antecedent circumstances from the triple framework of technology, organization, and environment in the research and investigate how they interact to affect GTFP. The research framework is shown in Figure 1.

2.3. Variable Headings and Information Sources

To examine the contributing elements and various enhancement paths of GTFP in each location, 30 Chinese provinces (cities and districts) were chosen as the study cases. Data from 2016 to 2018 were chosen for each variable indicator to determine the mean values due to changes in the statistical caliber of some indicators. Tibet is omitted since there are some missing data. The China Statistical Yearbook, China Environmental Statistical Yearbook, China Science and Technology Statistical Yearbook, China Energy Statistical Yearbook, and the EPS database were used to compile the data for this study.

2.3.1. Metrics and Outcome Variables

The paper’s outcome metric is GTFP. This paper builds on Xu’s research in [42] by introducing the GML index based on the SBM directional distance function to measure GTFP in each province and city from 2016–2018 and find the mean values to substitute in the subsequent empirical study. This is done to achieve global comparability of the production frontier and effectively deal with radial and angular issues. The input indicators: (1) the labor force, which is represented as the total number of employees in each province at the end of the year. (2) Capital stock, defined as capital stock acquired using the perpetual inventory approach. (3) Energy consumption, calculated using the widely used standard coal conversion technique as the sum of all energy consumption. The output indicators: (1) Expected output GDP, calculated by converting the GDP deflator for each province to the GDP’s actual value of 2000, the base year. (2) Undesirable outputs: Industrial wastewater, general industrial solid waste, CO2, and industrial SO2.
The following are the precise measuring steps:
  • Global Production Possibility Set
Considering the Kth region as the decision unit DK, assume that DK adds N factor inputs x = (x1,…, xn) ∈ R+N, and obtains M desired outputs y = (y1,…, yn) ∈ R+M and I non-desired outputs b = (b1,…, bn) ∈ R+I, and then DK’s period. The inputs and outputs in period t are denoted as (xkt, ykt, bkt). Considering the phenomenon of technological regression in the production possibility set in the current period, we directly construct the full domain production possibility set PG(x):
P G ( x ) = { ( y t , b t ) : t = 1 T k = 1 K z k t y k m t y k m t , m ; t = 1 T k = 1 K z k t b k i t b k i t , i ; t = 1 T k = 1 K z k t x k n t x k n t , n ; t = 1 T k = 1 K z k t = 1 , z k t 0 , k ;
where, ztk is the weight of each cross section, ztk ≥ 0 means constant payoff to scale (CRS), and k = 1 K z k t = 1 , ztk ≥ 0 means variable payoff to scale (VRS).
2.
SBM model
The full domain SBM directional distance function can be expressed as:
S v G ( x t , k , y t , k , b t , k , g x , g y , g b ) = max s x , s y , s b 1 N n = 1 N S n x g n x + 1 M + I ( m = 1 M S m y g m y + i = 1 I S i b g i b ) 2 s . t . t = 1 T k = 1 K z k t x k n t + s n x = x k n t , n ; t = 1 T k = 1 K z k t y k m t s m y = y k m t , m ; t = 1 T k = 1 K z k t b k i t + s i b = b k i t , i ; k = 1 K z k t = 1 , z k t 0 , k ; s m y 0 , m ; s i b 0 , i
where (gx, gy, gb) denote the direction vectors of input reduction, desired output increase, and non-desired output reduction, respectively, and (Sxn, Sym, Sbi) are the slack vectors representing the quantities of input redundancy, desired output deficiency, and non-desired output excess, respectively.
3.
GML index
G M L t t + 1 = 1 + S V G ( x t , y t , b t , g x , g y , g b ) 1 + S V G ( x t + 1 , y t + 1 , b t + 1 , g x , g y , g b ) = G E C t t + 1 × G T C t t + 1
The GML index represents the change in period t + 1 relative to period t. If the index is greater than 1, it means that GTFP is increasing; if it is less than 1, it means that GTFP is decreasing; if it is equal to 1, it means that GTFP is in a stable state.

2.3.2. Metrics and Antecedent Conditions

The factors in this investigation are listed in Table 1, along with their measurements. (1) Innovation capacity (IC): The variable innovation capacity was obtained using the entropy weighting method. Internal expenditure on research and experimental development (R&D) funds and R&D personnel were used to indicate innovation inputs, and technology market turnover and patents were used to indicate innovation outputs. (2) Information construction (IL): After entropy weighting, information construction is shown by Internet penetration rate, road mileage per unit area, and the ratio of road mileage to total population at the end of the year. (3) Environmental regulation (ER): Following entropy weighting, the rate of industrial sulfur dioxide removal, the number of actual participants in the environmental protection system, and the number of environmental cases that resulted in administrative sanctions all indicate the level of environmental regulation. (4) Industrial structure (IS): By entropy-weighting the advanced industrial structure (AIS) and the rationalization of industrial structure (RIS), the industrial structure index is created. (5) Economic level (EL): select the GDP per capita that best reflects the level of economic development. (6) Degree of openness (DO): The degree of openness is calculated by entropy-weighting total import and export/GDP and foreign direct investment/GDP, which measure the level of foreign trade and foreign investment, respectively:
A I S a = Δ v 3 Δ v 2
A I S b = 1 Δ v 1 + 2 Δ v 2 + 3 Δ v 3
P i = v i i = 1 n = 3 v i
Q i = s i i = 1 n = 3 s i
R I S 2 = 1 i = 1 n = 3 ( P I ln P i Q i )
where vi denotes the output value of industry i (i = 1,2,3); Δvi denotes the value added of industry i; Pi denotes the proportion of output value of industry i to total output value; and si denotes the proportion of employees in industry i to the total employees.

3. Results

3.1. Calibration of Data

Data calibration is the first step in fsQCA. Each antecedent condition and outcome variable in fsQCA is handled as an ensemble, and data calibration is the act of giving each instance an ensemble affiliation score [43]. The research of Fan [44] is referred to in this paper. The 95% quantile, 50% quantile, and 5% quantile are set as three anchor points corresponding to the thresholds of full affiliation, crossover, and incomplete affiliation, respectively. As a result, the six antecedent conditions and one outcome variable are calibrated to be between 0 and 1. This paper combines the partisan affiliation of the crosspoint values with the actual analysis of the related conditions and refers to Fiss [45] because individual affiliation scores of 0.5 after calibration will prevent the cases in which they are located from being included in the subsequent analysis and affect the results. Table 2 displays the calibration anchors for each variable.

3.2. A One-Variate Analysis of Necessity

A single-variable necessity analysis must be conducted first. In a necessity analysis, the relationship between a single antecedent variable and its onset and the outcome variable and its onset is tested. If an antecedent variable is required for the outcome variable, it must exist before the outcome variable and not appear before the antecedent variable in the same observation. The presence or absence of a necessary condition is typically evaluated based on the consistent results when employing fsQCA for necessity analysis. The consistency level’s cutoff value is 0.9. The antecedent variable is deemed necessary for the result variable when the consistency level is higher than 0.9 [46]. The coverage level indicates the percentage of this condition that is always necessary.
For 30 provinces (municipalities and autonomous areas) in China, Table 3 examines the need for GTFP and its antecedent variables. There is no single essential condition variable among these antecedent factors that cause high GTFP or non-high GTFP, as shown from Table 3’s consistency level for all six antecedent variables of GTFP and their non-set. This further shows that achieving high GTFP is not always possible with just one conditional variable and that additional combinations of adequacy analyses of each antecedent variable of GTFP are required.

3.3. Building Truth Tables

The combinations of states generated by the logically existing antecedent variables, along with their number of cases, raw consistency scores, and PRI consistency scores, will be listed in detail through the truth table before the adequacy analysis. The consistency threshold for parameter setting is set to 0.8. The case frequency criterion is selected as 1, considering that this study has 30 instances, which is a small and medium-sized sample. Conversely, antecedent variables with affiliation scores more than 0.5 are given a value of 1, while those with affiliation values less than 0.5 are given a value of 0. Reference is made to Patala [47] to prevent the concurrent appearance of attribute combination subset relations when the results and no attributes are combined. We follow Patala’s recommendation to assign a value of 1 to the results of combinations with PRI consistency greater than 0.6 and a value of 0 to the results of combinations less than 0.6 to prevent the appearance of attribute combination subset relations when there is no attribute combination. In order to generate high GTFP, three types of combinations must satisfy certain requirements. Table 4 displays the specific outcomes. Among them, the combinations with the highest levels of innovation capacity, information construction, environmental regulation, industrial structure, openness, and economic level have the most significant number of cases, indicating that it is the most representative.

3.4. An Evaluation of the Configuration’s Sufficiency

The legal analysis by fsQCA produces three answers after building the truth table: complex, intermediate, and parsimonious solutions [23]. There are no logical leftover terms or counterfactual combinations in the complex solution. The conclusion is too simple and might not be consistent with reality because the simple answer comprises all logical residuals and contains many counterfactual combinations. The in-between answer is the intermediate one, and the conclusion is generally applicable and frequently employed in practical applications. This paper’s findings are provided by Fiss [45]. As seen in Table 5, the findings are presented using Fiss’ results presentation. The core conditions affect the outcomes significantly and are present in both the intermediate and parsimonious solutions. Marginal conditions have an auxiliary impact on the outcomes and are conditions that only show up in the intermediate solution and not the simplex solution. The absence of a blank denotes whether the condition is present or not. Coverage shows how much the antecedent variable contributes to explaining the findings.

3.4.1. The Configuration and Approach for High GTFP

Seven solutions result in high GTFP as shown in Table 5, and each of their solution consistency levels is higher than 0.85 [48]. The overall solution consistency level is 0.880, meaning that 88% of the cases satisfying the seven solutions also offer high GTFP. With an overall solution coverage level of 0.717, these seven solutions can account for 71.7% of the instances with high GTFP. In light of this, all seven of these solutions provide sufficient combinations of factors for high GTFP. This paper divides these seven isomorphs into two paths according to their core causal conditions for analysis to further elucidate the synergistic link of each antecedent variable on high GTFP in light of the isomorphic results.
  • Type of organizational management
Since H1a, H1b, H1c, and H1d share the same core causal conditions—high industrial structure and high environmental regulation at the organizational level—they are grouped and examined as the “Organizational management“. H1a suggests that if the core causal criteria of environmental regulation and industrial structure are met, high innovation capability, high openness, and high economic level can yield high GTFP. This solution includes Chongqing, Beijing, Zhejiang, Jiangsu, Guangdong, Shandong, and Liaoning. Six examples are shared by H1a and H1b (Beijing, Zhejiang, Jiangsu, Guangdong, Shandong, and Liaoning). H1c implies that even while low levels of environmental regulation and industrial structure exist in the marginal condition, substantial levels of environmental regulation and industrial structure exist in the core condition. The province of Sichuan corresponds to this category. According to H1d, high GTFP can be produced even with poor innovation ability, low openness, and average economic level when there is high environmental control, high industrial structure, and a high level of information construction in the peripheral condition. Shanxi fits in with this group.
A handful of cases are located in the more developed provinces in the western and central regions, but most of the cases included in this path are found in the eastern coastal provinces. The coastal cities of Zhejiang and Guangdong have quickly attained comprehensive coverage of information networks and rapid improvement of innovation levels based on their superior physical placements. This has accelerated the transformation of old and new dynamics in the province. At the same time, its proximity to the sea allows for regular external exchanges and easy trade flows, which promotes the growth of international markets and creates new types of supply chains and industrial chains. This contributes to a developed economy and an advanced and rationalized industrial structure, which aids in achieving high GTFP. Liaoning and Shandong are among the top ten in the nation for industrial structure rationalization, despite not being as developed as Zhejiang and Jiangsu. Shandong also tops the nation for the number of administrative environmental penalty cases, demonstrating the strength and tenacity of environmental regulation in Shandong and Liaoning. The development of local tourism and other tertiary industries is fueled by western regions such as Chongqing’s good natural environment and dense transportation network, making it a center of financial and consumer concentration in western China. This has prompted the local government to have higher environmental standards and feed the advanced industrial structure, focusing on the development of advanced manufacturing and service industries, which is conducive to achieving high GTFP. The number of persons involved in the environmental protection system and the number of cases involving environmental protection is higher in central provinces such as Shanxi because of their abundant mineral resources and strict environmental protection rules in industrial development. Government regulation and policy restrictions force it to produce high GTFP.
2.
Type of technical support
Since H2a, H2b, and H2c share the same core causal conditions—high innovation capacity and high information construction at the technological level—they are collectively referred to as “Technical support” in the analysis. According to H2b, under the core causal conditions of high innovation capacity and high information construction, proper environmental regulation and good openness can counteract the effects of low industrial structure and low economic level, as is the case in Anhui and Henan, and eventually lead to high GTFP. According to H2c, regions with high innovation capacity and information construction can still produce high gross domestic product (GDP) levels despite having a low industrial structure and insufficient openness due to their advanced economic levels and environmental regulations. Hubei is appropriate in this circumstance.
The developed eastern and some central provinces follow this kind of route. Among them, Shanghai, Jiangsu, and Fujian are coastal cities. As a result of their ideal locations, these cities enjoy favorable trade and information exchanges that support the expansion of high-tech businesses and contribute to local economic development. They also have a lot of universities and research centers, as well as much high-caliber personnel, which gives them good human and financial resources for their innovation, which ends up being an endogenous factor for increasing GTFP. Beijing and some other locations simultaneously fit into categories H2a, H1a, and H1b. As the country’s capital, Beijing benefits from clear political advantages, cluster effects, an abundance of talent, and resources in science, technology, education, culture, and information. Autonomous innovation demonstrated in highlands such as Zhongguancun also attract scientific research talent, assisting in the growth of high-tech and high-end service sectors and providing an advanced and rationalized industrial structure. Environmental restrictions are more potent and effective due to the increased focus on the environmental issues brought on by industrial pollution. The GTFP in Beijing comes in second place. As a municipality directly under the central government, Tianjin has clear resource advantages. Beijing’s transfer of talent capital and new industries also brings innovation advantages. The city’s port stimulates the growth of the local logistics sector and creates a wide-ranging information network, all of which are essential factors in the rise of its gross domestic product (GDP). Due to their advantageous geographic location, central provinces such as Hubei and Henan, for instance, have excellent water and land transportation networks. The establishment of the Zheng Luo Xin Self-Innovation Zone and the Wuhan East Lake Self-Innovation Zone has steadily improved these regions’ capacity for innovation and propelled digitalization to the fore, which has become the driving force behind their GTFP improvement.
Additionally, a comparison of solutions H1a and H1b shows that regions that create an industrial structure model appropriate for the region and establish highly compatible environmental regulations can substitute one or another to support the region’s GTFP regardless of whether or not their environmental conditions are still present. This demonstrates how the innovative capacity of developing regions may compensate for information occlusion and how a developed information network can address any technical issues brought on by a lack of innovation. Second, when combinations H2b and H2c are compared, the degrees of openness and economic level can both be substituted by regions with solid innovation capacity and complete information construction. This demonstrates that the international circular economy generated by the region’s open platform can compensate for the region’s internal economic development’s bottleneck and that the benefit of internal economic development can compensate for the internal economic development’s disadvantage. Comparing H1a, H1b, and H2a, it can be seen that in areas with relatively good economic levels and openness, the combination of environmental regulation and industrial structure can be replaced with the combination of innovation capability and information construction. This is because solid information network construction and better innovation capability as a technology drive are the internal boosts and endogenous driving forces for GTFP improvement.

3.4.2. The Configuration and Route for Non-High GTFP

Because of asymmetric causality, it is possible that the causes of non-growth are different from the causes of growth [49]. Therefore, we analyzed the non-high GTFP with the principle of asymmetric causality.
We researched the regions and antecedent solutions corresponding to non-high GTFP to conduct a more thorough study after analyzing the locations that produce high GTFP and their antecedent solutions. A total of 86.9% of the cases that satisfy the five solutions, as shown in Table 6, present non-high GTFP. The five solutions that create non-high GTFP each have individual solution consistency levels larger than 0.85 and an aggregate solution consistency level of 0.869. These five solutions can account for 70.4% of cases, according to the coverage level of 0.704, which is calculated. These five solutions thus represent sufficient sets of non-high GTFP circumstances. These five isomorphs were grouped into two routes in this research to understand further the synergistic relationship of each antecedent variable on non-high GTFP based on the isomorphic results.
(1)
Type of organizational management deficit and environmental support deficiency.
The core causal conditions that unite solutions NH1a, NH1b, and NH1c are a lack of environmental transparency and environmental control at the organizational level. The collaborative study refers to them as “Organizational management deficit and environmental support deficiency.” According to the solution NH1a, low innovation capacity at the peripheral condition, limited information construction, low and illogical industrial structure, and a lack of environmental control at the core conditions all contribute to a non-high GTFP situation. This combination includes Ningxia, Guangxi, Jilin, Yunnan, Xinjiang, Guizhou, and Inner Mongolia. According to NH1b, limited innovation ability in marginal conditions, inadequate environmental control in core conditions, inadequate information construction, and a low economic level contribute to non-high GTFP. This combination includes Guangxi, Gansu, Yunnan, Xinjiang, and Guizhou. Guangxi, Yunnan, Xinjiang, Guizhou, and Qinghai all belong to this category for the situation of poor environmental management and openness, according to NH1c. These three clusters share certain occurrences, demonstrating that low regional GTFP will result from a lack of environmental control, the closure of the region to the outside world, and a lack of innovative capacity.
The majority of the provinces along this route are found in the west. However, the lack of resources and low economic level force them to engage in some polluting enterprises, and some western regions have become the “pollution refuge” for polluting enterprises because of the complex ecological environment, harsh climatic conditions, and remote geographic location, which causes difficulties in opening up and backward economic development. The output of general industrial solid waste, sulfur dioxide, other gases, and wastewater emissions in the western area are all significantly higher than those in the eastern and central regions, according to data from the China Environment Statistical Yearbook for 2021. This shows that the government has not yet implemented pollution control regulations, resulting in a non-high GTFP state.
(2)
Type of organizational management imbalance and technological support deficiency.
A core causal condition unites the solutions of NH2a and NH2b: a lack of information construction, an overabundance of environmental regulation, and a weak and irrational industrial structure. As a result, they are integrated into one path analysis and given the name “Organizational management imbalance and technological support deficiency.” The solution NH2a suggests that if the regional innovation capability, openness, and economic level are all behind, it will result in the development of non-high GTFP in the event of low information construction, illogical industrial structure, and excessive environmental regulation. This condition is consistent with the province of Hebei. The solution NH2b shows that even if the marginal conditions have a high capacity for innovation and a high economic level, they will not result in high GTFP when the industrial structure and information construction of the core conditions are also lacking, as when there is strict environmental regulation. This condition is consistent with Shaanxi province.
Hebei’s geographic advantage is eliminated by the “siphon effect” of its powerful surrounding provinces [50]. Hebei is near Beijing and Tianjin. Because of these two municipalities’ superior public services, administrative resources, educational resources, and policy dividends, much top-notch talent is drawn to the region. However, Hebei did not benefit as much from its high-quality factors since Hebei’s high-quality resources instead flowed out more. This, combined with the province’s poor investment in education, caused a talent shortage, leading to high-tech industries giving Beijing and Tianjin precedence. Traditional industries such as steel, petrochemicals, equipment manufacturing, construction materials, and textiles have grown in Hebei. Hebei now has excessive environmental laws due to its locational mission and illogical industrial structure. It is challenging to introduce cutting-peripheral technology and new industries in Shaanxi because of its location in the inland hinterland, which has a limited information network and few significant benefits in terms of communication and transportation. It still relies heavily on conventional sectors such as the manufacturing of automobiles, electronics, and consumer products. As a result, the industrial structure in the provinces is highly developed and well-organized. Despite the attention it receives, environmental control nevertheless results in the production of non-high GTFP.

3.5. Analysis of Regional and Correspondence Paths

After summarizing the various paths corresponding to regions and provinces, as shown in Table 7, it is discovered that the high and non-high GTFP generation and the high GTFP improvement strategies have blatant geographical distribution features. The eastern, middle, and western areas contain the bulk of the provinces with GTFP solid realization. Moreover, whereas the western region is dominated by organizational management-based strategies alone, the eastern and central regions obtain high GTFP through two strategies: organizational management-based and technical support-based. The central and eastern regions, as well as the western area, individually, contain the respective provinces of non-high GTFP. The leading causes of the non-high GTFP in the western provinces are poor organizational management and insufficient environmental support. Due to an imbalance in organizational administration and a lack of technical assistance, Shaanxi province in the west and Hebei province in the center are suffering. Jilin province in the east is solely a result of a lack of environmental support and organizational management.

3.6. Tests for Robustness

This study modifies the consistency threshold to run the robustness test. The resultant combination states (as indicated in Table 8 and Table 9) are consistent with the prior combination states when the consistency threshold is changed from 0.8 to 0.85 [43]. Additionally, their individual and collective consistency are higher than 0.85, proving that they pass the robustness test. High environmental regulation, high industrial structure, high innovation capacity, and high information construction are the core causal prerequisites for high GTFP at both the technological and organizational levels. Low environmental regulation, low openness, low information building, low industrial structure, and solid environmental regulation are significant prerequisites for non-high GTFP.

4. Conclusions and Suggestions

Using 30 Chinese provinces (municipalities and autonomous regions) as a case study, we use fsQCA to conduct a configurational analysis of the external environmental factors affecting GTFP and study their multiple concurrent causal relationships and multiple paths. This helps to clarify the multiple paths to achieving high GTFP. The following are the key conclusions. (1) Two pathways produce high GTFP: Type of organizational management with high industrial structure and high environmental regulation as the core conditions, and type of technical support with high innovation capacity and high information construction as the core conditions. The provinces that fall under the first pathway are found mainly in eastern China, where having an advanced and sustainable industrial structure and organizationally regulated environmental rules are essential for reaching high GTFP. The provinces that correspond to the second route are in China’s eastern and central regions. The core conditions for achieving GTFP are their exceptional capacity for innovation and vast information construction at the technological level. (2) There are two ways to produce non-high GTFP: Type of organizational management imbalance and technological support deficiency with low information construction at the technical level, high environmental regulation at the organizational level, and type of organizational management deficit and environmental support deficiency with low industrial structure at the organizational level, and low information construction at the technical level as the core conditions. The first approach is seen chiefly in western China, where a lack of organizational environmental management and openness are the main factors. The second path is found in central and western China. Its main constraints are a dearth of technological knowledge construction, an excess of administrative environmental control, and an inadequate and irrational industrial structure. (3) Innovation capability and information construction in technological conditions, openness and economic level in environmental conditions, and the combination of environmental regulation and industrial structure in conditions can all be substituted for the combination of innovation capability and information construction under certain circumstances. The eastern and central areas of China implement two GTFP enhancement strategies—organizational management-based and technological support-based—to achieve these goals. These strategies have important regional distribution characteristics. There is only one form of organizational management dominant in western China.
These are primarily the policy repercussions of this article.
(1)
Regions with high GTFP levels should keep improving the prerequisites for the path type they are on. The development, dissemination, and application of new technologies should be encouraged to sustain the landing of emerging and high-tech industries. Technology-supported types should also use innovation highlands, such as self-innovation zones and high-tech zones, to drive the optimization and upgrading of the overall regional industrial structure. Specifically, to assist in the transformation and modernization of conventional regional industries using the Internet, the pioneer industries can be encouraged to take the initiative in fully utilizing blockchain, big data, and artificial intelligence penetration. Government policies on regional development should be fully embraced as a directing factor and a binding force by organizational management styles. The province’s industrial development should be entirely under the control of the government, which should also reasonably regulate the upgrading and transformation of the regional industrial structure to meet domestic demand and develop environmental regulation policies that support regional industrial development and ecological protection. To aid in the advanced growth of local industries, it can specifically introduce foreign investment or independently develop and establish high-tech, environmental protection, and new energy sectors. To encourage businesses in the area to take on the responsibility of energy conservation and green development, local governments should develop environmental regulation tools that match the intensity of regional environmental protection supervision and fully utilize environmental protection taxes and emissions trading. Finally, local governments should step up their education and propaganda efforts, promote all stakeholders’ shared involvement in environmental protection oversight, and encourage social parties to contribute to green development.
(2)
For regions that have not attained high GTFP, provinces that lack environmental support and organizational management are primarily found in the economically underdeveloped western region, allowing them to utilize the “Belt and Road fully” and “Western Development” strategies to continue to open up to the outside world to improve economic efficiency. The country should avoid becoming a “pollution sanctuary” by developing proper environmental control rules, raising the environmental threshold for foreign capital to enter the province, and ensuring the quality and manner of enterprise introduction. While local businesses should be encouraged to actively collaborate with foreign businesses to develop cutting-edge peripheral technologies and equipment suitable for improving the pollution of traditional local industries, local resources and advantages should be combined with a targeted selection of high-efficiency, low-pollution, high-tech foreign enterprises in the specific implementation. At the same time, the intensity of environmental regulations should be determined according to local conditions and time. Dynamic environmental regulation standards should be formulated to stimulate green innovation, and time should be given to enterprises to make green transformations, avoiding one-size-fits-all policies that hinder economic deregulation in regions with the organizational imbalance and a lack of technological support. At the same time, we should actively plan transportation and information networks, build more roads, guarantee comprehensive wireless coverage, connect to the outside world physically and virtually, close the information gap between regions, and encourage new technology industries to establish themselves in the neighborhood. In order to attract investment, it is essential to define the region’s positioning and distinctive advantages, develop a distinctive investment-attraction strategy with the bordering regions, and ensure regional interaction and industrial specialization.

5. Research Participation

This paper’s research contributions concentrate on the following three aspects:
First, the study of GTFP incorporates the TOE theoretical framework. In contrast with the existing literature on GTFP influencing factors and enhancement paths, this paper improves the special, single classification method. It integrates the factors influencing GTFP into three levels: technology, organization, and environment, based on TOE theory and the unique Chinese context. This article not only offers a more standardized theoretical perspective on the research of the enhancement path of GTFP, but it also deepens the practical applications of TOE theory.
Second, it expands the research toolkit in GTFP’s influence factors and enhancing pathways. The introduction of FsQCA compensates for the inadequacies of earlier research methods in the literature.
Thirdly, with the aid of the group state perspective, we use the fsQCA method to empirically explore the concurrent synergistic effects and linkage matching patterns of multiple conditions such as technology, organization, and environment in driving GTFP in the TOE framework, which expands the application of the TOE framework in explaining “causal complexity” and, to a certain extent, resolves the dilemma currently facing the theory.

6. Opportunities and Limitations

There are still certain restrictions despite our best attempts to provide a more thorough overview of the study questions. First, by using the fsQCA approach, we could add some depth to the viewpoints and findings of previous studies by tracing the origins of the data and determining the intricacy of the causal chain. However, the number of antecedent variables is constrained in fsQCA, and when antecedent variables are added, the number of potential group states grows exponentially. As a result, our analysis only included a modest number of antecedent situations. Second, the cases chosen represent 30 Chinese provinces, giving each province a primary direction for improvement. When creating particular regulations appropriate for the province, an additional study should be conducted for the province. Future research can therefore concentrate on more complicated situations, choose more cases and circumstances, and investigate more specific fsQCA application directions in this field specifically for GTFP. Thirdly, this study did not conduct a trend analysis over time. Future research can gather additional data to investigate the temporal evolution path using fsQCA.

Author Contributions

The authors contributed to each section of the paper by conceptualization, Y.G. and S.W.; methodology, Y.G.; software, Y.G.; validation, Y.G.; formal analysis, Y.G.; investigation, H.Z.; resources, H.Z.; data curation, H.Z.; writing—original draft preparation, Y.G.; writing—review and editing, S.W. and Y.G.; supervision, S.W.; project administration, S.W.; funding acquisition, S.W. All authors have read and agreed to the published version of the manuscript.

Funding

This research was supported by the National Social Science Foundation of China (grant no. 20STA017) and the Major Project of Education Science in Henan Province of China (grant no. 2022JKZB01).

Data Availability Statement

Not applicable.

Conflicts of Interest

The authors declare no conflict of interest.

References

  1. Chung, Y.H.; Färe, R.; Grosskopf, S. Productivity and undesirable outputs: A directional distance function approach. J. Environ. Manag. 1997, 51, 229–240. [Google Scholar] [CrossRef] [Green Version]
  2. Li, J.F.; Gu, A.L.; Ma, Z.Y.; Zhang, C.L.; Sun, C.Q. Economic development, energy demand, and carbon emission prospects of China’s provinces during the 14th Five-Year Plan period: Application of CMRCGE model. Adv. Clim. Chang. Res. 2019, 10, 165–173. [Google Scholar] [CrossRef]
  3. Chen, C.; Lan, Q.; Gao, M.; Sun, Y. Green total factor productivity growth and its determinants in China’s industrial economy. Sustainability 2018, 10, 1052. [Google Scholar] [CrossRef] [Green Version]
  4. National Bureau of Statistics of China. Statistical Bulletin on National Economic and Social Development of the People’s Republic of China 2021; National Bureau of Statistics of China: Beijing, China, 2022. [Google Scholar]
  5. Zhuang, W.; Wang, Y.; Lu, C.; Chen, X. The green total factor productivity and convergence in China. Energy Sci. Eng. 2022, 10, 2794–2807. [Google Scholar] [CrossRef]
  6. Xia, F.; Xu, J. Green total factor productivity: A re-examination of quality of growth for provinces in China. China Econ. Rev. 2020, 62, 101454. [Google Scholar] [CrossRef]
  7. Yang, Z.B.; Shao, S.; Yang, L.L.; Miao, Z. Improvement pathway of energy consumption structure in China’s industrial sector: From the perspective of directed technical change. Energy Econ. 2018, 72, 166–176. [Google Scholar] [CrossRef]
  8. Hou, S.; Song, L. Market integration and regional green total factor productivity: Evidence from China’s province-level data. Sustainability 2021, 13, 472. [Google Scholar] [CrossRef]
  9. Yang, Y.; Ma, H.; Wu, G. Agricultural Green Total Factor Productivity under the Distortion of the Factor Market in China. Sustainability 2022, 14, 9309. [Google Scholar] [CrossRef]
  10. Mao, J.; Wu, Q.; Zhu, M.; Lu, C. Effects of Environmental Regulation on Green Total Factor Productivity: An Evidence from the Yellow River Basin, China. Sustainability 2022, 14, 2015. [Google Scholar] [CrossRef]
  11. Xiao, S.; Wang, S.; Zeng, F.; Huang, W.-C. Spatial Differences and Influencing Factors of Industrial Green Total Factor Productivity in Chinese Industries. Sustainability 2022, 14, 9229. [Google Scholar] [CrossRef]
  12. Li, K.; Lin, B. Economic growth model, structural transformation, and green productivity in China. Appl. Energy 2017, 187, 489–500. [Google Scholar] [CrossRef]
  13. Riti, J.S.; Song, D.; Shu, Y.; Kamah, M. Decoupling CO2 emission and economic growth in China: Is there consistency in estimation results in analyzing environmental Kuznets curve? J. Clean. Prod. 2017, 166, 1448–1461. [Google Scholar] [CrossRef]
  14. Wang, K.L.; He, S.; Zhang, F.Q. Relationship between FDI, fiscal expenditure and green total-factor productivity in China: From the perspective of spatial spillover. PLoS ONE 2021, 16, e0250798. [Google Scholar] [CrossRef] [PubMed]
  15. Driffield, N.; Love, J.H.; Taylor, K. Productivity and labour demand effects of inward and outward foreign direct investment on UK industry. Manch. Sch. 2009, 77, 171–203. [Google Scholar] [CrossRef]
  16. Zhu, X.; Chen, Y.; Feng, C. Green total factor productivity of China’s mining and quarrying industry: A global data envelopment analysis. Resour. Policy 2018, 57, 1–9. [Google Scholar] [CrossRef]
  17. Li, T.; Han, D.; Ding, Y.; Shi, Z. How does the development of the internet affect green total factor productivity? Evidence from China. IEEE Access 2020, 8, 216477–216490. [Google Scholar] [CrossRef]
  18. Loganathan, N.; Mursitama, T.N.; Pillai, L.L.K.; Khan, A.; Taha, R. The effects of total factor of productivity, natural resources and green taxation on CO2 emissions in Malaysia. Env. Sci. Pollut. Res. 2020, 27, 45121–45132. [Google Scholar] [CrossRef]
  19. Fernando, Y.; Wah, W.X.; Shaharudin, M.S. Does a firm’s innovation category matter in practising eco-innovation? Evidence from the lens of Malaysia companies practicing green technology. J. Manuf. Technol. Manag. 2016, 27, 208–233. [Google Scholar] [CrossRef]
  20. Zhang, D.; Vigne, S.A. How does innovation efficiency contribute to green productivity? A financial constraint perspective. J. Clean. Prod. 2021, 280, 124000. [Google Scholar] [CrossRef]
  21. Zhang, J.; Lu, G.; Skitmore, M.; Ballesteros-Pérez, P. A critical review of the current research mainstreams and the influencing factors of green total factor productivity. Environ. Sci. Pollut. Res. 2021, 28, 35392–35405. [Google Scholar] [CrossRef]
  22. Xiaofei, X.; Yanjuan, C.; Yundi, Z. Impact of Environmental Regulation and Fdi on Green Total Factor Productivity: Evidence from China. Environ. Eng. Manag. J. 2021, 20, 177–184. [Google Scholar]
  23. Ragin, C.C. Redesigning Social Inquiry: Fuzzy Sets and Beyond; University of Chicago Press: Chicago, IL, USA, 2009. [Google Scholar]
  24. Tornatzky, L.G.; Fleischer, M.; Chakrabarti, A.K. The Processes of Technological Innovation; Lexington Books: Lanham, MD, USA, 1990. [Google Scholar]
  25. Chau, P.Y.K.; Tam, K.Y. Factors affecting the adoption of open systems: An exploratory study. MIS Q. 1997, 21, 1–24. [Google Scholar] [CrossRef]
  26. Walker, R.M. Internal and external antecedents of process innovation: A review and extension. Public Manag. Rev. 2014, 16, 21–44. [Google Scholar] [CrossRef]
  27. Oliveira, T.; Martins, M.F. Literature review of information technology adoption models at firm level. Electron. J. Inf. Syst. Eval. 2011, 14, 110–121. [Google Scholar]
  28. Ullah, F.; Qayyum, S.; Thaheem, M.J.; Al-Turjman, F.; Sepasgozar, S.M. Risk management in sustainable smart cities governance: A TOE framework. Technol. Forecast. Soc. Chang. 2021, 167, 120743. [Google Scholar] [CrossRef]
  29. Pudjianto, B.; Zo, H.; Ciganek, A.P.; Rho, J.J. Determinants of e-government assimilation in Indonesia: An empirical investigation using a TOE framework. Asia Pac. J. Inf. Syst. 2011, 21, 49–80. [Google Scholar]
  30. Bhattacharya, M.; Wamba, S.F. A conceptual framework of RFID adoption in retail using TOE framework. In Technology Adoption and Social Issues: Concepts, Methodologies, Tools, and Applications; IGI Global: Hershey, PA, USA, 2018; pp. 69–102. [Google Scholar]
  31. Wang, K.-L.; Pang, S.-Q.; Ding, L.-L.; Miao, Z. Combining the biennial Malmquist–Luenberger index and panel quantile regression to analyze the green total factor productivity of the industrial sector in China. Sci. Total Environ. 2020, 739, 140280. [Google Scholar] [CrossRef] [PubMed]
  32. Liu, G.; Wang, B.; Zhang, N. A coin has two sides: Which one is driving China’s green TFP growth? Econ. Syst. 2016, 40, 481–498. [Google Scholar] [CrossRef]
  33. Wu, H.; Hao, Y.; Ren, S.; Yang, X.; Xie, G. Does internet development improve green total factor energy efficiency? Evidence from China. Energy Policy 2021, 153, 112247. [Google Scholar] [CrossRef]
  34. Yoon, S.; Nadvi, K. Industrial clusters and industrial ecology: Building ‘eco-collective efficiency’in a South Korean cluster. Geoforum 2018, 90, 159–173. [Google Scholar]
  35. Kim, H.H.; Lee, H.; Lee, J. Technology diffusion and host–country productivity in South-South FDI flows. Jpn. World Econ. 2015, 33, 1–10. [Google Scholar] [CrossRef]
  36. Dong, B.; Xu, Y.; Fan, X. How to achieve a win-win situation between economic growth and carbon emission reduction: Empirical evidence from the perspective of industrial structure upgrading. Environ. Sci. Pollut. Res. 2020, 27, 43829–43844. [Google Scholar] [CrossRef]
  37. Ali, G.; Ashraf, A.; Bashir, M.K.; Cui, S. Exploring environmental Kuznets curve (EKC) in relation to green revolution: A case study of Pakistan. Environ. Sci. Policy 2017, 77, 166–171. [Google Scholar] [CrossRef]
  38. Rafindadi, A.A.; Muye, I.M.; Kaita, R.A. The effects of FDI and energy consumption on environmental pollution in predominantly resource-based economies of the GCC. Sustain. Energy Technol. Assess. 2018, 25, 126–137. [Google Scholar] [CrossRef]
  39. You, D.; Zhang, Y.; Yuan, B. Environmental regulation and firm eco-innovation: Evidence of moderating effects of fiscal decentralization and political competition from listed Chinese industrial companies. J. Clean. Prod. 2019, 207, 1072–1083. [Google Scholar] [CrossRef]
  40. Li, B.; Wu, S. Effects of local and civil environmental regulation on green total factor productivity in China: A spatial Durbin econometric analysis. J. Clean. Prod. 2017, 153, 342–353. [Google Scholar] [CrossRef]
  41. Du, K.; Li, J. Towards a green world: How do green technology innovations affect total-factor carbon productivity. Energy Policy 2019, 131, 240–250. [Google Scholar] [CrossRef]
  42. Xu, X.; Huang, X.; Huang, J.; Gao, X.; Chen, L. Spatial-temporal characteristics of agriculture green total factor productivity in China, 1998–2016: Based on more sophisticated calculations of carbon emissions. Int. J. Environ. Res. Public Health 2019, 16, 3932. [Google Scholar] [CrossRef] [Green Version]
  43. Schneider, C.Q.; Wagemann, C. Set-Theoretic Methods for the Social Sciences: A Guide to Qualitative Comparative Analysis; Cambridge University Press: Cambridge, UK, 2012. [Google Scholar]
  44. Fan, D.; Li, Y.; Chen, L. Configuring innovative societies: The crossvergent role of cultural and institutional varieties. Technovation 2017, 66, 43–56. [Google Scholar] [CrossRef]
  45. Fiss, P.C. Building better causal theories: A fuzzy set approach to typologies in organization research. Acad. Manag. J. 2011, 54, 393–420. [Google Scholar] [CrossRef] [Green Version]
  46. Greckhamer, T. CEO compensation in relation to worker compensation across countries: The configurational impact of country-level institutions. Strateg. Manag. J. 2016, 37, 793–815. [Google Scholar] [CrossRef]
  47. Patala, S.; Juntunen, J.K.; Lundan, S.; Ritvala, T. Multinational energy utilities in the energy transition: A configurational study of the drivers of FDI in renewables. J. Int. Bus. Stud. 2021, 52, 930–950. [Google Scholar] [CrossRef]
  48. De Crescenzo, V.; Ribeiro-Soriano, D.E.; Covin, J.G. Exploring the viability of equity crowdfunding as a fundraising instrument: A configurational analysis of contingency factors that lead to crowdfunding success and failure. J. Bus. Res. 2020, 115, 348–356. [Google Scholar] [CrossRef]
  49. Ucbasaran, D.; Shepherd, D.A.; Lockett, A.; Lyon, S.J. Life after business failure: The process and consequences of business failure for entrepreneurs. J. Manag. 2013, 39, 163–202. [Google Scholar] [CrossRef]
  50. Gao, L.H.; Wang, G.Q.; Zhang, J. Industrial Agglomeration Analysis Based on Spatial Durbin Model: Evidence from Beijing-Tianjin-Hebei. Econ. Circ. China. Complex. 2021, 2021, 3788784. [Google Scholar]
Figure 1. Research framework.
Sustainability 14 14082 g001
Table 1. Description of variables.
Variable TypeVariable Composition
Resulting VariablesGreen Total Factor Productivity
Technical conditionsInnovative capacity (IC)Internal expenditure on R&D funding
R&D staff
Technology market turnover
Number of patents granted
Information construction (IL)Internet penetration rate
Road miles per unit area
Number of road miles/total population at the end of the year
Organizational conditionsEnvironmental regulation (ER)Industrial sulfur dioxide removal rate
Actual number of people in the environmental protection system
Number of environmental cases with administrative penalties
Industrial structure (IS)Advanced industrial structure
Rationalization of industrial structure
Environmental conditionsDegree of openness
(DO)
Total exports and imports/GDP
Foreign direct investment/GDP
Economic level (EL)GDP per capita
Table 2. Calibration anchor points for variables.
VariableFull AffiliationCrossoverIncomplete Affiliation
Resulting variablesGTFP1.0651.0321.008
Technical conditionsIC0.6360.1160.009
IL0.5300.3350.199
Organizational conditionsER0.4940.2220.122
IS0.5710.0860.032
Environmental conditionsDO0.7410.2140.029
EL122,929.94649,629.53535,482.811
Table 3. Tests of necessity for individual condition variables.
VariableHigh GTFP~High GTFP
CoherenceCoverageCoherenceCoverage
IC0.6820.7700.5030.619
~IC0.6630.5500.8130.736
IL0.7620.7050.6040.609
~IL0.5770.5720.7070.764
ER0.7330.7210.6050.648
~ER0.6420.5990.7400.751
IS0.7190.7190.5520.601
~IS0.6020.5520.7420.742
DO0.7450.7630.5450.609
~DO0.6180.5550.7880.771
EL0.7090.8020.4890.602
~EL0.6480.5380.8390.758
Note: “~” means “not” for logical operations.
Table 4. Truth table.
ICILERISDOELNumberHigh GTFPRawconsistPRIconsistSYMconsist
101111110.9920.9170.917
110111310.9900.9710.971
101100110.9850.8850.885
011111110.9840.9330.933
011100110.9770.8960.896
111001110.9370.6830.683
111010210.9190.6210.632
111111610.8710.6750.678
101001100.9150.3990.399
000110200.8570.5120.512
000010100.8490.3590.416
001000100.8370.3330.333
000100100.8180.3920.392
000001300.8000.3680.368
010000100.7260.2550.255
000000400.5900.1710.171
Table 5. Configuration of high GTFP.
Combination PathType of Organizational ManagementType of Technical Support
H1aH1bH1cH1dH2aH2bH2c
Technical conditionsIC
IL
Organizational conditionsER
IS
Environmental conditionsDO
EL
Consistency0.8790.8720.9850.9770.8850.9190.937
Raw coverage0.4530.4450.2670.2950.4930.3390.353
Unique coverage0.0040.0120.0260.0420.0700.0310.012
Overall solution consistency0.880
Overall solution coverage0.717
Note: ● = core causal condition present; • = peripheral condition present; ⊗ = peripheral condition absent; and blank indicates that it may or may not be present.
Table 6. Configuration of non-high GTFP.
Combination PathType of Organizational Management Deficit and Environmental Support DeficiencyType of Organizational Management Imbalance and Technological Support Deficiency
NH1aNH1bNH1cNH2aNH2b
Technical conditionsIC
IL
Organizational conditionsER
IS
Environmental conditionsDO
EL
Consistency0.8900.9040.8930.9070.943
Raw coverage0.5060.5120.5380.3380.276
Unique coverage0.0310.0420.0670.0240.021
Overall solution consistency0.869
Overall solution coverage0.704
Note: ● = core causal condition present; Ⓧ = core causal condition absent; • = peripheral condition present; ⊗ = peripheral condition absent; and blank indicates that it may or may not be present.
Table 7. Multiple paths and corresponding areas for GTFP in different regions.
Specific PathRegional DivisionsCorresponding Provinces and Cities
Multiple pathways for high GTFPType of organizational managementEastern partBeijing, Zhejiang, Jiangsu, Guangdong, Shandong, Liaoning
Middle partShanxi, Hunan
Western partSichuan, Chongqing
Type of technical supportEastern partBeijing, Shanghai, Zhejiang, Jiangsu, Guangdong, Tianjin, Fujian
Middle partAnhui, Henan, Hubei
Western partnone
Multiple paths for non-high GTFPType of organizational management deficit and environmental support deficiencyEastern partJilin
Middle part/
Western partNingxia, Guangxi, Yunnan, Xinjiang, Guizhou, Inner Mongolia, Gansu, Qinghai
Type of organizational management imbalance and technological support deficiencyEastern part/
Middle partAnhui
Western partShaanxi
Table 8. Robustness test of high GTFP.
Combination PathType of Organizational ManagementType of Technical Support
H1aH1bH1cH1dH2aH2bH2c
Technical conditionsIC
IL
Organizational conditionsER
IS
Environmental conditionsDO
EL
Coherence0.8790.8720.9850.9770.8850.9190.937
Original coverage0.4530.4450.2670.2950.4930.3390.353
Unique coverage0.0040.0120.0260.0420.0700.0310.012
Consistency of the overall solution0.880
Overall solution coverage0.717
Note: ● = core causal condition present; • = peripheral condition present; ⊗ = peripheral condition absent; and blank indicates that it may or may not be present.
Table 9. Robustness test of non-high GTFP.
Combination PathType of Organizational Management Deficit and Environmental Support DeficiencyType of Organizational Management Imbalance and Technological Support Deficiency
NH1aNH1bNH1cNH2aNH2b
Technical conditionIC
IL
Organizational conditionsER
IS
Environmental conditionsDO
EL
Coherence0.8900.9040.8930.9070.943
Original coverage0.5060.5120.5380.3380.276
Unique coverage0.0310.0420.0670.0240.021
Consistency of the overall solution0.869
Overall solution coverage0.704
Note: ● = core causal condition present; Ⓧ = core causal condition absent; • = peripheral condition present; ⊗ = peripheral condition absent; and blank indicates that it may or may not be present.
Publisher’s Note: MDPI stays neutral with regard to jurisdictional claims in published maps and institutional affiliations.

