Article

What Is the Policy Effect of Coupling the Green Hydrogen Market, National Carbon Trading Market and Electricity Market?

1
School of Economics and Management, China University of Geosciences, Beijing 100083, China
2
Key Laboratory of Carrying Capacity Assessment for Resource and Environment, Ministry of Land and Resources, Beijing 100083, China
3
Key Laboratory of Strategic Studies, Ministry of Land and Resources, Beijing 100083, China
*
Author to whom correspondence should be addressed.
Sustainability 2022, 14(21), 13948; https://doi.org/10.3390/su142113948
Submission received: 1 October 2022 / Revised: 18 October 2022 / Accepted: 24 October 2022 / Published: 27 October 2022
(This article belongs to the Special Issue Green Hydrogen Economics and Planning towards Carbon Neutrality)

Abstract

:
Green hydrogen has become the key to social low-carbon transformation and is fully linked to zero carbon emissions. The carbon emissions trading market is a policy tool used to control carbon emissions using a market-oriented mechanism. Building a modular carbon trading center for the hydrogen energy industry would greatly promote the meeting of climate targets. Based on this, a “green hydrogen market—national carbon trading market–electricity market” coupling mechanism is designed. Then, the “green hydrogen market—national carbon trading market–electricity market” mechanism is modeled and simulated using system dynamics. The results are as follows: First, coupling between the green hydrogen market, carbon trading market and electricity market can be realized through green hydrogen certification and carbon quota trading. It is found that the coupling model is feasible through simulation. Second, simulation of the basic scenario finds that multiple-market coupling can stimulate an increase in carbon price, the control of thermal power generation and an increase in green hydrogen production. Finally, the proportion of the green hydrogen certification, the elimination mechanism of outdated units and the quota auction mechanism will help to form a carbon pricing mechanism. This study enriches the green hydrogen trading model and establishes a multiple-market linkage mechanism.

1. Introduction

To fight against the climate crisis, more than 140 economies have announced “carbon neutrality” goals and implemented a series of carbon reduction measures [1]. In order to improve national independent contribution, the Chinese government pledged to reach peak CO2 emissions before 2030 and carbon neutrality before 2060 [2]. Thus, China will build a clean, low-carbon, safe and efficient energy system. The National Development and Reform Commission and National Energy Administration jointly issued the “Medium and Long-Term Plan for Development of Hydrogen Energy Industry (2021–2035)”, which designed a blueprint from a strategic level to promote the development of China’s hydrogen energy industry [3]. Hydrogen energy, as a highly calorific and pollution-free resource, is considered ideal clean energy. The development and utilization of it are important paths to achieving the goal of carbon emission reduction.
On the one hand, compared with blue hydrogen and gray hydrogen, green hydrogen is sustainable. Green hydrogen production takes renewable energy as raw material. It has the characteristics of environmental protection, low emissions, and flexible transformation throughout the whole process, and is a replacement and supplement for renewable electricity [4]. On the other hand, renewable power, such as wind power and solar photovoltaic power, has grown rapidly in recent years. However, renewable energy has strong volatility, and there is a phenomenon of power abandonment caused by the power gird absorb it all in a short time. The issue of limited power will increase with the growth of installed renewable energy. Even considering the peak-clipping and valley-filling effects of energy-storage equipment, the amount of wind and electricity discarded is still considerable [5]. Therefore, green hydrogen will be the development direction of the hydrogen energy market in the future, and is also the key path for China to achieve the goal of “double carbon”. The application of green hydrogen is technically feasible, but there are economic limitations to the large-scale utilization of hydrogen energy. The high cost of hydrogen production from electrolytic water is the biggest bottleneck. Finding out how to reduce the cost under the premise of ensuing the large-scale development of green hydrogen has become an urgent problem to be solved.
The emissions trading system (ETS) guides the allocation of carbon-emission-space resources with market mechanisms, controls the emissions of energy-intensive enterprises, and economically encourages low-emission enterprises. China launched the world’s largest carbon market on 21 July 2021. Currently, the national carbon market only covers the power generation industry, which includes 2162 key emission units and covers about 4.5 billion tons of carbon dioxide [6]. The carbon trading policy reflects the principle that whoever pollutes pays. The internalization of external costs is an important policy tool to reduce carbon emissions by using market-oriented mechanisms. The carbon trading market is divided into two grades. In the primary market, the government allocates the initial carbon emission rights to trading agents according to the overall emission reduction target. In the secondary market, enterprises included in the trading system can freely trade carbon quotas. Meanwhile, emission-control enterprises can also purchase the Chinese Certified Emission Reduction (CCER) to realize carbon offset. Currently, the ETS is in the initial stage of operation, and it faces the problems of single trading products and a small market size. With the expansion of the carbon market, the market demand for CCER will be further increased.
With the maturity of the ETS, the carbon price signal is becoming more and more clear. Carbon price will provide an important reference basis for the verification of real production costs and benefits for different hydrogen production processes. Since green hydrogen and the ETS are both important paths to achieving the goal of carbon emission reduction and social low-carbon transformation. If they are deeply integrated, China will accelerate the pace of carbon neutralization. Based on these, this paper intends to solve two problems: First, can we design a coupling mechanism between the green hydrogen market, the national carbon trading market and the electricity market to realize the links between multiple markets? Second, how can we realize the effective linkage between markets, ease the cost of hydrogen energy and enhance the activity of the carbon trading market?

2. Literature Review

2.1. Coupling of Green Hydrogen Market and Electricity Market

In recent years, the economics of green hydrogen has attracted much attention in the field of hydrogen energy. The choice of hydrogen production technology determines the cost and carbon emissions of the hydrogen energy. Wang et al. [7] measured the trend of cost changes in different hydrogen production technologies. The results of the study showed that gray hydrogen has the lowest cost, and green hydrogen has the highest cost at this stage. In the long term, as technology progresses, green hydrogen will be the least costly hydrogen production method, and it will be developed on a large scale. It is necessary to discover the factors that reduce the cost of green hydrogen, and to realize the coupling of the green hydrogen and electricity markets. Liu et al. [8] argued that reducing the levelized price of clean hydrogen requires a concerted effort from various aspects, such as technology and business-model innovation, so it can play its role in energy transformation and deep decarbonization. Xu et al. [9] suggested that the problem of hydrogen storage configuration in scenic field stations under electro-hydrogen coupling can be optimized by a business model. Yang et al. [10] constructed a wind–hydrogen coupling model based on the goal of revenue maximization, and the study found that the wind–hydrogen coupling system improved the system revenue by 27% based on actual cases.
Renewable energy generation coupled with hydrogen production technology can not only reduce large-scale grid instability, and realize the full utilization of abandoned wind and light, but also significantly improve the renewable consumption rate [11]. The current operation mode of electricity–hydrogen coupling is mainly divided into three categories. First, hydrogen production from renewable energy sources can ensure green production and a stable supply of hydrogen energy [12]. Second, the flexible and corresponding characteristics of hydrogen production from electrolytic water are brought into play to smooth out the fluctuation of renewable energy output [13]. Third, making full use of abandoned wind and light resources can improve the renewable energy consumption rate [14]. Based on the above analysis, it can be found that the cost of green hydrogen is the bottleneck of development.

2.2. Coupling of Carbon Trading Market and Electricity Market

The purpose of “electricity–carbon” coupling is to link the electricity market with the carbon emissions trading market. The interaction of the two markets can help ensure that the electricity market carries out electricity trading while fulfilling the market obligations of carbon trading. So, the carbon price and trading volume, and the electricity price and power supply structure, can be mutually constrained while also promoting each other, and improve carbon electricity market integration [15,16]. The synergistic development of the power market and the carbon market is the key to full exploitation of the emission reduction potential of the two markets, and scholars have conducted relevant studies on this issue.
In order to study the coupling association between the carbon market and the power market, Zhao et al. [17] constructed a power generation cost model which considered the carbon emission price, and conducted a scenario-simulation analysis using Guangdong Province as an example. The study found that there is a mutually constraining relationship between the two markets, and the integrated development of the two markets is of great practical significance for the optimization of the power supply structure and the development of the new energy market. Feng et al. [18] designed a model of joint trading of green trading certificates and carbon markets to link renewable energy and thermal power generation enterprises. It is beneficial to promote the consumption of renewable energy and limit carbon emissions of thermal power generation enterprises through the coupling mechanism of multiple markets. Based on China’s 2030 carbon emission intensity reduction target, Feng et al. [19] constructed a policy synergy model to study the roles of the the carbon trading market and green certificate trading market on emission reduction in the power market, and this paper found that there is a significant mitigation effect of both markets on carbon emissions in the power sector. Some scholars have also studied the impact of carbon markets on thermal power producers from the perspective of electricity–carbon linkage [20,21].

2.3. Research Methods of Market Coupling Mechanism

Liang et al. [22] built a coupled market-clearing model for electricity and natural gas to study the method of multi-energy compliance with participation in market clearing, and the linkage between its energy purchase plan and energy price construction. Song et al. [23] used a system dynamics approach to construct a coupled model of the renewable electricity market, the excess consumption trading market, and the green certificate market. It was found that the renewable electricity consumption guarantee mechanism not only affects the price and trading volume of multiple markets, but also promotes the development of renewable electricity generation in China. Zhang et al. [24] promoted a coupling model between the distributed PV market and the electricity sales market using a system dynamics approach. Wang et al. [25] proposed a multi-objective optimization function to study the pricing mechanism of hydrogen stations under the coupling of electricity and hydrogen markets. It was found that a two-way pricing mechanism linking electricity and hydrogen systems can promote social welfare and renewable energy consumption.
The above can be summarized as follows: First, the emission reduction in clean hydrogen is incorporated into the national carbon market to promote its cost reduction and efficiency to achieve sustainable development. There are relatively few studies on the coupling of hydrogen energy and the carbon market, so such studies need to be further developed. Second, there is relatively abundant research on the integration and development of the electricity market and the carbon market. Most of the research has been conducted on carbon quota trading, and fewer research has been conducted on CCER. CCER has made a positive contribution to the diversified and market-oriented promotion of society-wide carbon emission reduction targets at a low cost. Under this logic, CCER is considered in the study of the coupling mechanism of the “electricity–carbon” market, which allow us to investigate the deep integration of the two markets. Third, there are many research methods for market coupling mechanisms. The formation of system feedback through cause-and-effect relationships has been used to study green hydrogen market–carbon trading market–electricity market coupling. Given that system dynamics is a discipline that studies the dynamic complexity of systems, it is mainly used to study the interdependence between the structure, function and dynamic behavior of complex systems. The method can analyze the causal relationships and feedback mechanisms among decisions from a microscopic perspective, and can also predict the future dynamic behavior of the system. Therefore, this paper investigates the multi-market coupling mechanism using a system dynamics (SD) model.
The remainder of this paper is organized as follows: Section 3 outlines the design of the “green hydrogen market–national carbon market–electricity market” coupling mechanism. Section 4 outlines the construction of the model. Section 5 presents the model simulation results and discussion. The sixth section draws the main conclusions and discusses policy recommendations.
The main contributions of this paper are as follows: First, the green hydrogen industry is introduced into the carbon trading market mechanism, and the coupling mechanism between the green hydrogen market, national carbon trading market and electricity market is simulated. It is designed such that the green hydrogen project obtains CCER through the carbon emission reduction certification system. Then, the CCER enters the national carbon trading market to obtain additional government subsidies and revenue. It promotes the large-scale development of the green hydrogen industry. Second, the system dynamics model of the green hydrogen market, national carbon trading market and electricity market is constructed. The dynamic evolution characteristics of variables such as the power generation, carbon trading price and CCER price of China’s green hydrogen industry are simulated.

3. Design of “Green Hydrogen Market–National Carbon Trading Market–Electricity Market” Coupling Mechanism

China is abundant in photovoltaic, wind, biomass, and marine energy and other resources. With the cost of renewable energy power generation becoming more and more competitive, it provides favorable conditions for the development of green hydrogen with technical progress. China’s hydrogen output was about 344 million tons in 2020, of which 67% was gray hydrogen, while only 3% was green hydrogen. In 2021, China’s hydrogen energy capacity increased to 400 million tons. According to the White Paper on the Hydrogen Energy and Fuel Cell Industry in China in 2020, released by the China Hydrogen Alliance, the proportion of green hydrogen will increase from 3% to 15% between 2020 and 2030 under the constraint of carbon emissions [26]. It can be seen that China will deploy green hydrogen on a large scale in order to achieve decarbonization.
Since the operation of the national carbon market, the carbon pricing mechanism has gradually been widely accepted by society, and the product categories of carbon trading will be enriched. Carbon trading gives a clear price signal to carbon emission, which integrates into the production and operation of enterprises through the price transmission mechanism. At present, the cost of green hydrogen is much higher than that of other processes. Without carbon pricing, the negative externalities generated by traditional hydrogen production from fossil fuels cannot be internalized, and the positive externalities of green hydrogen cannot be effectively compensated. Therefore, it is necessary to build a trading mechanism for the hydrogen energy industry section of the carbon trading center. Based on above analysis, a “green hydrogen market–national carbon trading market–electricity market” coupling mechanism is designed to realize multiple-market linkage, as shown in Figure 1.
From Figure 1, we find that: First, compared with the production process of gray hydrogen and blue hydrogen, green hydrogen production reduces carbon dioxide emissions. The emission reduction generated by green hydrogen can be converted into CCER and participate in carbon market transaction through the offset mechanism. Green hydrogen participates in the carbon market can not only alleviate the production cost, but also enrich the trading varieties. Therefore, the green hydrogen market is coupled with the carbon market. Second, the national carbon market only covers some of the thermal power generation industry. The government determines the initial carbon quota of thermal power generators based on historical carbon emissions. High-energy-consuming units have a large demand for quota, while low-energy-consuming units have a small demand. Insufficient and surplus quotas will be traded on the carbon market. Thus, the electricity market is coupled with the carbon market. Third, thermal power generators with low energy consumption can also purchase CCER on the carbon market for carbon offset. Thus, the thermal power market is coupled with the green hydrogen market. To summarize, the green hydrogen market, carbon market and electricity market are coupled.
With the expansion of the carbon market, the CCER market has further expanded. CCER not only has an emission reduction function, but can also appropriately reduce the performance cost of enterprises. It promotes the discovery of carbon price and the development of renewable energy. Green hydrogen has natural emission reduction, and also has the conditions to develop CCER, providing additional market-based income for green hydrogen through the national carbon market. This helps to change its income structure and also supports green hydrogen investment. In addition, the electricity market can not only absorb CCER, but can also participate in carbon quota trading. The power supply structure is optimized through the carbon pricing mechanism.

4. Model Construction

In this section, we will not only build a multi-market coupling model based on the third section, but we also need to study the paths to realize the coordinated development of the multi-market. It can be seen that the above problem is a multi-variable, high-order, nonlinear dynamic-feedback complex system problem. System dynamics is a subject that studies information feedback systems. It analyzes the causal relationship and feedback mechanisms among various decisions from a micro-structure perspective, according to mutual causal feedback characteristics of the internal components of the system. System dynamics can also predict the future dynamic behavior of a simulation system, and is suitable for analyzing the trend of complex systems over time [27,28]. Therefore, this section uses the system dynamics model to study the coordinated development of the hydrogen energy market, carbon trading market and electricity market.

4.1. Boundary and Model Assumptions

The model constructed in this study is divided into three parts, which focus on the interaction mechanisms between the green hydrogen market subsystem, the electricity market subsystem and the carbon market subsystem. The constructed system dynamics model operates in a specific environment, and therefore needs to satisfy certain assumptions. The main assumptions made in this paper are as follows.
First, through hydrogen production and usage, renewable energy sources such as wind, solar and water are stored and converted. This makes the energy supply more convenient and flexible for users. The renewable energy used for green hydrogen production is generated from discarded electricity.
Second, the demand side of the carbon trading market comprises high-energy-consuming thermal power generators, and the supply side comprises low-energy-consuming thermal power generators. Agents with insufficient carbon allowances can either meet their own carbon emissions by purchasing carbon allowances or offset them through CCER.
Third, since the carbon trading market only covers some emission-controlled enterprises, only thermal power generators are considered in this paper for the power market, and no renewable energy generators are considered. It is assumed that the construction cycle of thermal power units is 12 months, and the electricity demand grows according to a certain rate.

4.2. Causality Analysis

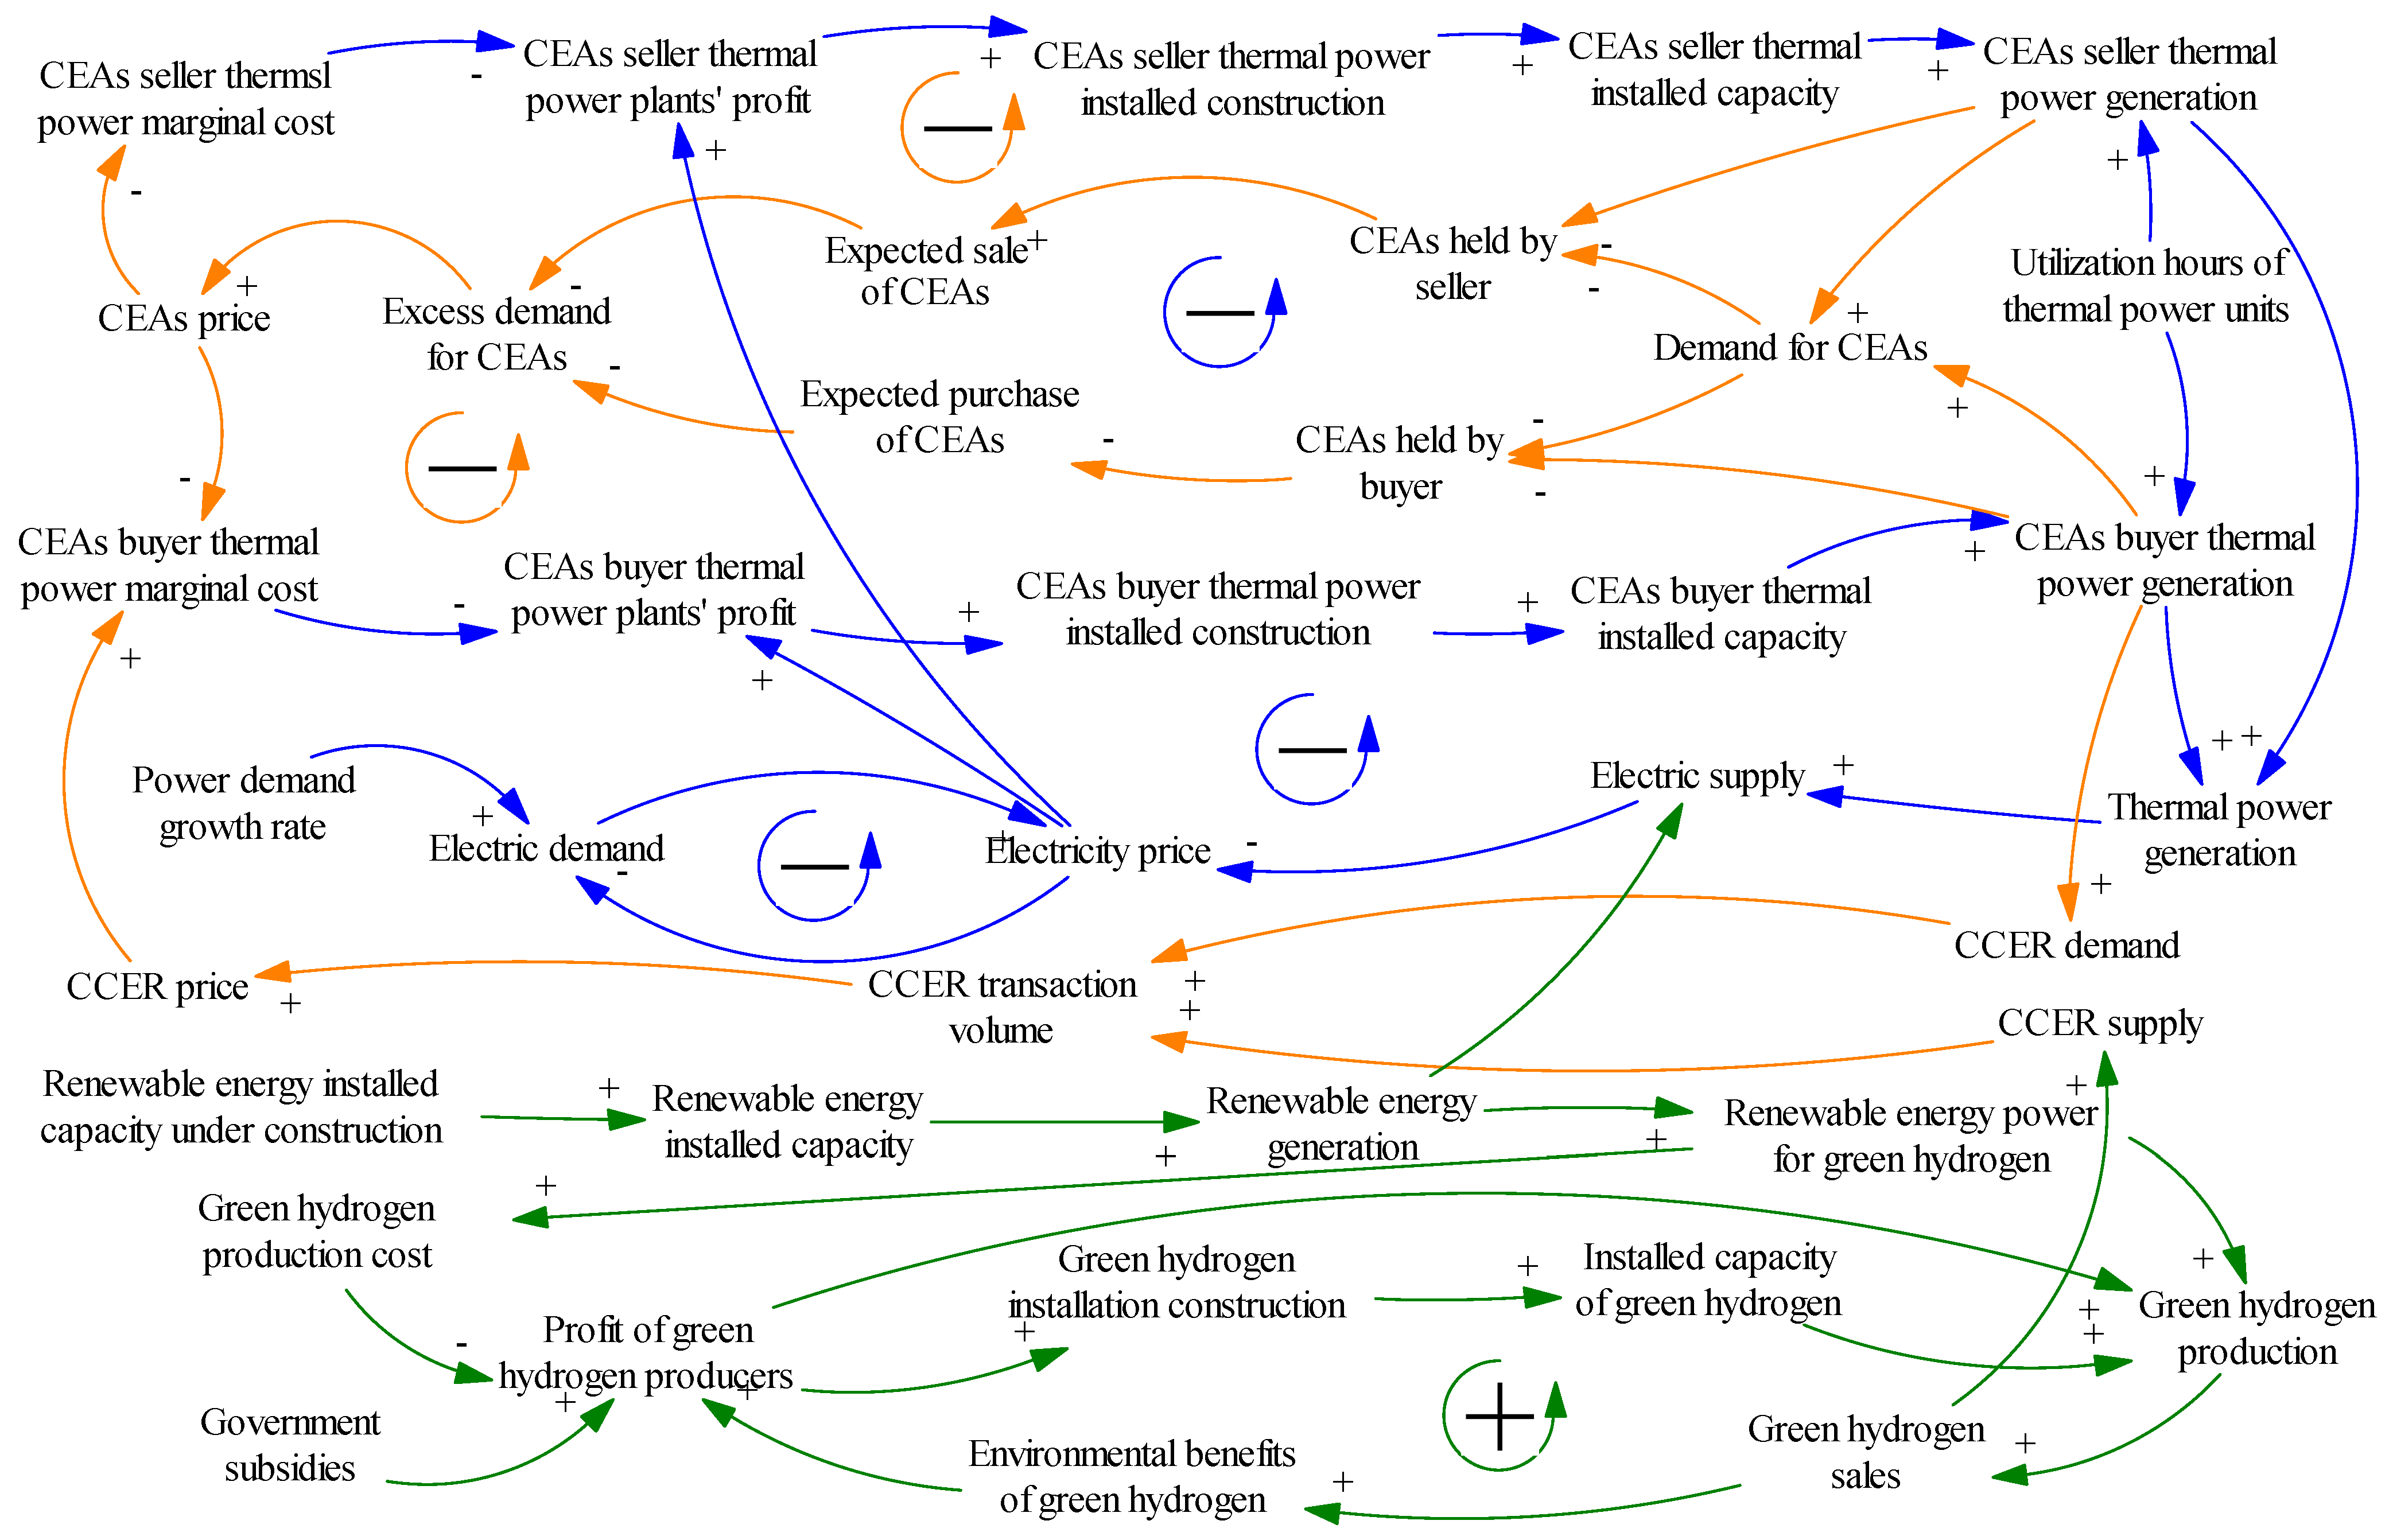
This section constructs a feedback structure for the green hydrogen market, electricity market and carbon trading market. In Figure 2, the green line connects the causal relationships between the variables of the green hydrogen market, the orange line connects the causal relationships between the variables of the carbon market system and the blue line connects the causal relationships between the variables of the electricity market. Figure 2 reveals that the causality diagram of the three market couplings includes one instance of positive feedback and five of negative feedback.
① Positive feedback in the green hydrogen market: An increase in the production of green hydrogen will lead to green hydrogen being sold in bulk. The greater the environmental benefits for green hydrogen producers, the greater the profit margins. Driven by the benefits, green hydrogen producers will produce more green hydrogen.
② Negative feedback of supply and demand in the electricity market: An increase in the electricity price makes the demand for electricity decrease, which leads to the supply exceeding the demand. In this case, a decrease in electricity price makes the electricity demand increase, which helps the supply and demand in the electricity market to reach a steady state.
③ The thermal power-production process of a Chinese emission allowance (CEAs) buyer: When a CEA buyer increases the production of thermal power, which will lead to a decrease in power price. When the power price decreases, the profit of the power producer decreases. When a CEA buyer reduces the thermal power production, while the power supply decreases, the power price increases.
④ The thermal power-production process of a CEA seller: An increase in electricity price makes the profit of carbon emission rights sellers increase, power production by carbon emission rights sellers increase, and power supply and demand increase; under the role of market regulation, an increase in power supply makes the power price decrease, and the carbon emission rights sellers reduce the power production, driven by profit.
⑤ The process of the buying of carbon allowance by a CEA buyer: A carbon price increase makes the cost to the CEA buyer increase and profit decrease. Further, the CEA buyer decreases their electricity supply, and the demand for carbon allowances decreases. Through the regulation of the carbon market, the demand for carbon allowances and carbon price changes. The thermal power generation increases.
⑥ The process of the selling of carbon allowances by a CEA seller: A rise in carbon price makes the profit of the CEA seller increase, and construction, installation and production will increase. These lead to an increase in demand for their own allowances, which is used to sell fewer allowances, and the excess demand for carbon allowances decreases. When the supply exceeds the demand in the carbon market, the carbon price decreases, the CEA seller reduces the electricity production, and the supply of allowances increases again.

4.3. System Dynamics Model Construction

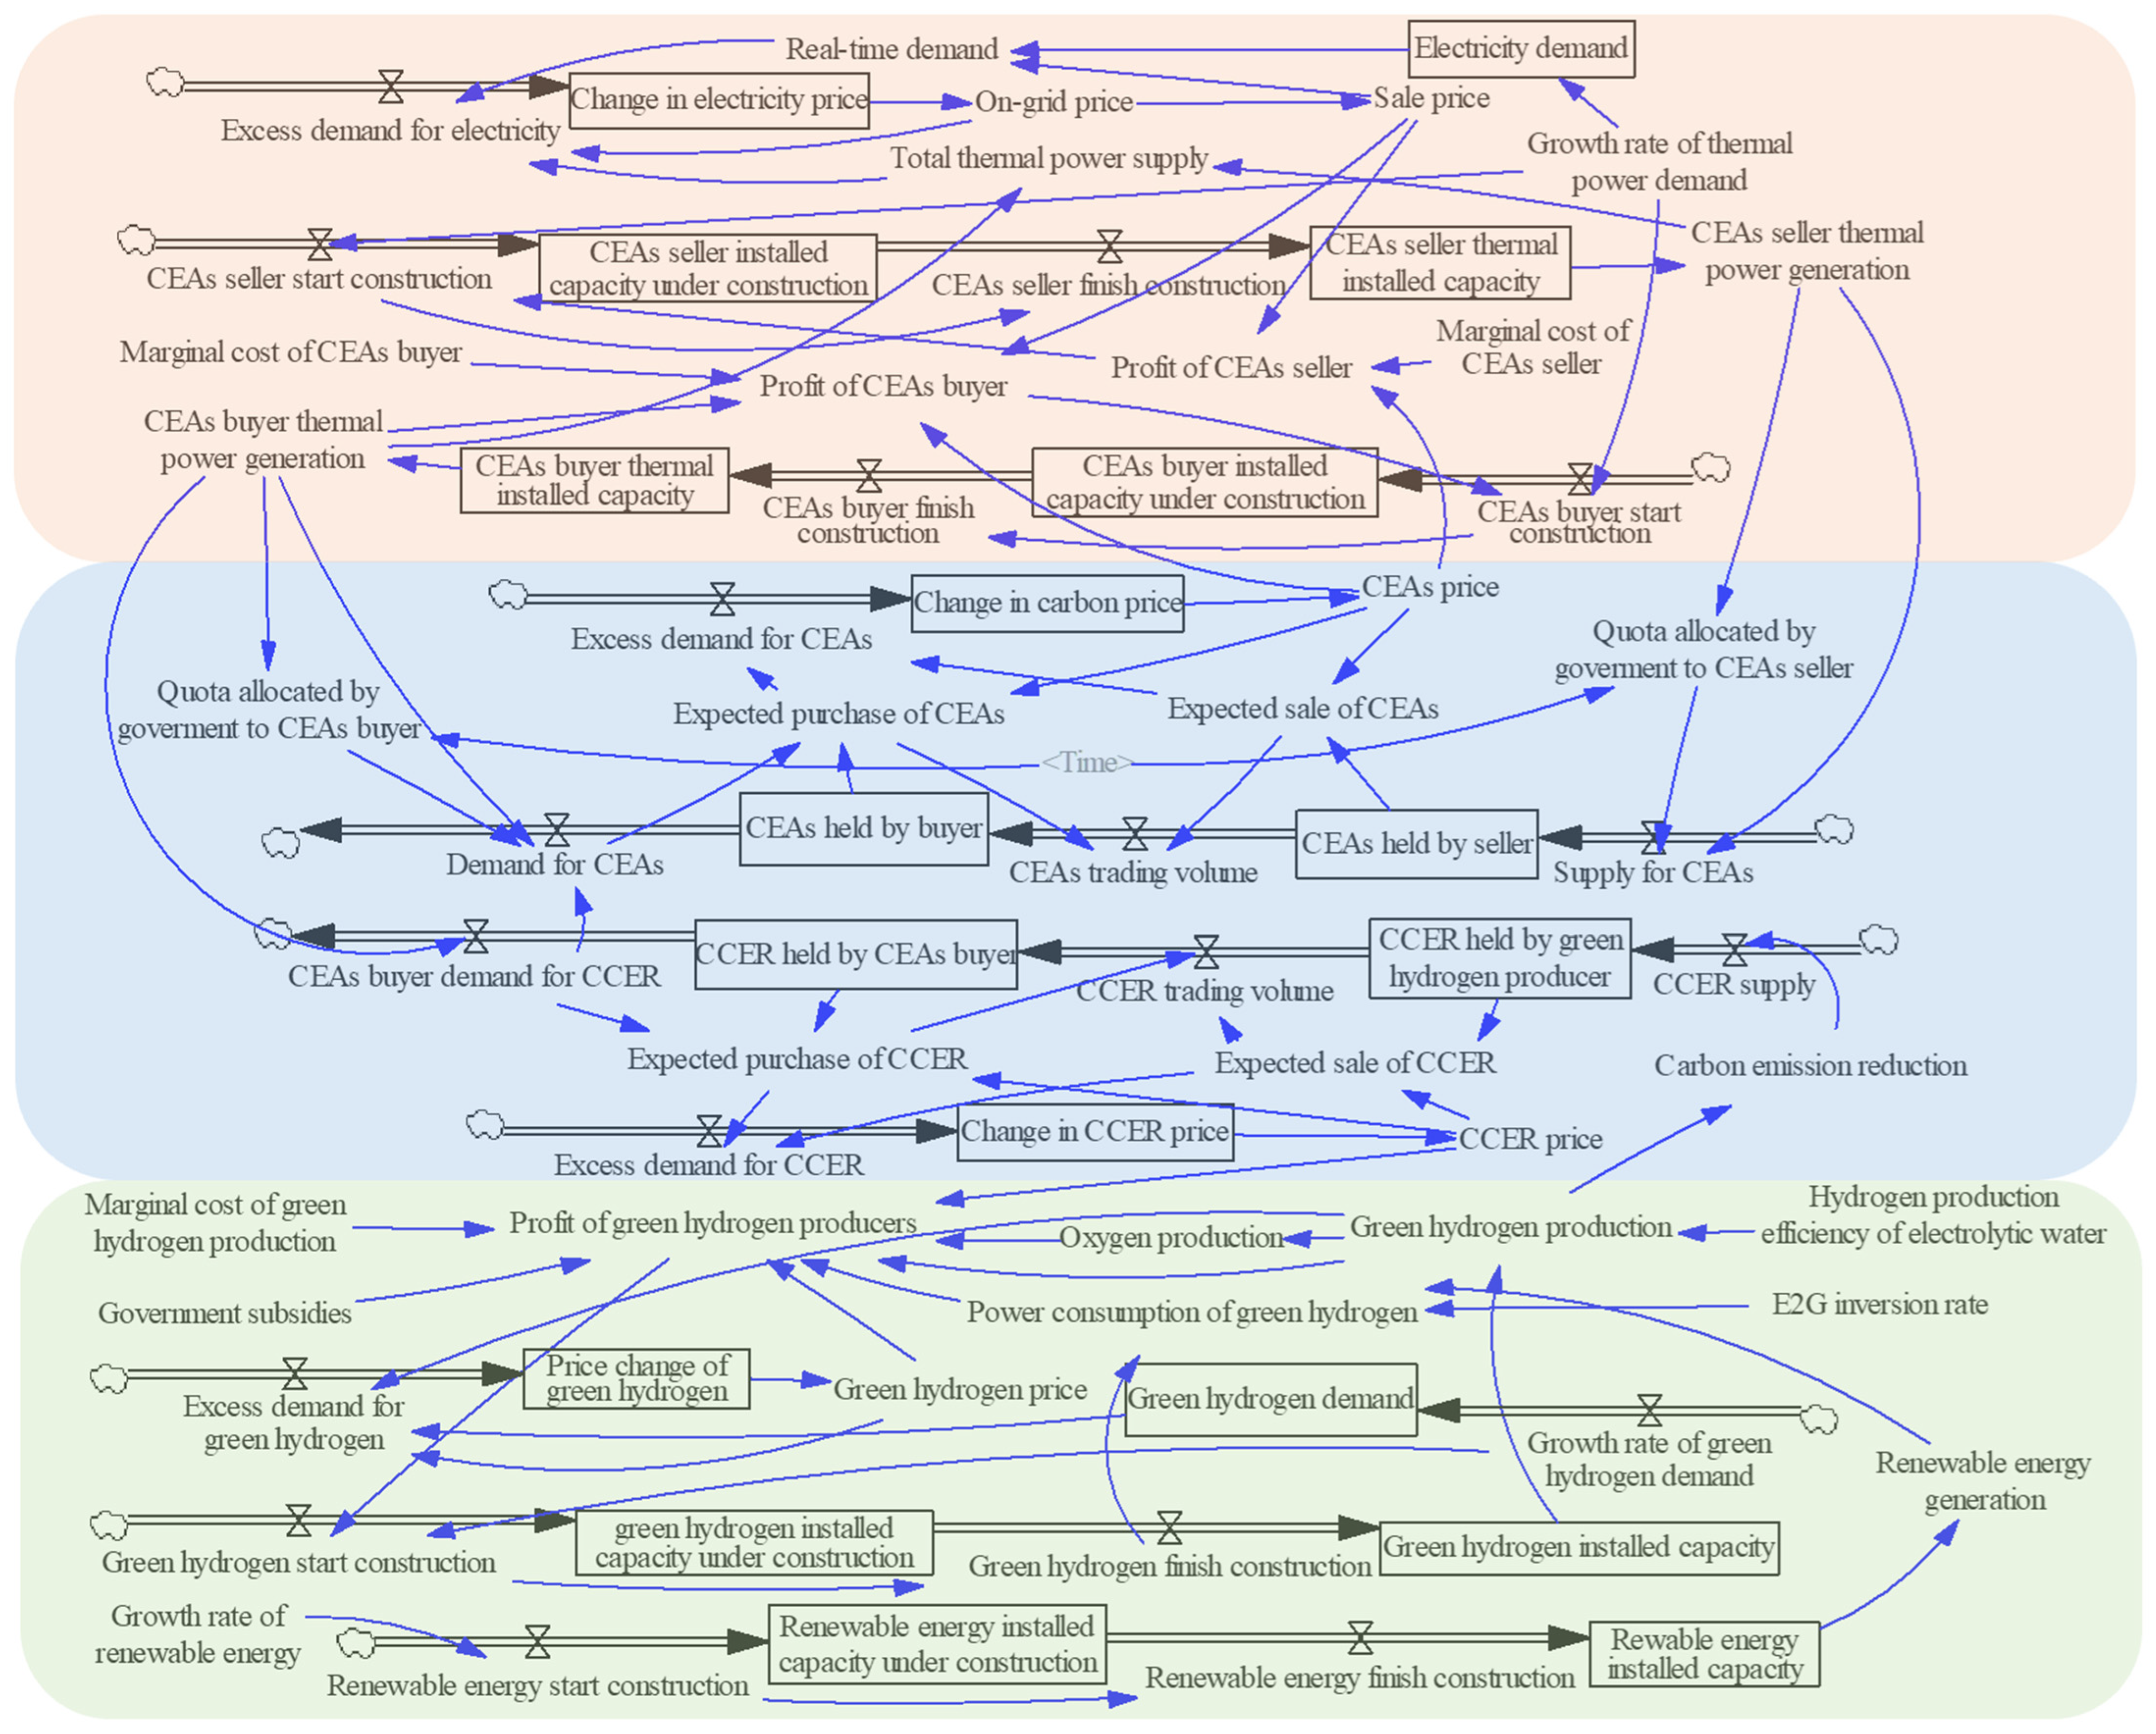
Based on the above cause–effect analysis, a stock-and-flow diagram of the green hydrogen market, carbon trading market and electricity market is further constructed, as shown in Figure 3. The orange part is the electricity market, the blue part is carbon market and the green part is the green hydrogen market. Based on the relationship between the variables of the different markets, the inter-variable functional relationship is set using Vensim PLE software. The functions include the integral function (INTEG), delay function (DELAY1) and smoothing function (SMOOTH).

4.4. Data Sources and Related Parameter Settings

The data required in the model for thermal power production, carbon trading and green hydrogen production process are mainly obtained from the National Bureau of Statistics, the Shanghai Environmental Energy Data Exchange, the official website of the CEC and the China Hydrogen Energy Alliance. The initial price of CCER in the model is set to 40 CNY/ton, and the initial price of carbon emission rights is set to 50 CNY/ton, with parameters from the literature [29,30].

4.5. Model Scenario Setting

On the basis of the existing basic scenario, the green hydrogen market, carbon market and electricity market will be continuously reformed. Therefore, the effectiveness of the market reform mechanism is researched through a multi-scenario setting. Table 1 shows a variety of scenarios set in this paper.

5. Results and Discussion

5.1. Simulation Results

(1)
Simulation analysis of the baseline scenario
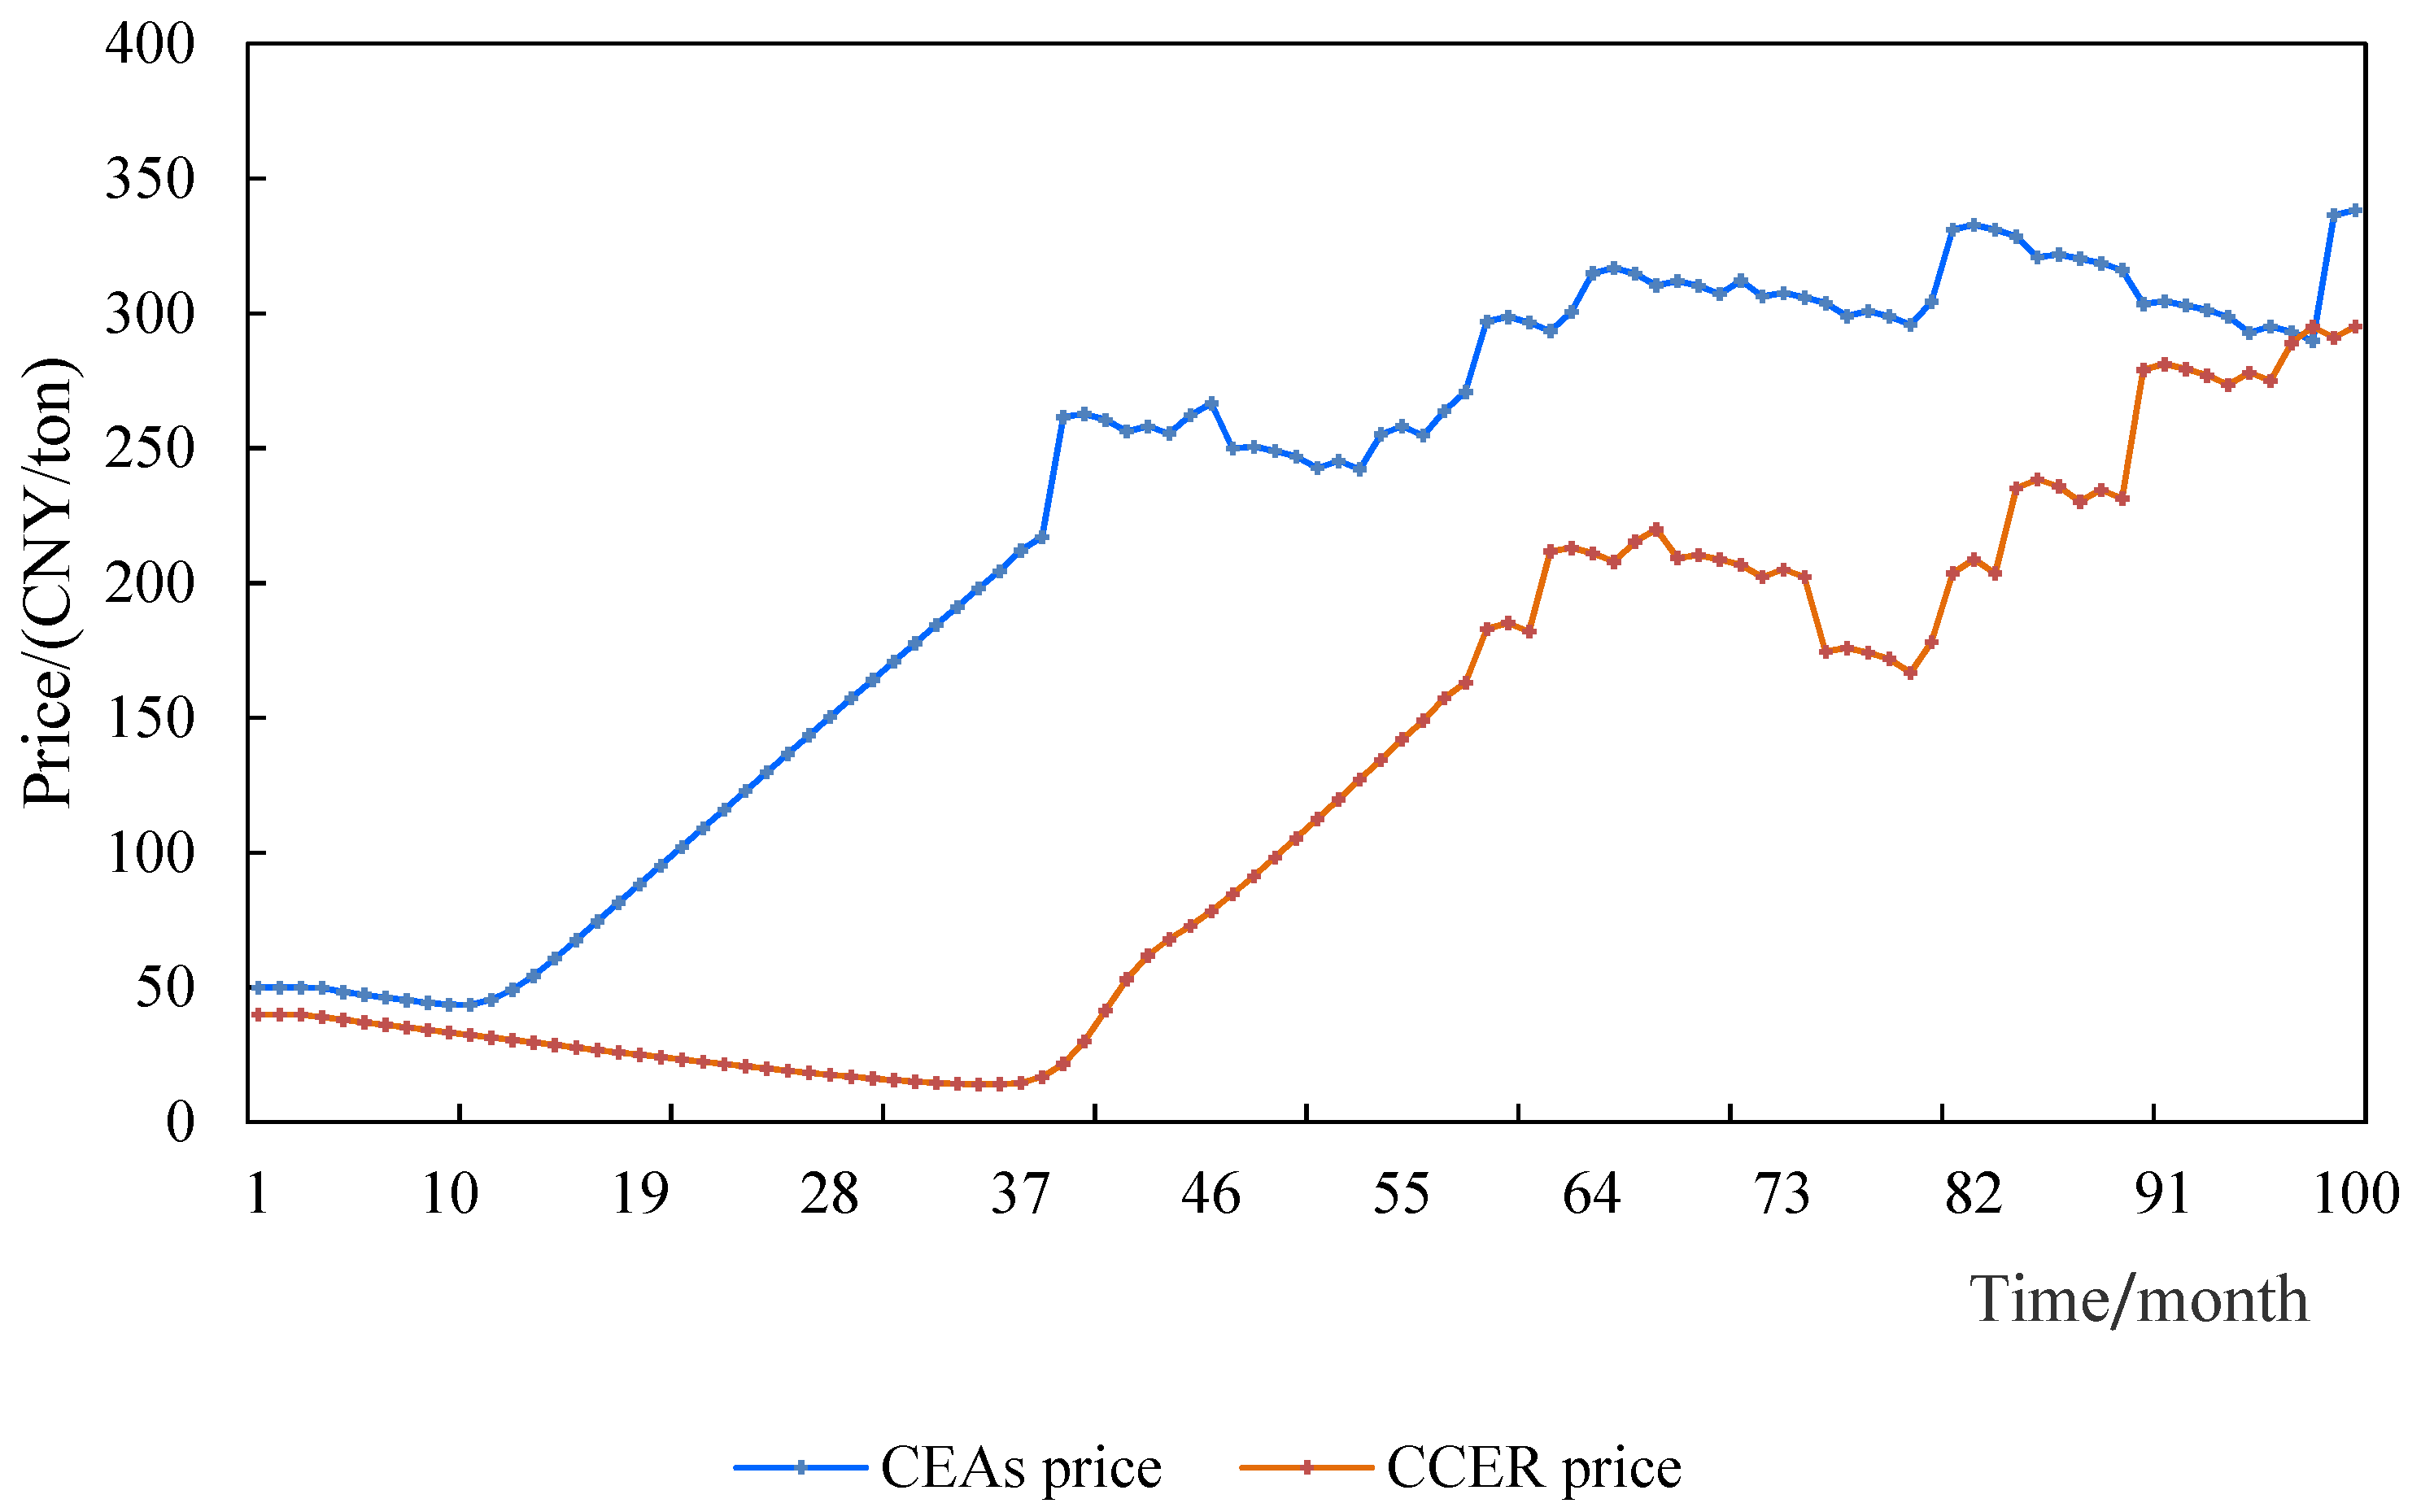
Figure 4 shows the trend of the CEA price and the CCER price under the base scenario. From the figure, we find that the carbon price goes through the process of “low level–fast rise–high level”, while the CCER price goes through the process of “decline–fast rise–high level”. Comparing the two curves, the carbon price curve is always above the CCER price curve, which shows that the carbon emission rights price was higher than the CCER price for a long time.
In the early stage of market operation, the constraint on emission-controlling enterprises is weak, and thermal power generation enterprises have less additional demand for CEAs based on the free allowances allocated. These lead to the carbon price being at a low level. However, as the intensity of carbon constraint increases, the demand for carbon allocation from emission-controlling enterprises increases, thus pushing up the carbon price. In addition, CCER, as a supplement to the mandatory carbon market, has a lower price than carbon quotas.
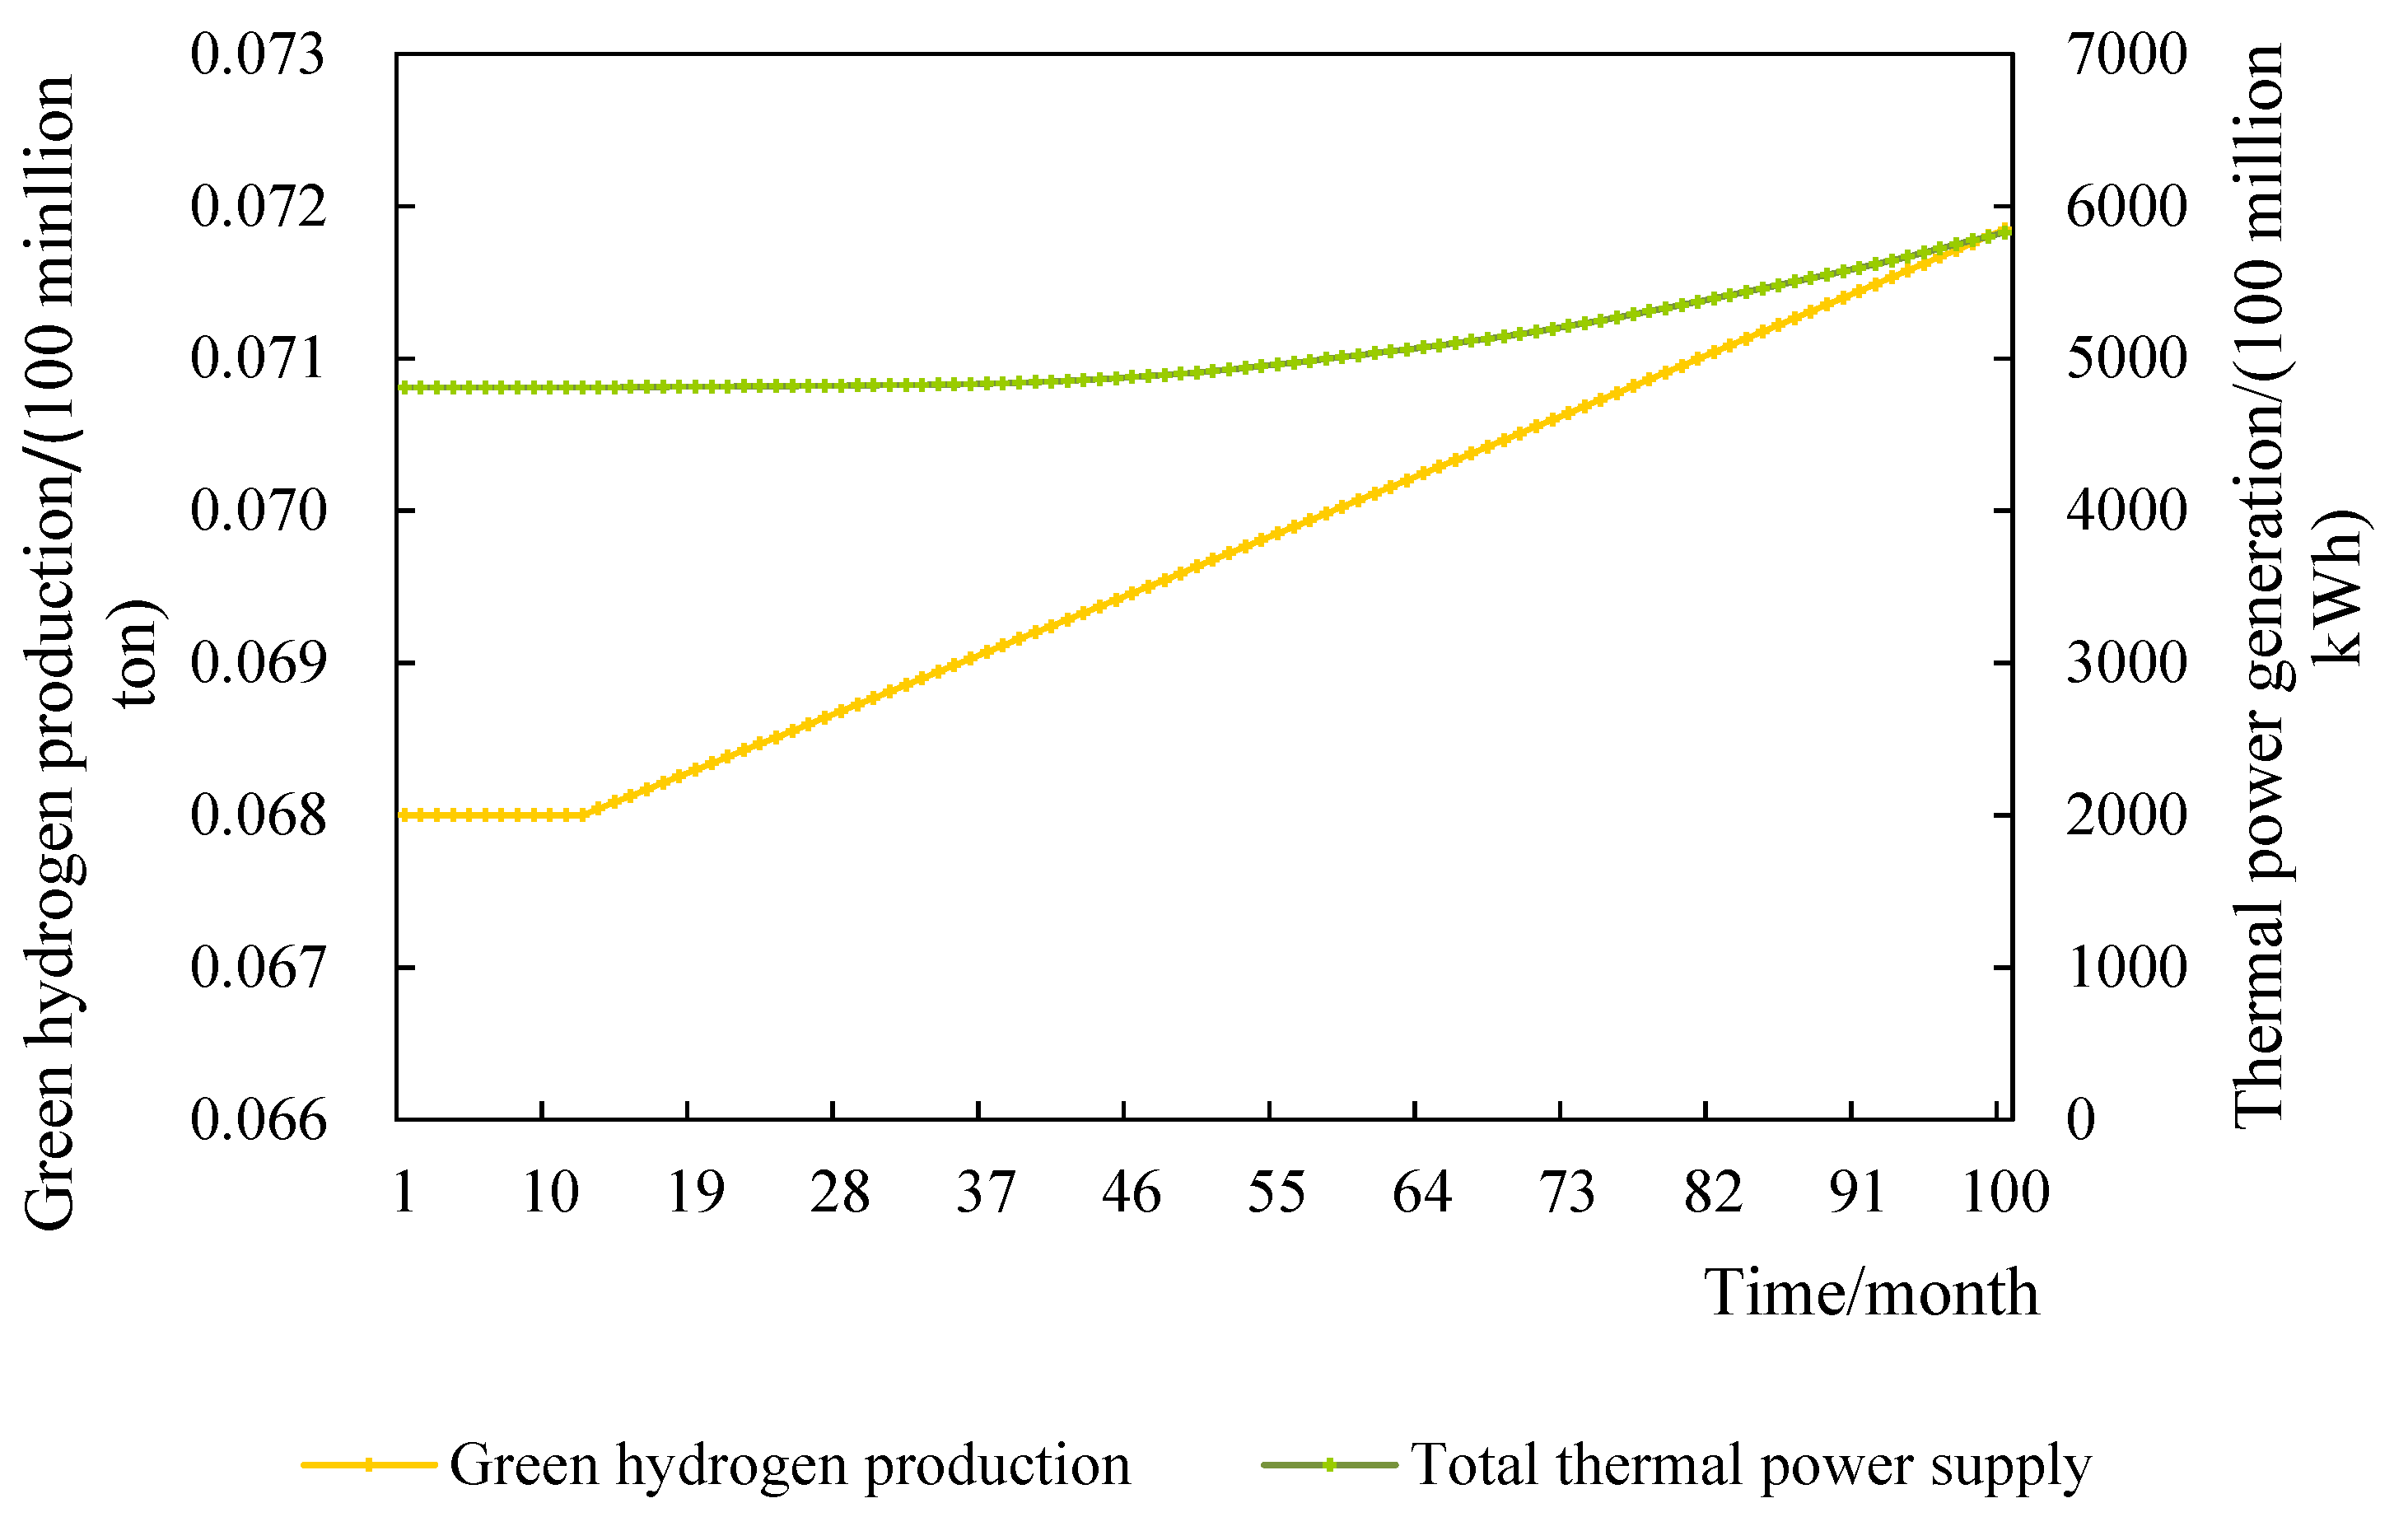
Figure 5 shows the trends of green hydrogen production and thermal power generation under the base scenario. The amount of green hydrogen production shows a significant upward trend, while the amount of thermal power generation has an upward trend, but the change is not significant. The reason for this is that the use of green hydrogen will promote the energy transition faster and free the country from its reliance on non-renewable energy with serious pollution. In order to realize the goal of “carbon emission peak, carbon neutrality”, the Chinese government strongly encourages development of the green hydrogen industry. While thermal power generation still has a large demand, the growth rate of thermal power is low due to environmental pollution.
(2)
Simulation analysis of different CCER offset ratios
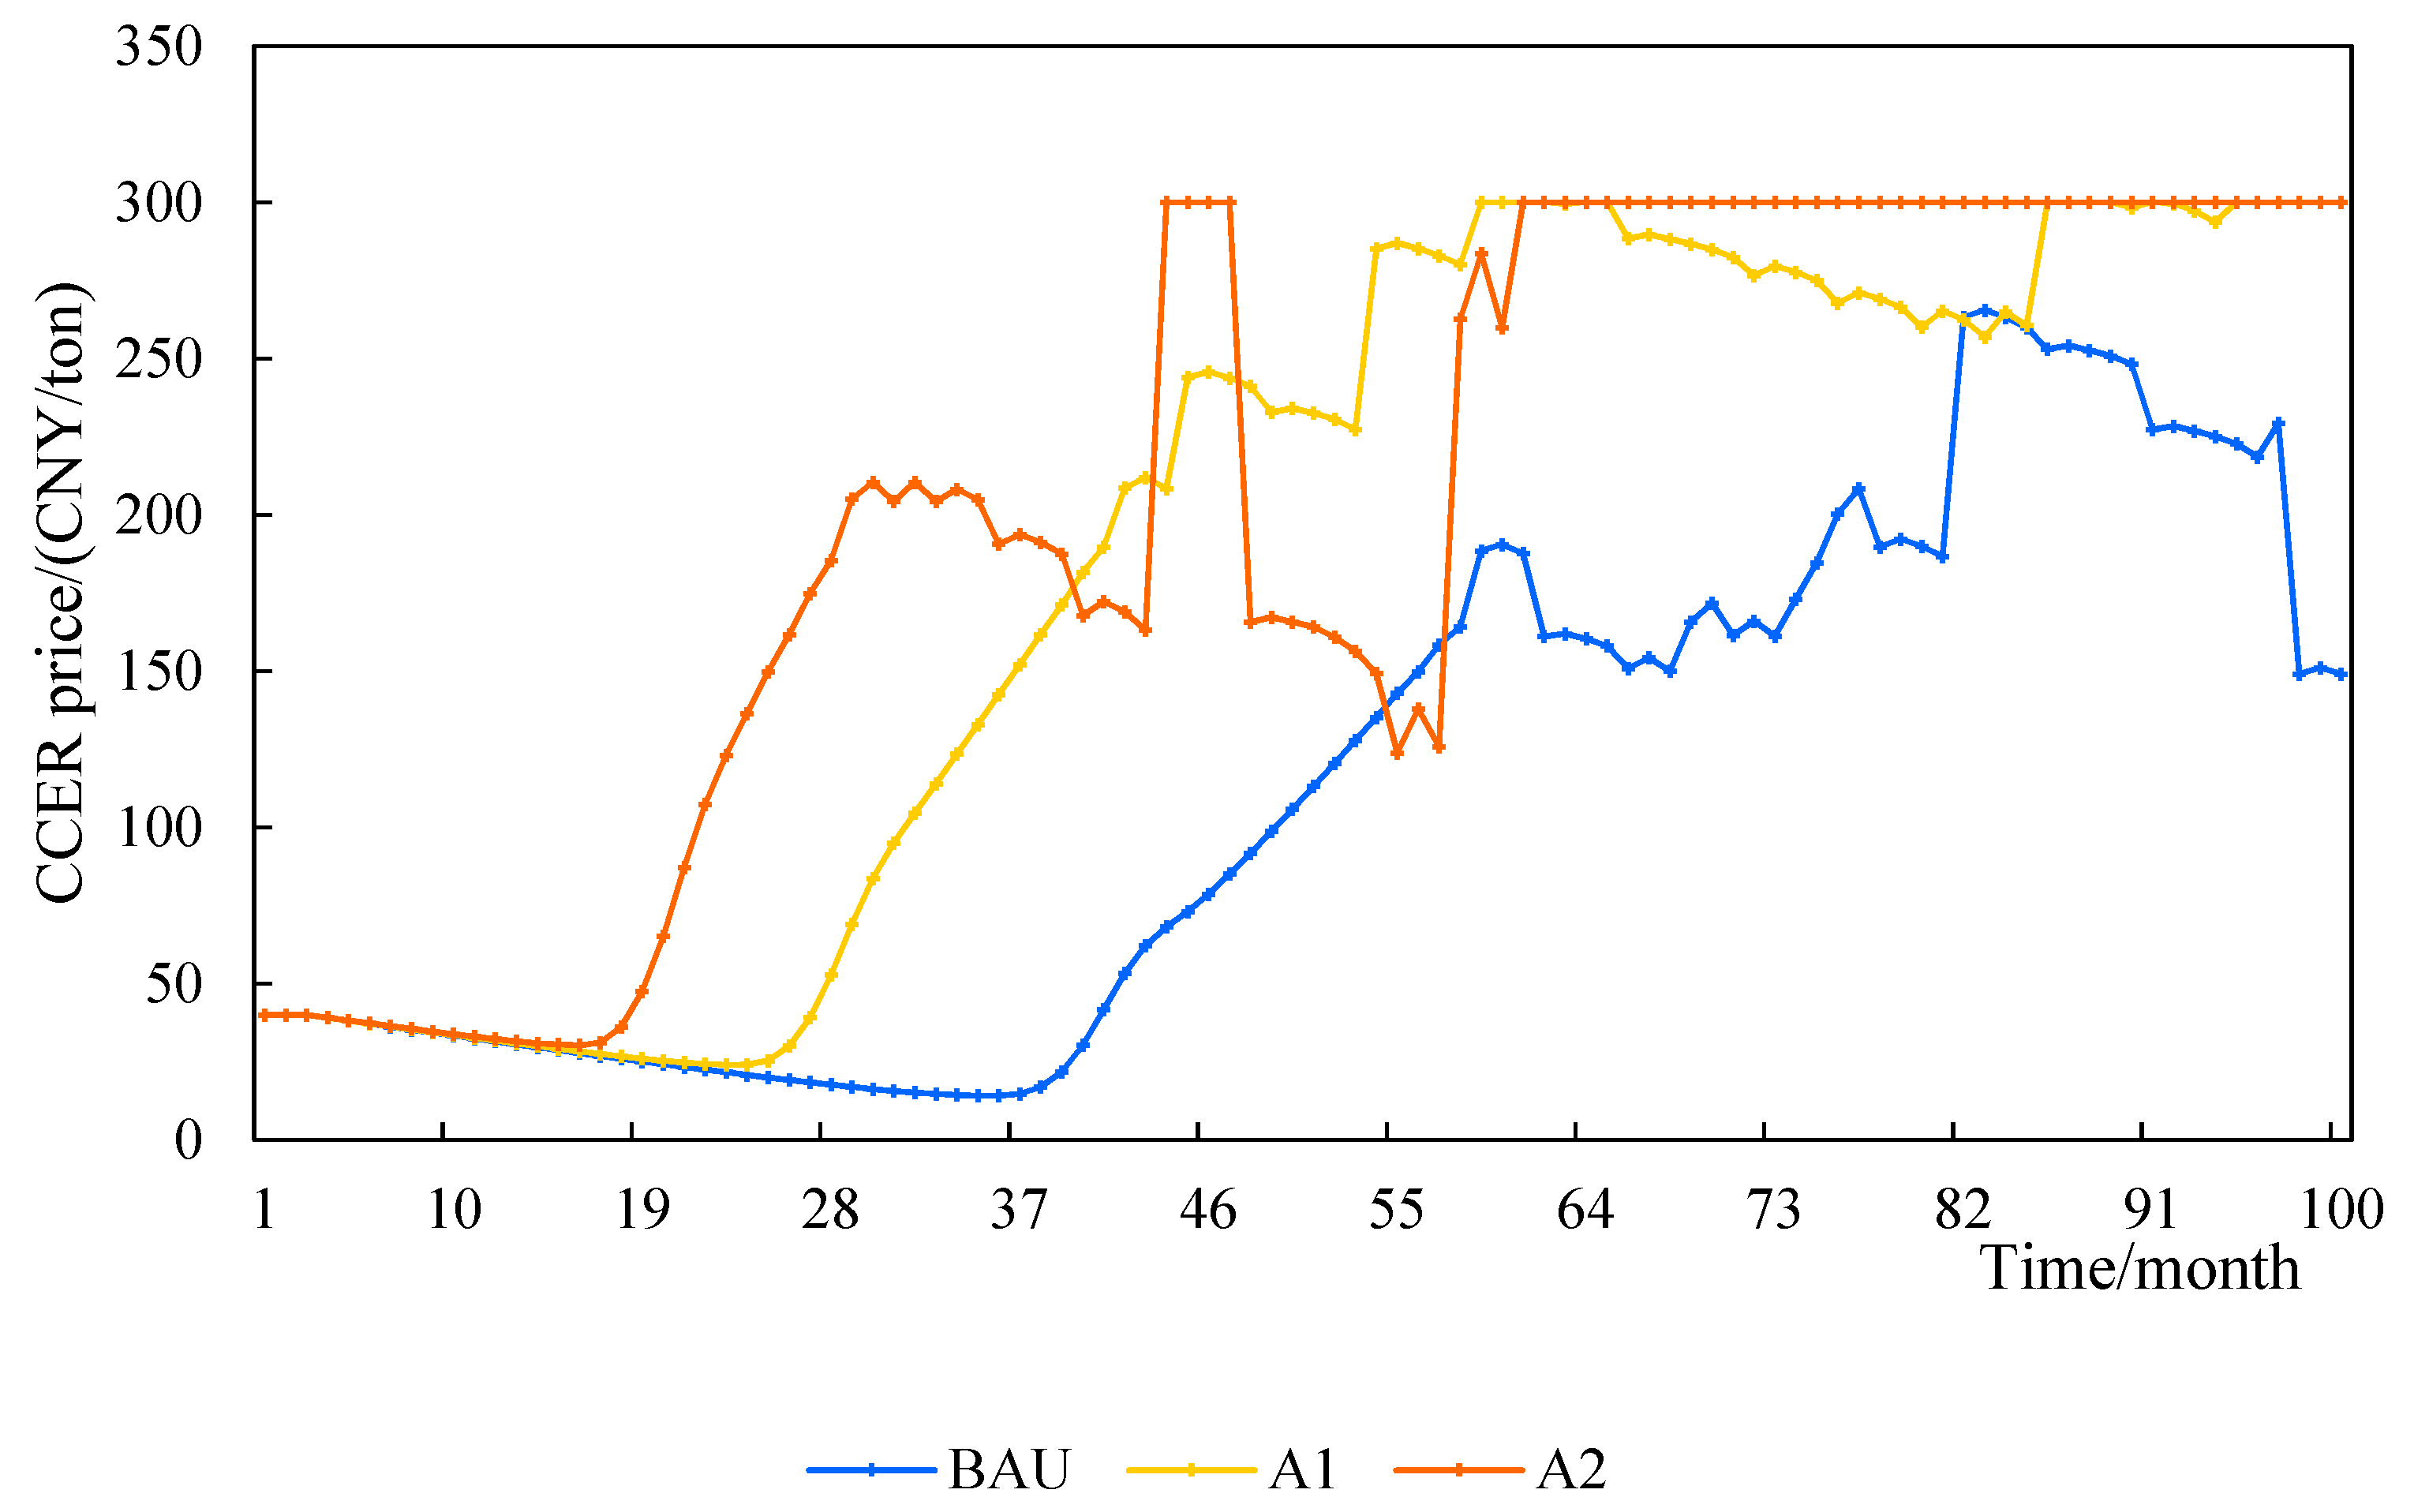
The current offset ratio of CCER is 5% in the carbon market. However, according to the experience of EU development, the offset ratio is about 15%. It can be foreseen that the offset ratio in the Chinese carbon market will increase in the future. Therefore, the impact of different CCER offset ratios on the system will be simulated in this section. Figure 6 shows the trend of CCER price changes under different CCER offset ratios. In addition, as the CCER offset ratio rises, the CCER price curve rises more quickly.
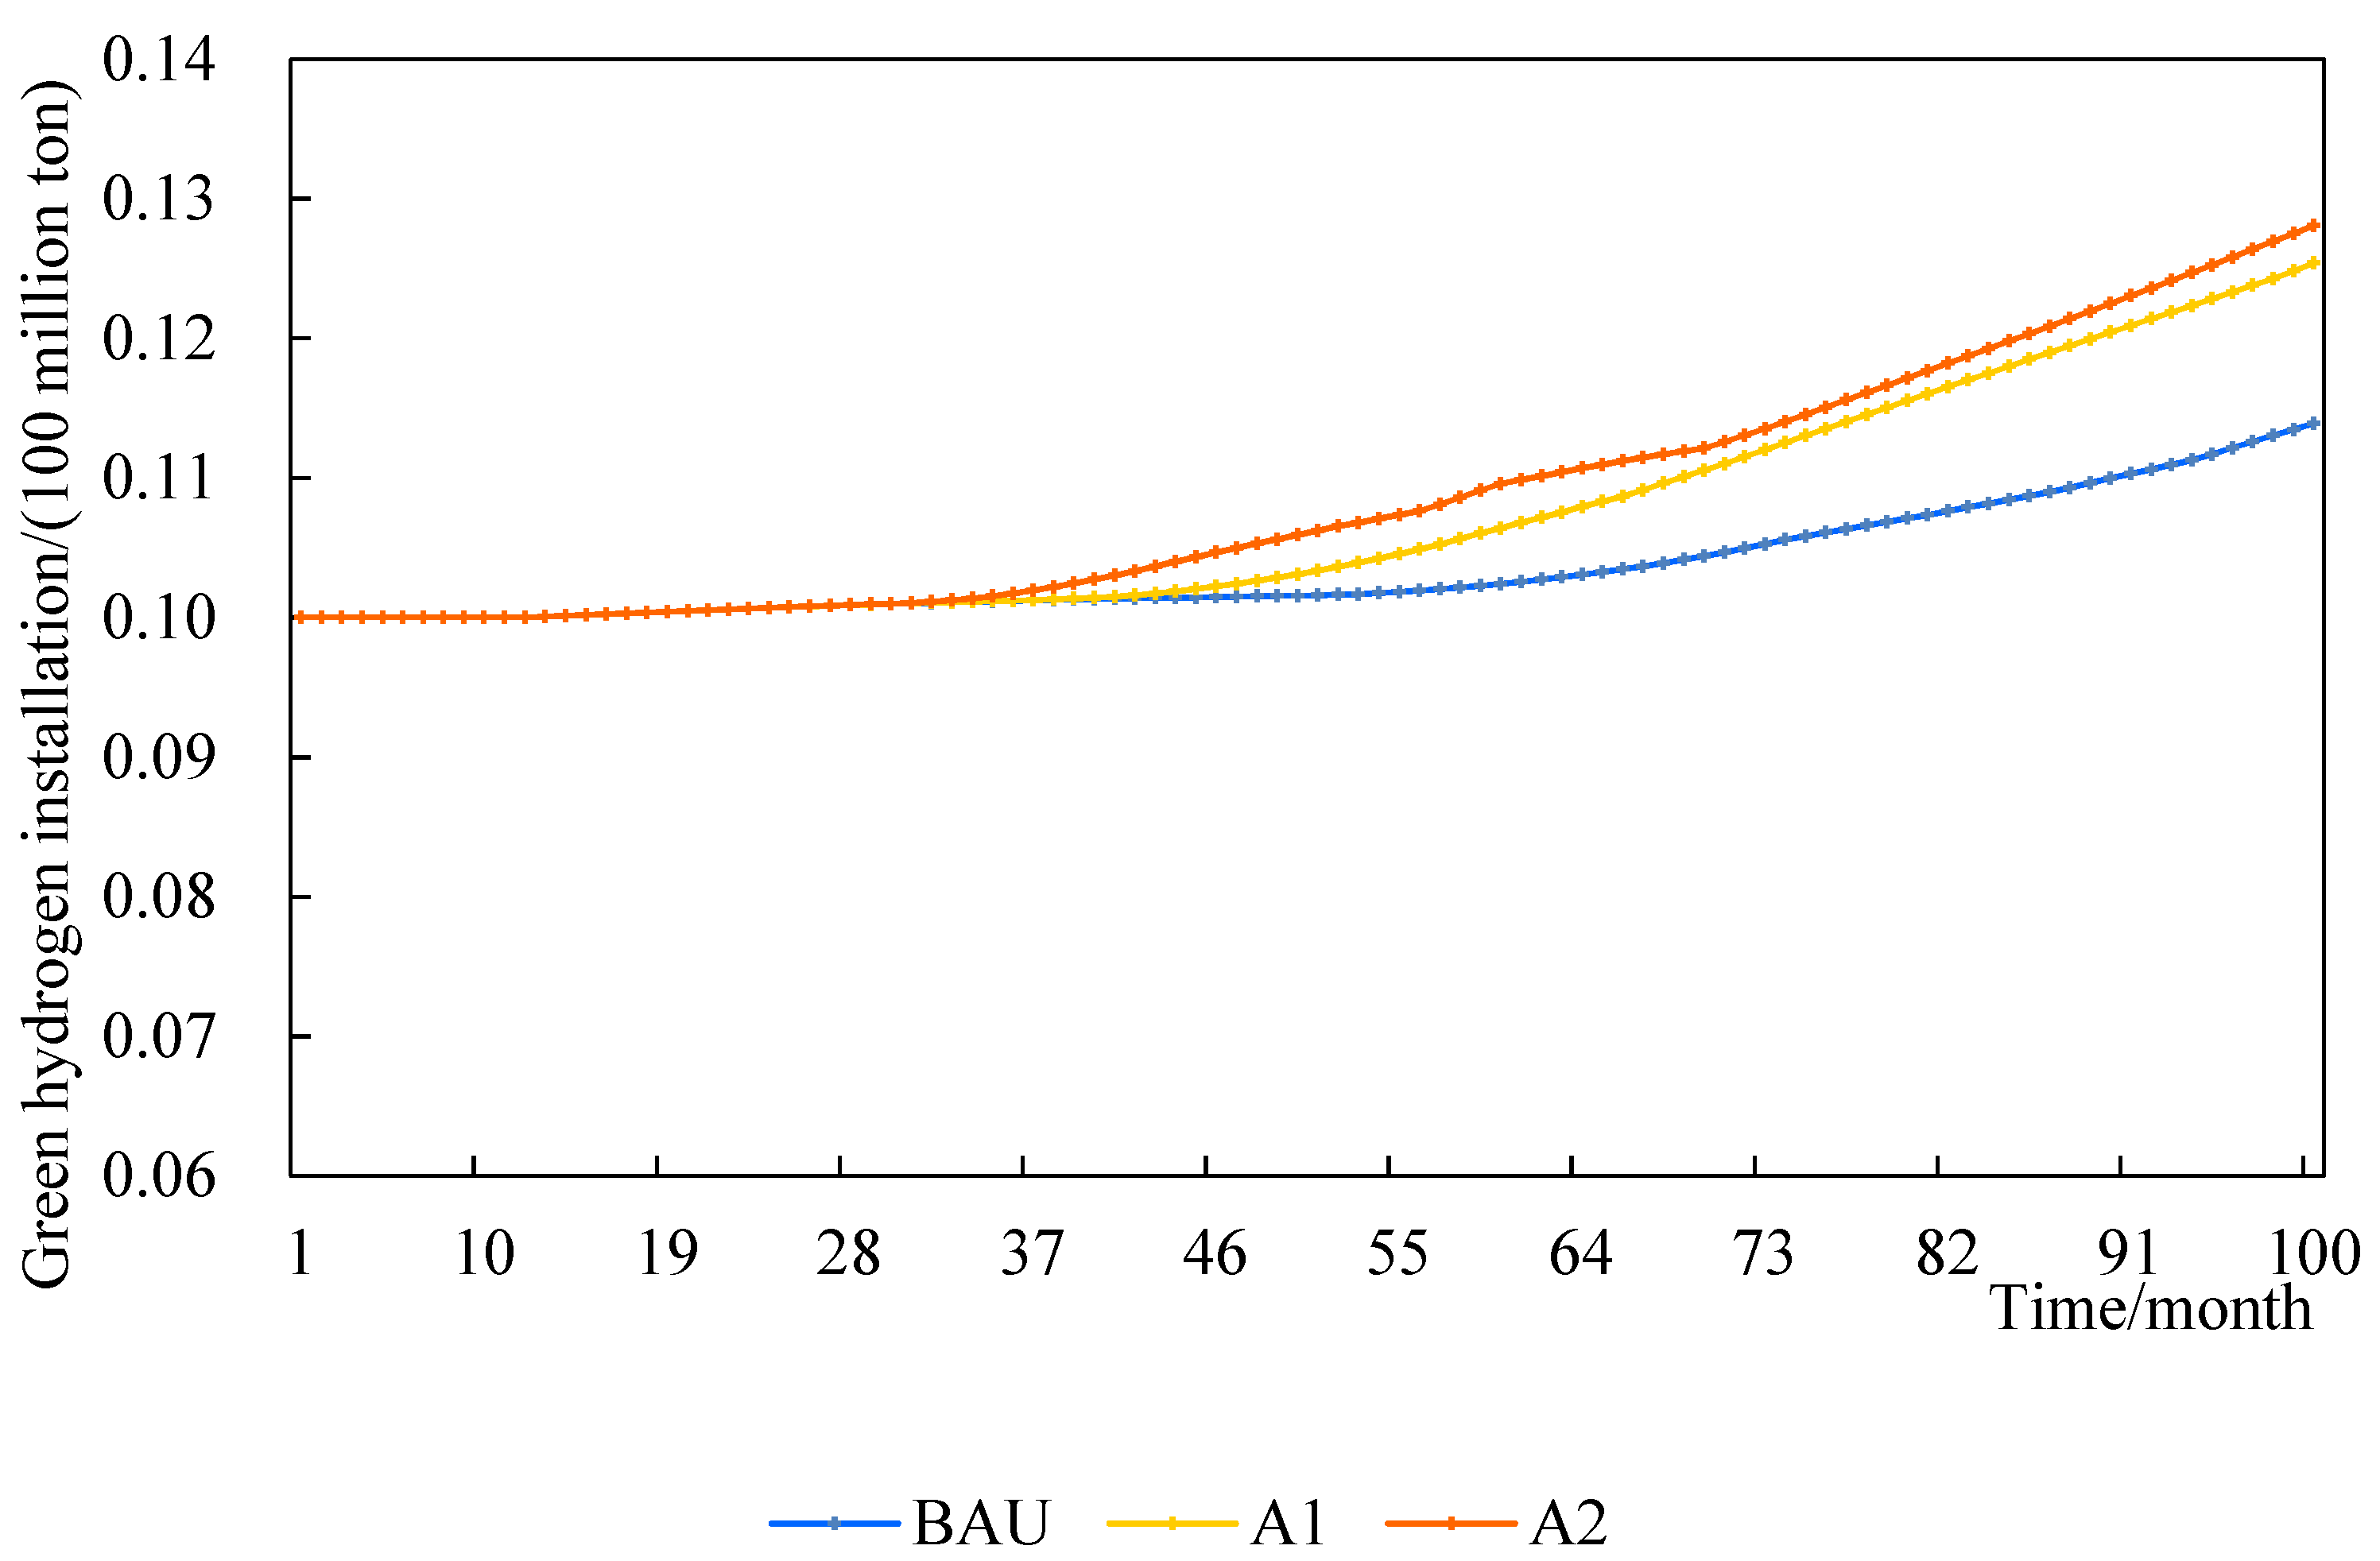
Figure 7 shows the trend of green hydrogen installation under different CCER offset ratios. This figure reveals that, on the one hand, all green hydrogen installations go through a “stable-rising” process, while on the other hand, the curve of green hydrogen installations tends to move upward with an increase in the CCER offset ratio; however, the change is not significant. This shows that when the price of CCER is low, enterprises will reduce their willingness to buy carbon emission rights and prefer to buy CCER. When the price of CCER is high, enterprises will be less willing to buy CCER and the production of green hydrogen will be reduced. Therefore, the CCER offset mechanism needs to be reasonably guided.
(3)
Simulation analysis of different green hydrogen certification ratios
Based on the CCER 5% offset ratio, the certification ratio for green hydrogen was set at 2.5%. However, as the recognition of green hydrogen increases, the certification ratio of green hydrogen also increases. Therefore, the green hydrogen certification ratio will be analyzed in this section. Figure 8 shows the trend of CCER price under different green hydrogen certification ratios. From the figure, we can see that the CCER price will experience a process of “slow decline–rapid increase”. In addition, as the ratio of green hydrogen certification increases, the process of rapid increase in the CCER price is delayed.
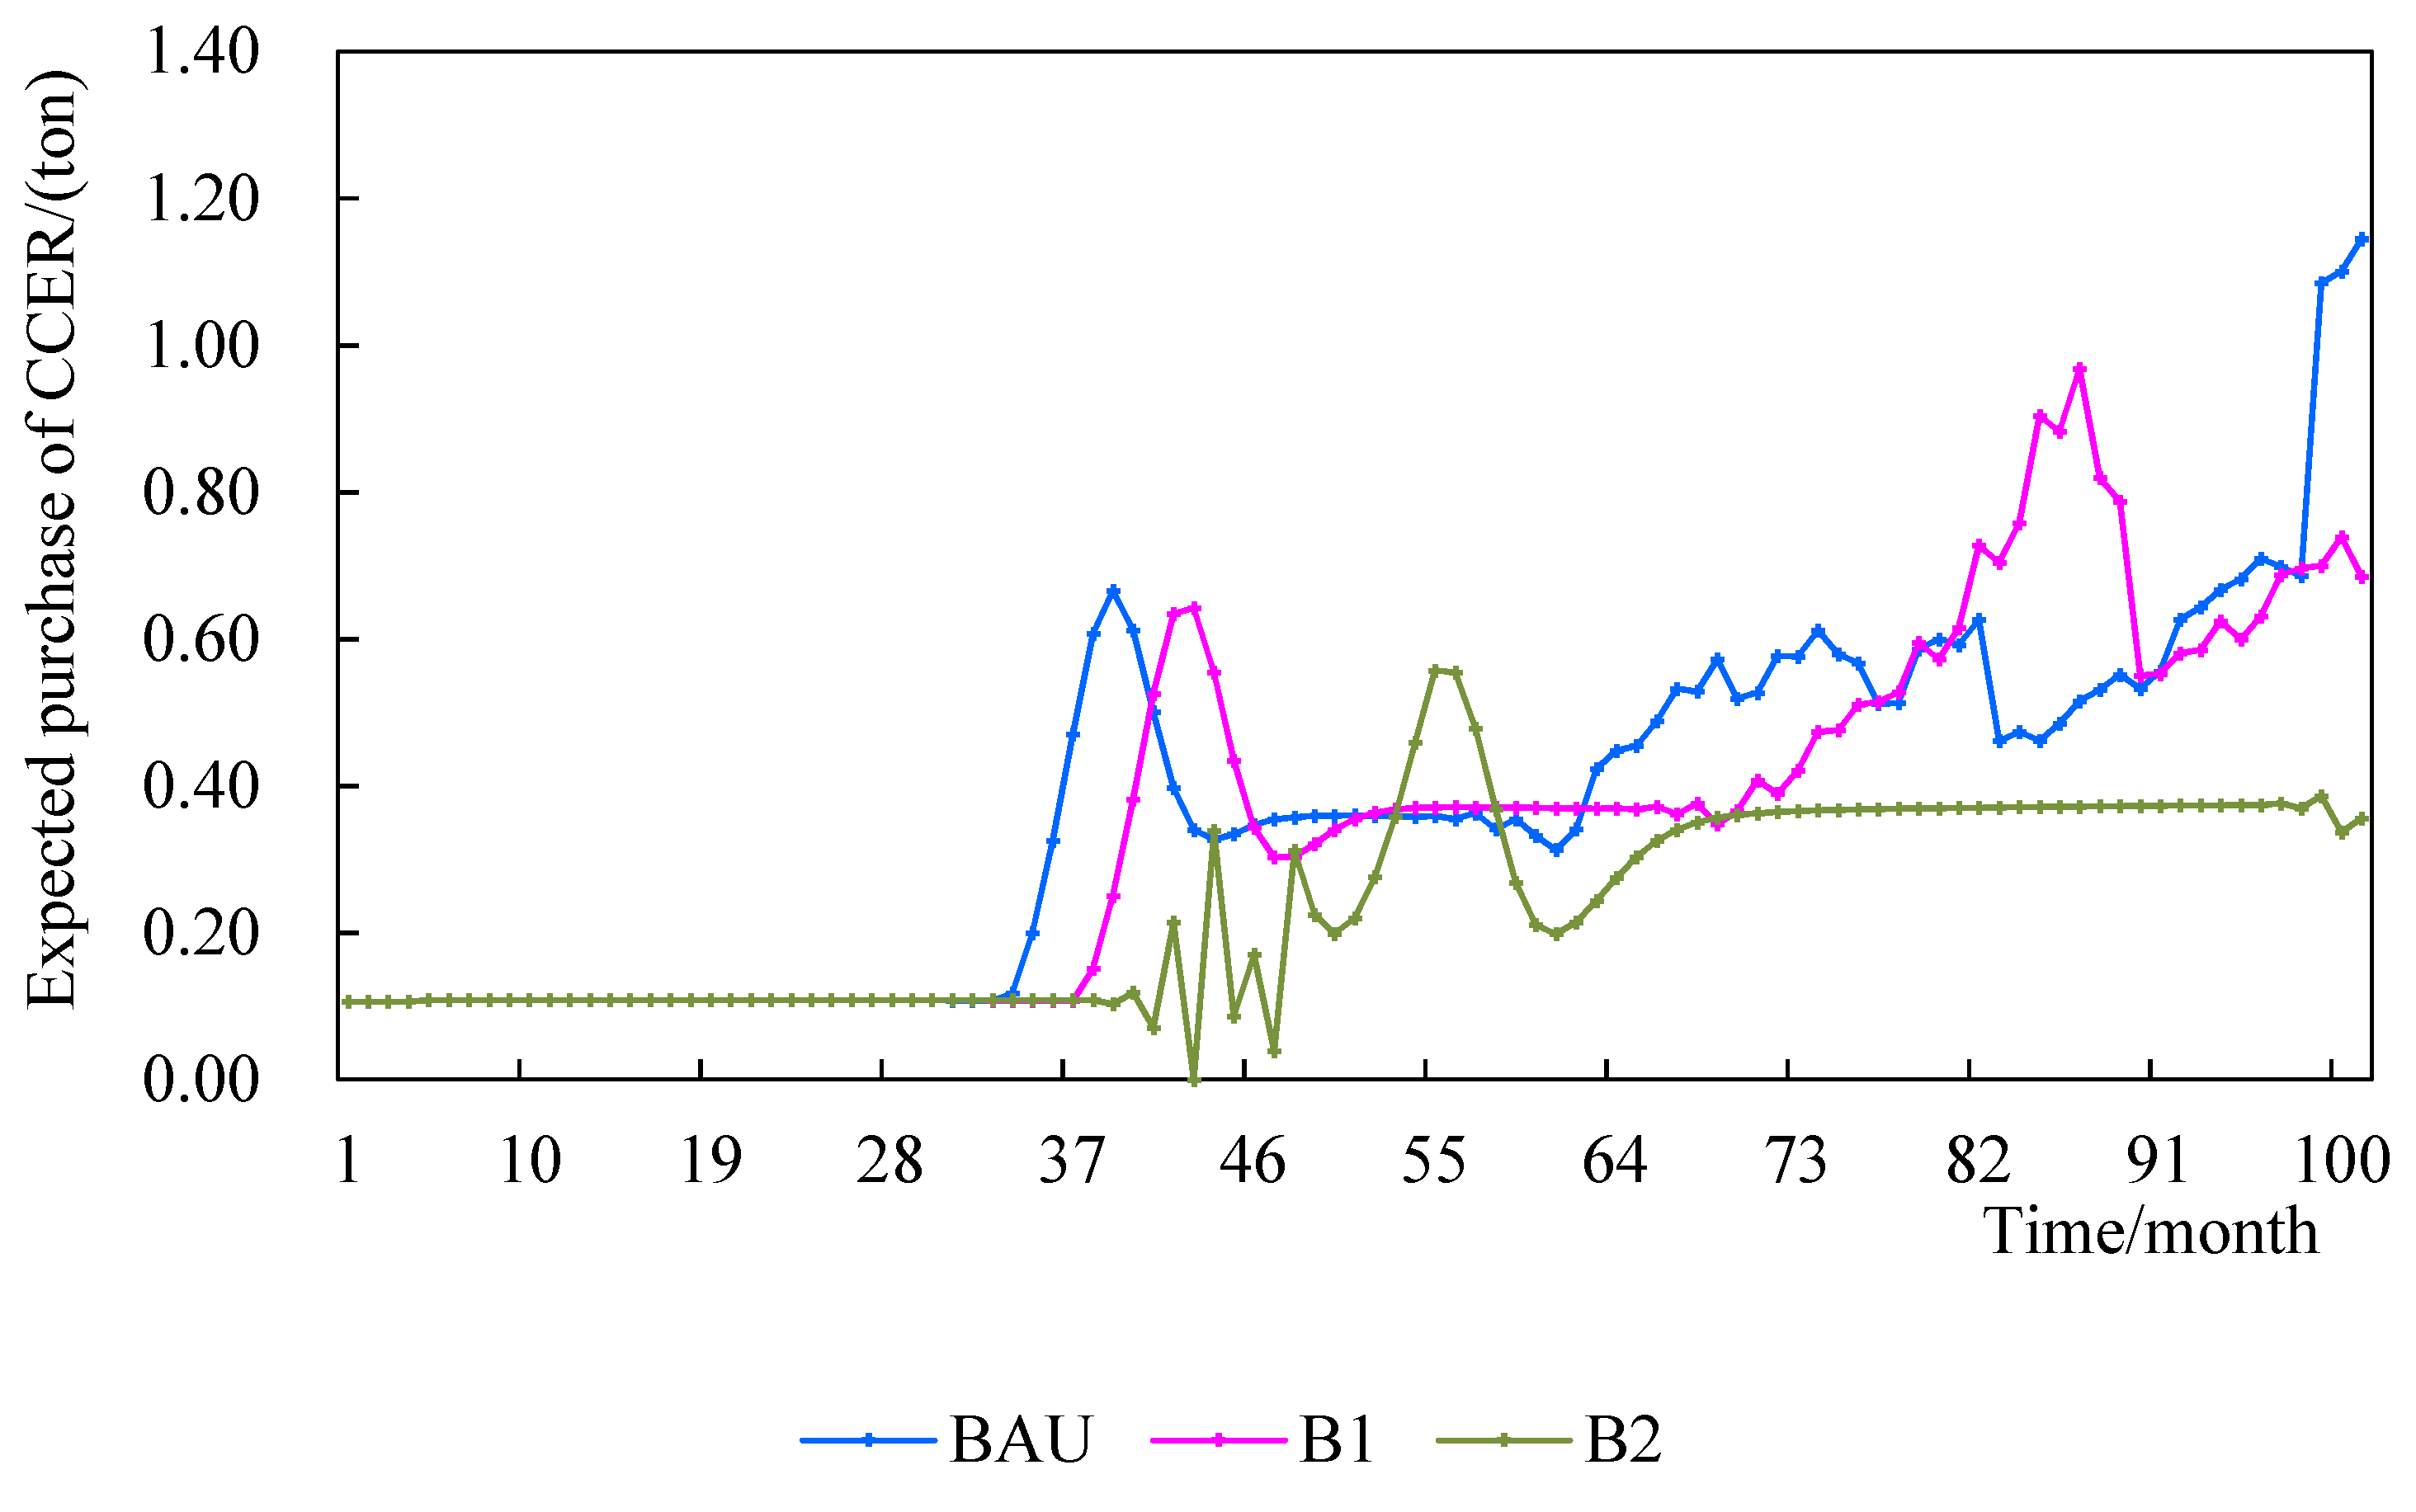
Figure 9 shows the trend of expected CCER purchases. The curves in the figure are analyzed. The demand for CCER decreases in the initial period, and the expected purchase of CCER rises after fluctuations. In addition, as the ratio of green hydrogen certification rises, the curves of expected CCER purchases are similar in the early stage, and the curves of expected CCER purchases shift down in the later stage. Based on Figure 8 and Figure 9, it can be seen that introducing green hydrogen projects into the carbon market requires reasonable control of the certification ratio. This will promote efficient, clean hydrogen projects in the carbon offset market.
(4)
Simulation analysis of different backward unit elimination rates
In response to the UN COP26 agreement on the phasing down of coal power, coal power units in China will be phased out, especially the outdated units. Based on this, this section will simulate the impact of phasing out the backward units on the system. Figure 10 shows the price trend of carbon emission rights under different phase-out ratios of the backward units. With an increase in the phase-out ratio of backward units, there is no significant difference in the carbon price curve at the beginning and the curve shifts downward at the later stage. The phase-out of outdated units reduces the demand for carbon allowances from emission-control enterprises, and the carbon price decreases under the market supply and demand structure.
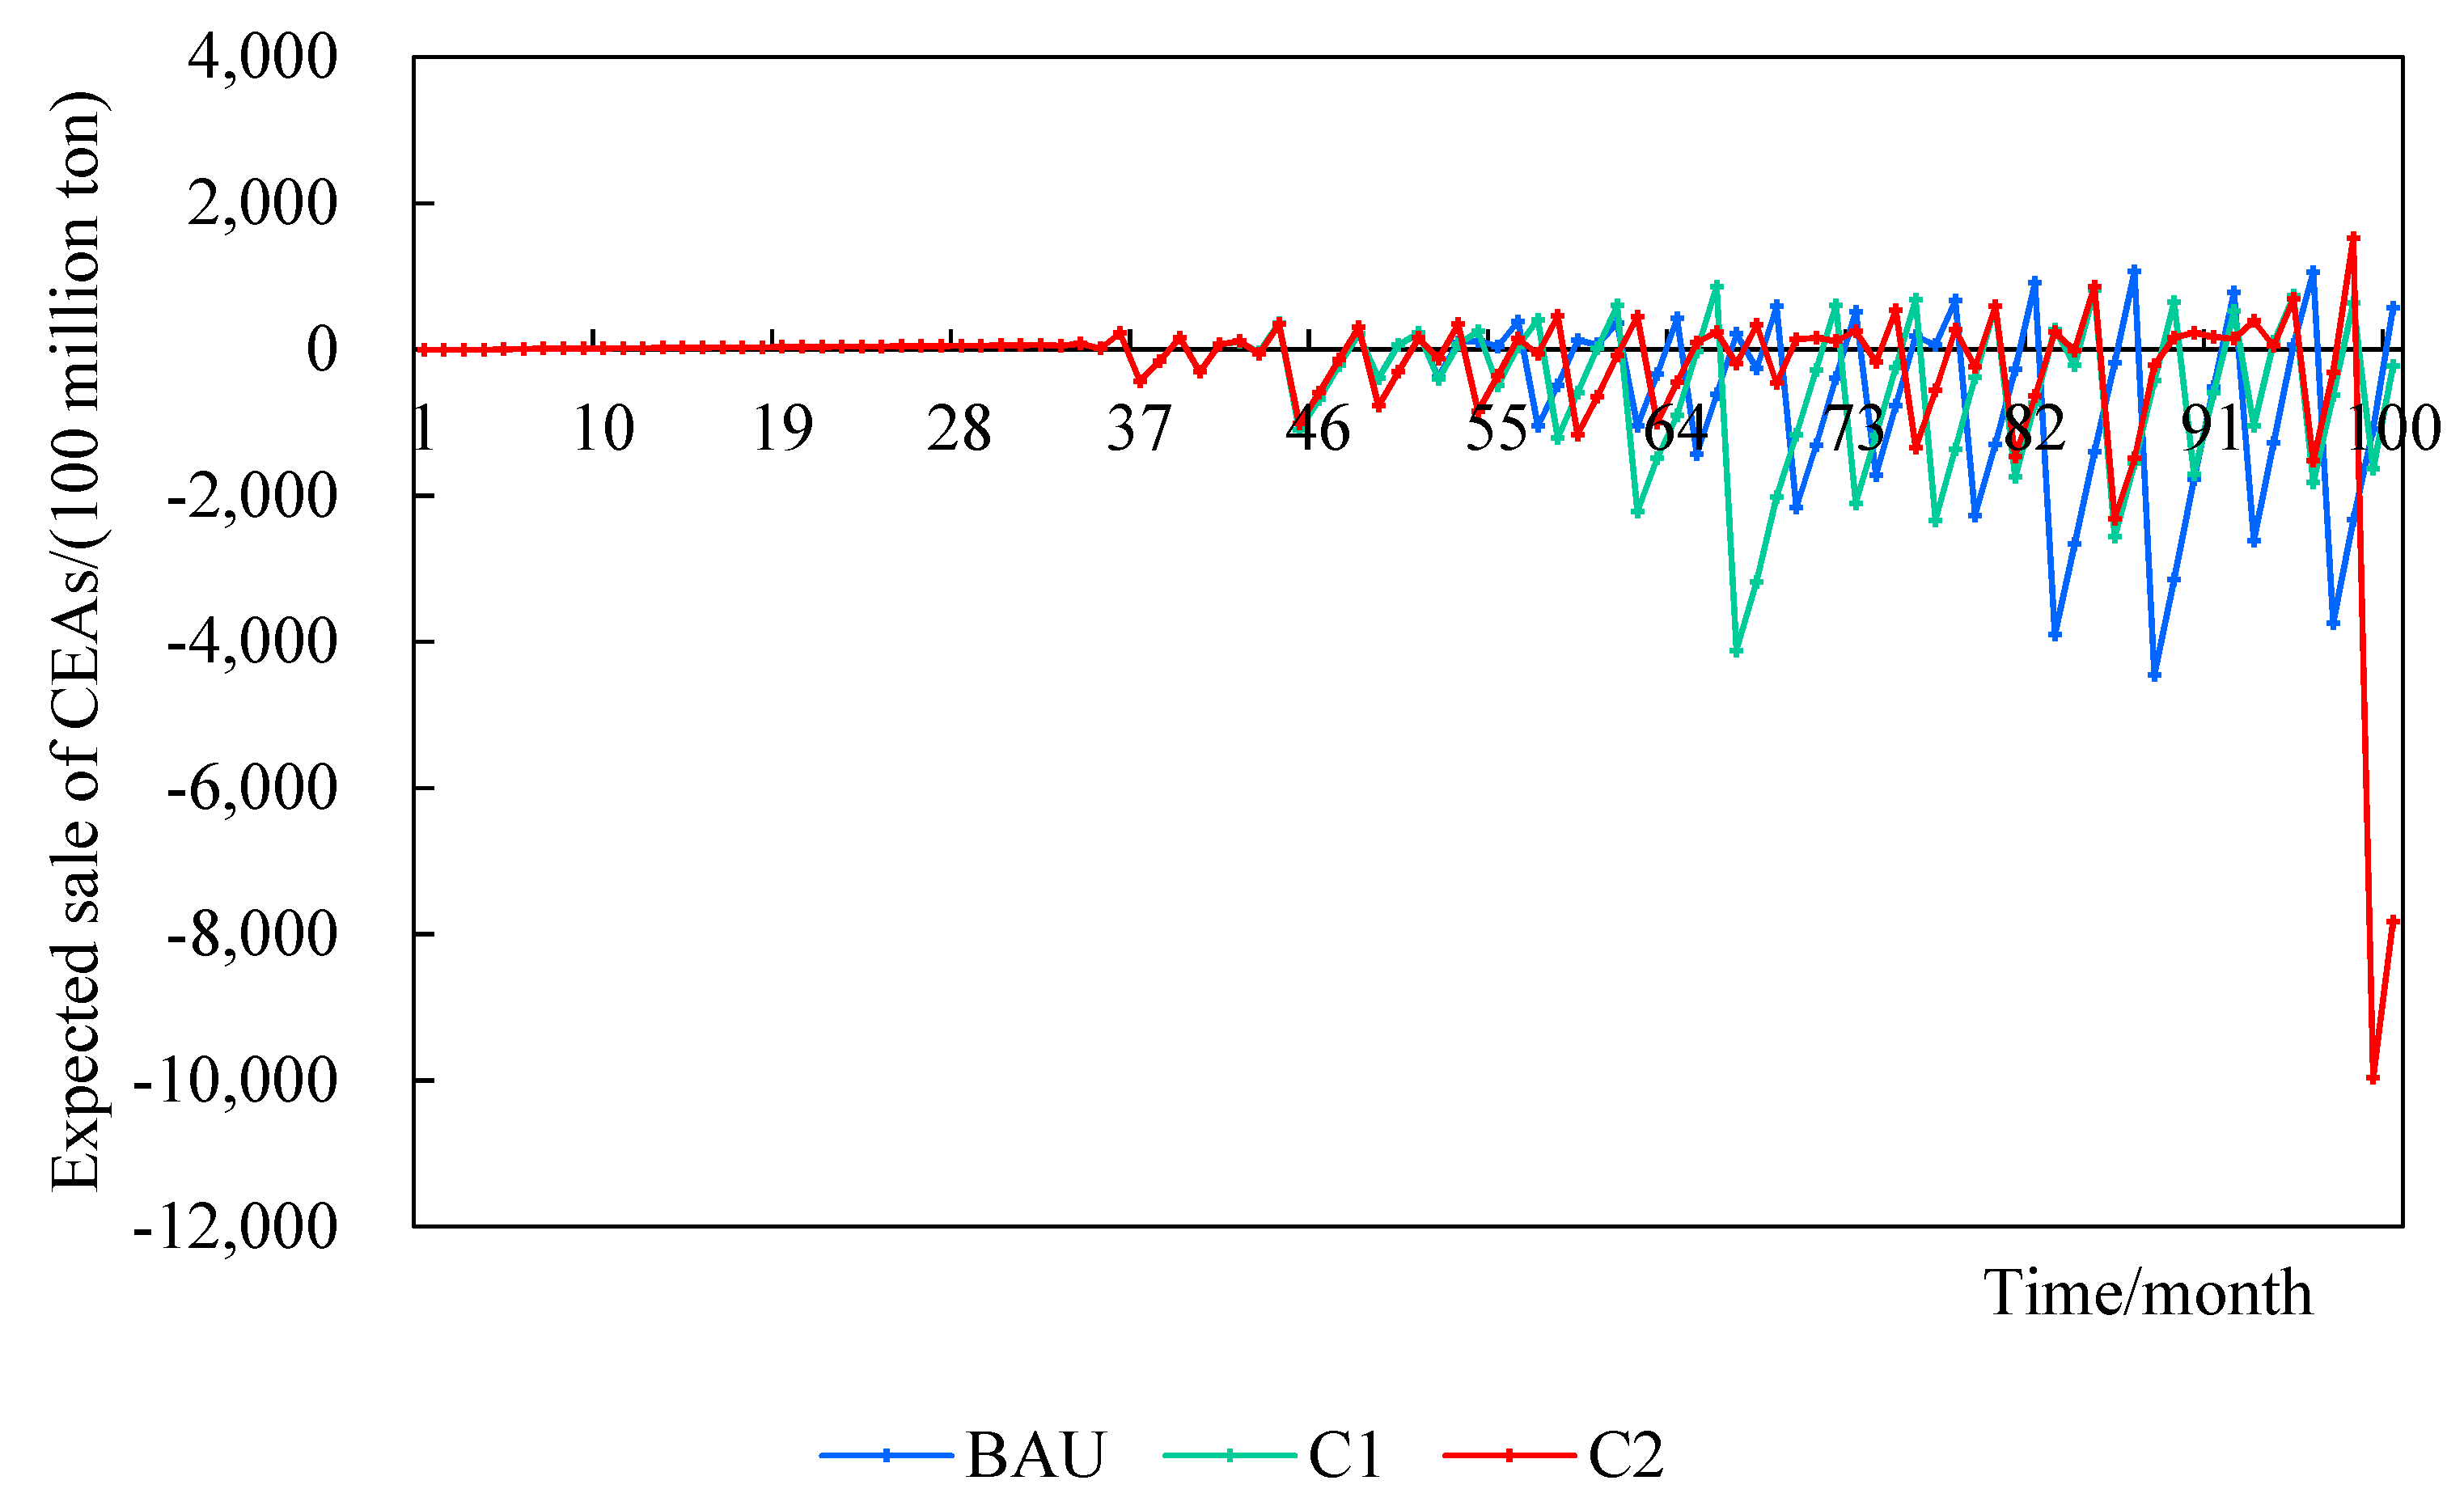
Figure 11 shows the curves of the expected CEA sales volume. The curves are smooth in the early stage and oscillate significantly in the later stage. Comparing the three curves, the difference between the three curves is not significant in the early stage. The higher the proportion of obsolete units eliminated in the later stage, the more volatile the curve of the CEAs’ expected sales volume is. With increased volatility of the carbon price, the sales volume of the carbon quota will show volatility.
(5)
Simulation analysis of different auction ratios
Currently, carbon quotas are allocated by the government for free, and in order to fully benefit from the usefulness of the carbon market quota, government departments will gradually introduce a paid auction mechanism. Therefore, this section examines the impact of introducing the auction mechanism in the carbon market. Figure 12 shows the trend of carbon price change under different auction ratios. From the figure, it can be found that an increase in the paid auction ratio will significantly pull up the carbon price.
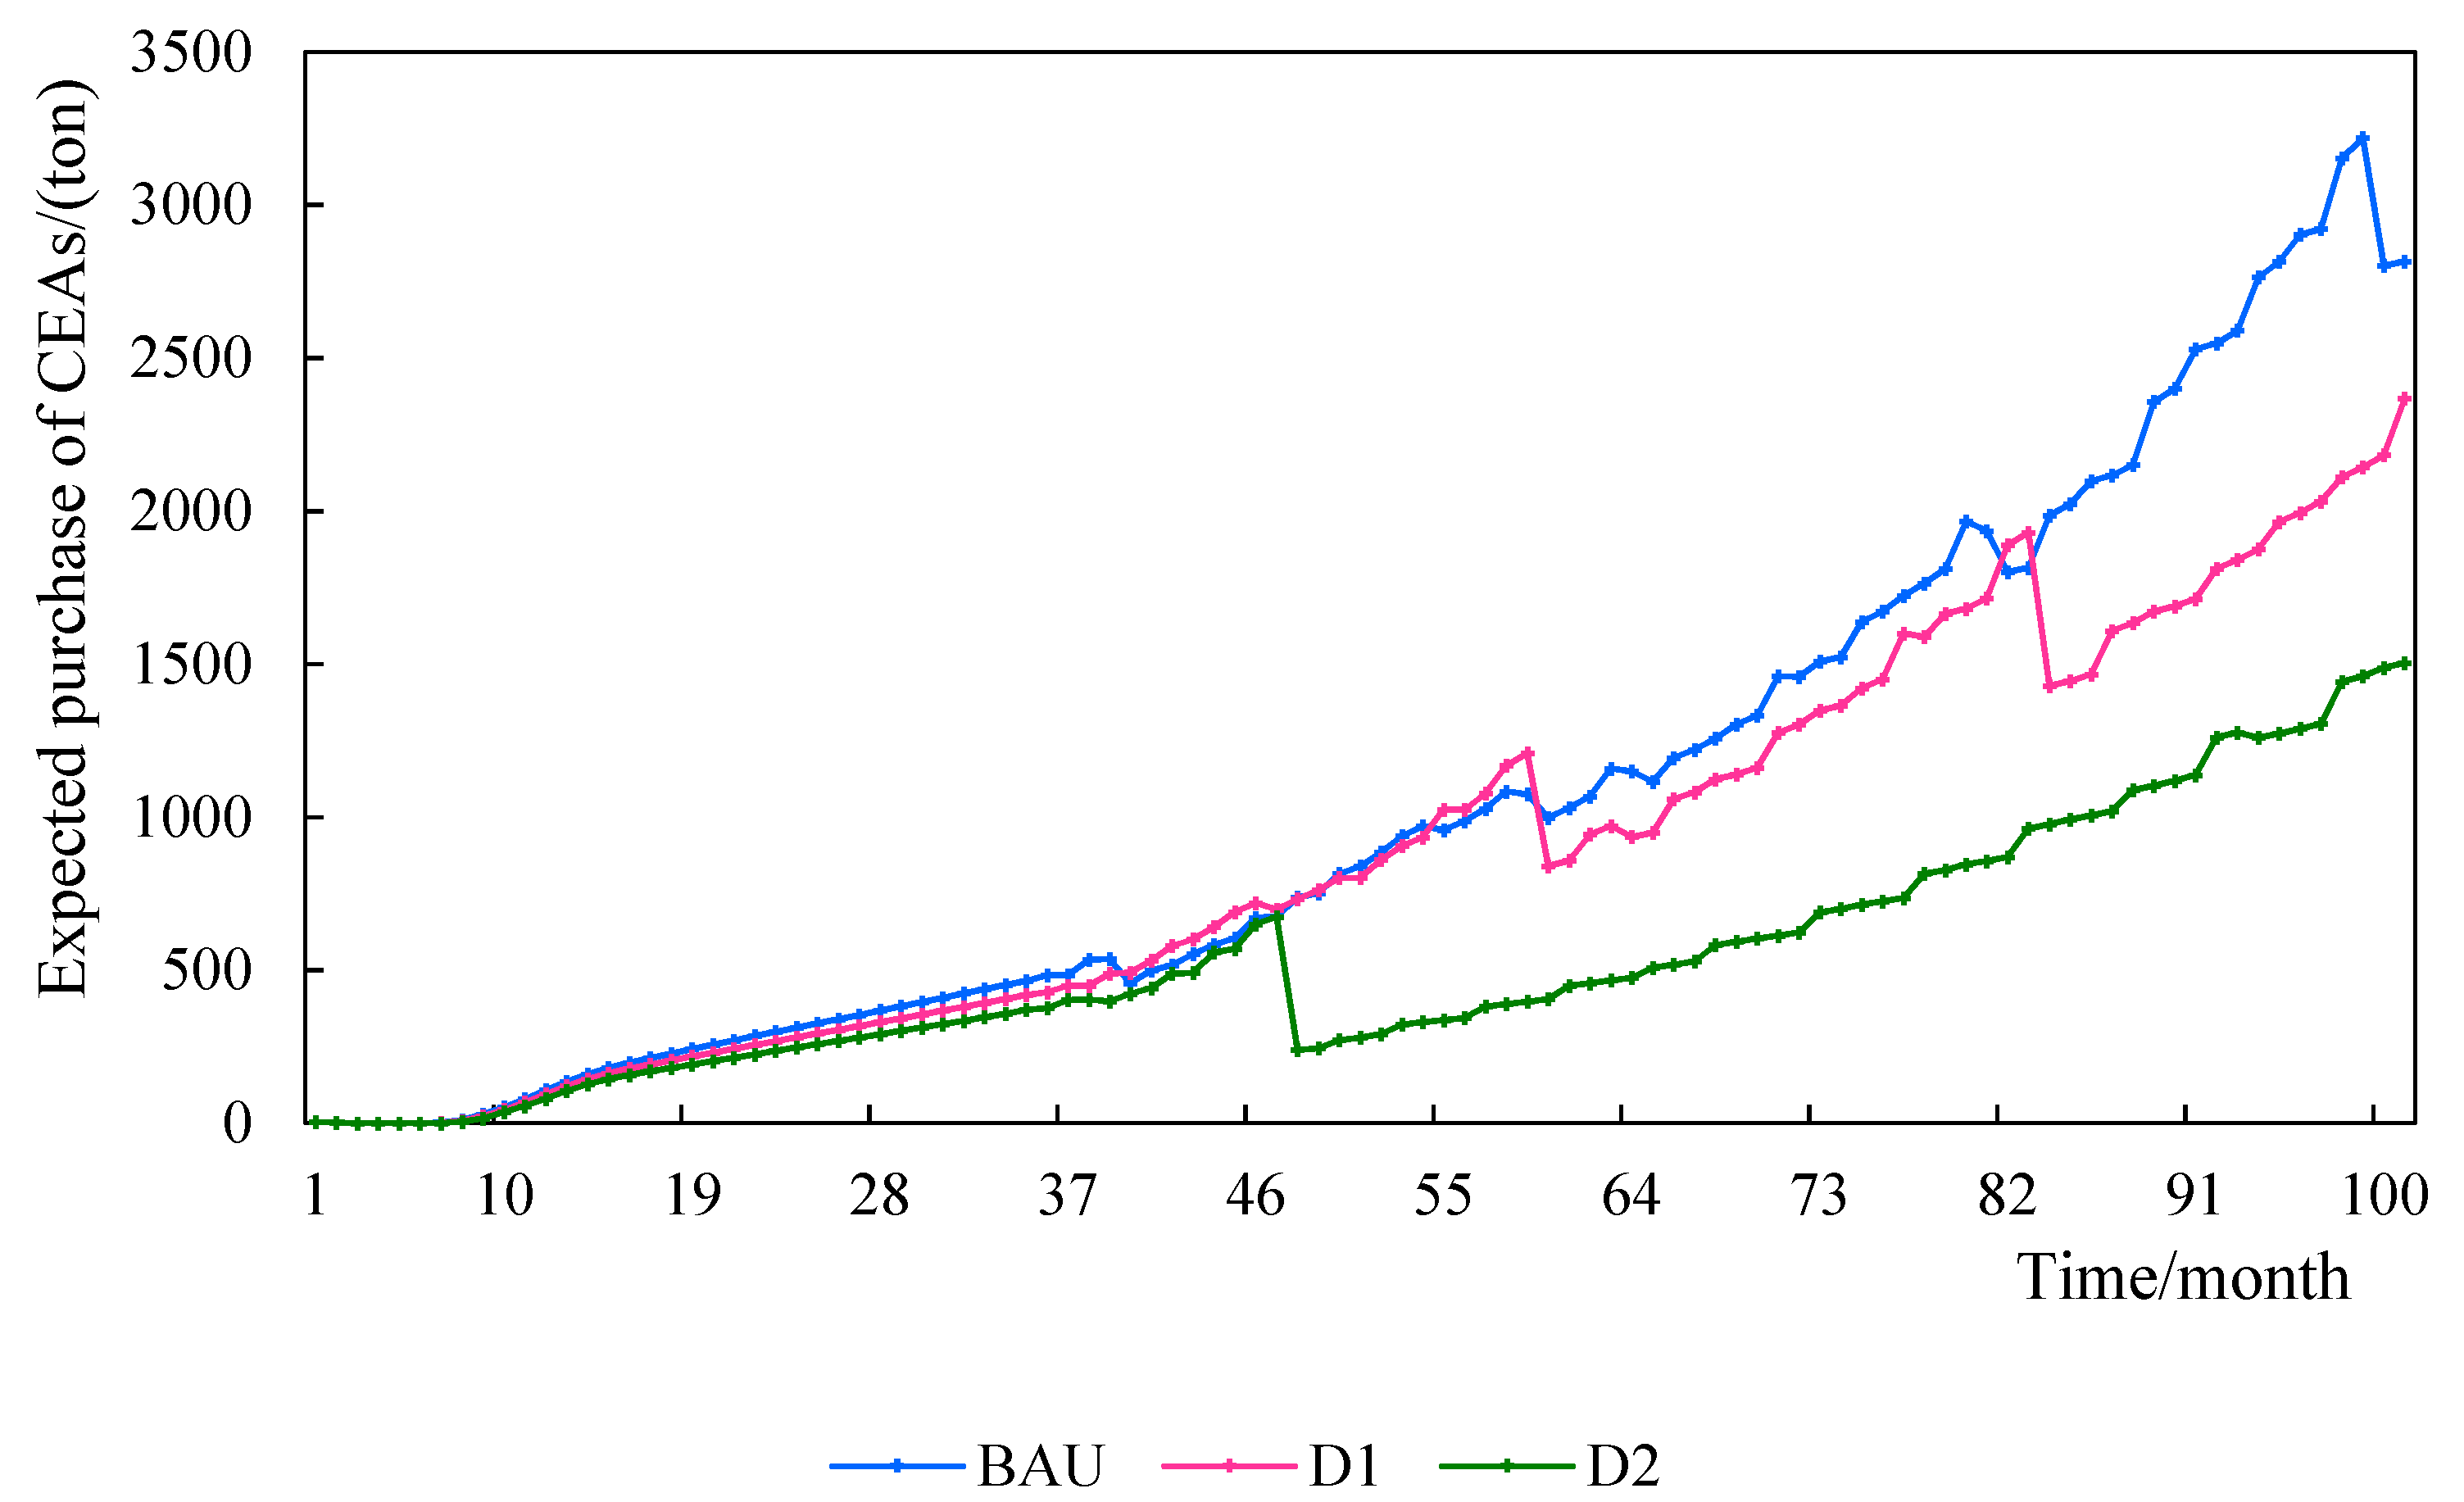
Figure 13 shows the trend of expected purchase of CEAs under different auction ratios. All three curves show an upward trend. In addition, as the auction ratio increases, the curve of the expected CEA purchase volume shifts downward. From Figure 12 and Figure 13, it can be seen that the paid auction mechanism distributes the external environmental costs caused by electricity production to power companies. The introduction of this mechanism helps in the discovery of carbon price and plays a signaling role for carbon price.
(6)
Comprehensive scenario-simulation analysis
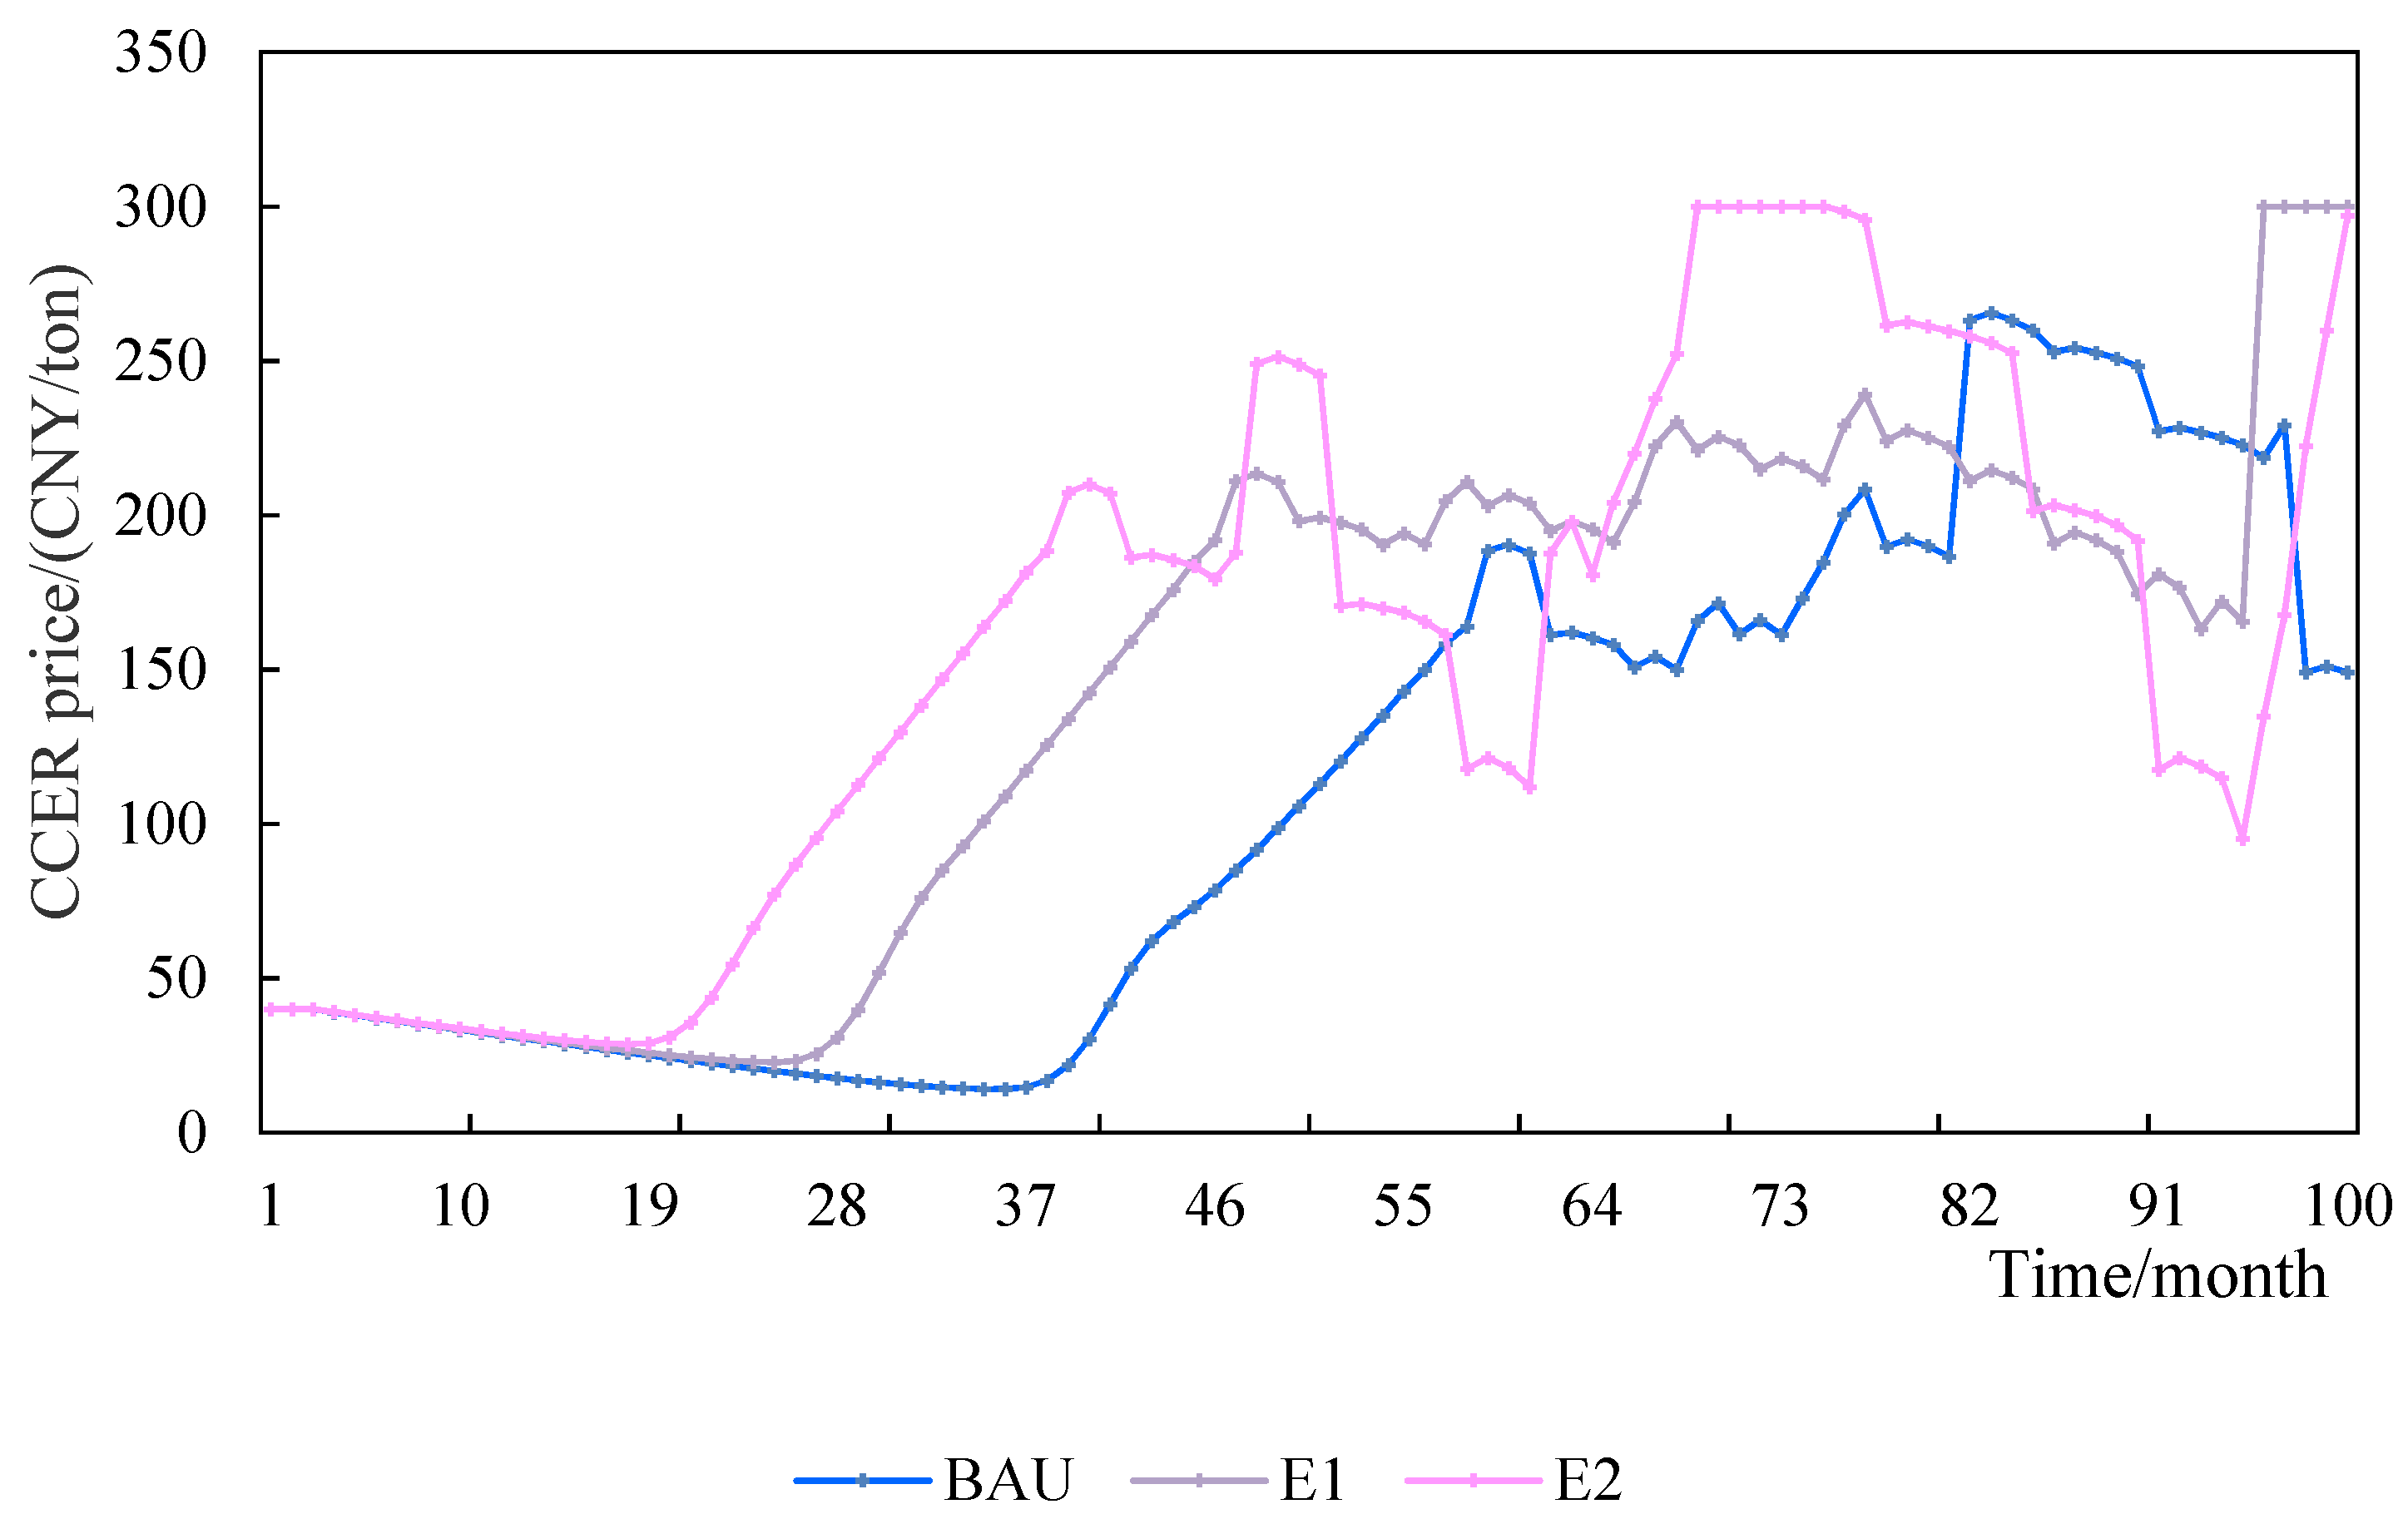
This section will comprehensively consider the impact of the CCER offset ratio, green hydrogen certification ratio, backward unit elimination rate and auction ratio on the system model. Figure 14 shows the trend of CCER price in the comprehensive scenario. The “rapid increase” in CCER price under the combined scenario will be advanced. It can be seen that the market price of carbon offsets shows an upward trend under the influence of multiple policies.
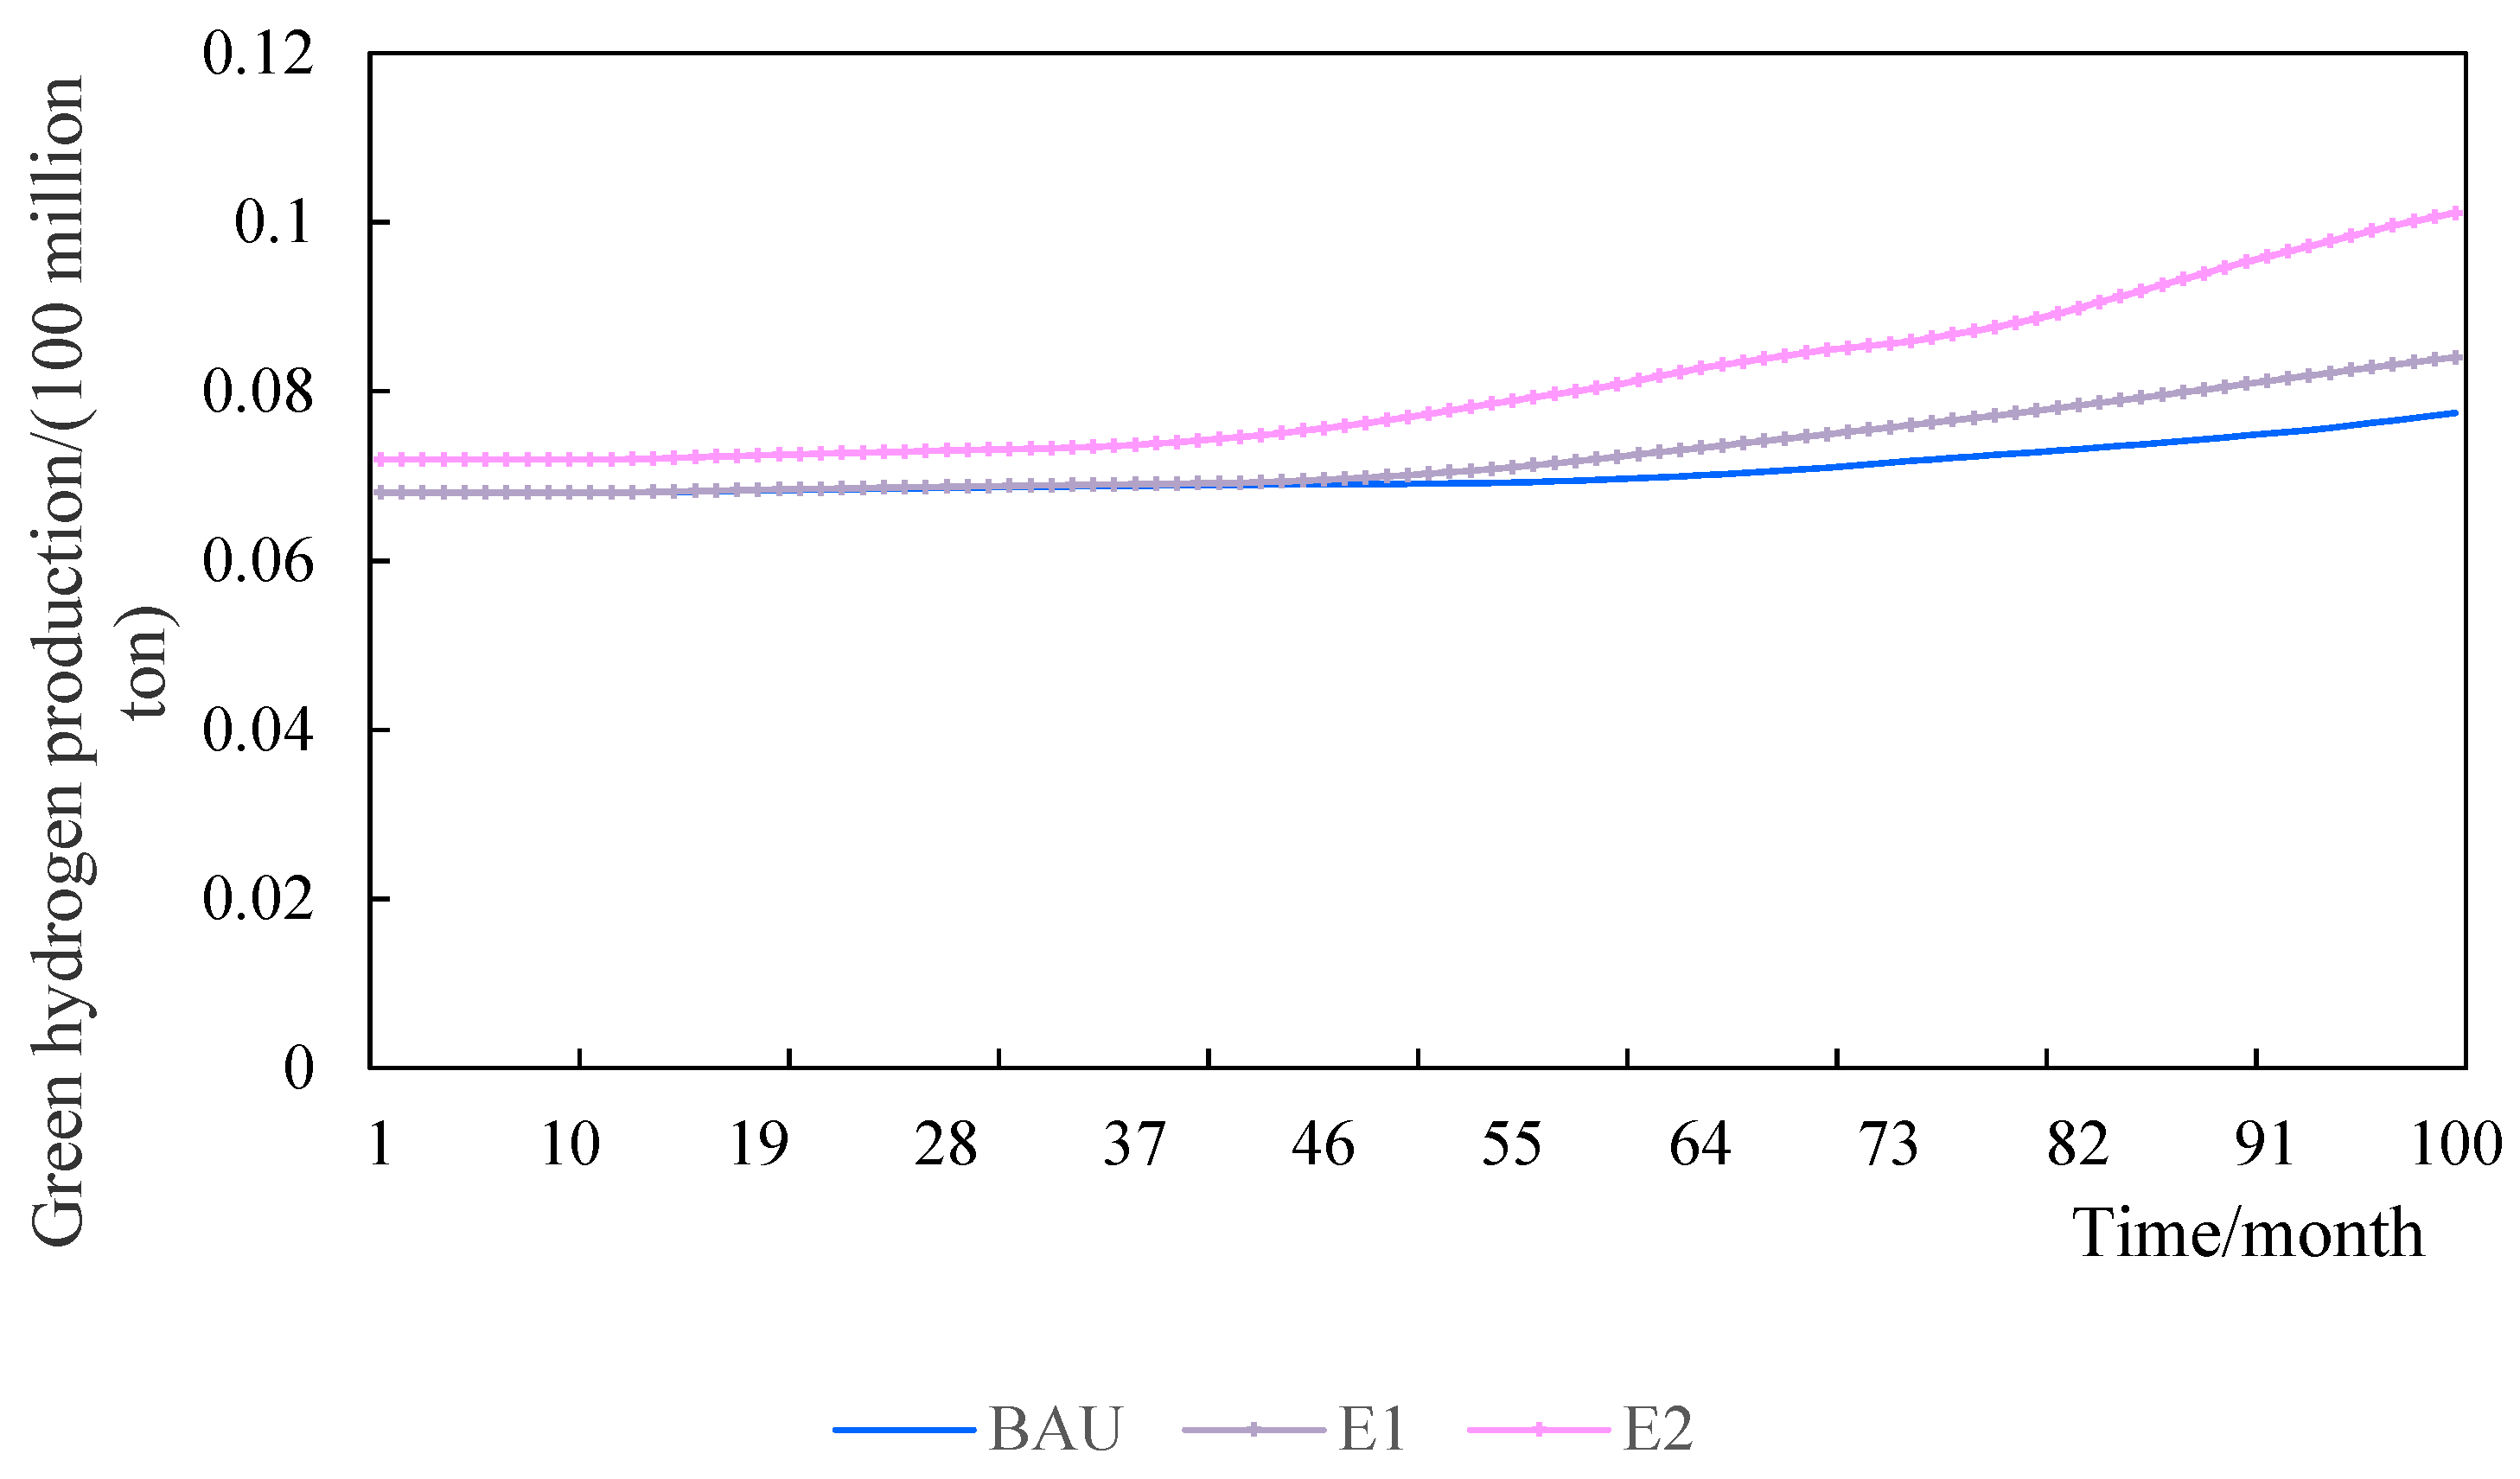
Figure 15 shows the trend of green hydrogen production. From the figure, we find that these three curves show an increasing trend, but the difference between the curves is not significant. The impact of multiple policies on the production of green hydrogen is not significant. The reason may be that the proportion of green hydrogen projects entering the carbon offset market is low and there is no significant increase in the revenue for green hydrogen producers. The country needs to introduce more supportive policies to promote the development of the green hydrogen industry.
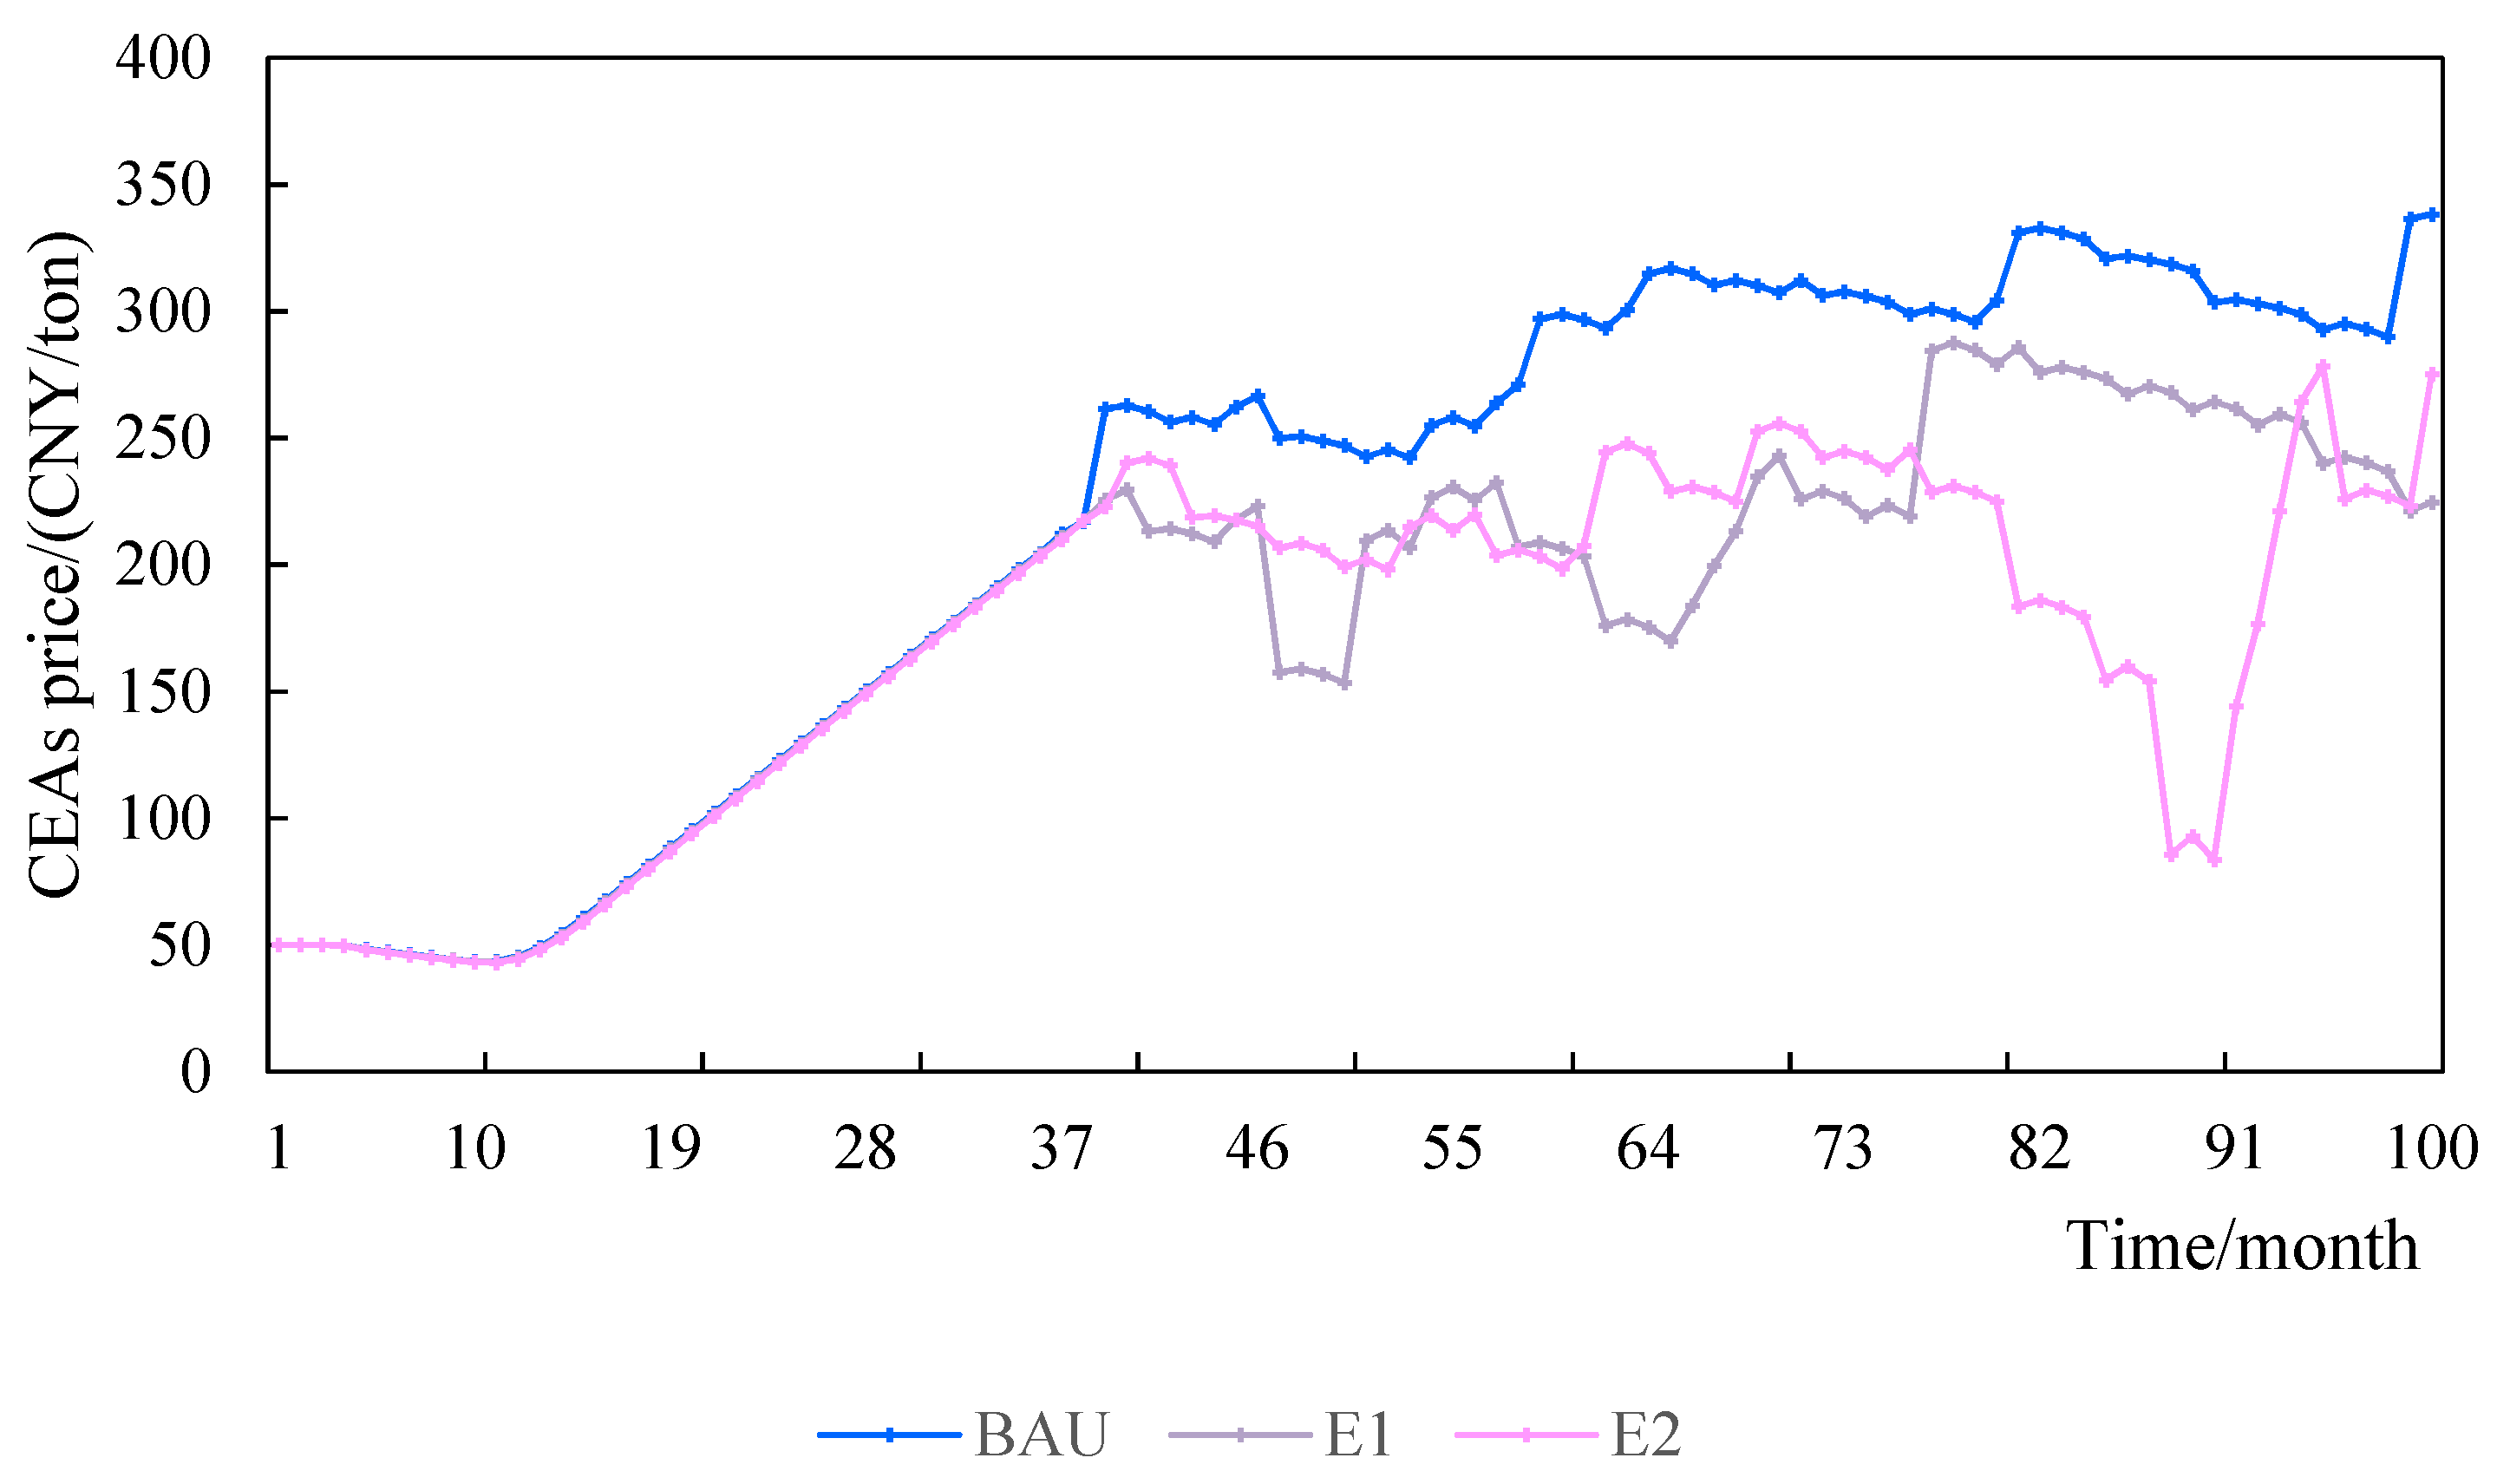
Figure 16 shows the trend of carbon allowance price. These three curves show the process of “stable–rapidly rising–rising in oscillation”. As the proportion of multiple factors increases, the carbon price moves downward in the later stage. Considering Figure 14 and Figure 16 together, we can see that the carbon price is significantly higher than the CCER price in the base scenario. The carbon price is similar to the CCER interval in the integrated scenario, with both fluctuating in the range of 40 CNY/ton to 300 CNY/ton.
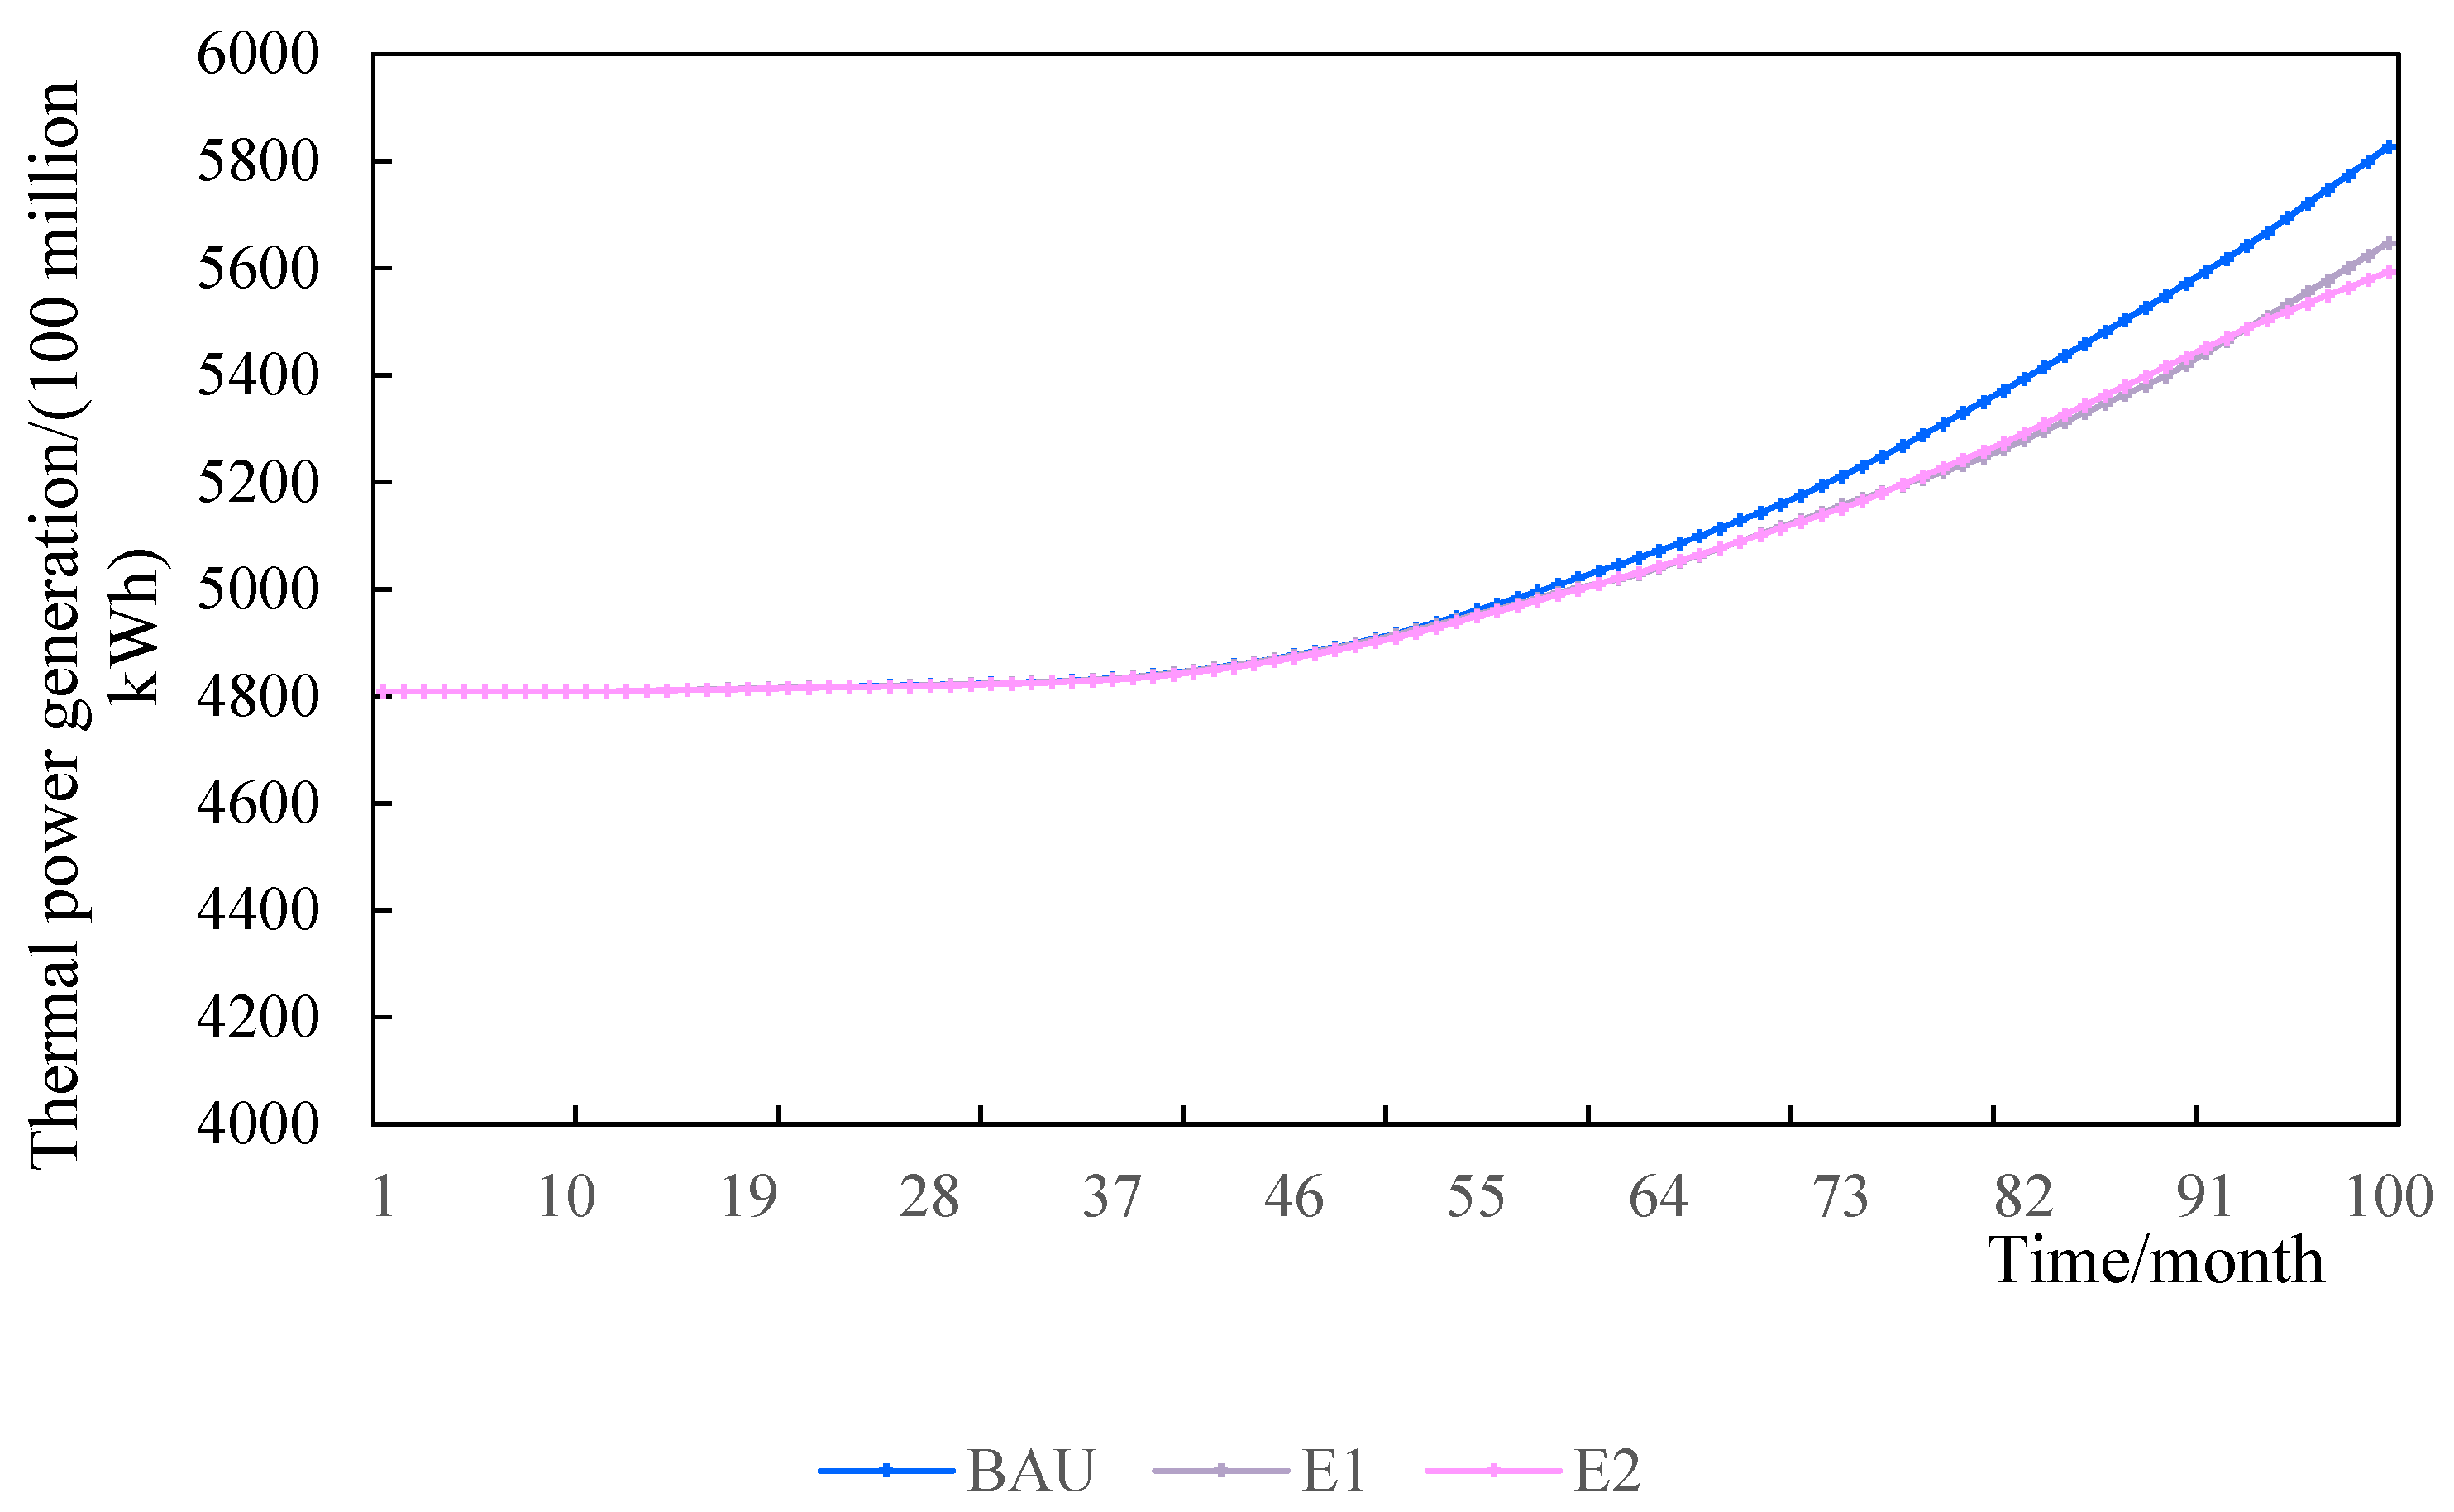
Figure 17 shows the trend of thermal power generation. We find that thermal power generation as the main supply body of electricity shows a certain degree of increase. With an increase in the proportion of each influencing factor, thermal power generation shows an increasing trend. However, the changes in the three curves are not significant. The reason may be that the thermal power-production space is compressed to the minimum to ensure the security of normal energy supply under the pressure of multiple policies.

5.2. Discussion

Based on above system-simulation results, a further in-depth analysis and discussion are presented:
First, the rising trends of the carbon price and CCER price in the basic scenario are consistent with the conclusions of the scholars Qi et al. [31] and Wang et al. [32]. The main reasons are that from the current trading situation of the national carbon market, the carbon price fluctuates at the level of 50 CNY/ton. Compared with the international carbon price, China’s carbon price is still low, and there is much room for growth. The carbon price signal formed by the carbon market is the premise for guiding capital to support the realization of the “double carbon” goal efficiently. It is also the key to stimulating the decarbonizing transformation of production and consumption modes. In addition, compared with the supply of CCER projects, its effective demand is seriously insufficient. The demand for CCER comes from buyers who are willing to reduce emissions and enterprises subject to emission limits. An increase in the CCER offset proportion will promote an increase in green hydrogen production. Compared with quotas, CCER has a flexible access and trading mechanism, which is favored by investors and emission-control enterprises. Even if the offset ratio rises, the price will still rise in the future.
Second, from Part (1) and Part (3) of Section 5.1, it can be found that green hydrogen production shows an upward trend, which has been recognized by many scholars. Pan et al. [33] said that hydrogen has huge application potential in energy storage and utilization, which is helpful for the consumption of renewable energy in power systems. Li et al. [34] believed that hydrogen production from renewable energy is one of the main ways to achieve carbon neutralization using hydrogen energy in the future. Due to the small volume of voluntary greenhouse gas emission reduction transactions and the lack of standardization of individual projects, the development of CCER is hindered. However, the scale of emission reduction projects will expand with the continuous improvement of market mechanisms. An increase in the proportion of green hydrogen project certification is inevitable. With the opening of CCER filing and approval, a large number of green hydrogen projects entered the market. These have led to a gradual decline in CCER prices. In the case of sufficient emission reduction projects, it is expected that the desire to buy will decrease accordingly.
Third, the elimination of backward units in the power market will lead to a decline in carbon price, while the introduction of the carbon market auction mechanism will increase the carbon price. In the short term, backward thermal power will accelerate its withdrawal. According to the data from the International Energy Agency, the carbon dioxide emissions of small thermal power units are 28% higher than those of large units. Based on the cumulative average transaction price of domestic carbon trading pilot projects, the carbon cost of small thermal power units is 0.003 USD/(kW·h) higher than that of large units [35]. The auction mechanism of carbon quotas will reduce the total amount of free quotas, and promote a rise in carbon trading price under the constraint of emission reduction [36]. The introduction of an auction mechanism can better reflect the principle of “polluter pays”. In the process of the development of the EU carbon emission system, we can gradually expand the proportion of auction allocation, replace free allocation with quotas in the form of auctions, and gradually increase the cost of enterprises to encourage emission-control enterprises to take emission reduction measures [37]. However, the carbon trading system of the US Regional Greenhouse Gas Initiative, which allocates quotas through full auctions, stimulated the activity of the carbon market through a reduction in the quota quantity in 2013 [38]. The effectiveness of carbon trading policy tools requires coupling of the power market and carbon market to form the linkage of the “electricity–carbon” market.

6. Main Conclusions and Policy Recommendations

6.1. Main Conclusions

This study first analyzes the coupling mechanism of the green hydrogen market, national carbon trading market and electricity market. Second, the green hydrogen market–national carbon trading market–electricity market model is built and simulated using the system dynamics method. Finally, the multi-scenario analysis method is used to study the impact of the CCER offset ratio, green hydrogen certification ratio, backward unit elimination rate, auction ratio and comprehensive scenario factors on the system. Based on the above research results, the main conclusions are as follows:
First, the operation of the system under the benchmark scenario shows that the system dynamics model built in this paper can make the green hydrogen market–national carbon trading market–power market coupling operation feasible. It not only helps to curb the carbon emissions of the power industry, but also helps in the consumption of renewable energy power. The result also shows that exploring the green hydrogen carbon emission reduction market-based trading mechanism is feasible. The emission reductions generated from clean hydrogen are included in the voluntary carbon emission reduction market for trading, and national hydrogen exchange can be explored in the future. The feedback mechanism constructed in this paper can stimulate an increase in carbon price and control the increase in thermal power generation and green hydrogen production.
Second, by analyzing the scenarios of different CCER offset ratios and different green hydrogen certification ratios, the CCER offset ratio needs to be reasonably controlled. Although an increase in offset ratio promotes an increase in green hydrogen production, it is not significant. The core of the carbon market formation mechanism is the control of the total quotas. If the offset ratio is too high, it is equivalent to increasing the total supply in a disguised way. It will change the supply-and-demand relationship of carbon market quotas, thus affecting the market price of quotas. An increase in the certified proportion of green hydrogen increases the supply of CCER, prompting downward movement of the CCER price curve. Green hydrogen provides certain benefits through certification, which can effectively improve the industrialization process. Therefore, the government should further issue support policies for the hydrogen energy industry, further expand the scale of green hydrogen projects, and make more green hydrogen enter the carbon trading market with certification.
Third, through the elimination of backward units, the introduction of auction mechanisms and the simulation of comprehensive scenarios, the “electricity–carbon” markets will continue to be reformed and improved. Carbon constraints will force the elimination of backward units. The increase in the proportion of auction mechanisms will help in the discovery of carbon prices. The two policies jointly promote the optimization of the power market structure. The government can consider these two policies to help achieve the “double carbon” goal. In the comprehensive scenario, the implementation of multiple policies will raise the price of CCER but lower the carbon price. Therefore, in view of the current development status of the electricity market, hydrogen energy market and carbon market, the corresponding energy conservation and emission reduction policies should be implemented in steps to link with the existing policies.

6.2. Policy Recommendations

Based on the above research results and main conclusions, the following policy recommendations are proposed for the coordinated development of China’s green hydrogen market, national emissions trading market and electricity market:
First, we should accelerate the construction of the carbon emission reduction trading mechanism for green hydrogen. Introducing green hydrogen into the voluntary carbon emission reduction market and electricity trading market will bring dividends to the green hydrogen industry. In the future, it is expected that a hydrogen energy exchange will be established and a common integration mechanism with the electricity market and the carbon market will be formed. This will not only bring more green cash-flow channels to the development of the hydrogen energy industry, but will also increase the financing space for the hydrogen energy industry. The commercialization and large-scale development of the hydrogen energy industry will also have a more complete market mechanism, and will also promote the coordinated development of the “green hydrogen market–national carbon trading market–electricity market”.
Second, we should set a reasonable CCER offset ratio and green hydrogen certification ratio. In the process of determining the offset ratio, the government needs to consider the mature development experience of foreign carbon markets. In addition, the excessive administrative discretion caused by frequent adjustment of the offset ratio in the domestic market, as well as the uncertainty of market expectations caused by frequent adjustment of the offset ratio, should be addressed, as the adjustment will lead to abnormal fluctuations in market prices. Standardized processes and audit mechanisms should be established for green hydrogen certification to encourage efficient green hydrogen projects to enter the market.
Finally, we should improve the trading mechanisms of the national carbon emission market. At present, the carbon market is in the initial stage, and the carbon market has not fully benefited from effect of the reverse-force mechanism on emission-control enterprises and the signal of carbon prices. In the future, the national carbon emissions trading market needs to introduce a paid auction mechanism so that enterprises can really pay for their external environmental costs. In addition, the power market also needs to speed up the elimination mechanism of outdated units and optimize the installed structure of the power market, so as to optimize the energy structure of the power market.
This research has some limitations still need to be improved upon. On the one hand, renewable energy power generation can participate in green electricity trading, can be converted into a green electricity certificate, and can also be converted into CCER to participate in carbon market trading. On the other hand, we need to solve the problem of green hydrogen emission reduction exceeding the offset proportion of CCER. However, the above issues are not fully considered in this paper. Future studies can comprehensively consider these problems.

Author Contributions

H.-R.W.: writing—original draft preparation, methodology, software. T.-T.F.: supervision, conceptualization, writing—reviewing and editing. Y.L.: visualization. H.-M.Z.: resources. J.-J.K.: revising the manuscript. All authors have read and agreed to the published version of the manuscript.

Funding

This paper is supported by the National Natural Science Foundation of China (Grant No. 42171278), the Fundamental Research Funds for the Central Universities (Grant No. 2652019083), the National Natural Science Foundation of China (Grant Nos. 71991481 and 71991480), the Beijing Municipal Social Science Foundation (17YJC029) and the National Natural Science Foundation of China (Grant No. 51978443).

Institutional Review Board Statement

Not applicable.

Informed Consent Statement

Not applicable.

Conflicts of Interest

The authors declare that they have no known competing financial interests or personal relationships that could have appeared to influence the work reported in this paper.

Nomenclature

ETSEmissions trading system
CCERChinese Certified Emission Reduction
SDSystem dynamics
CEAsChinese emission allowances
DYNAMODynamic model
UN COP26The United Nations Conference of the Parties 26
electricity–carbonElectricity market and carbon market
CO2Carbon dioxide
CECChina Electricity Council
EUEuropean Union
USUnited States
Double carbonCarbon emission peak, carbon neutrality

References

  1. Energy & Climate. Net Zero Emissions Race [EB/OL]. 2022. Available online: https://eciu.net/netzerotracker (accessed on 1 January 2022).
  2. Xi, J.P. Building on the Past to Start a New Journey in the Global Response to Climate Change—Speech at the Climate Ambition Summit. China Environment Supervision. 2020. Available online: http://www.gov.cn/gongbao/content/2020/content_5570055.htm (accessed on 12 December 2020).
  3. PRC National Development and Reform Commission. Medium and Long-Term Planning of Hydrogen Energy Industry Development(021-2035) [EB/OL]. 2022. Available online: http://www.nea.gov.cn/2022-03/23/c_1310525755.htm (accessed on 23 March 2022).
  4. Li, W.; Wan, Y.M.; Xiong, Y.L.; Gao, P.B. Green hydrogen standard in China: Standard and evaluation of low-carbon hydrogen, clean hydrogen, and renewable hydrogen. Int. J. Hydrog. Energy 2022, 47, 24584–24591. [Google Scholar] [CrossRef]
  5. Dabar, O.A.; Awaleh, M.O.; Waberi, M.M.; Adan, A.I. Wind resource assessment and techno-economic analysis of wind energy and green hydrogen production in the Republic of Djibouti. Energy Rep. 2022, 8, 8996–9016. [Google Scholar] [CrossRef]
  6. Nogrady, B. China launches world’s largest carbon market: But is it ambitious enough? Nature 2021, 595, 637. [Google Scholar] [CrossRef]
  7. Wang, Y.Z.; Ou, X.M.; Zhou, S.H. Future cost trend of hydrogen production in China based on learning curve. Adv. Clim. Chang. Res. 2022, 18, 283–293. [Google Scholar]
  8. Liu, W.; Wan, Y.M.; Xiong, Y.L.; Tao, Z.J.; Zhu, Y.B. Key Technology of Water Electrolysis and Levelized Cost of Hydrogen Analysis under Carbon Neutral Vision. Trans. China Electrotech. Soc. 2022, 37, 2888–2896. [Google Scholar]
  9. Xu, C.B.; Zhao, Y.H.; Wang, X.C.; Ke, Y.M. Optimal Configuration of Hydrogen Energy Storage for Wind and Solar Power Stations Considering Electricity-Hydrogen Coupling Under Carbon Neutrality Vision. Electr. Power Constr. 2022, 43, 10–18. [Google Scholar]
  10. Yang, J.G.; Liu, W.M.; Li, S.X.; Deng, T.H.; Shi, Z.P.; Hu, Z.C. Optimal Operation Scheme and Benefit Analysis of Wind-Hydrogen Power Systems. Electr. Power Constr. 2017, 38, 106–115. [Google Scholar]
  11. Dai, H.C.; Dai, H.M. Green hydrogen production based on the co-combustion of wood biomass and porous media. Appl. Energy 2022, 324, 119779. [Google Scholar] [CrossRef]
  12. Ling, W.; Li, Q.; Zhang, K. Development Strategy of Hydrogen Energy Industry in China. Chin. J. Eng. Sci. 2022, 24, 80–88. [Google Scholar] [CrossRef]
  13. Cao, F.; Guo, T.; Chen, K.; Jin, X.L.; Zhang, L.; Yang, J.H.; Yin, A.M. Progress and development prospect of coupled wind and hydrogen systems. In Proceedings of the CSEE 2021, Lisbon, Portugal, 21–23 June 2021; Volume 41, pp. 2187–2200. [Google Scholar]
  14. Schrotenboer, A.H.; Veenstra, A.A.; uit het Broek, M.A.; Ursavas, E. A Green Hydrogen Energy System: Optimal control strategies for integrated hydrogen storage and power generation with wind energy. Renew. Sustain. Energy Rev. 2022, 168, 112744. [Google Scholar] [CrossRef]
  15. Ji, B.; Sun, H.; Liang, X.; Liu, Y.; Li, F. Discussion on convergent trading of the carbon and electricity market on the path to carbon peak and carbon neutrality. Huadian Technol. 2021, 43, 33–40. [Google Scholar]
  16. Shuai, Y.F.; Zhou, C.L.; Li, M.; Hu, J.F.; Wang, P. Coupling mechanism of U.S. carbon market and electricity market: A case study of regional greenhouse gas initiative. Electr. Power Constr. 2018, 39, 41–47. [Google Scholar]
  17. Zhao, C.; Zhang, M.; Wu, J.; Yuan, J. The Coupling Study on Carbon Market and Power Market. Chin. J. Environ. Manag. 2019, 11, 105–112. [Google Scholar]
  18. Feng, C.S.; Xie, F.R.; Wen, F.S.; Zhang, Y.B.; Hu, J.H. Design and Implementation of Joint Trading Market for Green Power Certificate and Carbon Based on Smart Contract. Autom. Electr. Power Syst. 2021, 45, 1–11. [Google Scholar]
  19. Feng, T.T.; Li, R.; Zhang, H.M.; Gong, X.L.; Yang, Y.S. Induction mechanism and optimization of tradable green certificates and carbon emission trading acting on electricity market in China. Resour. Conserv. Recycl. 2021, 169, 105487. [Google Scholar] [CrossRef]
  20. Wang, B.C.; Liu, Y.; Cui, X. Research on compensation mechanism of thermal power enterprises based on electricity-carbon linkage. Electr. Meas. Instrum. 2019, 56, 65–70. [Google Scholar]
  21. Liu, Y.; Cui, X.; Xie, X.; Gao, J.; Zou, C. Research on the trading of clean energy power generation right with the best social benefit under the electric-carbon linkage environment. Electr. Meas. Instrum. 2020, 57, 112–117. [Google Scholar]
  22. Liang, Z.Y.; Bao, M.L.; Ding, Y.; Song, Y.H.; Hou, Y.Q.; Feng, H. Clearing model of electricity-gas joint market considering the complementary elasticity of multi-energy loads. In Proceedings of the CSEE 2022, Montreal, QC, Canada, 14–19 August 2022; pp. 1–16. [Google Scholar]
  23. Song, X.H.; Han, J.J.; Zhang, L.; Zhao, C.P.; Wang, P.; Liu, X.Y.; Li, Q.C. Impacts of renewable portfolio standards on multi-market coupling trading of renewable energy in China: A scenario-based system dynamics model. Energy Policy 2021, 159, 112647. [Google Scholar] [CrossRef]
  24. Zhang, H.; Han, D.; Liu, T.; Huang, Y. Analysis of market coupling mechanism between distributed photovoltaic penetration and electricity market under the background of carbon neutrality. J. Shanghai Jiaotong Univ. 2022, 1–9. [Google Scholar] [CrossRef]
  25. Wang, L.; Jiao, S.; Xie, Y.; Xia, S.; Zhang, D.; Zhang, Y.; Li, M. Two-way dynamic pricing mechanism of hydrogen filling stations in electric-hydrogen coupling system enhanced by blockchain. Energy 2022, 239, 122194. [Google Scholar] [CrossRef]
  26. China Hydrogen Alliance. White Paper on Hydrogen Energy and Fuel Cell Industry in China. [EB/OL]. 2020. Available online: http://www.h2cn.org.cn/publication.html (accessed on 29 June 2020).
  27. Peng, G.B.; Xiang, Y. CO2 emission coupled power generation mix evolution: A system dynamics approach. Energy Rep. 2022, 8, 597–604. [Google Scholar] [CrossRef]
  28. Ding, Y.; Chen, S.; Zheng, Y.; Chai, S.; Nie, R. Resilience assessment of China’s natural gas system under supply shortages: A system dynamics approach. Energy 2022, 247, 123518. [Google Scholar] [CrossRef]
  29. Cao, X.L.; Cheng, Y.M.; Wu, W.G. Study on the Priorities for the Development of CCER Forestry Carbon Sink Projects under the Context of Carbon Neutrality Goals. J. Stat. Inf. 2022, 37, 52–63. [Google Scholar]
  30. Wu, Q.Y. Price and scale effects of China’s carbon emission trading system pilots on emission reduction. J. Environ. Manag. 2022, 314, 115054. [Google Scholar] [CrossRef] [PubMed]
  31. Qi, S.; Cheng, S.; Tan, X.; Feng, S.; Zhou, Q. Predicting China’s carbon price based on a multi-scale integrated model. Appl. Energy 2022, 324, 119784. [Google Scholar] [CrossRef]
  32. Wang, M.G.; Zhu, M.R.; Tian, L.X. A novel framework for carbon price forecasting with uncertainties. Energy Econ. 2022, 112, 106162. [Google Scholar] [CrossRef]
  33. Pan, G.S.; Gu, W.; Zhang, H.Y.; Que, Y. Electricity and Hydrogen Energy System Towards Accommodation of High Proportion of Renewable Energy. Autom. Electr. Power Syst. 2020, 44, 1–10. [Google Scholar]
  34. Shuang, L.I.; Yixiang, S.H.I.; Ningsheng, C.A.I. Progress in hydrogen production from fossil fuels and renewable energy sources for the green energy revolution. J. Tsinghua Univ. (Sci. Technol.) 2022, 62, 655–662. [Google Scholar]
  35. Yue, B.X.; Xiong, H.B.; Guo, Y.Z.; Guo, C.X. Carbon transaction mechanism promotes low-carbon transformation of power industry. Electr. Autom. 2022, 44, 1–3. [Google Scholar]
  36. Wang, W.; Zhao, X.; Zhang, Q.; Fu, C.; Xie, P. Auction mechanism design of the Chines national carbon market for carbon neutralization. Chin. J. Popul. Resour. Environ. 2022, 20, 115–124. [Google Scholar] [CrossRef]
  37. Experience and Lessons Learned from the Power Sector’s Participation in the EU Carbon Emissions Trading System. Available online: http://www.edf.org (accessed on 1 May 2020).
  38. Yan, J. The impact of climate policy on fossil fuel consumption: Evidence from the Regional Greenhouse Gas Initiative (RGGI). Energy Econ. 2021, 100, 105333. [Google Scholar] [CrossRef]
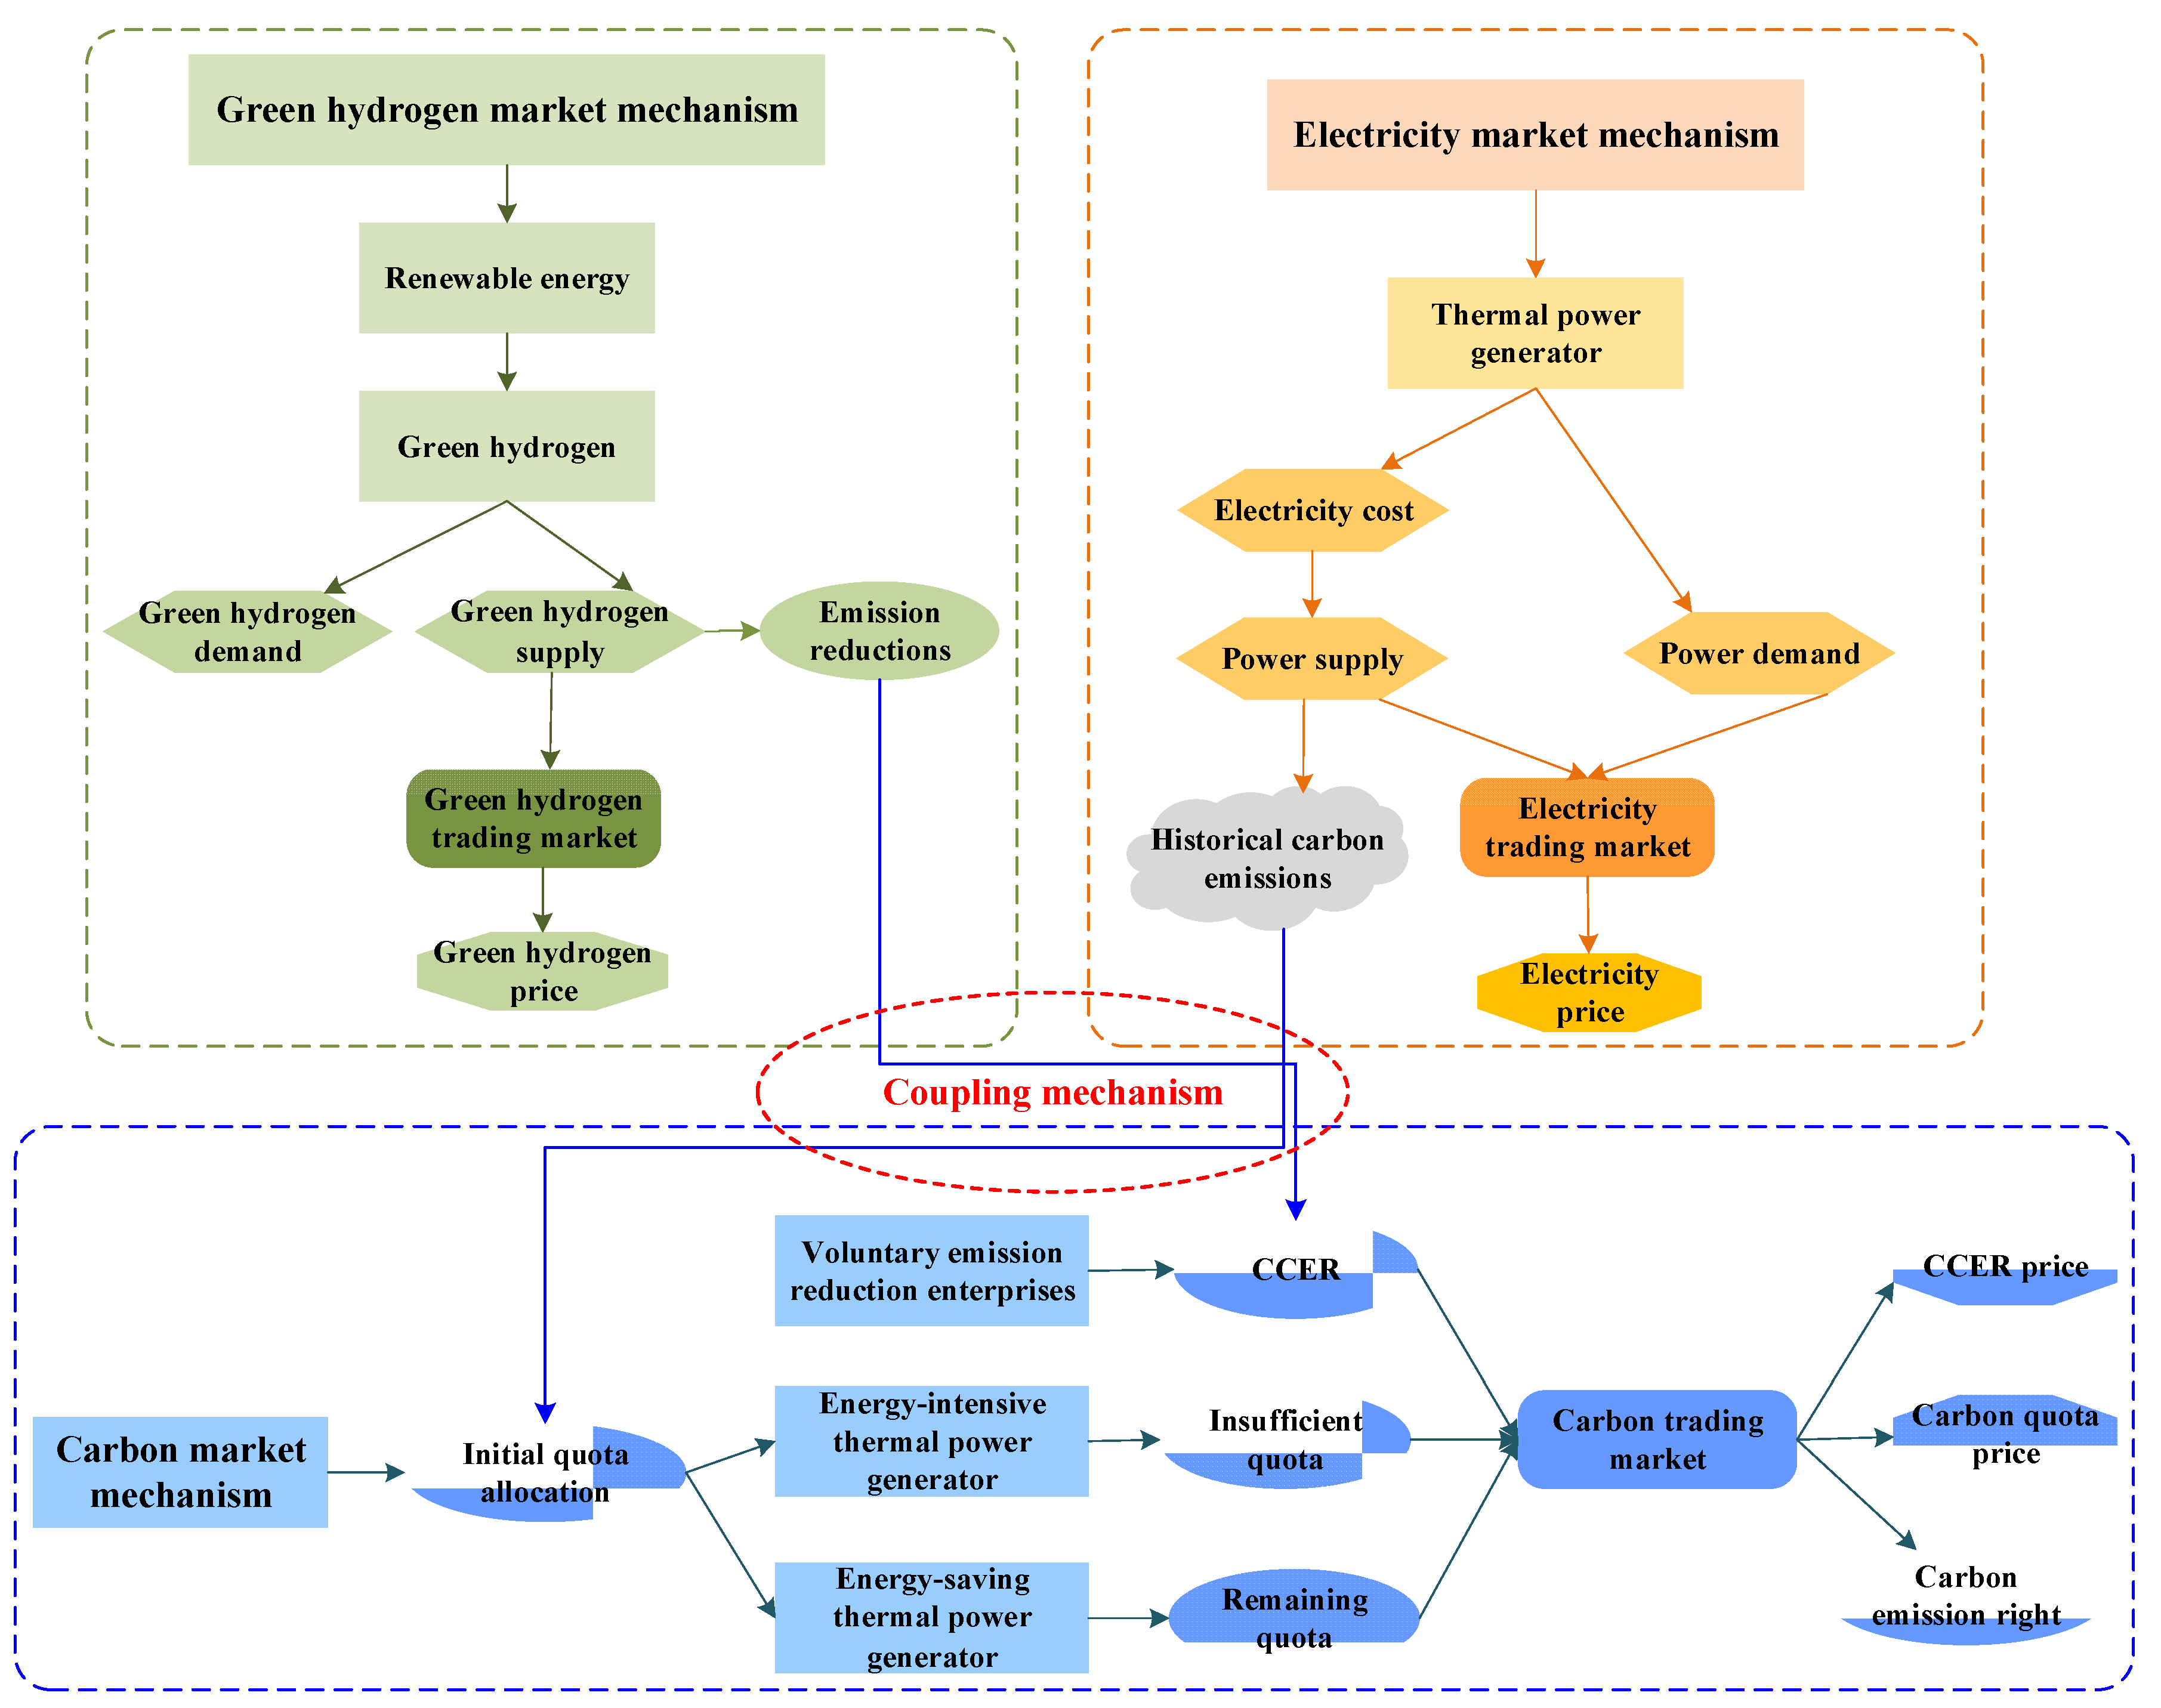
Figure 1. Coupling mechanism of green hydrogen market–national carbon trading market–electricity market.
Sustainability 14 13948 g001
Figure 2. Causal relationship diagram.
Sustainability 14 13948 g002
Figure 3. Stock-and-flow diagram.
Sustainability 14 13948 g003
Figure 4. Carbon emission rights price and CCER price trends.
Sustainability 14 13948 g004
Figure 5. Green hydrogen production and thermal power generation trends.
Sustainability 14 13948 g005
Figure 6. CCER price trends with different CCER offset ratios.
Sustainability 14 13948 g006
Figure 7. Installed green hydrogen trends under different CCER offset ratios.
Sustainability 14 13948 g007
Figure 8. CCER price trends under different green hydrogen certification ratios.
Sustainability 14 13948 g008
Figure 9. Trend of expected purchase of CCER.
Sustainability 14 13948 g009
Figure 10. CEA price change trends.
Sustainability 14 13948 g010
Figure 11. Trend of expected sale of CEAs.
Sustainability 14 13948 g011
Figure 12. CEA price trends at different auction ratios.
Sustainability 14 13948 g012
Figure 13. Expected purchase of CEAs at different auction ratios.
Sustainability 14 13948 g013
Figure 14. CCER price trends under the comprehensive scenario.
Sustainability 14 13948 g014
Figure 15. Green hydrogen production trends under the comprehensive scenario.
Sustainability 14 13948 g015
Figure 16. CEA price trends under the comprehensive scenario.
Sustainability 14 13948 g016
Figure 17. Thermal power generation trends under the comprehensive scenario.
Sustainability 14 13948 g017
Table 1. Scenario parameter setting.
Influencing FactorsScenarioParameter Setting
CCER Offset Ratio (%)Proportion of Green
Hydrogen Certification (%)
Elimination Rate of Backward Units (%)Quota Auction
Proportion (%)
Basic scenarioBAU52.500
CCER offset ratioA172.500
A2102.500
Proportion of green hydrogen certificationB15300
B25400
Elimination rate of backward unitsC152.550
C252.5200
Quota auction proportionD152.5010
D252.5020
Comprehensive scenarioE173510
E21042020
Publisher’s Note: MDPI stays neutral with regard to jurisdictional claims in published maps and institutional affiliations.