Abstract
The study aims to measure the effectiveness of the project management information system (PMIS) and its impact on financial wellness in rural areas. The study uses DeLone and McLean’s updated information success model to measure the net impacts of the PMIS on the community. The dynamics between the PMIS and financial wellness have not yet been clarified, as the available literature on the concerned domain is very limited; thus, further research is required to report the effect of the PMIS on financial wellness. A total of 628 samples were analyzed from 666 collected through structured questionnaires and stratified sampling from 21 hill blocks from the hills of Uttarakhand. Exploratory-confirmatory factor analysis and path analysis were both conducted using SPSS and AMOS. The study found that PMIS quality, information quality, and service quality are significantly important for the PMIS, and its impact on the net benefits derived from PMIS was studied. The results also reveal that the net benefits of the system impact the financial behavior and financial attitudes of SHGs and cooperative members, consequently significantly impacting financial wellness. This study proposes and tests the information system (IS) financial wellness (FW) model for community-based development programs in the lines of the logical framework approach and the stimulus-organism-response framework.
1. Introduction
The project management information system (PMIS) is an integrated management tool or application that facilitates project planning, implementation, execution, monitoring, decision making, knowledge management, information collection, and dissemination [1,2,3,4,5,6,7]. The PMIS plays the role of a bridge among stakeholders to communicate results [8]. It is a course of action that is required to obtain the correct information to the right people at the right time for taking corrective measures [9]. The PMIS is used as project objectives, requirements, and functionality standards available in the system. The information system is key to economic growth and influences societal interactions [10].
This study used a logical framework approach (LFA) to measure the result chains of the PMIS. The strategic elements of the LFA are input, output, outcome, and impact [11,12,13,14,15,16,17,18]. The input indicates different resources, i.e., financial, human, material, system, training, and information for the execution of the intervention. The output refers to immediate results from intervention in the form of products, goods, services, information, reports, and knowledge. The outcome expresses short-term and medium-term changes, i.e., changes in financial knowledge, attitudes, behavior, practices, and financial decision making. Financial knowledge is articulated through different financial instruments and basic financial calculations that can make a sound financial decision [19,20,21,22].
Financial knowledge improves financial behavior [23,24,25], which is also influenced by information [26,27,28]. Financial behavior specifies the effective financial management of income, savings, risk, investments, and credit [19,29,30,31]. Researchers [32,33] explain that financial knowledge impacts the six best financial planning practices (emergency fund, risk, credit report, credit payoff, no overdraft, and retirement planning), and that savings behaviors, cash management, risk, and credit management represent financial behavior. The forms of impact include adequate nutrition, decent health, food security, and financial wellness. The financial wellness of rural households highlights financial health, financial security, and operative financial management, which are associated with happiness and subjective well-being [19,21,34,35,36]. Financial wellness is influenced by different factors such as individual characteristics, education, income, savings, investments, risk management, credit management, financial behavior, attitude, knowledge, locus of control, living standards, and social agents [19,34,37,38,39,40].
The stimulus-organism-response (S-O-R) framework was proposed by [41,42] to measure the behavioral outcomes of the results chains. The framework has been widely used to measure the impacts of technology in people’s life [43,44]. Researchers [43,45,46,47,48,49,50] describe stimuli as external and environmental factors that influence behaviors and attitudes, and the response refers to the outcomes and impacts following changes in behavior and attitude, where the organism drives and mediates change. According to [51], the organism facilitates the achievement of stimuli impacts in the form of a response provided by the person. Ref. [52] uses stimuli as a social support system; interaction, self-efficacy, and basic literacy as an organism; and student satisfaction as a response in their research on student learning satisfaction. The stimulus refers to the attributes of a website, and consumer engagement (an organism state) is affected by the attributes of a website, which influence the response as the outcome reflected through consumer behavior [48]. This indicates that when the stimulus is prompted, the consumer perceives it into meaningful information or knowledge, and makes an action-oriented decision. Thus, based on the discussion, this study uses the S-O-R framework to review the relationship between the PMIS (stimulus) and financial wellness (response), where the net benefits of cooperative societies associated with the PMIS (organism) mediate the relation.
The present study takes a sample from the households in the hill districts of Uttarakhand, who are members of SHGs, as well as cooperative societies, and small and marginal farmers. These small and marginal farmers have less than 2-hectare operational agriculture landholdings. The average landholding in Uttarakhand is 0.85 hectares [53]. They use an online PMIS for record keeping, member profiles, demand and supply data, value chain-wise production and marketing data, business data, livelihood finance, savings, and internal lending [54,55]. The PMIS also facilitates performance grading, gap analysis, service delivery, business trends, and comparative analysis through a dashboard [56,57]. Cooperative societies are the grass-root primary institutions and rural enterprises that play a vital role in rural development and improve the economic scenario of rural households [58,59,60]. These small and medium enterprises are significant for poverty reduction, women empowerment, job creation, and economic growth at the local level [28]. They provide services under different government social welfare programs [61]. All pro-poor homogenous rural households are members of self-help groups (SHGs), producer groups (PGs), vulnerable producer groups (VPGs), cluster-level federations (CLFs), or livelihood collectives (LCs), in the form of cooperative societies. These members set up cooperative societies through a democratic process for everyday social, cultural, and economic purposes [62]. The core theme of the cooperative is serving and providing paybacks to all members or stakeholders. The sustainability and success of a cooperative are dependent upon the trust and benefits of the members.
United Nations member states adopted seventeen SDGs with the core motto of “leave no one behind”. They have identified three different SDGs for reducing socio-economic disparity, i.e., Goal 1—No Poverty, Goal 5—Gender Equality, and Goal 10—Reducing Inequality [63]. The functioning of SHGs and cooperative societies is naturally aligned with SDGs. According to the human development report, the disparity in human development influences social imbalance in the community and the wellness of households [64]. ICT for Development (ICT4D) plays a vital role in achieving sustainable development goals [65,66,67,68,69]. SHGs work for their members’ holistic social–economic development, covering livelihood activities, and many other issues [70]. Cooperative societies’ uniform distribution of information through the PMIS reduces the disparity among various vulnerable groups. The present study measures the PMIS and financial wellness factors using proxy income, savings, and women empowerment indicators. Information Communication Technology (ICT) provides data to all and reduces the disparity in society [71]. Based on literature review and empirical studies, this study attempts to combine information systems with financial wellness for the first time, as per the authors’ best knowledge. The study mainly evaluates: Does the PMIS for community institutions influences members’ financial wellness or not? Furthermore, what factors are important to the PMIS effectiveness? The development of the IS-FW model has been elaborated in further sections ahead. Congruently, the present study has analyzed the effectiveness of the PMIS through the DeLone & McLean Information Success Model (updated) [72] and its impact on the financial wellness of rural households.
2. Literature Review
Three theories or models were widely used to measure the information systems (IS) and information technology (IT) research, i.e., the Technology Adoption Model (TAM), the Unified Theory of Acceptance and Use of Technology (UTAUT), and the DeLone & McLean Information Success Model (D&M-IS). The TAM model evaluates the adaptability and utility of IT [73,74,75]. The TAM2, an extension of TAM, includes social influence and cognitive instrumental processes which thoroughly explain perceived usefulness and behavioral intention [75,76]. Further, the TAM3, an integrated model, includes TAM2 with determinants of perceived ease of use and enhanced adaptability and uses of IT [75,77]. TAM3 also proposed a set of pre- and post-activities for the success of IT. The UTAUT includes performance expectancy, effort expectancy, social influence, facilitating conditions and influences of behavioral intentions, and perceived use or success of IS [75,78]. The model includes age, gender, experience, and voluntariness of use as a moderator. The UTAUT2 includes new constructs of hedonic motivation, price value, experience, and habit in the UTAUT model [75,79]. The D&M-IS success model includes organizational impacts and is widely used for measuring MIS success [72,80,81].
2.1. DeLone & McLean Updated Information Success Model
The D&M-IS model has been commonly used to evaluate the success or effectiveness of information systems. It was introduced in 1992 [80] and later updated in 2003 [72]. The initial model had six constructs: system quality, information quality, use, user satisfaction, individual impact, and organizational impact. The updated model introduced two new variables, i.e., service quality and intention to use. Individual and organizational impacts were combined and introduced as net benefits [72] and later modified as net impacts [81]. The D&M-IS updated model is widely used by researchers [82,83,84,85,86,87,88,89,90,91,92,93,94] for evaluating the effectiveness of information systems in different domains. The current study uses the D&M-IS updated model as a base framework for measuring the PMIS effectiveness.
2.2. PMIS Quality
The PMIS quality represents technical specifications, operational functioning, representation, accessibility, easiness, and overall system characteristics which encourage users to use the system, which benefits users and the organization [84,85,91,92,95,96,97]. System quality is a fundamental and common factor for project management success and project product success [98]. The users avoid a complex or poor standard system for several reasons, e.g., tough to operate, issues in accessibility, improper usability, delay in processing queries, and displays of jumbled information [98,99,100,101,102]. From the above discussion, we can formulate the following hypothesis.
H1a.
PMIS quality is significantly important for an effective PMIS.
2.3. Information Quality
Information quality indicates data and information characteristics, e.g., data accuracy, data representation as an output report which is easy to understand, and evidence for decision-making, which they get from a proper information system [85,87,91,103,104,105]. Precise information not only helps in decision-making but also supports activity implementation. Inaccurate and incomplete information misleads facts, resulting in losses for individuals and organizations [98,99,100,101,102]. From the above discussion, we can formulate the following hypothesis.
H1b.
Information quality is significantly important for an effective PMIS.
2.4. Service Quality
Service quality is mainly referred to as the quality of support service, help-desk, assistance, and guidance as well as quick troubleshooting of users’ queries, system-level technical issues, regular training, handholding users to use the system, analyzing data and information, and adopting best practices to execute project activities [84,88,90,97,105,106,107]. From the above discussion, we can formulate the following hypothesis.
H1c.
Service quality is significantly important for an effective PMIS.
2.5. Net Benefits of PMIS
The D&M-IS updated model refers to net benefits having positive impacts on users and organizations [72]. It is subjective as well as objective and contextual for any organizational mandates. The organization’s benefits import overall support in implementation, service delivery, monitoring, evaluation, fulfilling objectives, and achieving goals, while individual’s benefits include cost-savings, time-saving and increased knowledge [81,85,108]. According to the domain, net benefits have been contextualized by different researchers. The net benefits of an e-learning system are measured through usability, facility, more learning, and user productivity [109]. Similarly, the net benefits of an e-learning system are denoted by new opportunity, employability options, and career growth [90]. The net benefits of a student monitoring information system are measured by performance, activity completion, and effective working [105]. The net benefits of a village financial system are time-saving, performance, and increased knowledge [110]. The present study represents the net benefits through time-saving, implementation, service delivery, evaluation of activities, and knowledge increase.
Through ICT4D platforms (farmer information system—IFFCOBAZAR, IFFCO Kisan), farmers receive advisory information on agriculture and allied activities, weather, market information, and government schemes, which enhances the farmers’ net benefits in terms of increased revenue, increased knowledge, time-saving, and improved decision-making [111]. ICT4D (financial information system) also improves net benefits in terms of financial literacy, financial knowledge, and financial behaviors and increases rural households’ financial decision-making capacity [112,113]. Cooperatives societies or community-owned enterprises benefit from information and communication systems, implement multisectoral development activities in the local context, and contribute to community empowerment [114]. They use different ICT4D tools, i.e., web applications, smart phones, videos, handbooks, pictorial books, flipcharts, and traditional tools, i.e., training, exposure, workshops, and meetings for the capacity buildings of their members. In the studies [57,115], cooperative societies support financial inclusion, financial literacy programs and disseminate information on different financial instruments. The PMIS is used for regular monitoring and provides customized reports, which improve decision-making and helps in taking corrective measures. This improves SHGs and cooperatives’ net benefits in terms of effective execution, service delivery mechanisms, analysis, business decisions, and others through the PMIS. From the above discussion, we can formulate the following hypothesis.
H2.
An effective PMIS has a significant impact on the net benefits of PMIS.
2.6. Outcome and Impact of PMIS
Net impacts refer to positive and negative outcomes, impacting users, organizations, and communities [81]. Net impacts can be summarized according to the project goals and objectives like economic growth, increased income, savings, quality execution, increased knowledge, and adoption of best practices. ICT4D plays an important role in influencing the net impacts such as financial knowledge, financial wellness, poverty reduction, women’s rights and empowerment, health, environment, and climate awareness [116]. Researchers [117,118,119,120] found that financial inclusion and ICT4D initiatives directly contribute to economic growth that influences economic well-being or financial wellness. Financial inclusion refers to accessing affordable financial products and services [121]. Training and capacity-building programs under financial inclusion and practicing “panchsutras” increased knowledge. A study [122] reveal that skills training under e-commerce initiatives enhanced rural livelihood and increased income. Financial knowledge influences financial behavior, which is enriched through information and communication [27]. Panchasutras include five financial practices, i.e., regular meetings; regular savings; regular inter-loaning; timely repayment; and up-to-date books of accounts [123]. ICT4D is a driving force to influence socio-economic transformation by improving awareness and knowledge in the long-term, which tweaked behavioral change [124]. ICT4D applications improve financial management practices, increase efficiency in utilizing financial resources, and increase financial decision-making [125]. The present study measures outcomes through financial behavior and financial attitude, where impact is measured by financial wellness.
2.7. Net Benefits of PMIS and Financial Behavior
PMIS facilitates knowledge dissemination, and subsequently, households learn about the best practices and participate in multiple income-generating activities that improves their income and cash in hand. Households received regular training and information on financial practices and instruments from cooperative societies, NGOs, development projects, micro-finance institutions, and banks, which increased their financial knowledge as the net benefits of the PMIS. Members admire and practice panchsutras, which increases community groups’ cohesiveness and long-term sustainability [123]. They save regularly in the SHG common fund, which is used as a revolving fund. The PMIS facilitates the digitization of records and provides customized analytical reports, i.e., grading (assessment), SHG grading system includes financial management capabilities, and behavioral disciplines including five practices of panchsutras [126], savings, internal lending, repayments, meetings, participation, etc., that results in easy execution, improves services, and decision-making in the form of net benefits of the PMIS [54,57,127,128,129]. Financial knowledge through different literacy programs improves households’ borrowing, including internal-lending behavior [130]. The PMIS provides reports on loans taken from different sources, utilization of loans, repayments of loans, and others. Based on member profiles in the PMIS, cooperative societies facilitate their members for crop and cattle insurance [115]. The demand and supply data, value-chain-wise production and marketing data, and business data in the PMIS support increasing income and improve knowledge, decision-making, and service delivery, denoted as the net benefits of the PMIS.
Researchers [19,20,22,29,30,131] argued that improved financial knowledge (net benefits of the PMIS) and financial practice promote better utilization of income and cash in hand that influences day-to-day expenses, asset creation, asset maintenance, investments, savings, risk, and credit which denote the financial behavior of the households. Subsequently, financial behavior impacts financial wellness. Researchers [27,112,124,132] explained that the net benefits of ICT tools influence financial behavior and further influence financial wellness. Therefore, based on the above literature, we formed the following hypothesis.
H3.
Net benefits of PMIS has a significant impact on financial behavior.
2.8. Savings Behavior and Financial Behavior
Savings behavior is a progressive financial behavior for future life so that one can fulfill their requirements and handle unexpected financial crises [19,133]. Savings behavior as a financial behavior that leads to financial wellness and reduces future financial stress [19,134,135]. Saving factors significantly influence financial behavior that positively affects financial emergencies [136]. Household savings are a significant growth driver of economic sustainability and are directly associated with income [137]. Village organizations (SHGs) encourage regular savings practices under panchsutras that lead to financial behavior [138]. The PMIS facilitates record-keeping and data analysis of savings data and provides customized analytical reports, which improves savings practices. Members practice savings for better livelihood, education, health, immediate expenditure, and better lifestyles [139,140]. Based on the above discussion, we formulated the following hypothesis.
H4a.
Savings behavior is significantly important for financial behavior.
2.9. Cash Management and Financial Behavior
Cash management is a kind of effective financial management of the budget through better utilization of income and cash in hand [19,20,131] that influences a household day to day expenses, asset creation, asset maintenance, savings, etc., leading to financial behavior. The PMIS facilitates knowledge dissemination, and subsequently, households learn about the best practices and participate in multiple income-generating activities that improve their income. Livelihood diversification enhances rural household income, which directly influences households’ well-being [141]. They received information and training on financial instruments and management, improving their knowledge and, consequently, their financial behavior. According to [142], the use of ICT4D applications (PMIS) positively impacts the cash management behavior of the person. Therefore, based on the above discussion, we formulated the following hypothesis.
H4b.
Cash Management is significantly important for financial behavior.
2.10. Risk-Credit Management and Financial Behavior
Financial literacy programs improve households’ borrowing, including internal-lending behavior [130]. The net benefits of the PMIS improve households’ financial knowledge, which improves their financial management practices. The PMIS provides reports on loans taken from different sources, utilization of loans, repayments of loans, and others. Members took low-cost (interest) loans from the common fund of SHGs, which they repaid as decided (generally long-term) by the group [115,138,143,144,145]. Based on member profiles in the PMIS, cooperative societies facilitate their members for crop and cattle insurance [115]. Risk (insurance) and credit (loan) management components are measured as a financial behavior [32,33,146,147]. Risk and credit management pertains to unpredicted financial requirements that can be fulfilled through different financial instruments, i.e., insurance and credit schemes [19,148]. Therefore, we formulate the following hypothesis.
H4c.
Risk-credit management is significantly important for financial behavior.
2.11. Net Benefits of PMIS and Financial Attitude
Financial attitude is an inclination toward different financial instruments and practices such as income, expenditure, and saving attitudes, which is influenced by financial knowledge (net benefits) that leads to financial wellness [19,149,150,151]. The net benefits of the PMIS facilitates cooperatives in the following areas, i.e., financial knowledge, record-keeping, input–output service delivery mechanism, demand–supply, and influencing members’ attitudes towards income, savings, investments, risk, and credit. The PMIS provides analytical reports (net benefits) from the SHGs grading system, showing the weak area for further capacity enhancements. Similarly, the PMIS shows a monthly key performance chart for the cooperative societies, which facilitates them to compare performance with others and review the weak area. A study by [152] indicates that training on financial matters and information technology creates a positive attitude in the SHGs. Therefore, based on the above literature, researchers formulate the following hypothesis.
H5.
Net benefits of PMIS has a significant impact on financial attitude.
2.12. Financial Wellness
Researchers [153,154,155,156,157] conceptualized financial wellness as the satisfaction of income and savings, happiness, and quality of life, which is related to income, savings, credit, investments, knowledge, and basic financial calculations. Financial wellness indicates an expression of financial security and health, and economic well-being indicates subjective wellness that covers financial behavior, attitude, and situations of an individual [19,21,34,35,158]. Financial knowledge, skills, attitude, and behavior will improve financial management and planning, impacting financial wellness [159]. The Consumer Financial Protection Bureau (CFPB) developed the financial well-being index covering cash management behavior, savings behavior, risk–credit management behavior, and financial attitude [36]. Based on the literature, financial wellness is an important factor in human development. This study measures the financial wellness of rural households in terms of increased income, savings, and improved living conditions.
2.13. Financial Behavior and Financial Wellness
Financial knowledge and practices improve financial decision-making and behavior toward income, savings, investments, risk, and credit, impacting financial wellness [160]. Financial knowledge improves financial behavior impacting financial wellness [20]. Financial experience, status, and knowledge affect financial wellness, which is influenced by financial behavior [29]. Financial behavior is financial planning and money management for the short-term and long-term that impacts financial wellness [30]. Financial intervention, i.e., education, skills, and knowledge, improve financial behavior that enhances financial wellness [37]. This study uses financial behavior as a second-order construct derived from savings behavior, cash, and risk–credit management. Thus, based on the aforementioned literature, we have formulated the following hypothesis.
H6.
Financial behavior has a significant impact on financial wellness.
2.14. Financial Attitude and Financial Wellness
Financial behavior and attitude are the core antecedents of financial wellness [21,34,37,141]. Financial attitude is a perception of financial instruments and income, expenditure, and savings management [149]. Financial knowledge and education influence financial attitude that positively impacts financial wellness [161]. According to [20,162], obsession, strength, energy, dissatisfaction, storage, and security are the six concepts of financial attitude, which are mostly related to attitude toward income and expenditure. A study by [163] explained that financial attitude and behavior are very much relevant for financial wellness. Thus, based on the above literature of this study, we have formulated the following hypothesis.
H7.
Financial attitude has a significant impact on financial wellness.
Based on the literature review, Table 1 summarizes all constructs and variables. On the basis of variables, the final questionnaire has been developed.

Table 1.
Variables measured in different constructs.
3. Information System-Financial Wellness (IS-FW) Model
Researchers [84,90,167,168,169,170] conceptualized specific models using the D&M-IS and formed a second order from system quality, information quality, and service quality for information system constructs in their studies. They measure the information system’s effectiveness in line with the research area and conceptualize the information system’s effectiveness using the D&M-IS framework. Accordingly, this study combined the PMIS quality, information quality, and service quality in a second-order construct named PMIS. Researchers [85,87,110,171,172] also used the D&M-IS model to evaluate the system effectiveness and impacts in their respective domain. The literature review shows that the IS model measured information systems’ effectiveness through the net benefits [85,90,110,170]. Table 2 summarizes some of the information system success models on different themes/domains.
Table 2.
Conceptual models of IS used by researchers in various domains.
Previous literature has not explained the direct or indirect relationship between the PMIS or the net benefits of the PMIS and financial wellness as per the authors’ best knowledge. However, researchers [111,112,116,117,118,119,120,125] shows that ICT or ICT4D tools and platforms (website, information system) influence factors of financial behavior and financial attitude, further impact on financial wellness and wellbeing.
The net benefits of the PMIS represent an effective implementation of activities and service delivery, analytical reports for decisions-support, evaluation, gap identification, and financial knowledge. Researchers [27,124,125] explained that information and communication, financial practices, and financial knowledge improves financial management practices and financial decision-making, further improving financial behavior and attitude. Researchers [19,20,22,29,30,131] indicate improved financial knowledge, and financial practice, which positively influence income, budget (cash management), savings (savings behavior), insurance (risk), loan (credit) variables of financial behaviors.
Researchers [20,32,33,131,133,146,147] explained variables of financial behavior comprised from the variables of savings behavior, cash management, and risk-credit management. Savings behavior as a financial behavior reduces financial stress for emergencies and further impacts financial wellness [133,134,135,136]. Cash management as a financial behavior refers to the effective management of income and cash in hand that impact financial wellness [20,131]. Risk-credit management as a financial behavior indicates risk mitigation through insurance and effective management of loans that impact financial wellness [32,33,146,147]. Financial attitude is a persona for income, expenditure, and savings attitudes influenced by financial knowledge (net benefits) and further impacts financial wellness [149,150,151].
The financial wellness of rural households specifies financial health, security, and operative financial management, which synchronize with happiness and subjective well-being [19,21,34,35,158]. Financial wellness depends upon financial behavior and attitude [21,34,35,36,37,141,173], which is influenced by financial knowledge (the net benefits of the PMIS) and financial practices.
Thus, based on the research work mentioned earlier in this article, the researchers proposed an IS-FW model (Figure 1) to measure the effectiveness of the PMIS and its impact on financial wellness in rural households.
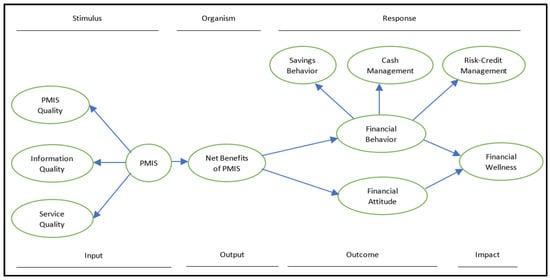
Figure 1.
Conceptual IS-FW Model.
3.1. IS-FW Model and Logical Framework Approach (LFA)
The IS-FW model adopts the LFA for evaluating the system impacts. Input represents the PMIS that covers the PMIS quality (accessibility, usability, functionality of the information system), information quality (accuracy, use, usability of information), and service quality (training and capacity building, technical handholding, and support service). The output represents the net benefits of the PMIS in terms of accurate and understandable reports, reduced time, enhanced financial knowledge, improved input-output services, support in implementation, and decision-making. The outcome indicates the change (attitude, behavior, practices) in the short-term or medium-term. This study uses financial behavior and attitude as an outcome of the training, capacity-building, financial practices, and financial knowledge through the support of the PMIS. Impact refers to long-term change in a situation as rural households’ financial wellness (income, savings, and living conditions).
3.2. IS-FW Model and Stimulus-Organism-Response (S-O-R) Framework
The IS-FW model harmonized with the Stimulus-Organism-Response (SOR) framework as stimuli (PMIS) influence the response (financial behavior, financial attitude, and financial wellness), which mediate by the organism (the net benefit of the PMIS) [43,45,46,47,48,49,50]. The PMIS, which represents data, information, system, reports, training, and handholding, acts as a stimulus and influences individuals (benefits for the members of the SHGs and cooperatives) and organisms (the net benefits of the PMIS of cooperative societies). Organisms directly influences and mediates the stimuli’s response (outcome and impact). The net benefits of the PMIS facilitate implementation, training, service delivery, financial knowledge, and decision-making. It improves the effectiveness of cooperatives and members’ trust in the SHGs and cooperatives. This study measures the response in two parts. A short-term response represents financial behavior and attitude, and a long-term response represents financial wellness. Thus, the IS-FW model, which is synchronized with the S-O-R framework, reflected that an effective PMIS impacts financial behavior, financial attitude, and financial wellness (response) after realizing the net benefits of the PMIS (organism).
The model hypothesized that the PMIS quality, information quality, and service quality are significantly important for an effective PMIS, and its impact has been found on the net benefits derived from the PMIS. On the other side, the net benefits of an effective PMIS significantly substantiate financial behavior (cash management, savings behavior, and risk-credit management) and the financial attitude of users; subsequently, these constructs influence financial wellness.
4. Research Method
The primary objective was to examine the effectiveness of the PMIS using the updated D&M-IS model and its impact on the financial wellness of rural households. The sample was collected using stratified sampling from rural households in 21 hill blocks of 9 hill districts of Uttarakhand, in which PMIS is implemented. Further, the blocks were geographically stratified into upper, middle, and foothills villages. All households are members of the SHGs and cooperative societies and come under the small and marginal farmers category. A total of 720 samples were identified as targeted respondents. However, 666 questionnaires were returned, and a total of 628 were analyzed using SPSS and AMOS. Responses were collected through the survey method, using a structured questionnaire (Appendix A), which was converted into the native language, “Hindi”. Seven points Likert scale has been used for taking responses on items. The variables’ scales were adapted from the previous literature (Table 1).
5. Data Analysis and Results
The demographic statistics of the sample show that 87.4% of members are females, and 12.6% are male. Female representation is higher because SHGs and Producer groups (PGs) have the most women members [127]. One hundred percent of households are shareholders of cooperatives and members of SHGs. The president, secretary, and cashier of cooperatives are key decision-makers in day-to-day operations and represent 29.3% of the sample. The general membership of the cooperatives represented 70.7% of the sample. Within 29.3% of the key positions, 92% are female, and 8% are male, which indicates that more women are in leadership positions. A total of 29% of respondents are eighth pass, 27.8% intermediates, 14.6% graduates and 8.6% postgraduates, which indicates that all members are literate. Cronbach’s alpha (0.879, No of Items = 37) indicates the overall quality and consistency of the sample data [174]. Nine constructs (eigenvalue > 1, loadings > 0.40) were verified through varimax, principal component analysis, and rotated component matrix [175]. Barlett’s test of sphericity is significant (p < 0.001), and Kaiser-Meyer-Olkin (KMO) value is (0.918 > 0.70) to measure sampling adequacy [176]. The variance for the first factor is 11.137% (<50%), and the total variance explained is 75.947% (>50%) [177].
5.1. Confirmatory Factor Analysis (CFA)
CFA has been conducted to validate the factors through construct validity, convergent validity, and discriminant validity [178,179]. Construct validity is measured by a set of fit indices [180]. Figure 2 illustrates the results of the goodness of fits indices for the model. The p-value of Chi-square < 0.05, due to large sample size [181]. The results of absolute fit indices, relative fit indices, and non-centrality-based indices values Chi-square/df = 2.474, GFI = 0.889, AGFI = 0.868, SRMR=0.051, NFI = 0.918, PNFI = 0.818, IFI = 0.950, TLI = 0.943, CFI = 0.950, PGFI = 0.750, and RMSEA = 0.048 shows that the model is acceptable [182,183,184,185,186].
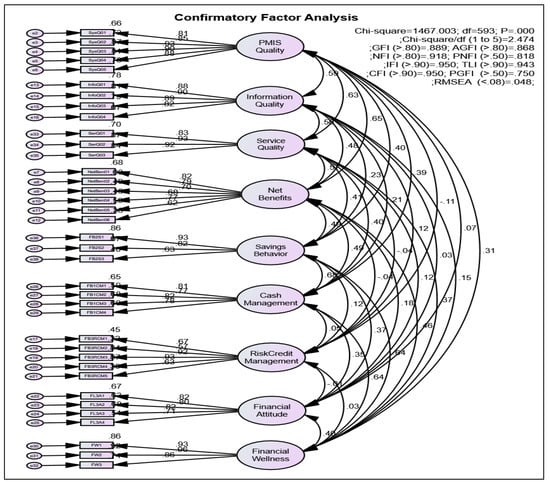
Figure 2.
Confirmatory Factor Analysis.
A study [184] suggested that GFI is a good fit if the score is 0.90 or higher, and researchers [187,188] suggested that GFI should not be used. However, refs. [189,190,191,192,193] indicate that GFI is a reasonable fit if the score is higher than 0.80.
The difference in factor loadings with and without a common latent factor (CLF) is less than 0.2. Table 3 indicates that there is no common method bias effect in the model [194,195,196]. For measuring the validity of the model, [182] state tool package has been used. Table 3 shows that the composite reliability (CR) of all constructs is more than the prescribed value of 0.7, the average variance extracted (AVE) is above 0.5, and the maximum shared squared variance (MSV) should be less than AVE [197]. Maximum reliability (MaxR(H)) indicates the relationship between construct and their respective items, and its values should be above 0.7 and more than CR [198,199,200,201,202]. Therefore, we can conclude that the model has a convergent validity.
Table 3.
Reliability and validity parameters.
Table 3 shows that average shared variance (ASV) is less than AVE, and Table 4 describes the square root of AVE as greater than inter-construct correlations [197,203,204]; we can conclude that the proposed model has discriminant validity.
Table 4.
Fornell-Larcker Discriminant Validity Criteria.
A substitute method Heterotrait-Monotrait (HTMT) ratio of correlation, has been used for verifying discriminant validity by different researchers [205,206,207,208]. Table 5 shows that all HTMT values are less than 0.85 [181] and less than 0.90 [209]. Therefore, the proposed model has discriminant validity.
Table 5.
Discriminant Validity Criteria using HTMT.
To measure discriminant validity, HTMT2, an updated version of HTMT, has been introduced [210]. The HTMT is based on the arithmetic mean and HTMT2 on the geographic mean and less biased estimations. Table 6 shows that all HTMT2 values are less than 0.85 [181] and less than 0.90 [209]. Therefore, the proposed model has discriminant validity.
Table 6.
Discriminant Validity Criteria using HTMT2.
5.2. Structured Model
Path analysis through structural equation modeling (SEM) was done to evaluate the conceptual model and hypotheses derived in the literature review. Figure 3 structure model depicts the results of evaluating the hypothesis, standard regression weights, and values of fit indices, e.g., absolute fit indices, relative fit indices, and non-centrality-based indices. The results Chi-square/df = 2.855, GFI = 0.865, AGFI = 0.847, SRMR=0.084, NFI = 0.902, PNFI = 0.839, IFI = 0.934, TLI = 0.929, CFI = 0.934, PGFI = 0.763, and RMSEA = 0.054 shows that the model is acceptable.
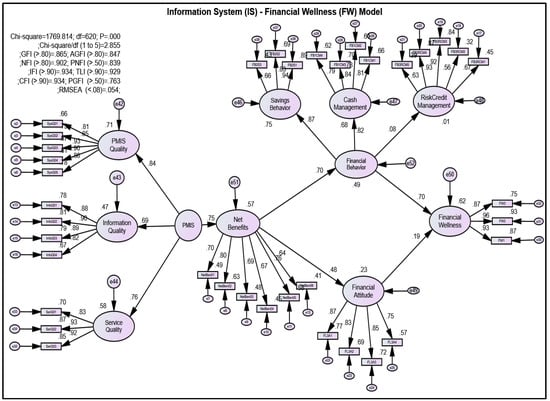
Figure 3.
Structural Equation Model (SEM) with path diagrams.
The coefficient of determination (R-square) of constructs denotes the variance in the dependent variables, which is explained by the independent variables [211]. According to [211] if R-square value has <0.02 means very weak, <0.13 weak, <0.26 moderate and ≥0.26 substantial. A study of [212] refers R-square < 0.10 is negligible and R-square ≥ 0.10 is adequate. Similarly [213] explained R-square < 0.19 very weak, <0.33 weak, <0.67 moderate and ≥0.67 substantial. On the other hand [214,215] suggested R-square < 0.25 very weak, <0.50 weak, <0.75 moderate and ≥0.75 substantial. Table 7 shows values of the R-square of all the constructs are acceptable.
Table 7.
R-square values.
As per Figure 3, factor loading of risk-credit management on financial behavior is very weak and insignificant. Therefore, the researchers also evaluated the model without using risk-credit management and found that the fit indices have improved. Table 8 shows model-fit indices with and without risk-credit management in the IS-FW model.
Table 8.
Values with and without Risk-Credit Management.
The researchers further calculated R-square without risk–credit management and found that the R-square of financial behavior (0.49 to 0.38), financial attitude (0.23 to 0.04), and financial wellness (0.63 to 0.58) have reduced. According to [197,211], the f-square is the degree of the impact on the endogenous construct, and the value ≥ 0.02 is a weak effect, ≥0.15 is moderate, and ≥0.35 is strong. The researchers calculated the f-square effect of risk-credit management for financial behavior (0.21, moderate effect), financial attitude (0.24, moderate effect), and financial wellness (0.13, weak effect). It indicates that the effect size of credit, life, health, crop, and livestock insurance variables of risk-credit management in this study has a moderate effect on the value of R-square of financial behavior and financial attitude and has a weak effect on the value of R-square of financial wellness.
Therefore, in a particular geographical area, risk-credit management is insignificant, but in other geographical regions, it may become significant because risk-credit management is an important factor for understanding the financial behavior of individuals.
6. Discussion
Table 9 presents standardized regression weights of all the relationships present in the model. The result of hypothesis H1a (β = 0.844, p < 0.001) was accepted and contributed to previous literature [84,85,91,92,95,96,97,216] as system quality is an important factor which impacts information system. The results revealed that the PMIS quality, which represents system accessibility, searchability, data representation, usability, and overall functionality, significantly makes PMIS effective.
Table 9.
Standardized Regression Weights: hypotheses testing.
H1b (β = 0.686, p < 0.001) was accepted and indicated that data and information should be easy to understand, precise, self-explainable, and supportive as evidence for further acts. The hypothesis corroborates study of [85,87,91,103,104,105,216] as information quality is an important factor of information system.
H1c (β = 0.764, p < 0.001) was accepted and subsidized previous literature [84,88,90,97,105,106,107]. It explained that service quality which covers troubleshooting user issues, regular handholding, training, and capacity building, improves system effectiveness. In the context of cooperatives, it is important to provide regular training to the cooperative members and their staff.
H2 (β = 0.756, p < 0.001) was accepted and revealed that an effective system would significantly benefit the users and the organizations. The hypothesis contributes to earlier literature [81,85,90,105,110,111,112]. The results show that an effective PMIS will benefit in implementing activities, evaluating and finding the critical gaps, increasing knowledge, and saving the user time. Hence, the higher the PMIS quality, information quality, and service quality make an effective PMIS, whereas an effective PMIS provides higher net benefits to the users and the organization. Therefore, we can conclude that the PMIS quality, information quality, and service quality make PMIS effective, which has a significant impact on the net benefits of the PMIS.
H3 (β = 0.700, p < 0.001) was accepted and explained that the net benefits of an effective PMIS would significantly impact financial behavior. The hypothesis synchronized with earlier literature of [20,22,27,29,30,112,124,131,132] that indicates financial knowledge (the net benefits of the PMIS) and financial practices motivate effective utilization of income and cash in hand, savings, and other financial management. Thus, we can conclude that the net benefits of an effective PMIS significantly impact financial behavior.
Hypothesis H4a (β = 0.867 p < 0.001) was accepted. It supports the literature of [133,134,135,136,138,139,140] as a practice of savings reduce financial stress and ensure availability of funds in the future. Thus, we can conclude that savings behavior significantly impacts financial behavior.
Hypothesis H4b (β = 0.824 p < 0.001) was accepted and supported by the literature of [20,131,142] that explained that effective cash management (i.e., income, budget, day-to-day expenses) significantly impacts financial behavior.
Hypothesis H4c (β = 0.074 p (0.092) > 0.001) was rejected, showing that risk-credit management does not significantly impact the financial behavior of rural households. The risk-credit management was significantly loaded into EFA and CFA; however, it does not become significant in the structural equation model. It explained that households are aware of different insurance and loan products but avoid taking loans from formal sources. However, SHG members utilize internal lending or inter-loaning for their immediate loans requirement.
Hypothesis H5 (β = 0.481 p < 0.001) was accepted and contributed to the literature [150,151,152], which indicates that financial knowledge (the net benefits of the PMIS), training, capacity-building, and financial practices impact financial attitude. The literature [19,217,218] indicates that financial knowledge and attitude are counterparts and complement each other. The results revealed that the net benefits of the PMIS enhance financial knowledge, which significantly substantiates financial attitudes.
Hypothesis H6 (β = 0.704 p < 0.001) was accepted and synchronized with the literature of [20,29,30,37], which explained that financial behavior represents behavior towards financial management which has significant impacts on financial wellness. It also reveals that financial behavior is influenced by financial knowledge and practices. Therefore, we can conclude that positive behavior toward income and savings are the two most important behaviors that influence rural households’ financial wellness.
Hypothesis H7 (β = 0.189 p < 0.001) was accepted and contributed to the literature of [20,34,37,141,161,162,163], which indicates that positive financial attitude towards financial management and knowledge significantly impacts the financial wellness of rural households.
The above hypotheses are corroborated by the concept of [153,154,155,156,157], which indicate that financial knowledge, financial behavior, and financial attitude are important aspects of financial wellness.
The results reveal that an effective PMIS significantly influences net benefits in terms of saving time, gap analysis, implementation of activities, evaluation of activities, increased financial knowledge, and supporting the decision-making of cooperative societies. Subsequently, it supports cooperative societies’ activities and SHGs’ behavior and attitude towards income, savings, and internal lending. Further, an effective PMIS facilitates need-based training, capacity building on information technologies, income-generating activities, and financial management improves rural livelihood and enhances the income and savings of rural households.
Based on the above discussion, we can conclude that an effective PMIS in community-based development programs positively impacts community members’ financial behavior and attitude and improves their financial wellness.
7. Conclusions
This study evaluated the effectiveness of the PMIS for rural households who are a member of SHGs and cooperatives societies and checked the PMIS’s impact on their financial wellness. All households are small and marginal farmers. The PMIS quality, information quality, and service quality constructs conclude into a second-order construct named PMIS. The study shows that the PMIS quality, information quality, and service quality significantly represent overall PMIS. The impact of an effective PMIS is measured on the net benefits of the PMIS. Cash management, savings behavior, and risk–credit management are merged into a second-order construct named financial behavior. The financial behavior and financial attitude represent financial wellness. The study revealed that the net benefits of an effective PMIS significantly impacted rural households’ financial behavior and financial attitudes. Subsequently, financial behavior and financial attitude significantly impact the financial wellness of rural households.
The PMIS quality, information quality, service quality, net benefits, cash management, savings behavior, financial behavior, attitude, and wellness have significantly loaded into the IS-FW model and indicate that financial wellness or economic well-being was improved. It also indicates that ICT or ICT4D is an enabler or catalyst of financial wellness and plays a vital role in development [67]. The results directly correlated with SDG-1 aims to end poverty in all its forms everywhere. The results show that majority of women are in leadership or decision-making positions, which is a sign of women empowerment. These results correlate with SDG-5 purposes to provide equal access, empower women and girls, and increase their representation in the political and economic decision-making processes. The sample was collected from members of SHGs and cooperative societies, including all types of socio-economic category households. These households are of small and marginal farmers. The PMIS is equally accessible to all and impacts everyone. So, the results are in line with SDG-10, which aims to reduce income inequalities and eliminate discriminatory practices by promoting universal social, economic, and political inclusion. Therefore, the IS-FW model presented in the study contributes to SDG-1, SDG-5, and SDG-10. The study shows that the IS-FW model significantly contributes to income, savings, women empowerment, and financial knowledge and reduces socio-economic inequalities. Overall, the study revealed that ICT or ICT4D is one of the main contributors to enhancing financial wellness, enriching financial knowledge, improving behavior, and reducing inequality. The study also infers that community (SHGs, and cooperative societies) driven livelihood financing projects along with information and communication systems further increase economic well-being and reduce socio-economic injustice.
8. Theoretical Implications
The Information System (IS)-Financial Wellness (FW) model, which has been developed and tested in this study, is a holistic approach for measuring the PMIS and its effect on financial wellness in the rural setting.
This study offers three theoretical implications. First, an effective PMIS in cooperative societies within community-based rural development programs plays an important role in their planning, implementation, monitoring, and evaluation. The PMIS quality, information quality, and service quality are important parameters for an effective PMIS in rural development programs.
Second, the combination of net benefits of information technology, financial training, capacity-building, and financial inclusion stimulates financial practices in the SHGs.
Third, diversified livelihood opportunities increase rural households’ income in rural areas. Additionally, financial literacy (financial knowledge) and financial practices (panchsutras) influence their behavior and attitude toward income, savings, investments, expenditure, risk, and credit management, which in turn impact financial wellness.
Further, this study collaborates the IS model with predictors of FW and establishes the relation of IS with important constructs like financial behavior and financial attitude, which have not been studied earlier, to the best knowledge of the authors.
9. Practical Implications
This study acknowledges the net impact of the PMIS and establishes a relation between PMIS and financial wellness in the context of rural areas. The study identifies and validates determinants of an effective PMIS through SHGs and cooperative members’ perceptions. The results also validate that sustainable financial practices (panchsutras), digitization of records, and PMIS impact financial wellness. The adoption of the IS-FW model in rural community settings can improve the financial wellness of rural households by using ICT or ICT4D tools and platforms (PMIS). The IS-FW model will benefit the rural community-based development programs, rural community organizations, civil societies, scholars, development practitioners, bankers and regulators, policymakers, rural enterprises, and farmer-producer organizations. As the study finds, households are aware of risk-credit management, but it is not significant in the structured model. So, the implementors and policymakers need to look into the end-to-end risk and credit management solution. Overall, the results emphasized that ICT or ICT4D tools and platforms (information systems) impact individuals, organizations, and society.
10. Research Limitations and Future Research Directions
The research covers only the SHGs and cooperative members’ perspectives, whereas non-members, seasonal migrating members, peri-urban and rurban households, and youths have not been considered. Peri-urban a transactional area between rural and urban, whereas rurban refers rural-urban area based on population [219,220,221,222]. Other aspects of the economy, i.e., health, food security, and employment, need to be further studied. The research finds that risk-credit management is insignificant to financial behavior in a rural setting. An independent study needs to be conducted for rural households’ risk (insurance products) and credit (loan instruments).
Author Contributions
Conceptualization, A.P., G.C. and P.G.D.; methodology, A.P., G.C. and P.G.D.; software, A.P.; validation, A.P., G.C. and P.G.D.; formal analysis, A.P., G.C. and P.G.D.; investigation, A.P., G.C. and P.G.D.; resources, A.P.; data curation, A.P., G.C. and P.G.D.; writing—original draft preparation, A.P.; writing—review and editing, A.P., G.C. and P.G.D.; visualization, A.P., G.C. and P.G.D.; supervision, G.C. and P.G.D.; project administration, G.C. and P.G.D.; funding acquisition, A.P. All authors have read and agreed to the published version of the manuscript.
Funding
This research received no external funding.
Institutional Review Board Statement
Not applicable.
Informed Consent Statement
Not applicable.
Data Availability Statement
Not applicable.
Acknowledgments
The authors gratefully acknowledge the members of the SHGs and cooperatives who provide their valuable time for the survey.
Conflicts of Interest
The authors declare no conflict of interest.
Appendix A. Questionnaire
| SN. | Variables | Constructs | Notation | Questionnaire |
|---|---|---|---|---|
| 1 | Easy to Operate | PMIS Quality | SysQ01 | PMIS is easy to operate and search records. |
| 2 | System Functionality | SysQ02 | PMIS has features that help in financial record keeping, implementation of activities, business activities, decision making, and other activities. | |
| 3 | Representation of Data | SysQ03 | PMIS provides charts of our business data and financial data. | |
| 4 | Usability | SysQ04 | Based on our monthly activities, PMIS provides a monthly performance chart. We take a printout and review our Cooperative and our staffs’ performance. | |
| 5 | Usability | SysQ05 | PMIS does the grading of cooperatives, which shows our rank compared to other cooperatives. | |
| 6 | Decision Support | Information Quality | InfoQ01 | The monthly key performance chart of our cooperative provides the right direction for us. |
| 7 | Evidence | InfoQ02 | PMIS output report, i.e., demand-supply financial (savings, internal lending, etc.) helps us to make the decision. | |
| 8 | Accuracy | InfoQ03 | Reporting formats reflect accurate data that our staff entered. | |
| 9 | Easy to understand | InfoQ04 | PMIS reporting formats are easy to understand and clear. | |
| 10 | Assurance | Service Quality | SerQ01 | We have access to technical support for PMIS when needed. |
| 11 | Training | SerQ02 | We have received training on PMIS and financial management | |
| 12 | Training | SerQ03 | Our staff received frequent training on PMIS, financial management | |
| 13 | Implementation | Net Benefits | NetBen01 | PMIS facilitates in implementation of activities. |
| 14 | Save Time | NetBen02 | PMIS saves our time. | |
| 15 | Implementation | NetBen03 | PMIS improves services to the community members. | |
| 16 | GAP analysis | NetBen04 | PMIS helps us to analyze business data, and financial data | |
| 17 | Evaluation | NetBen05 | PMIS helps performance measurement. | |
| 18 | Knowledge Increase | NetBen06 | Our financial knowledge is increased after the information we receive. | |
| 19 | Budget Management | Cash Management | FB1CM1 | I make a monthly budget and strictly follow that. |
| 20 | Utility Bills | FB1CM2 | I always pay electric and water bills before the due date. | |
| 21 | Purchase Behavior | FB1CM3 | I always check purchase bills after buying daily consumption items from the market. | |
| 22 | Budget Management | FB1CM4 | I always keep track of my family expenses. | |
| 23 | Savings Behavior | Savings Behavior | FB2S1 | I always deposit extra money in my savings account. |
| 24 | Regular Savings | FB2S2 | I always contribute my monthly savings contribution towards SHG/PG. | |
| 25 | Savings Behavior (Negative) | FB2S3 | I prefer to have deposits in the account rather than more cash in hand. | |
| 26 | Loan | Risk-Credit Management | FB3RCM1 | I regularly pay loan instalments of Kisan Credit Card. |
| 27 | Health Insurance | FB3RCM2 | I have a health insurance policy for emergency health care expenses. | |
| 28 | Crop Insurance | FB3RCM3 | Every season, I purchase crop insurance to reduce financial losses caused by crop failure. | |
| 29 | Cattle Insurance | FB3RCM4 | My cattle are covered by insurance. | |
| 30 | Life Insurance | FB3RCM5 | I have a personal Life Insurance policy. | |
| 31 | Expenditure Attitude | Financial Attitudes | FL3A1 | I always bargain for almost everything that I buy. |
| 32 | Expenditure Attitude | FL3A2 | In making any purchase, generally, my first consideration is the cost. | |
| 33 | Expenditure Attitude | FL3A3 | I always like to buy input items from cooperatives because they give us more quality products at a lower price. | |
| 34 | Income Generating Activities | FL3A4 | I always participate in group, cooperative, and project activities. | |
| 35 | Income | Financial Wellness | FW1 | After joining the SHG/Cooperative, our income has increased. |
| 36 | Savings | FW2 | After joining the SHG/Cooperative, our savings have increased. | |
| 37 | Living Standards | FW3 | After joining the SHG/Cooperative, our living condition has improved. |
References
- Schneider, C.; Fuller, M.A.; Valacich, J.S.; George, J.F. Information Systems Project Management—A Process Approach; Golub, B.L., Ed.; Prospect Press: Burlington, VT, USA, 2020; ISBN 9781943153534. [Google Scholar]
- Laudon, K.C.; Laudon, J.P. Management Information System—Managing the Digital Firm, 16th ed.; Pearson: New York, NY, USA, 2020; ISBN 9780135191798. [Google Scholar]
- Rahman, H.; Shafique, M.N.; Rashid, A. Project Success in the Eyes of Project Management Information System and Project Team Members. Abasyn Univ. J. Soc. Sci. 2018, 11, 1–8. [Google Scholar]
- Teixeira, L.; Xambre, A.R.; Figueiredo, J.; Alvelos, H. Analysis and Design of a Project Management Information System: Practical Case in a Consulting Company. Procedia Comput. Sci. 2016, 100, 171–178. [Google Scholar] [CrossRef]
- Kumar, V.; Purohit, A. Information management system in the livelihood project. Int. J. Res. Commer. IT Manag. 2016, 6, 13–17. [Google Scholar]
- Schwindt, C.; Zimmermann, J. Impact of Project Management Information Systems. In Handbook on Project Management and Scheduling; Springer International Publishing: Cham, Switzerland, 2015; Volume 2, p. 1406. ISBN 9783319059150. [Google Scholar]
- PMBOK. A Guide to the Project Management Body of Knowledge (PMBOK® Guide); PMBOK: Pennsylvania, PA, USA, 2013; ISBN 9781935589679. [Google Scholar]
- MeitY PMIS: Programme Management Information System. Available online: https://pmis.negd.gov.in (accessed on 20 February 2022).
- Project Management for Development Organizations (PM4DEV). Project Information Management System; Project Management for Development Organizations: Washington, DC, USA, 2018; p. 18. [Google Scholar]
- Clemons, E.K.; Dewan, R.M.; Kauffman, R.J.; Weber, T.A. Understanding the Information-Based Transformation of Strategy and Society. J. Manag. Inf. Syst. 2017, 34, 425–456. [Google Scholar] [CrossRef]
- NITI Aayog Monitoring Toolkits. Available online: https://dmeo.gov.in/monitoring/toolkits/dmeo (accessed on 5 March 2022).
- Schmidt, T.D. Strategic Project Management Made Simple: Solution Tools for Leaders and Teams, 2nd ed.; John Wiley & Sons: Hoboken, NJ, USA, 2021; ISBN 9781119718185. [Google Scholar]
- Smith, D.K.F. Managing Project & Strategic Objectives with Logframe Analysis and the Logical Framework. PM World J. 2021, X, 1–8. [Google Scholar]
- Martinez, D.E.; Cooper, D.J. Seeing through the Logical Framework. Voluntas 2020, 31, 1239–1253. [Google Scholar] [CrossRef]
- Garbutt, A.; Simister, N. The Logical Framework; Intrac for Civil Society: London, UK, 2017. [Google Scholar]
- Umhlaba Development Services. Introduction to Monitoring and Evaluation Using the Logical Framework Approach; Umhlaba Development Services: Johannesburg, South Africa, 2017. [Google Scholar]
- DFID. Guidance on Using the Revised Logical Framework; DFID: London, UK, 2011. [Google Scholar]
- ILO. Project Design Manual A Step-by-Step Tool to Support the Development of Cooperatives and Other Forms of Self-Help Organization; ILO: Geneva, Switzerland, 2010; ISBN 9789221241683. [Google Scholar]
- Purohit, A.; Chopra, D.G.; Dangwal, D.P.G. Determinants of Financial Wellness of Rural Households in the Hill Districts of Uttarakhand: An Empirical Approach. Indian J. Financ. Bank. 2022, 9, 83–103. [Google Scholar] [CrossRef]
- Adiputra, I.G. The Influence of Financial Literacy, Financial Attitude and Locus of Control on Financial Satisfaction: Evidence From the Community in Jakarta. KnE Soc. Sci. 2021, 2021, 636–654. [Google Scholar] [CrossRef]
- OECD. OECD/INFE 2020 International Survey of Adult Financial Literacy; OECD: Paris, France, 2020. [Google Scholar]
- Murari, K. Managing Household Finance: An Assessment of Financial Knowledge and Behaviour of Rural Households. J. Rural Dev. 2019, 38, 706–733. [Google Scholar] [CrossRef]
- Morris, T.; Maillet, S.; Koffi, V. Financial Knowledge, Financial Confidence and Learning Capacity on Financial Behavior: A Canadian Study. Cogent Soc. Sci. 2022, 8, 1996919. [Google Scholar] [CrossRef]
- Coskun, A.; Dalziel, N. Mediation Effect of Financial Attitude on Financial Knowledge and Financial Behavior: The Case of University Students. Int. J. Res. Bus. Soc. Sci. 2020, 9, 2. [Google Scholar] [CrossRef]
- Yong, C.C.; Yew, S.Y.; Wee, C.K. Financial Knowledge, Attitude and Behaviour of Young Working Adults in Malaysia. Institutions Econ. 2018, 10, 21–48. [Google Scholar]
- Raveendran, J.; Soren, J.; Ramanathan, V.; Sudharshan, R.; Mahalanabis, S.; Suresh, A.K.; Balaraman, V. Behavior Science Led Technology for Financial Wellness. CSI Trans. ICT 2021, 9, 115–125. [Google Scholar] [CrossRef]
- Zuraidah, Z.; Nasution, E.S. The Effect of Financial Literacy on Financial Behavior Moderated by Information Access. Proc. Int. Conf. Multidiciplinary Res. 2021, 4, 37–42. [Google Scholar] [CrossRef]
- Hashim, A.; Umar, A. The Relationship between Market Orientation, Human Resource Management, Adoption of Information Communication Technology, Performance of Small Medium Enterprises and Mediating Cash Management. In Proceedings of the 4th International Conference on Rural Development and Entrepreneurship (ICORE), Kedah, Malaysia, 30 November–2 December 2017; pp. 1–10. [Google Scholar]
- Iramani, R.; Lutfi, L. An Integrated Model of Financial Well-Being: The Role of Financial Behavior. Accounting 2021, 7, 691–700. [Google Scholar] [CrossRef]
- Zulaihati, S.; Widyastuti, U. Determinants of Consumer Financial Behavior: Evidence from Households in Indonesia. Accounting 2020, 6, 1193–1198. [Google Scholar] [CrossRef]
- Widyastuti, U.; Sumiati, A.; Herlitah; Melati, I.S. Financial Education, Financial Literacy, and Financial Behaviour: What Does Really Matter? Manag. Sci. Lett. 2020, 10, 2715–2720. [Google Scholar] [CrossRef]
- Robb, C.A.; Woodyard, A.S. Financial Knowledge and Best Practice Behavior. J. Financ. Couns. Plan. 2011, 22, 60–70. [Google Scholar]
- Huston, S.J. Measuring Financial Literacy. J. Consum. Aff. 2010, 44, 296–316. [Google Scholar] [CrossRef]
- Botha, F.; de New, J.P. Proposal of a Short Form Self-Reported Financial Wellbeing Scale for Inclusion in the 2026 Census. Aust. Popul. Stud. 2021, 5, 34–39. [Google Scholar] [CrossRef]
- CFPB. CFPB Financial Well-Being Scale: Scale Development Technical Report; CFPB: Washington, DC, USA, 2017. [Google Scholar]
- CFPB. Measuring Financial Well-Being: A Guide to Using the CFPB Financial Well-Being Scale; CFPB: Washington, DC, USA, 2015. [Google Scholar]
- Brüggen, E.C.; Hogreve, J.; Holmlund, M.; Kabadayi, S.; Löfgren, M. Financial Well-Being: A Conceptualization and Research Agenda. J. Bus. Res. 2017, 79, 228–237. [Google Scholar] [CrossRef]
- Prawitz, A.D.; Cohart, J. Financial Management Competency, Financial Resources, Locus of Control, and Financial Wellness. J. Financ. Couns. Plan. 2016, 27, 142–157. [Google Scholar] [CrossRef]
- Zemtsov, A.A.; Osipova, T.Y. Financial Wellbeing as a Type of Human Wellbeing: Theoretical Review. Eur. Proc. Soc. Behav. Sci. EpSBS 2016, 7, 385–392. [Google Scholar]
- Falahati, L.; Sabri, M.F. An Exploratory Study of Personal Financial Wellbeing Determinants: Examining the Moderating Effect of Gender. Asian Soc. Sci. 2015, 11, 33–42. [Google Scholar] [CrossRef]
- Woodworth, R.S. Psychology (Revised Edition), 2nd ed.; Henry Holt & Company: New York, NY, USA, 1929. [Google Scholar]
- Mehrabian, A.; Russell, J.A. An Approach to Environmental Psychology; The MIT Press: Cambridge, MA, USA, 1974; ISBN 8003742722. [Google Scholar]
- Olfat, M.; Ahmadi, S.; Shokouhyar, S.; Bazeli, S. Linking Organizational Members’ Social-Related Use of Enterprise Social Media (ESM) to Their Fashion Behaviors: The Social Learning and Stimulus-Organism-Response Theories. Corp. Commun. 2022, 27, 91–109. [Google Scholar] [CrossRef]
- Wu, P.; Feng, R. Social Media and Health: Emerging Trends and Future Directions for Research on Young Adults. Int. J. Environ. Res. Public Health 2021, 18, 8141. [Google Scholar] [CrossRef] [PubMed]
- Pandita, S.; Mishra, H.G.; Chib, S. Psychological Impact of COVID-19 Crises on Students through the Lens of Stimulus-Organism-Response (SOR) Model. Child. Youth Serv. Rev. 2021, 120, 105783. [Google Scholar] [CrossRef]
- Chopdar, P.K.; Balakrishnan, J. Consumers Response towards Mobile Commerce Applications: S-O-R Approach. Int. J. Inf. Manag. 2020, 53, 102106. [Google Scholar] [CrossRef]
- Kim, M.J.; Lee, C.K.; Jung, T. Exploring Consumer Behavior in Virtual Reality Tourism Using an Extended Stimulus-Organism-Response Model. J. Travel Res. 2020, 59, 69–89. [Google Scholar] [CrossRef]
- Islam, J.U.; Shahid, S.; Rasool, A.; Rahman, Z.; Khan, I.; Rather, R.A. Impact of Website Attributes on Customer Engagement in Banking: A Solicitation of Stimulus-Organism-Response Theory. Int. J. Bank Mark. 2020, 38, 1279–1303. [Google Scholar] [CrossRef]
- Luqman, A.; Cao, X.; Ali, A.; Masood, A.; Yu, L. Empirical Investigation of Facebook Discontinues Usage Intentions Based on SOR Paradigm. Comput. Hum. Behav. 2017, 70, 544–555. [Google Scholar] [CrossRef]
- Prashar, S.; Sai Vijay, T.; Parsad, C. Effects of Online Shopping Values and Website Cues on Purchase Behaviour: A Study Using S-O-R Framework. Vikalpa—J. Decis. Makers 2017, 42, 1–18. [Google Scholar] [CrossRef]
- Agbonlahor, E.; Oasgiede, I.F. Stimulus-Organism-Response (S-O-R) Interaction Effects of the Sign Learning Theory in Achieving Motor Outcomes. J. Lang. Technol. Entrep. AFRICA 2017, 8, 109–121. [Google Scholar]
- Zhang, G.; Yue, X.; Ye, Y.; Peng, M.Y.P. Understanding the Impact of the Psychological Cognitive Process on Student Learning Satisfaction: Combination of the Social Cognitive Career Theory and SOR Model. Front. Psychol. 2021, 12, 1–14. [Google Scholar] [CrossRef] [PubMed]
- PIB Categorisation of Farmers. Available online: https://pib.gov.in/newsite/PrintRelease.aspx?relid=188051 (accessed on 10 June 2021).
- ICAR. Evaluation of Successful Interventions under the Integrated Livelihoods Support Project (ILSP) of Uttarakhand and the Lessons for Out-Scaling; Central Project Coordination Unit (CPCU): New Delhi, India, 2021. [Google Scholar]
- CPCU. ILSP: Annual Progress Report—2020–21; Integrated Livelihood Support Project (ILSP): Dehradun, India, 2021. [Google Scholar]
- CPCU. ILSP: Annual Progress Report—2017–18; Integrated Livelihood Support Project (ILSP): Dehradun, India, 2018. [Google Scholar]
- UGVS. Case Studies—Towards Prosperity; Integrated Livelihood Support Project (ILSP): Dehradun, India, 2017. [Google Scholar]
- Mishra, K. Cooperative Movement and Its Emerging Scenario in India. Int. J. Sci. Technol. Res. 2020, 9, 3799–3802. [Google Scholar]
- Sahoo, A.K.; Meher, S.K.; Panda, T.C.; Sahu, S.; Begum, R.; Barik, N.C. Critical Review on Cooperative Societies in Agricultural Development in India. Curr. J. Appl. Sci. Technol. 2020, 39, 114–121. [Google Scholar] [CrossRef]
- Apostolakis, G.; Van Dijk, G. Cooperative Organizations and Members’ Role: A New Perspective; CIRIEC No 2018/04; CIRIEC International: Liège, Belgium, 2018. [Google Scholar]
- PIB Cooperatives Should Play Significant Role in the Implementation of Development Schemes. Available online: https://pib.gov.in/newsite/PrintRelease.aspx?relid=123141 (accessed on 5 September 2021).
- COOP What Is a Cooperative? Available online: https://www.ica.coop/en/cooperatives/what-is-a-cooperative (accessed on 13 August 2021).
- UNDP. The 17 Sustainable Development Goals. Available online: https://sdgs.un.org/goal (accessed on 14 February 2022).
- UNDP. The Next Frontier: Human Development and the Anthropocene; UNDP: New York, NY, USA, 2020; ISBN 9789211264425. [Google Scholar]
- Chien, F.; Anwar, A.; Hsu, C.C.; Sharif, A.; Razzaq, A.; Sinha, A. The Role of Information and Communication Technology in Encountering Environmental Degradation: Proposing an SDG Framework for the BRICS Countries. Technol. Soc. 2021, 65, 101587. [Google Scholar] [CrossRef]
- Onyebu, U.F.; Emmanuel, D.U.; Ali, G.J. The Role of ICT in Sustainable Development Goal (SDG). West Afr. J. Ind. Acad. Res. 2019, 20, 40–48. [Google Scholar]
- Qureshi, S. Perspectives on Development: Why Does Studying Information and Communication Technology for Development (ICT4D) Matter? Inf. Technol. Dev. 2019, 25, 381–389. [Google Scholar] [CrossRef]
- Jindal, S.; Vatta, L. ICT: A Deed for Sustainable Development Goals. J. Natl. Dev. 2018, 31, 222–235. [Google Scholar] [CrossRef]
- Mata, F.J.; Pont, A. ICT for Promoting Human Development and Protecting the Environment. IFIP Int. Fed. Inf. Process. 2016, 2, 3–13. [Google Scholar] [CrossRef]
- PaySe. Digitizing SHG Transactions—A Case of PaySe; PaySe: Noida, India, 2020. [Google Scholar]
- Qureshi, S. Why Data Matters for Development? Exploring Data Justice, Micro-Entrepreneurship, Mobile Money and Financial Inclusion. Inf. Technol. Dev. 2020, 26, 201–213. [Google Scholar] [CrossRef]
- DeLone, W.H.; McLean, E.R. The DeLone and McLean Model of Information Systems Success: A Ten-Year Update. J. Manag. Inf. Syst. 2003, 19, 9–30. [Google Scholar] [CrossRef]
- Davis, F.D. Perceived Usefulness, Perceived Ease of Use, and User Acceptance of Information Technology. MIS Q. 1989, 13, 319–340. [Google Scholar] [CrossRef]
- Davis, F.D. User Acceptance of Information Systems: The Technology Acceptance Model (TAM). Int. J. Man. Mach. Stud. 1993, 38, 475–487. [Google Scholar] [CrossRef]
- Papagiannidis, S. Theoryhub Book; Theory Hub: Newcastle upon Tyne, UK, 2022; ISBN 9781739604400. Available online: https://open.ncl.ac.uk (accessed on 8 September 2022).
- Venkatesh, V.; Davis, F.D. A Theoretical Extension of the Technology Acceptance Model: Four Longitudinal Field Studies. Manag. Sci. 2000, 46, 185–204. [Google Scholar] [CrossRef]
- Venkatesh, V.; Bala, H. Technology Acceptance Model 3 and a Research Agenda on Interventions. Decis. Sci. 2008, 39, 273–315. [Google Scholar] [CrossRef]
- Venkatesh, V.; Morris, M.G.; Davis, G.B.; Davis, F.D. User Acceptance of Information Technology: Toward a Unified View. MIS Q. 2003, 27, 425–478. [Google Scholar] [CrossRef]
- Venkatesh, V.; Thong, J.Y.L.; Xu, X. Consumer Acceptance and Use of Information Technology: Extending the Unified Theory of Acceptance and Use of Technology. MIS Q. 2012, 36, 157–178. [Google Scholar] [CrossRef]
- DeLone, W.H.; McLean, E.R. Information Systems Success: The Quest for the Dependent Variable. J. Manag. Inf. Syst. 1992, 3, 60–95. [Google Scholar] [CrossRef]
- DeLone, W.H.; McLean, E.R. Information Systems Success Measurement. Found. Trends Inf. Syst. 2016, 2, 1–116. [Google Scholar] [CrossRef]
- Sulistiyani, E.; Tyas, S.H.Y. What Is the Measurement of the the IT Success? Procedia Comput. Sci. 2022, 197, 282–289. [Google Scholar] [CrossRef]
- Garomssa, S.D.; Kannan, R.; Chai, I. Updated DeLone and McLean IS Success Model and Commercial Open Source Software (COSS) Company Success. In Proceedings of the 10th Knowledge Management International Conference (KMICe2021), Putrajaya, Malaysia, 1 February 2021; pp. 33–38. [Google Scholar]
- Alketbi, S.; Akmal, S.; Al-Shami, S.S.A.; Hamid, R.A. Conceptual Framework: The Role of Cognitive Absorption in Delone and Mclean Success Model in Online Learning in United Arab Emirates. Acad. Strateg. Manag. J. 2021, 20, 1–9. [Google Scholar]
- Dewi, N.W.S.C.; Suprasto, H.B.; Bagus, A.A.N.; Dwija Putri, I.G.A.M.A. Putri Implementation of the Tri Hita Karana Culture in Delone and Mclean Models to Assess The Success of Using Accounting Information Systems. J. Econ. Financ. Manag. Stud. 2021, 4, 2082–2092. [Google Scholar] [CrossRef]
- Lee, C.C.; Nagpal, P.; Lim, H.S.; Dutil, L.; Lee, R.; Kim, Y. A Variation of the DeLone and McLean Model for Collaborative Commerce Services: A Structural Equation Model. J. Int. Technol. Inf. Manag. 2021, 29, 81–101. [Google Scholar]
- Le, Q.B.; Nguyen, M.D.; Bui, V.C.; Dang, T.M.H. The Determinants of Management Information Systems Effectiveness in Small-and Medium-Sized Enterprises. J. Asian Financ. Econ. Bus. 2020, 7, 567–576. [Google Scholar] [CrossRef]
- Zaineldeen, S.; Hongbo, L.; Koffi, A.L. Review of The DeLone and McLean Model of Information Systems Success’ Background and It’s an Application in the Education Setting, and Association Linking with Technology Acceptance Model. Int. J. Res. Soc. Sci. 2020, 10, 99–109. [Google Scholar]
- Lee, E.Y.; Jeon, Y.J.J. The Difference of User Satisfaction and Net Benefit of a Mobile Learning Management System According to Self-Directed Learning: An Investigation of Cyber University Students in Hospitality. Sustainbility 2020, 12, 2672. [Google Scholar] [CrossRef]
- Chopra, G.; Madan, P.; Jaisingh, P.; Bhaskar, P. Effectiveness of E-Learning Portal from Students’ Perspective: A Structural Equation Model (SEM) Approach. Interact. Technol. Smart Educ. 2019, 16, 94–116. [Google Scholar] [CrossRef]
- Al-Mamary, Y.H.S. Measuring Information Systems Success in Yemen: Potential of Delone and Mcleans Model. Int. J. Sci. Technol. Res. 2019, 8, 793–799. [Google Scholar]
- Adya, M.; Wang, W.; Donovan, E.; Indira, G.R. A Cloud Update of the DeLone and McLean Model of Information Systems. J. Inf. Technol. Manag. 2018, XXIX, 23–34. [Google Scholar]
- Mahmoodi, Z.; Esmaelzadeh-Saeieh, S.; Lotfi, R.; Baradaran Eftekhari, M.; Akbari Kamrani, M.; Mehdizadeh Tourzani, Z.; Salehi, K. The Evaluation of a Virtual Education System Based on the DeLone and McLean Model: A Path Analysis. F1000Research 2017, 6, 1–11. [Google Scholar] [CrossRef]
- Sedera, D.; Eden, R.; McLean, E.R. Are We There yet? A Step Closer to Theorizing Information Systems Success. In Proceedings of the International Conference on Information Systems (ICIS 2013): Reshaping Society Through Information Systems Design, Milan, Italy, 15–18 December 2013; Volume 1, pp. 499–519. [Google Scholar]
- Ahmed, M.; Rashid, U.; Nasuredin, J.; Hamawandy, N.; Bewani, H.; Jamil, D. The Effect of Delone and Mclean’s Information System Success Model on The Job Performance of Accounting Managers in Iraqi Banks. J. Contemp. Issues Bus. Gov. 2021, 27, 1–15. [Google Scholar] [CrossRef]
- Seliana, N.; Suroso, A.I.; Yuliati, L.N. Evaluation of E-Learning Implementation in the University Using Delone and Mclean Success Model. J. Apl. Manaj. 2020, 18, 345–352. [Google Scholar] [CrossRef]
- Nugroho, Y.; Prasetyo, A. Assessing Information Systems Success: A Respecification of the DeLone and McLean Model to Integrating the Perceived Quality. Probl. Perspect. Manag. 2018, 16, 348–360. [Google Scholar] [CrossRef]
- Iriarte, C.; Bayona, S. IT Projects Success Factors: A Literature Review. Int. J. Inf. Syst. Proj. Manag. 2020, 8, 49–78. [Google Scholar] [CrossRef]
- Choi, H.J.; Ahn, J.C.; Jung, S.H.; Kim, J.H. Communities of Practice and Knowledge Management Systems: Effects on Knowledge Management Activities and Innovation Performance. Knowl. Manag. Res. Pract. 2020, 18, 53–68. [Google Scholar] [CrossRef]
- Mustafa, S.Z.; Kar, A.K.; Janssen, M.F.W.H.A. Understanding the impact of digital service failure on users: Integrating Tan’s failure and DeLone and McLean’s success model. Int. J. Inf. Manag. 2020, 53, 102119. [Google Scholar] [CrossRef]
- Coiera, E. Assessing Technology Success and Failure Using Information Value Chain Theory. Stud. Health Technol. Inform. 2019, 263, 35–48. [Google Scholar] [CrossRef]
- DeLone, W.H.; McLean, E.R. Measuring E-Commerce Success: Applying the DeLone and McLean Information Systems Success Model. Int. J. Electron. Commer. 2004, 9, 31–47. [Google Scholar] [CrossRef]
- Hardianti; Hidayatullah, S.; Respati, H. Implementation of the DeLone and McLean information system success models for information systems based on social media. Int. J. Creat. Res. Throughts 2021, 9, 4361–4368. [Google Scholar]
- Paudel, S.; Kumar, V. Critical Success Factors of Information Technology Outsourcing for Emerging Markets. J. Comput. Sci. 2021, 17, 459–469. [Google Scholar] [CrossRef]
- Riasti, B.K.; Nugroho, A. Analysis of the Success of Student Monitoring Information System Implementation Using DeLone and McLean Model. J. Phys. Conf. Ser. 2019, 1339, 012063. [Google Scholar] [CrossRef]
- Zheng, Y.; Wang, J.; Doll, W.; Deng, X.; Williams, M. The Impact of Organisational Support, Technical Support, and Self-Efficacy on Faculty Perceived Benefits of Using Learning Management System. Behav. Inf. Technol. 2018, 37, 311–319. [Google Scholar] [CrossRef]
- Alshammari, S.H.; Ali, M.B.; Rosli, M.S. The Influences of Technical Support, Self Efficacy and Instructional Design on the Usage and Acceptance of LMS: A Comprehensive Review. Turk. Online J. Educ. Technol. 2016, 15, 116–125. [Google Scholar]
- Petter, S.; Delone, W.; McLean, E.R. Information Systems Success: The Quest for the Independent Variables. J. Manag. Inf. Syst. 2013, 29, 7–62. [Google Scholar] [CrossRef]
- Sari, N.W.W.; Yanuartha, W.; Yani, M.; Dewa, S.R. Evaluation of E-Learning Implementation During the COVID-19 with the DeLone and McLean Models. Int. J. Inf. Syst. Technol. 2021, 4, 637–644. [Google Scholar] [CrossRef]
- Ariyanto, D.; Dewi, A.A.; Hasibuan, H.T.; Paramadani, R.B. The Success of Information Systems and Sustainable Information Society: Measuring the Implementation of a Village Financial System. Sustainability 2022, 14, 3851. [Google Scholar] [CrossRef]
- Paliwal, M.; Nistala, N. IFFCO: Staying on Top of the Cooperatives. In Catalysing Sustainable Development Through Producers Collectives; Tripathy, K.K., Wadkar, S.K., Singh, A., Eds.; Notion Press: Chennai, India, 2021; pp. 255–284. ISBN 9781639403844. [Google Scholar]
- Tambo, J.A.; Aliamo, C.; Davis, T.; Mugambi, I.; Romney, D.; Onyango, D.O.; Kansiime, M.; Alokit, C.; Byantwale, S.T. The Impact of ICT-Enabled Extension Campaign on Farmers’ Knowledge and Management of Fall Armyworm in Uganda. PLoS ONE 2019, 14, e0220844. [Google Scholar] [CrossRef]
- IFAD. 10 Ways in Which ICTs Can Transform the Lives of Rural Women. Available online: https://www.ifad.org/en/web/latest/story/asset/40232867 (accessed on 18 December 2020).
- Siochrú, S.Ó. Empowering Communities through ICT Cooperative Enterprises: The Case of India. In Proceedings of the Development in the Information Society: Exploring a Social Policy Framework, Bangalore, India, 18–20 January 2007; pp. 24–43. [Google Scholar]
- NIRDPR. Impact Evaluation of Financial Inclusion Programmes of UPASaC in Uttarakhand; National Institute of Rural Development and Panchayati Raj: Hyderabad, India, 2020. [Google Scholar]
- Walsham, G. ICT4D Research: Reflections on History and Future Agenda. Inf. Technol. Dev. 2017, 23, 18–41. [Google Scholar] [CrossRef]
- Pradhan, R.P.; Arvin, M.B.; Nair, M.S.; Hall, J.H.; Bennett, S.E. Sustainable Economic Development in India: The Dynamics between Financial Inclusion, ICT Development, and Economic Growth. Technol. Forecast. Soc. Chang. 2021, 169, 120758. [Google Scholar] [CrossRef]
- Rahman, S.A.; Alam, M.M.D.; Taghizadeh, S.K. Do Mobile Financial Services Ensure the Subjective Well-Being of Micro-Entrepreneurs? An Investigation Applying UTAUT2 Model. Inf. Technol. Dev. 2020, 26, 421–444. [Google Scholar] [CrossRef]
- Mushtaq, R.; Bruneau, C. Microfinance, Financial Inclusion and ICT: Implications for Poverty and Inequality. Technol. Soc. 2019, 59, 106–112. [Google Scholar] [CrossRef]
- Lapukeni, A.F. Financial Inclusion and the Impact of ICT: An Overview. Am. J. Econ. 2015, 5, 495–500. [Google Scholar] [CrossRef]
- Word Bank Financial Inclusion Overview. Available online: https://www.worldbank.org/en/topic/financialinclusion/overview#1 (accessed on 5 April 2022).
- Peng, C.; Ma, B.; Zhang, C. Poverty Alleviation through E-Commerce: Village Involvement and Demonstration Policies in Rural China. J. Integr. Agric. 2021, 20, 998–1011. [Google Scholar] [CrossRef]
- RBI. Master Circular—Deendayal Antyodaya Yojana—National Rural Livelihoods Mission (DAY-NRLM); RBI/2019-2; Springer: Cham, Switzerland, 2019. [Google Scholar]
- Zheng, Y.; Hatakka, M.; Sahay, S.; Andersson, A. Conceptualizing Development in Information and Communication Technology for Development (ICT4D). Inf. Technol. Dev. 2018, 24, 1–14. [Google Scholar] [CrossRef]
- Alshubiri, F.; Jamil, S.A.; Elheddad, M. The Impact of ICT on Financial Development: Empirical Evidence from the Gulf Cooperation Council Countries. Int. J. Eng. Bus. Manag. 2019, 11. [Google Scholar] [CrossRef]
- NABARD. Master Circular on Self Help Group-Bank Linkage Programme; NABARD: Mumbai, India, 2018. [Google Scholar]
- CPCU. ILSP: Annual Progress Report—2019–20; Integrated Livelihood Support Project (ILSP): Dehradun, India, 2020. [Google Scholar]
- CPCU. ILSP: Annual Progress Report—2018–19; Integrated Livelihood Support Project (ILSP): Dehradun, India, 2019. [Google Scholar]
- CPCU. ILSP: Annual Progress Report—2013–14; Integrated Livelihood Support Project (ILSP): Dehradun, India, 2014. [Google Scholar]
- Bu, D.; Hanspal, T.; Liao, Y.; Liu, Y. Financial Literacy and Self-Control in FinTech: Evidence from a Field Experiment on Online Consumer Borrowing; SAFE Working Paper No. 273; Leibniz Institute for Financial Research SAFE: Frankfurt, Germany, 2020. [Google Scholar]
- Fazli Sabri, M.; Reza, T.S.; Wijekoon, R. Financial Management, Savings and Investment Behavior and Financial Well-Being of Working Women in the Public Sector. Maj. Ilm. Bijak 2020, 17, 135–153. [Google Scholar] [CrossRef]
- Munyegera, G.K.; Matsumoto, T. ICT for Financial Access: Mobile Money and the Financial Behavior of Rural Households in Uganda. Rev. Dev. Econ. 2018, 22, 45–66. [Google Scholar] [CrossRef]
- Despard, M.R.; Friedline, T.; Martin-West, S. Why Do Households Lack Emergency Savings? The Role of Financial Capability. J. Fam. Econ. Issues 2020, 41, 542–557. [Google Scholar] [CrossRef]
- Gaisina, S.; Kaidarova, L. Financial Literacy of Rural Population as a Determinant of Saving Behavior in Kazakhstan. Rural Sustain. Res. 2017, 38, 32–42. [Google Scholar] [CrossRef]
- Nguyen, T.A.N.; Rózsa, Z.; Belás, J.; Belásová, Ľ. The Effects of Perceived and Actual Financial Knowledge on Regular Personal Savings: Case of Vietnam. J. Int. Stud. 2017, 10, 278–291. [Google Scholar] [CrossRef]
- Lulaj, E.; Dragusha, B.; Lulaj, D.; Rustaj, V.; Gashi, A. Households Savings and Financial Behavior in Relation To the Ability To Handle Financial Emergencies: Case Study of Kosovo. Acta Sci. Pol. Oeconomia 2021, 20, 35–48. [Google Scholar] [CrossRef]
- OECD Household Savings. OECD Factbook 2015–2016: Economic, Environmental and Social Statistics; OECD Publishing: Paris, France, 2016; pp. 52–54. [Google Scholar]
- Ban, R.; Gilligan, M.J.; Rieger, M. Self-Help Groups, Savings and Social Capital: Evidence from a Field Experiment in Cambodia. J. Econ. Behav. Organ. 2020, 180, 174–200. [Google Scholar] [CrossRef]
- Ruhela, S.; Prakash, A. Saving Preferences and Financial Literacy of Self Help Group Members: A Study of Uttar Pradesh. Manthan J. Commer. Manag. 2018, 4, 82–92. [Google Scholar] [CrossRef]
- Kumar, L.; Vijayalakshmi, C.; Raghuraman, S. Role of Voluntary Savings in SHG/SHG Members: An Analysis in Tamil Nadu & Karnataka; NABARD: Mumbai, India, 2009. [Google Scholar]
- Gautam, Y.; Andersen, P. Rural Livelihood Diversification and Household Well-Being: Insights from Humla, Nepal. J. Rural Stud. 2016, 44, 239–249. [Google Scholar] [CrossRef]
- San-Jose, L.; Iturralde, T.; Maseda, A. The Influence of Information Communications Technology (ICT) on Cash Management and Financial Department Performance: An Explanatory Model. Can. J. Adm. Sci. 2009, 26, 150–169. [Google Scholar] [CrossRef]
- Meenatchi, M.E.; Ponnudurai, D.S.A. A Study on Factor Influencing SHG Members to Start Enterprises and Problems Encountered by the SHGs Members in Their Enterprises in Thoothukudi District. Hist. Res. J. 2019, 5, 2828–2838. [Google Scholar]
- Prashar, M.; Chahal, B.P.S. Micro-Savings, Micro-Finance and Selfempowerment—Analysis of Rural Women SHGs of Punjab. J. Adv. Res. Dyn. Control Syst. 2019, 11, 1354–1359. [Google Scholar]
- Samishetti, B.; Anusha, K. Financial Management of Self Help Groups in the Warangal Rural District. Eur. J. Mol. Clin. Med. 2020, 7, 866–876. [Google Scholar]
- Chavali, K.; Raj, P.M.; Ahmed, R. Does Financial Behavior Influence Financial Well-Being? J. Asian Financ. Econ. Bus. 2021, 8, 273–280. [Google Scholar] [CrossRef]
- Strömbäck, C.; Lind, T.; Skagerlund, K.; Västfjäll, D.; Tinghög, G. Does Self-Control Predict Financial Behavior and Financial Well-Being? J. Behav. Exp. Financ. 2017, 14, 30–38. [Google Scholar] [CrossRef]
- Murugesan, R.; Manohar, V. Financial Literacy—A Determinant of Investment in Health Insurance. Int. J. Commer. 2020, 8, 33–38. [Google Scholar] [CrossRef]
- IGI-Global. What Is Financial Attitudes. Available online: https://www.igi-global.com/dictionary/financial-literacy/58683 (accessed on 22 May 2021).
- Talwar, M.; Talwar, S.; Kaur, P.; Tripathy, N.; Dhir, A. Has Financial Attitude Impacted the Trading Activity of Retail Investors during the COVID-19 Pandemic? J. Retail. Consum. Serv. 2021, 58, 102341. [Google Scholar] [CrossRef]
- Rai, K.; Dua, S.; Yadav, M. Association of Financial Attitude, Financial Behaviour and Financial Knowledge Towards Financial Literacy: A Structural Equation Modeling Approach. FIIB Bus. Rev. 2019, 8, 51–60. [Google Scholar] [CrossRef]
- Meena, M.S.; Singh, K.M. Measurement of Attitudes of Rural Poor Towards SHGs in Bihar, India. SSRN Electron. J. 2012, March, 1–7. [Google Scholar] [CrossRef]
- Strumpel, B. Economic Means for Human Needs: Social Indicators of Well-Being and Discontent; U Michigan Press: Ann Arbor, MI, USA, 1976. [Google Scholar]
- Porter, N.M.; Thomas Garman, E.; Garman, E.T. Testing a Conceptual Model of Financial Well-Being. J. Financ. Couns. Plan. 1993, 4, 135–164. [Google Scholar]
- Joo, S.; Grable, J.E. An Exploratory Framework of the Determinants of Financial Satisfaction. J. Fam. Econ. Issues 2004, 25, 25–50. [Google Scholar] [CrossRef]
- Woodyard, A. Measuring Financial Wellness. Consum. Interes. Annu. 2013, 59, 1–6. [Google Scholar]
- Kempson, E.; Finney, A.; Poppe, C. Financial Well-Being A Conceptual Model and Preliminary Analysis. SIFO Consumption Research Norway: Oslo, Norway, 2017. [Google Scholar]
- Predergast, S.; Blackmore, D.; Kempson, E. Financial Wellbeing—A Survey of Adults in New Zealand; ANZ Banking Group Limited: Melbourne, Australia, 2018. [Google Scholar]
- Reserve Bank of India. National Strategy for Financial Education 2020–2025; Reserve Bank of India: Mumbai, India, 2021. [Google Scholar]
- PwC. PwC’s 9th Annual Employee Financial Wellness Survey; PricewaterhouseCoopers LLP: London, UK, 2020. [Google Scholar]
- Potrich, A.C.G.; Vieira, K.M.; Mendes-Da-Silva, W. Development of a Financial Literacy Model for University Students. Manag. Res. Rev. 2016, 39, 356–376. [Google Scholar] [CrossRef]
- Besri, A.A.O. Pengaruh Financial Attitude, Financial Knowledge Dan Locus of Control Terhadap Financial Management Behavior Mahasiswa S-1 Fakultas Ekonomi Universitas Islam Indonesia Yogyakarta; Universitas Islam Indonesia: Yogyakarta, Indonesia, 2018; pp. 1–19. [Google Scholar]
- Ponchio, M.C.; Cordeiro, R.A.; Gonçalves, V.N. Personal Factors as Antecedents of Perceived Financial Well-Being: Evidence from Brazil. Int. J. Bank Mark. 2019, 37, 1004–1024. [Google Scholar] [CrossRef]
- Ojo, A.I. Validation of the Delone and Mclean Information Systems Success Model. Healthc. Inform. Res. 2017, 23, 60–66. [Google Scholar] [CrossRef] [PubMed]
- Xiao, J.J.; Kim, K.T. The Able Worry More? Debt Delinquency, Financial Capability, and Financial Stress. J. Fam. Econ. Issues 2022, 43, 138–152. [Google Scholar] [CrossRef]
- Gutti, R.K.P. An Analysis of Literacy in Finance among the Students of Postgraduate Management Studies in Hyderabad. Int. J. Mod. Agric. 2020, 9, 893–903. [Google Scholar]
- Dutta, B.; Peng, M.H.; Chen, C.C.; Sun, S.L. Interpreting Usability Factors Predicting Sustainable Adoption of Cloud-Based e-Learning Environment during COVID-19 Pandemic. Sustainbility 2021, 13, 9329. [Google Scholar] [CrossRef]
- Thongmak, M. A Model for Enhancing Employees’ Lifelong Learning Intention Online. Learn. Motiv. 2021, 75, 101733. [Google Scholar] [CrossRef]
- Wu, X.; Xiong, J.; Yan, J.; Wang, Y. Perceived Quality of Traceability Information and Its Effect on Purchase Intention towards Organic Food. J. Mark. Manag. 2021, 37, 1267–1286. [Google Scholar] [CrossRef]
- Aldholay, A.H.; Isaac, O.; Abdullah, Z.; Ramayah, T. The Role of Transformational Leadership as a Mediating Variable in DeLone and McLean Information System Success Model: The Context of Online Learning Usage in Yemen. Telemat. Inform. 2018, 35, 1421–1437. [Google Scholar] [CrossRef]
- Dalloul, M.H.M.; Ibrahim, Z.B.; Urus, S.T. The Association Between the Success of Information Systems and Crises Management (A Theoretical View and Proposed Framework). Int. J. Asian Soc. Sci. 2022, 12, 55–68. [Google Scholar] [CrossRef]
- Božič, K.; Dimovski, V. The Relationship between Business Intelligence and Analytics Use and Organizational Absorptive Capacity: Applying the DeLone & Mclean Information Systems Success Model. Econ. Bus. Rev. 2020, 22, 191–232. [Google Scholar] [CrossRef]
- Coşkuner, S. Understanding Factors Affecting Financial Satisfaction: The Influence of Financial Behavior, Financial Knowledge and Demographics. Imp. J. Interdiscip. Res. 2016, 2, 377–385. [Google Scholar]
- George, D.; Mallery, P. IBM SPSS Statistics 23 Step by Step: A Simple Guide and Reference, 14th ed.; Routledge Taylor & Francis Group: New York, NY, USA, 2016; ISBN 9781138491045. [Google Scholar]
- Hair, J.F.; Sarstedt, M.; Ringle, C.M.; Gudergan, S.P. Advanced Issues in Partial Least Squares Structural Equation Modeling; SAGE Publishing: New York, NY, USA, 2017. [Google Scholar]
- Watkins, M.W. Exploratory Factor Analysis: A Guide to Best Practice. J. Black Psychol. 2018, 44, 219–246. [Google Scholar] [CrossRef]
- Podsakoff, P.M.; Organ, D.W. Self-Reports in Organizational Research: Problems and Prospects. J. Manag. 1986, 12, 531–544. [Google Scholar] [CrossRef]
- Baistaman, J.; Awang, Z.; Afthanorhan, A.; Zulkifli Abdul Rahim, M. Developing and Validating the Measurement Model for Financial Literacy Construct Using Confirmatory Factor Analysis. Humanit. Soc. Sci. Rev. 2020, 8, 413–422. [Google Scholar] [CrossRef]
- Yusof, Y.; Jusoff, K.; Ibrahim, Y.; Awang, Z. The Influence of Green Practices by Non-Green Hotels on Customer Satisfaction and Loyalty in Hotel and Tourism Industry. Int. J. Green Econ. 2017, 11, 1. [Google Scholar] [CrossRef]
- Awang, Z. Structural Equation Modeling Using AMOS Graphic; Penerbit Universiti Teknologi MARA: Shah Alam, Malaysia, 2012; ISBN 9789673634187. [Google Scholar]
- Kline, R.B. Principles and Practice of Structural Equation Modeling, 4th ed.; The Guilford Press: New York, NY, USA, 2016; ISBN 9781609182304. [Google Scholar]
- Gaskin, J. CFA: Model Fit Analysis. Available online: http://statwiki.gaskination.com/index.php?title=CFA#Model_Fit (accessed on 4 July 2021).
- Hooper, D.; Coughlan, J.; Mullen, M.R. Structural Equation Modelling: Guidelines for Determining Model Fit. Electron. J. Bus. Res. Methods 2008, 6, 53–60. [Google Scholar] [CrossRef]
- Hu, L.T.; Bentler, P.M. Cutoff Criteria for Fit Indexes in Covariance Structure Analysis: Conventional Criteria versus New Alternatives. Struct. Equ. Model. 1999, 6, 1–55. [Google Scholar] [CrossRef]
- Bentler, P.M.; Bonett, D.G. Significance Tests and Goodness of Fit in the Analysis of Covariance Structures. Psychol. Bull. 1980, 88, 588–606. [Google Scholar] [CrossRef]
- Tucker, L.R.; Lewis, C. A Reliablity Coefficient for Maximum Likelihood Factor Analysis. Psychometrika 1973, 38, 421–422. [Google Scholar] [CrossRef]
- Fan, Y.; Chen, J.; Shirkey, G.; John, R.; Wu, S.R.; Park, H.; Shao, C. Applications of Structural Equation Modeling (SEM) in Ecological Studies: An Updated Review. Ecol. Process. 2016, 5, 19. [Google Scholar] [CrossRef]
- Sharma, S.; Mukherjee, S.; Kumar, A.; Dillon, W.R. A Simulation Study to Investigate the Use of Cutoff Values for Assessing Model Fit in Covariance Structure Models. J. Bus. Res. 2005, 58, 935–943. [Google Scholar] [CrossRef]
- Rakshit, S.; Mondal, S.; Islam, N.; Jasimuddin, S.; Zhang, Z. Social Media and the New Product Development during COVID-19: An Integrated Model for SMEs. Technol. Forecast. Soc. Chang. 2021, 170, 120869. [Google Scholar] [CrossRef]
- Tsai, W.H.; Wu, Y.S.; Cheng, C.S.; Kuo, M.H.; Chang, Y.T.; Hu, F.K.; Sun, C.A.; Chang, C.W.; Chan, T.C.; Chen, C.W.; et al. A Technology Acceptance Model for Deploying Masks to Combat the COVID-19 Pandemic in Taiwan (My Health Bank): Web-Based Cross-Sectional Survey Study. J. Med. Internet Res. 2021, 23, 4. [Google Scholar] [CrossRef] [PubMed]
- Cheng, S.-I. Comparisons of Competing Models between Attitudinal Loyalty and Behavioral Loyalty. Int. J. Bus. Soc. Sci. 2011, 2, 149–166. [Google Scholar]
- Baumgartner, H.; Homburg, C. Applications of Structural Equation Modeling in Marketing and Consumer Research: A Review. Int. J. Res. Mark. 1995, 13, 136–146. [Google Scholar] [CrossRef]
- Doll, W.J.; Xia, W.; Torkzadeh, G. A Confirmatory Factor Analysis of the End-User Computing Satisfaction Instrument. MIS Q. 1994, 18, 453–461. [Google Scholar] [CrossRef]
- Liu, Y.; Kim, C.Y.; Lee, E.H.; Yoo, J.W. Relationship between Sustainable Management Activities and Financial Performance: Mediating Effects of Non-Financial Performance and Moderating Effects of Institutional Environment. Sustainability 2022, 14, 1168. [Google Scholar] [CrossRef]
- Archimi, C.S.; Reynaud, E.; Yasin, H.M.; Bhatti, Z.A. How Perceived Corporate Social Responsibility Affects Employee Cynicism: The Mediating Role of Organizational Trust. J. Bus. Ethics 2018, 151, 907–921. [Google Scholar] [CrossRef]
- Podsakoff, P.M.; MacKenzie, S.B.; Lee, J.Y.; Podsakoff, N.P. Common Method Biases in Behavioral Research: A Critical Review of the Literature and Recommended Remedies. J. Appl. Psychol. 2003, 88, 879–903. [Google Scholar] [CrossRef]
- Hair, J.F.; Hult, G.T.M.; Ringle, C.M.; Sarstedt, M. A Primer on Partial Least Squares Structural Equation Modeling (PLS-SEM), 2nd ed.; SAGE Publications: Los Angeles, CA, USA, 2017; ISBN 9781483377445. [Google Scholar]
- Bernardo, A.B.I.; Mendoza, N.B. Measuring Hope during the COVID-19 Outbreak in the Philippines: Development and Validation of the State Locus-of-Hope Scale Short Form in Filipino. Curr. Psychol. 2021, 40, 5698–5707. [Google Scholar] [CrossRef]
- Sharif Nia, H.; She, L.; Rasiah, R.; Khoshnavay Fomani, F.; Kaveh, O.; Pahlevan Sharif, S.; Hosseini, L. Psychometrics of Persian Version of the Ageism Survey Among an Iranian Older Adult Population During COVID-19 Pandemic. Front. Public Heal. 2021, 9, 1–11. [Google Scholar] [CrossRef] [PubMed]
- She, L.; Ma, L.; Khoshnavay Fomani, F. The Consideration of Future Consequences Scale Among Malaysian Young Adults: A Psychometric Evaluation. Front. Psychol. 2021, 12, 770609. [Google Scholar] [CrossRef] [PubMed]
- Uslu, A.; Alagöz, G.; Güneş, E. Socio-Cultural, Economic, and Environmental Effects of Tourism from the Point of View of the Local Community. J. Tour. Serv. 2020, 11, 21. [Google Scholar] [CrossRef]
- Hancock, G.R.; Mueller, R.O. Rethinking Construct Reliability within Latent Variable Systems. In Structural Equation Modeling: Present and Future: A Festschrift in Honor of Karl Jöreskog; Cudeck, R., du Toit, S., Srbom, D., Eds.; Scientific Software International: Lincolnwood, IL, USA, 2001; pp. 195–216. ISBN 9780894980497. [Google Scholar]
- Hair, J.F.; Black, W.C.; J.Babin, B.; Anderson, R.E. Multivariate Data Analysis, 7th ed.; Prentice Hall: Hoboken, NJ, USA, 2010. [Google Scholar]
- Fornell, C.; Larcker, D.F. Evaluating Structural Equation Models with Unobservable Variables and Measurement Error. J. Mark. Res. 1981, 18, 39–50. [Google Scholar] [CrossRef]
- Wan Mat, W.R.; Kim, H.J.; Abdul Manaf, A.A.; Phang Ing, G.; Abdul Adis, A.A. Young Malaysian Consumers’ Attitude and Intention to Imitate Korean Celebrity Endorsements. Asian J. Bus. Res. 2019, 9, 1–23. [Google Scholar] [CrossRef]
- Lim, X.J.; bt Mohd Radzol, A.R.; Cheah, J.-H.; Wong, M.W. The Impact of Social Media Influencers on Purchase Intention and the Mediation Effect of Customer Attitude. Asian J. Bus. Res. 2017, 7, 19–36. [Google Scholar] [CrossRef]
- Ab Hamid, M.R.; Sami, W.; Mohmad Sidek, M.H. Discriminant Validity Assessment: Use of Fornell & Larcker Criterion versus HTMT Criterion. J. Phys. Conf. Ser. 2017, 890, 012163. [Google Scholar] [CrossRef]
- Henseler, J.; Ringle, C.M.; Sarstedt, M. A New Criterion for Assessing Discriminant Validity in Variance-Based Structural Equation Modeling. J. Acad. Mark. Sci. 2015, 43, 115–135. [Google Scholar] [CrossRef]
- Gold, A.H.; Malhotra, A.; Segars, A.H. Knowledge Management: An Organizational Capabilities Perspective. J. Manag. Inf. Syst. 2001, 18, 185–214. [Google Scholar] [CrossRef]
- Roemer, E.; Schuberth, F.; Henseler, J. HTMT2–an Improved Criterion for Assessing Discriminant Validity in Structural Equation Modeling. Ind. Manag. Data Syst. 2021, 121, 2637–2650. [Google Scholar] [CrossRef]
- Cohen, H. Statistical Power Analysis for the Behavioral Sciences, 2nd ed.; Lawrence Erlbaum Associates: Mahwah, NJ, USA, 1988; ISBN 0805802835. [Google Scholar]
- Falk, R.F.; Miller, N.B. A Primer for Soft Modeling, 1st ed.; University of Akron: Akron, OH, USA, 1992; ISBN 0962262846. [Google Scholar]
- Chin, W.W. The Partial Least Squares Approach for Structural Equation Modeling. In Modern Methods for Business Research; Marcoulides, G.A., Ed.; Lawrence Erlbaum Associates: New York, NY, USA, 1998; pp. 295–336. ISBN 0-8058-2677-7. [Google Scholar]
- Hussain, S.; Fangwei, Z.; Siddiqi, A.F.; Ali, Z.; Shabbir, M.S. Structural Equation Model for Evaluating Factors Affecting Quality of Social Infrastructure Projects. Sustainbility 2018, 10, 1415. [Google Scholar] [CrossRef]
- Hair, J.F.; Ringle, C.M.; Sarstedt, M. PLS-SEM: Indeed a Silver Bullet. J. Mark. Theory Pract. 2011, 19, 139–152. [Google Scholar] [CrossRef]
- Alhendawi, K.M.; Baharudin, A.S. The Assessment of Information System Effectiveness in E-Learning, E-Commerce and E-Government Contexts: A Critical Review of the Literature. J. Theor. Appl. Inf. Technol. 2017, 95, 4897–4912. [Google Scholar]
- Shaharuddin, N.S.; Zain, Z.M.; Ahmad, S.F.S. Financial Planning Determinants Among Working Adults During COVID 19 Pandemic. Int. J. Acad. Res. Account. Financ. Manag. Sci. 2021, 1, 285–304. [Google Scholar] [CrossRef]
- Marime, N.; Magweva, R.; Dzapasi, F.D. Demographic Determinants of Financial Literacy in the Masvingo Province of Zimbabwe. PM World J. 2020, IX, 1–18. [Google Scholar]
- GOI Rurban Cluster. Available online: https://rurban.gov.in/index.php/public_home/rurban_cluster#gsc.tab=0 (accessed on 10 February 2022).
- Simon, D. Peri-Urbanization. In The Palgrave Encyclopedia of Urban and Regional Futures; Springer International Publishing: Cham, Switzerland, 2020; pp. 1–5. ISBN 978-3-030-51812-7. [Google Scholar]
- Hui, R.; Wescoat, J.L. Visualizing Peri-Urban and Rurban Water Conditions in Pune District, Maharashtra, India. Geoforum 2019, 102, 255–266. [Google Scholar] [CrossRef]
- Singh, C.; Rahman, A. Urbanising the Rural: Reflections on India’s National Rurban Mission. Asia Pac. Policy Stud. 2018, 5, 370–377. [Google Scholar] [CrossRef]


Publisher’s Note: MDPI stays neutral with regard to jurisdictional claims in published maps and institutional affiliations. |
© 2022 by the authors. Licensee MDPI, Basel, Switzerland. This article is an open access article distributed under the terms and conditions of the Creative Commons Attribution (CC BY) license (https://creativecommons.org/licenses/by/4.0/).