
Impact of Changes in Membership on Prices of a Unified Carbon Market: Case Study of the European Union Emissions Trading System


Abstract
1. Introduction
2. Literature Review
3. Methodology and Data
3.1. Research Hypothesis
- The event of entering the EU has a positive impact on carbon prices or the event of leaving the EU has a negative impact on carbon prices, indicating that the market expects that the allocation of emission allowances is less than the country’s demand;
- The event of entering the EU has a negative impact on carbon prices or the event of leaving the EU has a positive impact on carbon prices, indicating that the market expects that the allocation of emission allowances is greater than the country’s demand;
- The event of entering or leaving EU does not have a significant impact on carbon prices, indicating that the market expects that the country’s allowances can balance supply and demand, or the country does not play an important role in the EU ETS, which cannot significantly affect the market expectation.
3.2. Methodology
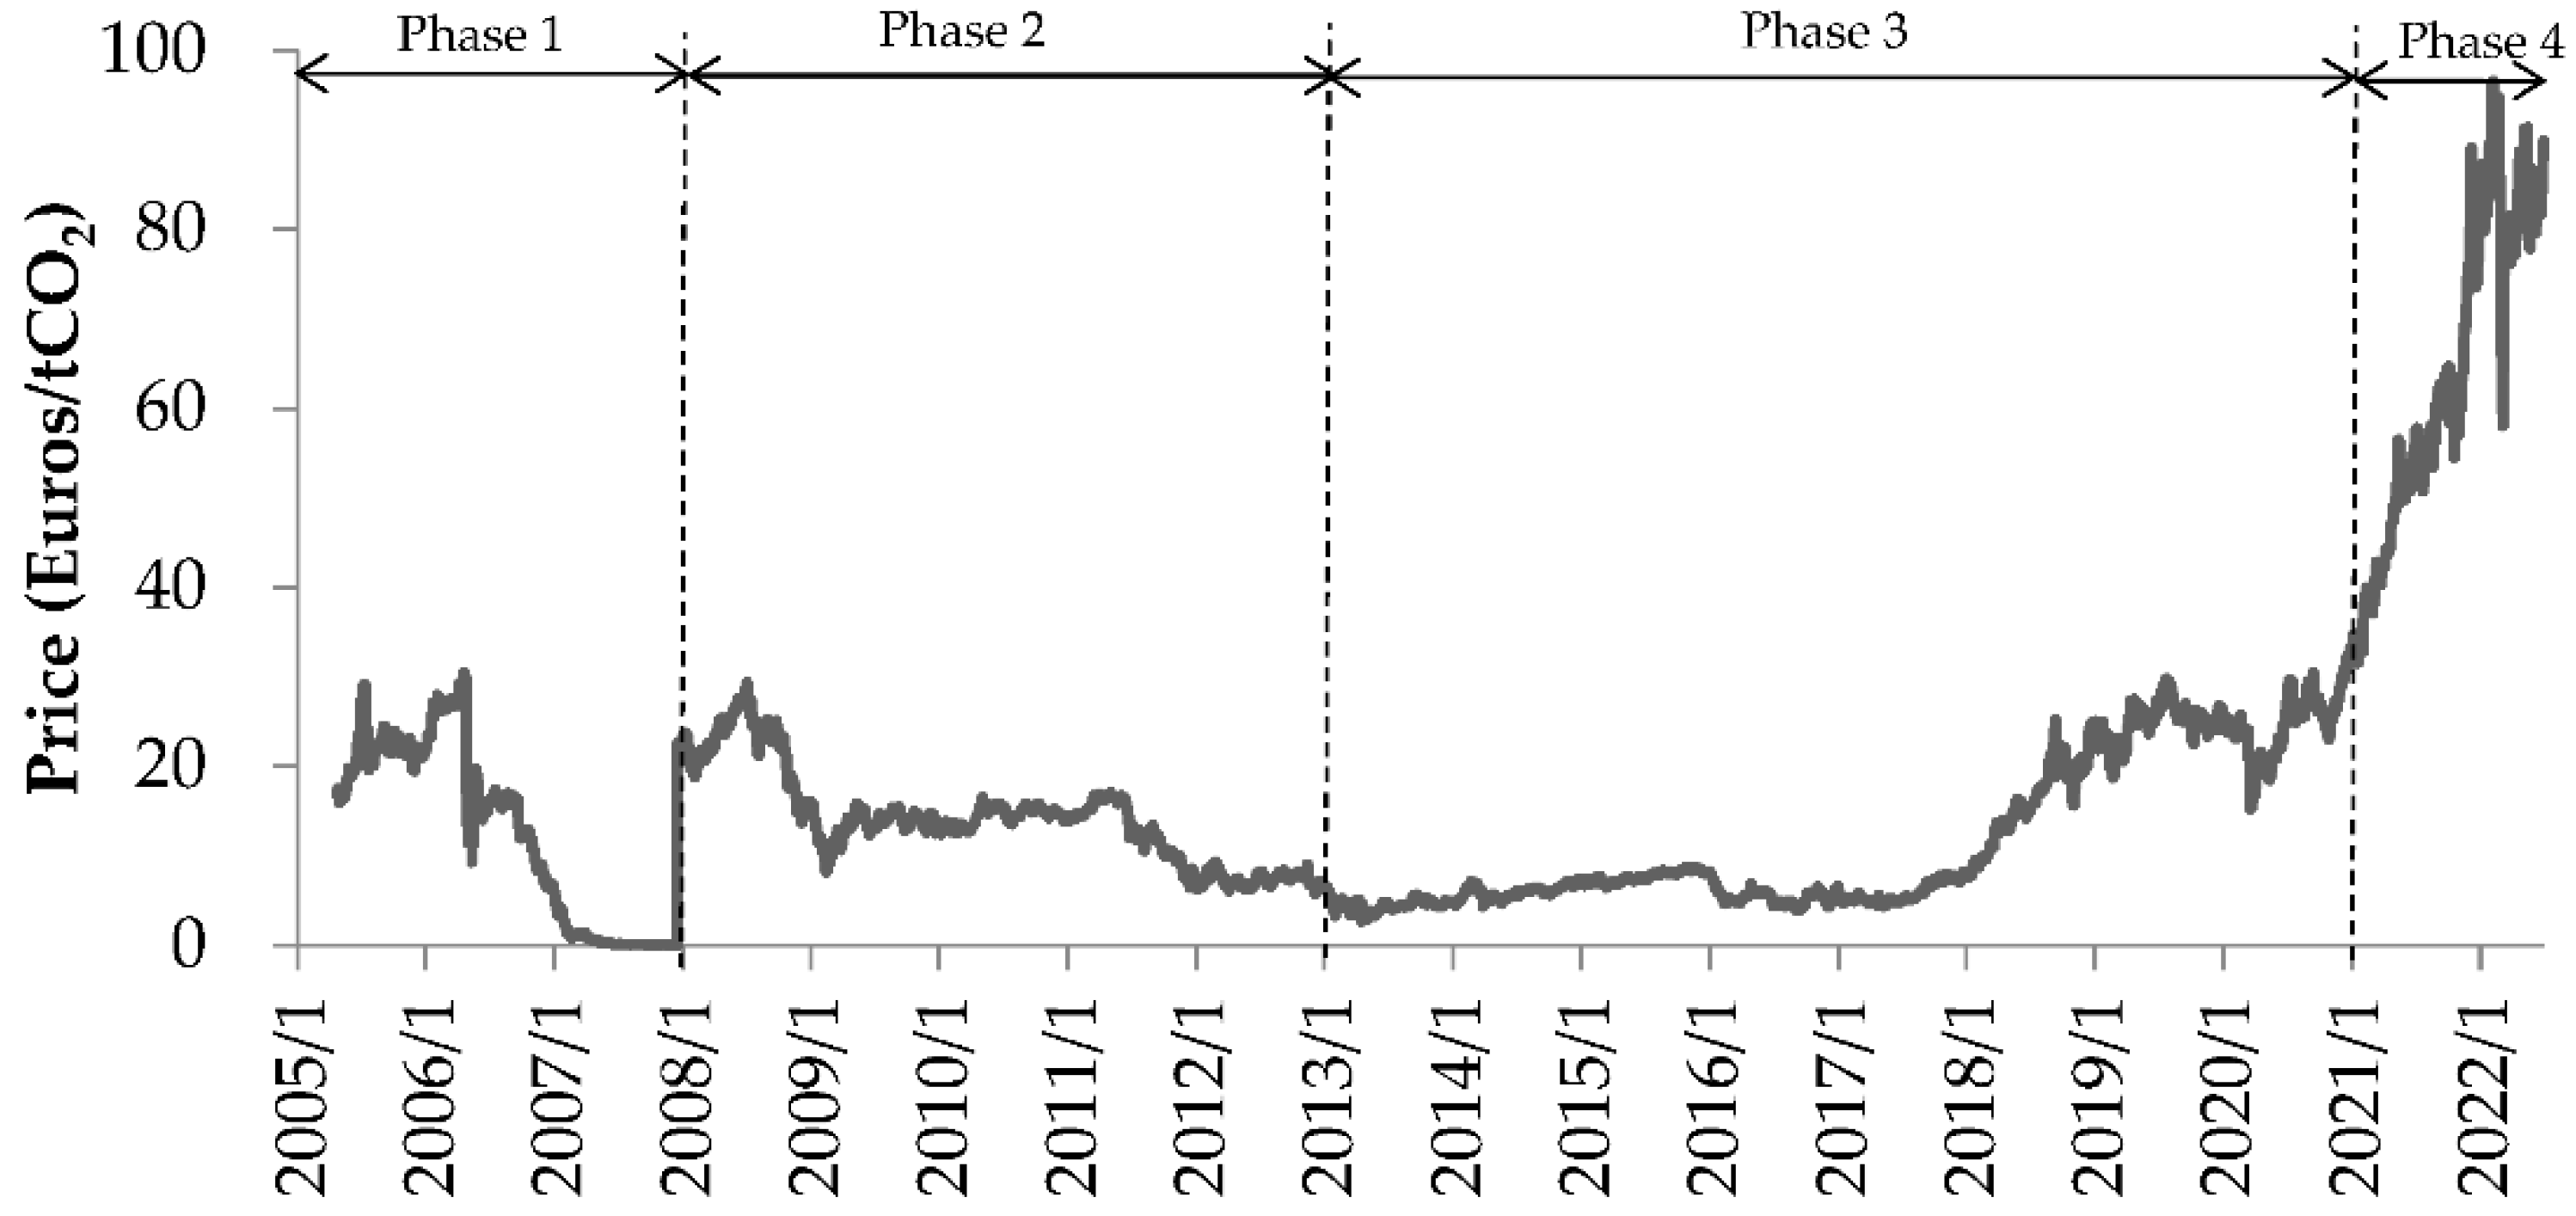
3.3. Data of EUA Prices
3.4. Event Selection
- The Stabilisation and Association Agreement (SAA) between the EU and a country was signed.
- The EU confirmed granting a country EU candidate or potential candidate status.
- The EU proposed a negotiation plan for a country to join the EU. (Since the proposal of a negotiation plan has provided the market with an expectation of opening negotiations, the proposal rather than the formal opening is selected here. If a country joined the EU ETS before the proposal of negotiation (e.g., Iceland), the event of negotiation is not selected).
- The EU agreed to end its accession negotiations with a country.
- A country formally joined the EU or EU ETS. (If a country joined the EU ETS before joining the EU (e.g., Croatia), the event of joining the EU ETS is selected.)
- The country requested that it no longer be regarded as a candidate country.
- The results of the Brexit referendum were announced.
- The European Council adopted the Withdrawal Agreement.
- The country formally left the EU and EU ETS.
4. Results
5. Further Analysis
6. Conclusions and Implications
Author Contributions
Funding
Institutional Review Board Statement
Informed Consent Statement
Data Availability Statement
Conflicts of Interest
References
- International Carbon Action Partnership. Emissions Trading Worldwide: Status Report 2022. 2022. Available online: https://icapcarbonaction.com/system/files/document/220408_icap_report_rz_web.pdf (accessed on 13 July 2022).
- European Commission. EU ETS Handbook. 2015. Available online: https://ec.europa.eu/clima/sites/clima/files/docs/ets_handbook_en.pdf (accessed on 14 February 2020).
- Lutz, B.J.; Pigorsch, U.; Rotfuß, W. Nonlinearity in cap-and-trade systems: The EUA price and its fundamentals. Energy Econ. 2013, 40, 222–232. [Google Scholar] [CrossRef]
- Koch, N.; Fuss, S.; Grosjean, G.; Edenhofer, O. Causes of the EU ETS price drop: Recession, CDM, renewable policies or a bit of everything?—New evidence. Energy Policy 2014, 73, 676–685. [Google Scholar] [CrossRef]
- Bel, G.; Joseph, S. Emission abatement: Untangling the impacts of the EU ETS and the economic crisis. Energy Econ. 2015, 49, 531–539. [Google Scholar] [CrossRef]
- Alberola, E.; Chevallier, J.; Chèze, B. Price drivers and structural breaks in European carbon prices 2005–2007. Energy Policy 2008, 36, 787–797. [Google Scholar] [CrossRef]
- Creti, A.; Jouvet, P.-A.; Mignon, V. Carbon price drivers: Phase I versus Phase II equilibrium? Energy Econ. 2012, 34, 327–334. [Google Scholar] [CrossRef]
- Byun, S.J.; Cho, H. Forecasting carbon futures volatility using GARCH models with energy volatilities. Energy Econ. 2013, 40, 207–221. [Google Scholar] [CrossRef]
- Boersen, A.; Scholtens, B. The relationship between European electricity markets and emission allowance futures prices in phase II of the EU (European Union) emission trading scheme. Energy 2014, 74, 585–594. [Google Scholar] [CrossRef]
- Balcılar, M.; Demirer, R.; Hammoudeh, S.; Nguyen, D.K. Risk spillovers across the energy and carbon markets and hedging strategies for carbon risk. Energy Econ. 2016, 54, 159–172. [Google Scholar] [CrossRef]
- Ji, Q.; Zhang, D.; Geng, J. Information linkage, dynamic spillovers in prices and volatility between the carbon and energy markets. J. Clean. Prod. 2018, 198, 972–978. [Google Scholar] [CrossRef]
- Zhu, B.; Ye, S.; Han, D.; Wang, P.; He, K.; Wei, Y.-M.; Xie, R. A multiscale analysis for carbon price drivers. Energy Econ. 2019, 78, 202–216. [Google Scholar] [CrossRef]
- Mansanet-Bataller, M.; Pardo, A. Impacts of regulatory announcements on CO2 prices. J. Energy Mark. 2009, 2, 75–107. [Google Scholar] [CrossRef]
- Lepone, A.; Rahman, R.; Yang, J.-Y. The impact of European Union Emissions Trading Scheme (EU ETS) National Allocation Plans (NAP) on carbon markets. Low Carbon Econ. 2011, 2, 71–90. [Google Scholar] [CrossRef]
- Hitzemann, S.; Uhrig-Homburg, M.; Ehrhart, K.-M. Emission permits and the announcement of realized emissions: Price impact, trading volume, and volatilities. Energy Econ. 2015, 51, 560–569. [Google Scholar] [CrossRef]
- Jia, J.-J.; Xu, J.-H.; Fan, Y. The impact of verified emissions announcements on the European Union emissions trading scheme: A bilaterally modified dummy variable modelling analysis. Appl. Energy 2016, 173, 567–577. [Google Scholar] [CrossRef]
- Guo, J.; Su, B.; Yang, G.; Feng, L.; Liu, Y.; Gu, F. How Do Verified Emissions Announcements Affect the Comoves between Trading Behaviors and Carbon Prices? Evidence from EU ETS. Sustainability 2018, 10, 3255. [Google Scholar] [CrossRef]
- Conrad, C.; Rittler, D.; Rotfuß, W. Modeling and explaining the dynamics of European Union Allowance prices at high-frequency. Energy Econ. 2012, 34, 316–326. [Google Scholar] [CrossRef]
- Chen, J.; Muckley, C.B.; Bredin, D. Is information assimilated at announcements in the European carbon market? Energy Econ. 2017, 63, 234–247. [Google Scholar] [CrossRef]
- Alberola, E.; Chevallier, J. European Carbon Prices and Banking Restrictions: Evidence from Phase I (2005–2007). Energy J. 2009, 30, 51–79. [Google Scholar] [CrossRef]
- Daskalakis, G.; Psychoyios, D.; Markellos, R.N. Modeling CO2 emission allowance prices and derivatives: Evidence from the European trading scheme. J. Bank. Financ. 2009, 33, 1230–1241. [Google Scholar] [CrossRef]
- Koch, N.; Grosjean, G.; Fuss, S.; Edenhofer, O. Politics matters: Regulatory events as catalysts for price formation under cap-and-trade. J. Environ. Econ. Manag. 2016, 78, 121–139. [Google Scholar] [CrossRef]
- Deeney, P.; Cummins, M.; Dowling, M.; Smeaton, A.F. Influences from the European Parliament on EU emissions prices. Energy Policy 2016, 88, 561–572. [Google Scholar] [CrossRef]
- Fan, Y.; Jia, J.-J.; Wang, X.; Xu, J.-H. What policy adjustments in the EU ETS truly affected the carbon prices? Energy Policy 2017, 103, 145–164. [Google Scholar] [CrossRef]
- Ye, S.; Dai, P.-F.; Nguyen, H.T.; Huynh, N.Q.A. Is the cross-correlation of EU carbon market price with policy uncertainty really being? A multiscale multifractal perspective. J. Environ. Manag. 2021, 298, 113490. [Google Scholar] [CrossRef] [PubMed]
- Dai, P.-F.; Xiong, X.; Duc Huynh, T.L.; Wang, J. The impact of economic policy uncertainties on the volatility of European carbon market. J. Commod. Mark. 2022, 26, 100208. [Google Scholar] [CrossRef]
- Dou, Y.; Li, Y.; Dong, K.; Ren, X. Dynamic linkages between economic policy uncertainty and the carbon futures market: Does Covid-19 pandemic matter? Resour. Policy 2022, 75, 102455. [Google Scholar] [CrossRef]
- Wu, X.; Yin, X.; Mei, X. Forecasting the Volatility of European Union Allowance Futures with Climate Policy Uncertainty Using the EGARCH-MIDAS Model. Sustainability 2022, 14, 4306. [Google Scholar] [CrossRef]
- Song, Y.; Liang, D.; Liu, T.; Song, X. How China’s current carbon trading policy affects carbon price? An investigation of the Shanghai Emission Trading Scheme pilot. J. Clean. Prod. 2018, 181, 374–384. [Google Scholar] [CrossRef]
- Song, Y.; Liu, T.; Liang, D.; Li, Y.; Song, X. A Fuzzy Stochastic Model for Carbon Price Prediction Under the Effect of Demand-related Policy in China’s Carbon Market. Ecol. Econ. 2019, 157, 253–265. [Google Scholar] [CrossRef]
- Song, Y.; Liu, T.; Ye, B.; Zhu, Y.; Li, Y.; Song, X. Improving the liquidity of China’s carbon market: Insight from the effect of carbon price transmission under the policy release. J. Clean. Prod. 2019, 239, 118049. [Google Scholar] [CrossRef]
- Brown, S.J.; Warner, J.B. Measuring security price performance. J. Financ. Econ. 1980, 8, 205–258. [Google Scholar] [CrossRef]
- Brown, S.J.; Warner, J.B. Using daily stock returns: The case of event studies. J. Financ. Econ. 1985, 14, 3–31. [Google Scholar] [CrossRef]
- Walker, N. Brexit Timeline: Events Leading to the UK’s Exit from the European Union. House of Commons Library Briefing Paper Number 7960. 2020. Available online: https://researchbriefings.files.parliament.uk/documents/CBP-7960/CBP-7960.pdf (accessed on 13 July 2022).
- de Aguiar, T.R.S.; Bebbington, J. Disclosure on climate change: Analysing the UK ETS effects. Account. Forum 2014, 38, 227–240. [Google Scholar] [CrossRef]
- Lorenzoni, I.; Benson, D. Radical institutional change in environmental governance: Explaining the origins of the UK Climate Change Act 2008 through discursive and streams perspectives. Glob. Environ. Chang. 2014, 29, 10–21. [Google Scholar] [CrossRef]
- Ellerman, A.D.; Buchner, B.K. The European Union Emissions Trading Scheme: Origins, Allocation, and Early Results. Rev. Environ. Econ. Policy 2007, 1, 66–87. [Google Scholar] [CrossRef]
- Carbon Trust. EU ETS Phase II Allocation: Implications and Lessons. 2007. Available online: https://prod-drupal-files.storage.googleapis.com/documents/resource/public/EU%20Emissions%20Trading%20Scheme%20%28EU%20ETS%29%20-%20EU%20ETS%20Phase%20II%20Allocation_Implications%20And%20Lessons%20-%20REPORT.pdf (accessed on 13 July 2022).


| Sample Period | Mean | Std. Dev. | Maximum | Minimum | Skewness | Kurtosis | Observations | |
|---|---|---|---|---|---|---|---|---|
| Phase 1 | 22 April 2005–31 December 2007 | −0.0109 | 0.1072 | 1.0986 | −1.3863 | −3.1656 | 73.3346 | 684 |
| Phases 2, 3 and 4 | 2 January 2008–30 June 2022 | 0.0004 | 0.0316 | 0.2405 | −0.4347 | −0.7815 | 14.4729 | 3734 |
| EU ETS Phase | No. | Date | Event | Type |
|---|---|---|---|---|
| Phase 1 (2005–2007) | 1 | 16 December 2005 | The European Council decided to grant candidate country status to the former Yugoslav Republic of Macedonia. (Macedonia was renamed as the "the Republic of North Macedonia" in February 2019. Since the events related to this country in the paper were before its re-name, it is still called "the former Yugoslav Republic of Macedonia" or “Macedonia” in the paper.) | Entry |
| 2 | 12 June 2006 | The SAA and Interim Agreement between the EU and Albania were signed. | Entry | |
| 3 | 1 January 2007 | Romania and Bulgaria formally joined the EU. | Entry | |
| 4 | 15 October 2007 | The SAA between the EU and Montenegro was signed. | Entry | |
| Phase 2 (2008–2012) | 5 | 29 April 2008 | The SAA and Interim Agreement between the EU and Serbia were signed. | Entry |
| 6 | 16 June 2008 | The SAA and Interim Agreement between the EU and Bosnia and Herzegovina were signed. | Entry | |
| 7 | 17 December 2010 | The European Council confirmed Montenegro as a candidate country. | Entry | |
| 8 | 10 June 2011 | The European Commission proposed to the EU Council of Ministers to close the last four chapters in the accession negotiations with Croatia. (The European Commission made a recommendation before the decision of the European Council, which is also included in events, considering that the incident may also affect market expectations.) | Entry | |
| 9 | 24 June 2011 | The European Council agreed that the accession negotiations with Croatia should be concluded by the end of June 2011, paving the way for the country to become the 28th EU member in 2013. | Entry | |
| 10 | 9 December 2011 | The European Council launched the accession process with Montenegro in a view to open negotiations in June 2012. | Entry | |
| 11 | 1 March 2012 | The European Council confirmed Serbia as a candidate country. | Entry | |
| Phase 3 (2013–2020) | 12 | 1 January 2013 | Croatia joined the EU ETS. | Entry |
| 13 | 28 June 2013 | The European Council agreed to open accession negotiations with Serbia. | Entry | |
| 14 | 27 June 2014 | The European Council granted candidate status to Albania. | Entry | |
| 15 | 25 July 2014 | The SAA between the EU and Kosovo was initialed. (According to the official website of the EU (see https://europa.eu), this designation is without prejudice to positions on status, and is in line with UNSCR 1244/1999 and the ICJ Opinion on the Kosovo declaration of independence. The paper holds no position on the status of Kosovo.) | Entry | |
| 16 | 12 March 2015 | Iceland requested that it no longer be regarded as a candidate country. | Exit | |
| 17 | 24 June 2016 | The UK held a referendum on its membership of the EU, with the majority of voters choosing to leave the EU (51.9% of the vote versus 48.1% voting to remain). | Exit | |
| 18 | 26 June 2018 | The European Council agreed to set out the path towards opening accession negotiations with the former Yugoslav Republic of Macedonia and Albania in June 2019. | Entry | |
| 19 | 25 November 2018 | At a special meeting of the European Council, EU27 leaders endorsed the Withdrawal Agreement and approved the political declaration on future EU–UK relations. | Exit | |
| 20 | 31 January 2020 | The UK formally left the EU. | Exit | |
| Phase 4 (2021–2030) | 21 | 1 January 2021 | The UK formally left the EU ETS. | Exit |
| 22 | 23 June 2022 | Ukraine and Moldova were granted candidate status by unanimous agreement between the leaders of all 27 EU member states. Georgia was identified as a potential candidate. | Entry |
| Event Window | [−5, +5] | [0, +5] | [−5, +5] | [0, +5] | [−5, +5] | [0, +5] | [−5, +5] | [0, +5] |
|---|---|---|---|---|---|---|---|---|
| Event 1 (16 December 2005) | Event 2 (12 June 2006) | Event 3 (1 January 2007) | Event 4 (15 October 2007) | |||||
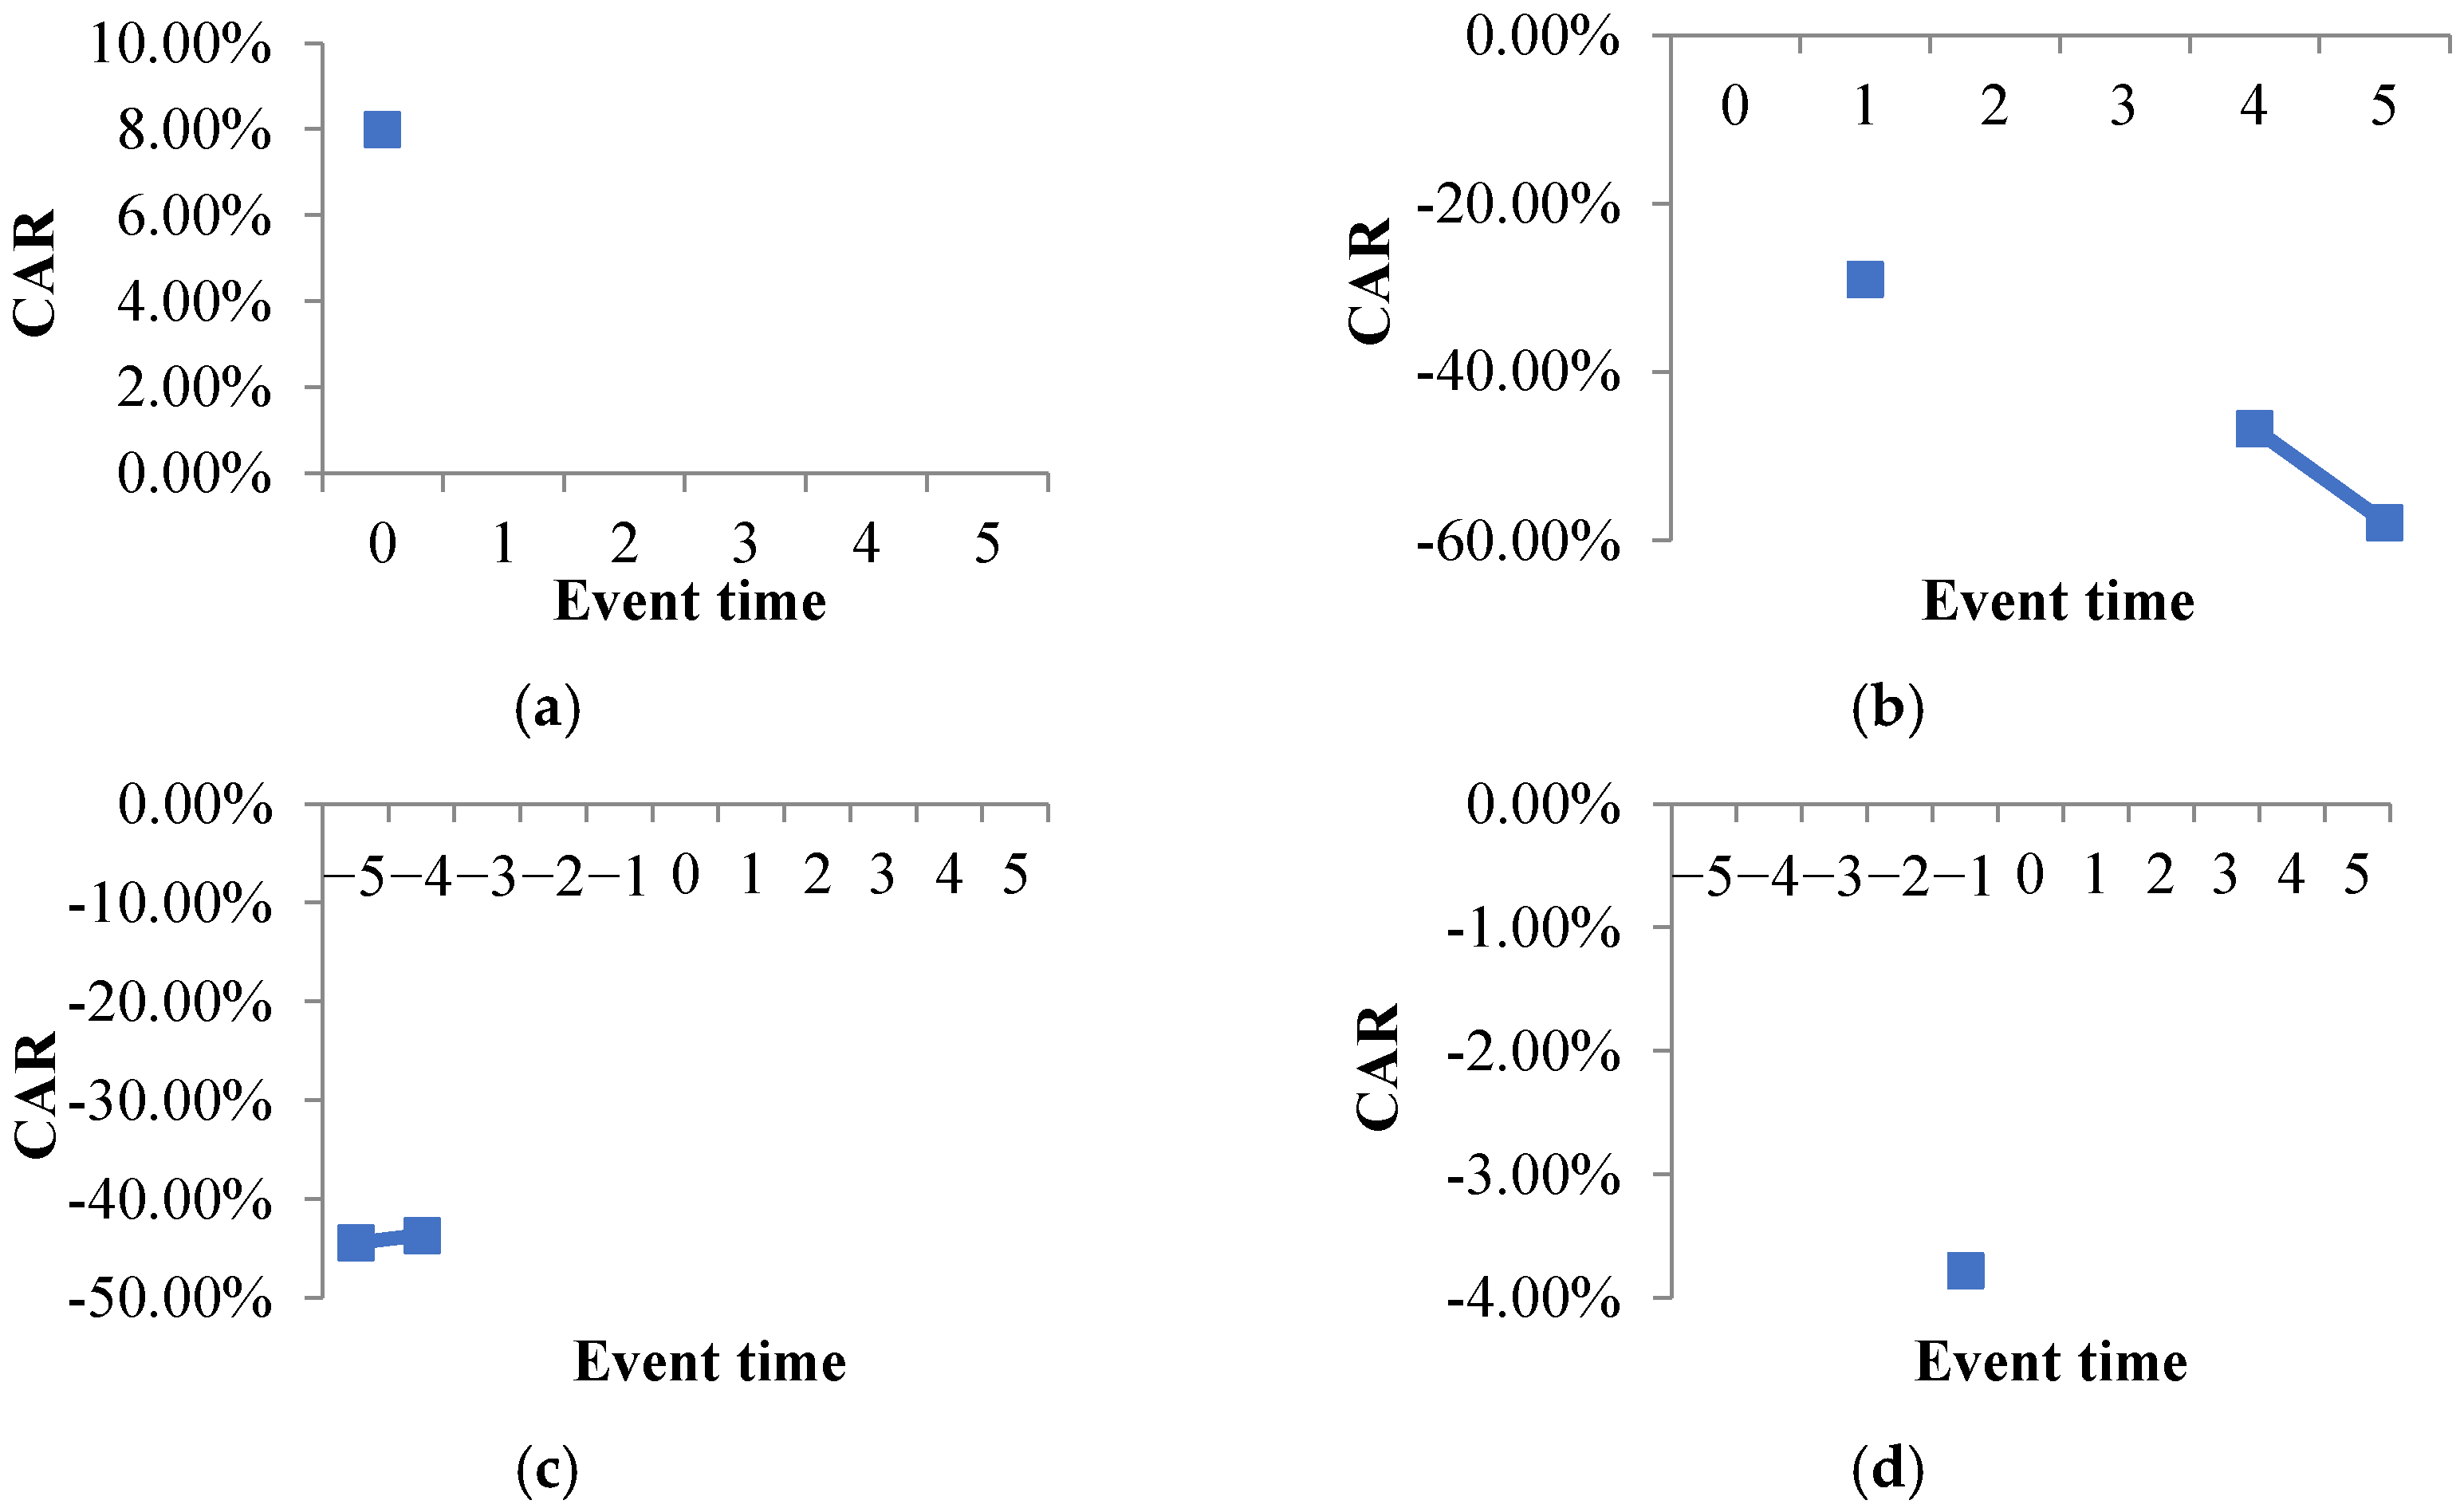
| CAR-5 | −1.14 | −1.4 | 3.92 | −44.39 *** | ||||
| CAR-4 | 1.29 | −2.21 | 7.04 | −43.59 ** | ||||
| CAR-3 | 2.98 | −6 | 4.32 | −42.79 * | ||||
| CAR-2 | 1.64 | −12.13 * | 5.26 | −41.98 | ||||
| CAR-1 | 1.92 | −11.36 | 4.69 | −41.18 | ||||
| CAR0 | 1.04 | −0.88 | −3.36 | 8.00 *** | −10.8 | −15.49 * | −40.37 | 0.8 |
| CAR+1 | 0.39 | −1.54 | −3.59 | 7.77 * | −24.24 | −28.93 ** | −39.57 | 1.61 |
| CAR+2 | 2.56 | 0.63 | −3.16 | 8.2 | −23.3 | −27.99 * | −38.77 | 2.41 |
| CAR+3 | 2.38 | 0.45 | −2.73 | 8.63 | −23.4 | −28.09 * | −37.96 | 3.22 |
| CAR+4 | 1.73 | −0.19 | −0.62 | 10.75 | −41.95 | −46.64 ** | −37.16 | 4.02 |
| CAR+5 | 0.37 | −1.56 | 2.13 | 13.50 * | −53.11 * | −57.80 *** | −36.36 | 4.82 |
| Event 5 (29 April 2008) | Event 6 (16 June 2008) | Event 7 (17 December 2010) | Event 8 (10 June 2011) | |||||
| CAR-5 | 0.06 | −0.54 | 0.49 | 0.38 | ||||
| CAR-4 | −1.66 | −1.96 * | 0.16 | −0.52 | ||||
| CAR-3 | −4.01 | −1.88 | −0.24 | −0.8 | ||||
| CAR-2 | −3.45 | −2.83 * | −1 | −1.71 | ||||
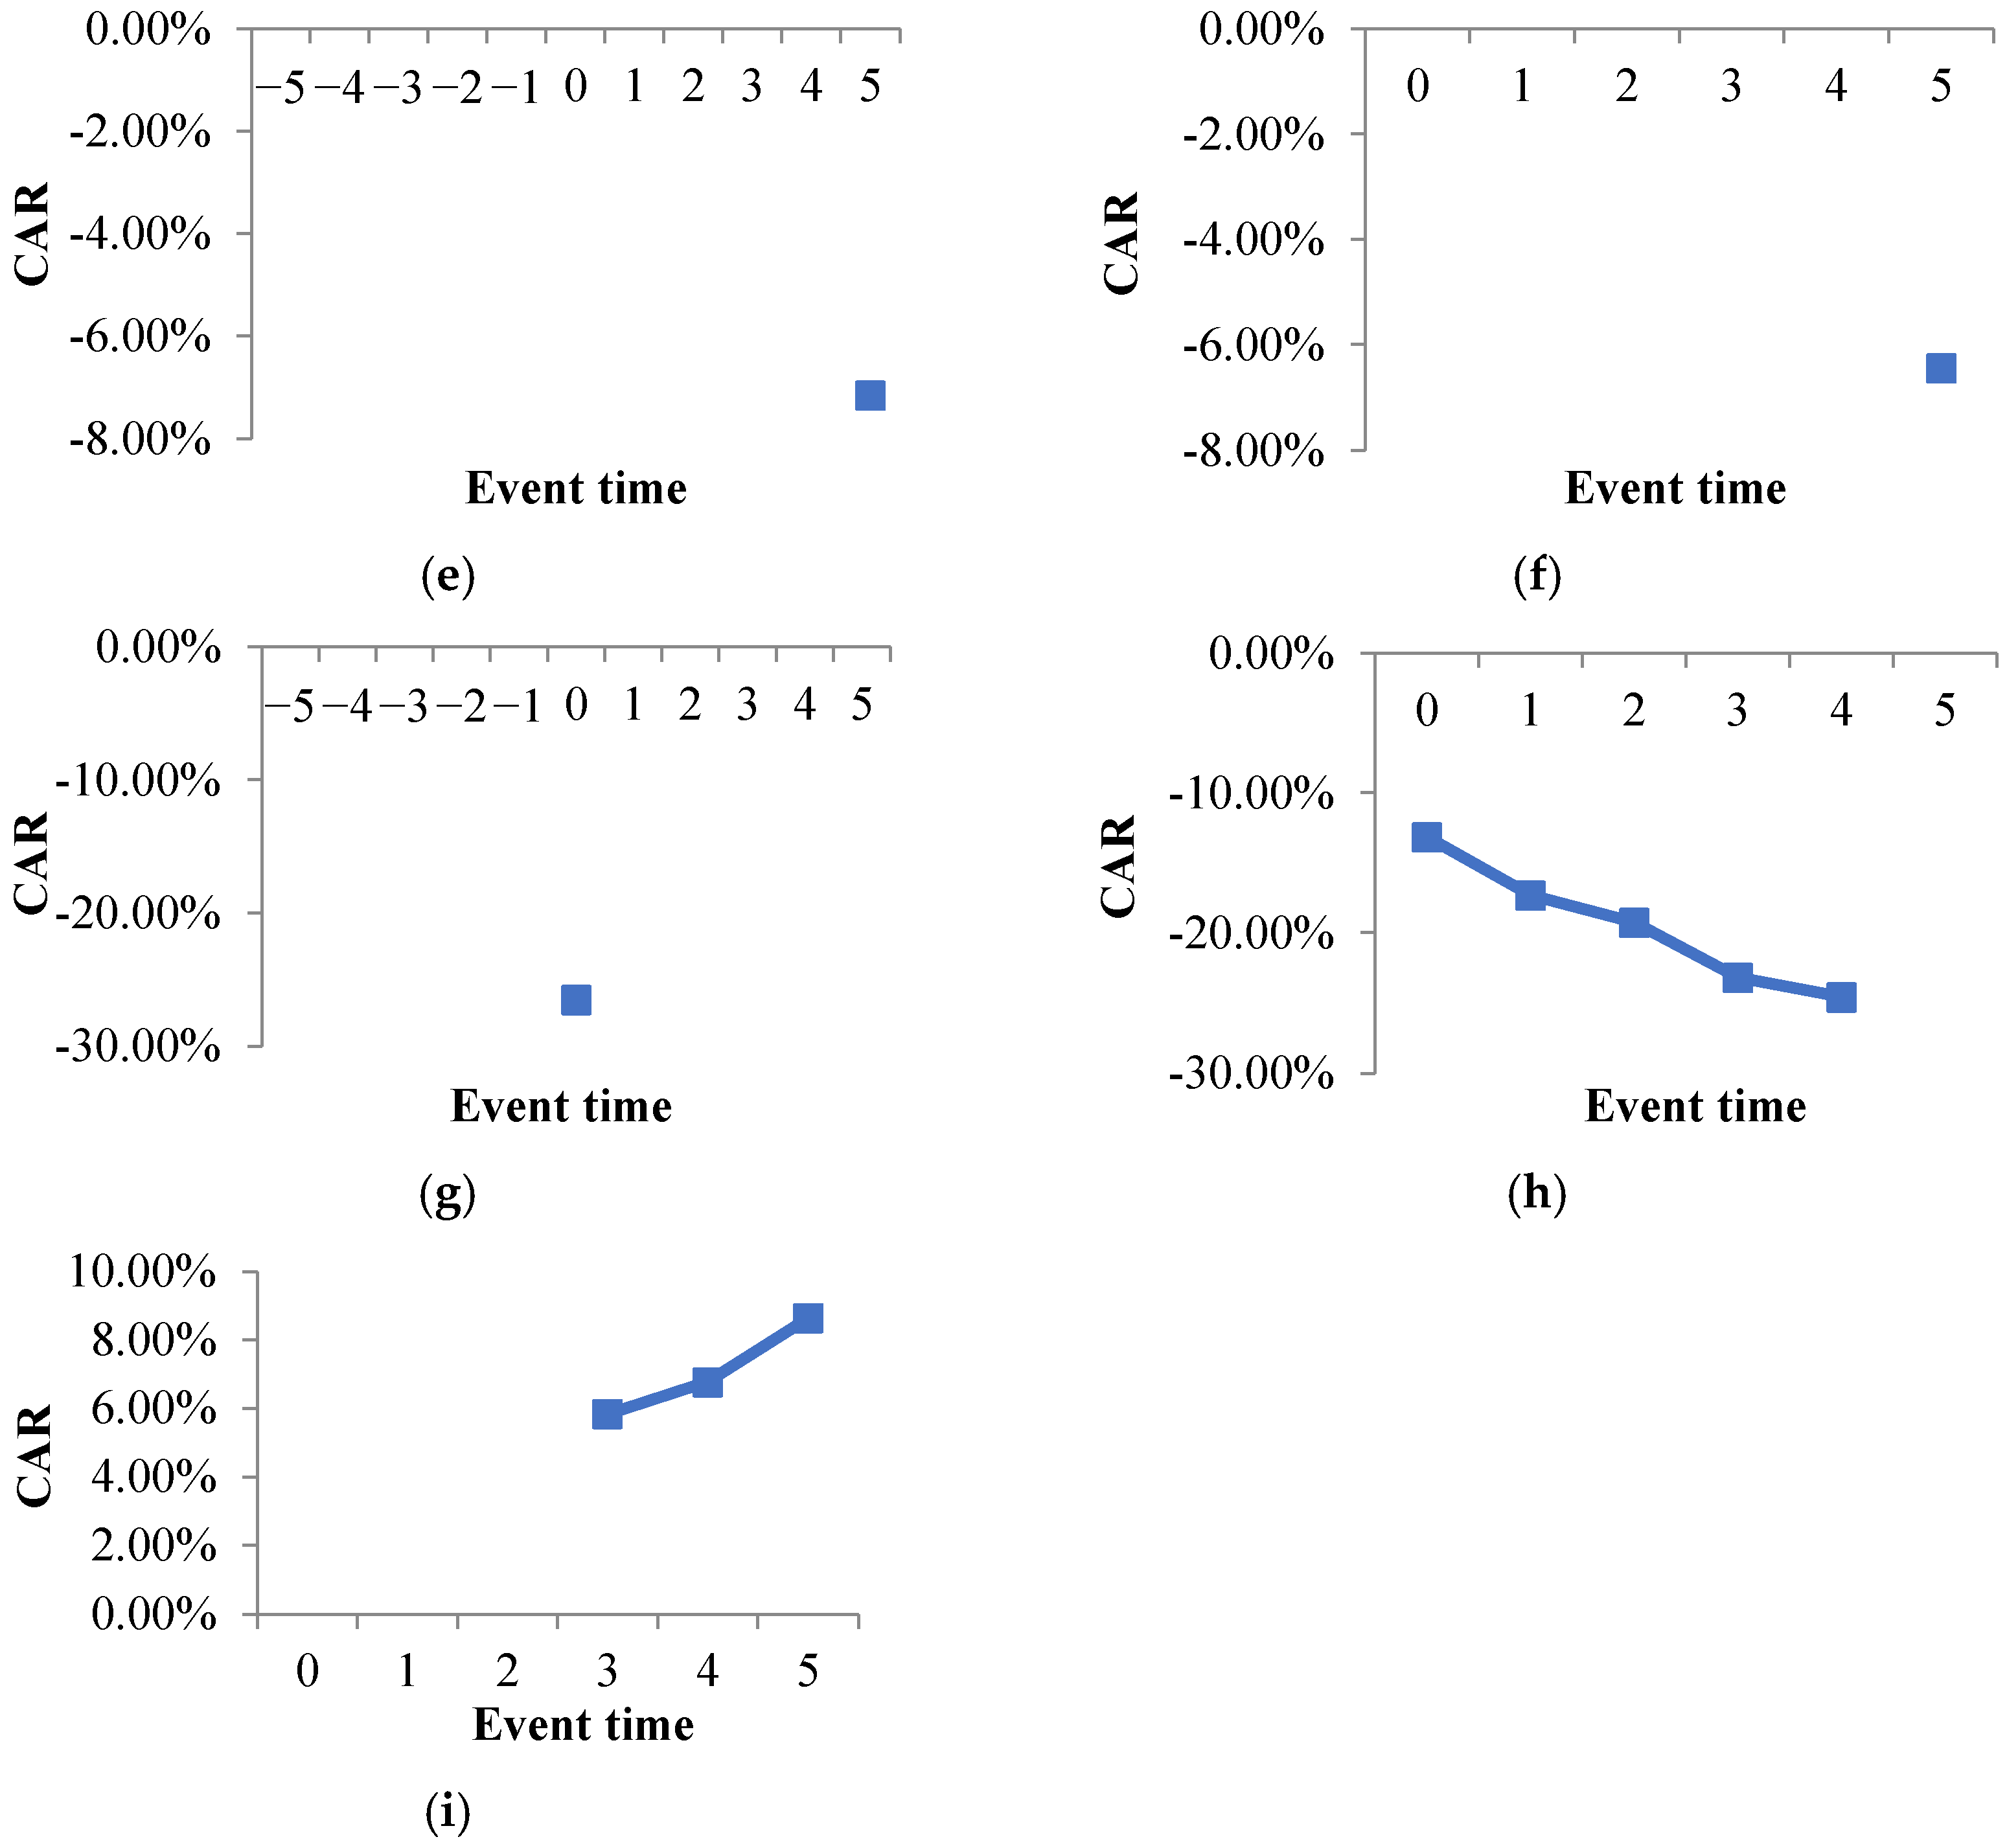
| CAR-1 | −4.26 | −3.77 ** | −1.48 | −0.71 | ||||
| CAR0 | −6.44 | −2.17 | −3.65 * | 0.12 | −3.38 | −1.9 | −0.82 | −0.11 |
| CAR+1 | −8.1 | −3.83 | −3.61 * | 0.17 | −3.88 | −2.4 | −0.68 | 0.03 |
| CAR+2 | −9.82 * | −5.55 | −3.02 | 0.76 | −3.37 | −1.89 | −1.89 | −1.18 |
| CAR+3 | −6.28 | −2.01 | −2.87 | 0.91 | −2.29 | −0.81 | −3.36 | −2.65 |
| CAR+4 | −3.39 | 0.87 | −4.06 | −0.29 | −3.93 | −2.45 | −4.41 | −3.7 |
| CAR+5 | −4.88 | −0.62 | −3.12 | 0.66 | −3.78 | −2.3 | −7.15 ** | −6.44 ** |
| Event 9 (24 June 2011) | Event 10 (9 December 2011) | Event 11 (1 March 2012) | Event 12 (1 January 2013) | |||||
| CAR-5 | −2.6 | −0.71 | −3.66 | −0.96 | ||||
| CAR-4 | −5 | −6.77 | 2.62 | −0.78 | ||||
| CAR-3 | −8.08 | −5.95 | 3.47 | −1.75 | ||||
| CAR-2 | −8.05 | −6.78 | −1.97 | −6.66 | ||||
| CAR-1 | −18.01 | −0.3 | −7.46 | −7.25 | ||||
| CAR0 | −26.48 ** | −8.47 | 2.97 | 3.27 | −3.94 | 3.52 | −8.31 | −1.06 |
| CAR+1 | −20.83 | −2.82 | −0.25 | 0.05 | −2 | 5.46 | −10.83 | −3.58 |
| CAR+2 | −16.43 | 1.57 | −6.57 | −6.27 | −4.53 | 2.93 | −11.62 | −4.37 |
| CAR+3 | −20.09 | −2.08 | −14.49 | −14.19 | −7.84 | −0.38 | −6.35 | 0.9 |
| CAR+4 | −15.94 | 2.06 | −8.96 | −8.66 | −7.37 | 0.09 | −9.15 | −1.9 |
| CAR+5 | −17.74 | 0.27 | −8.58 | −8.28 | −9.3 | −1.84 | −13.03 | −5.78 |
| Event 13 (28 June 2013) | Event 14 (27 June 2014) | Event 15 (25 July 2014) | Event 16 (12 March 2015) | |||||
| CAR-5 | −1.43 | 1.68 | −2.79 | −3.99 | ||||
| CAR-4 | −7.87 | 3.84 | −2.1 | −3.32 | ||||
| CAR-3 | −4.32 | 2.68 | −0.6 | −5.16 | ||||
| CAR-2 | −1.36 | 1.87 | −0.91 | −3.16 | ||||
| CAR-1 | −1.41 | 1.41 | −3.19 | −4.11 | ||||
| CAR0 | −6.82 | −5.41 | 2.17 | 0.76 | −2.18 | 1.01 | −9.49 | −5.38 * |
| CAR+1 | −6.39 | −4.98 | 2.75 | 1.34 | −1.51 | 1.68 | −8.78 | −4.67 |
| CAR+2 | −5.49 | −4.08 | 5.84 | 4.43 | −4.28 | −1.09 | −8.38 | −4.28 |
| CAR+3 | 3.2 | 4.61 | 6.55 | 5.14 | −3.1 | 0.09 | −4.82 | −0.71 |
| CAR+4 | −0.13 | 1.28 | 4.93 | 3.52 | −2.11 | 1.08 | −4.73 | −0.63 |
| CAR+5 | −6.34 | −4.93 | −1.2 | −2.61 | −1.29 | 1.89 | −5.85 | −1.74 |
| Event 17 (24 June 2016) | Event 18 (26 June 2018) | Event 19 (25 November 2018) | Event 20 (31 January 2020) | |||||
| CAR-5 | −0.96 | −2.74 * | −1.04 | −1.31 | ||||
| CAR-4 | 1.92 | −1.16 | 1.63 | −0.5 | ||||
| CAR-3 | −3.61 | 0.72 | 6.7 | −0.21 | ||||
| CAR-2 | −1.55 | 2.56 | 8.68 | −2.94 | ||||
| CAR-1 | −2.51 | 1.66 | 5.14 | −4.08 | ||||
| CAR0 | −15.64 | −13.13 ** | 1.43 | −0.24 | 3.15 | −1.99 | −3.41 | 0.67 |
| CAR+1 | −19.81 | −17.30 ** | 2.65 | 0.98 | 1.89 | −3.25 | −6.22 | −2.14 |
| CAR+2 | −21.76 | −19.25 ** | 0.75 | −0.91 | 0.2 | −4.93 | −5.58 | −1.5 |
| CAR+3 | −25.71 * | −23.20 ** | 0.45 | −1.21 | 3.83 | −1.31 | −3.84 | 0.24 |
| CAR+4 | −27.08 * | −24.57 ** | 0.75 | −0.91 | 6.1 | 0.97 | −4.73 | −0.65 |
| CAR+5 | −24.03 | −21.52 | 0.71 | −0.95 | 6.64 | 1.51 | −5.76 | −1.68 |
| Event 21 (1 January 2021) | Event 22 (23 June 2022) | |||||||
| CAR-5 | 0.52 | −3.97 * | ||||||
| CAR-4 | 4.03 | −4.87 | ||||||
| CAR-3 | 2.44 | −3.1 | ||||||
| CAR-2 | −0.41 | −2.39 | ||||||
| CAR-1 | 0.88 | −5.98 | ||||||
| CAR0 | 3.55 | 2.67 | −3.43 | 2.55 * | ||||
| CAR+1 | 1.06 | 0.18 | −4.43 | 1.55 | ||||
| CAR+2 | 2.76 | 1.88 | −2.66 | 3.32 | ||||
| CAR+3 | 5.75 | 4.88 | −0.14 | 5.84 ** | ||||
| CAR+4 | 5.89 | 5.01 | 0.79 | 6.77 ** | ||||
| CAR+5 | 4.47 | 3.59 | 2.66 | 8.64 *** | ||||
| Variable | CAR11 | CAR6 | ||||
|---|---|---|---|---|---|---|
| Constant | −12.8655 ** | 23.1454 | 23.0694 | −5.4173 | 57.2720 * | 57.2438 * |
| (−2.9030) | (0.7638) | (0.7607) | (−1.1557) | (2.0769) | (2.0071) | |
| NAP_NIM | 8.6355 | 8.6884 | 2.9413 | 3.2238 | ||
| (1.0893) | (0.9908) | (0.3508) | (0.3909) | |||
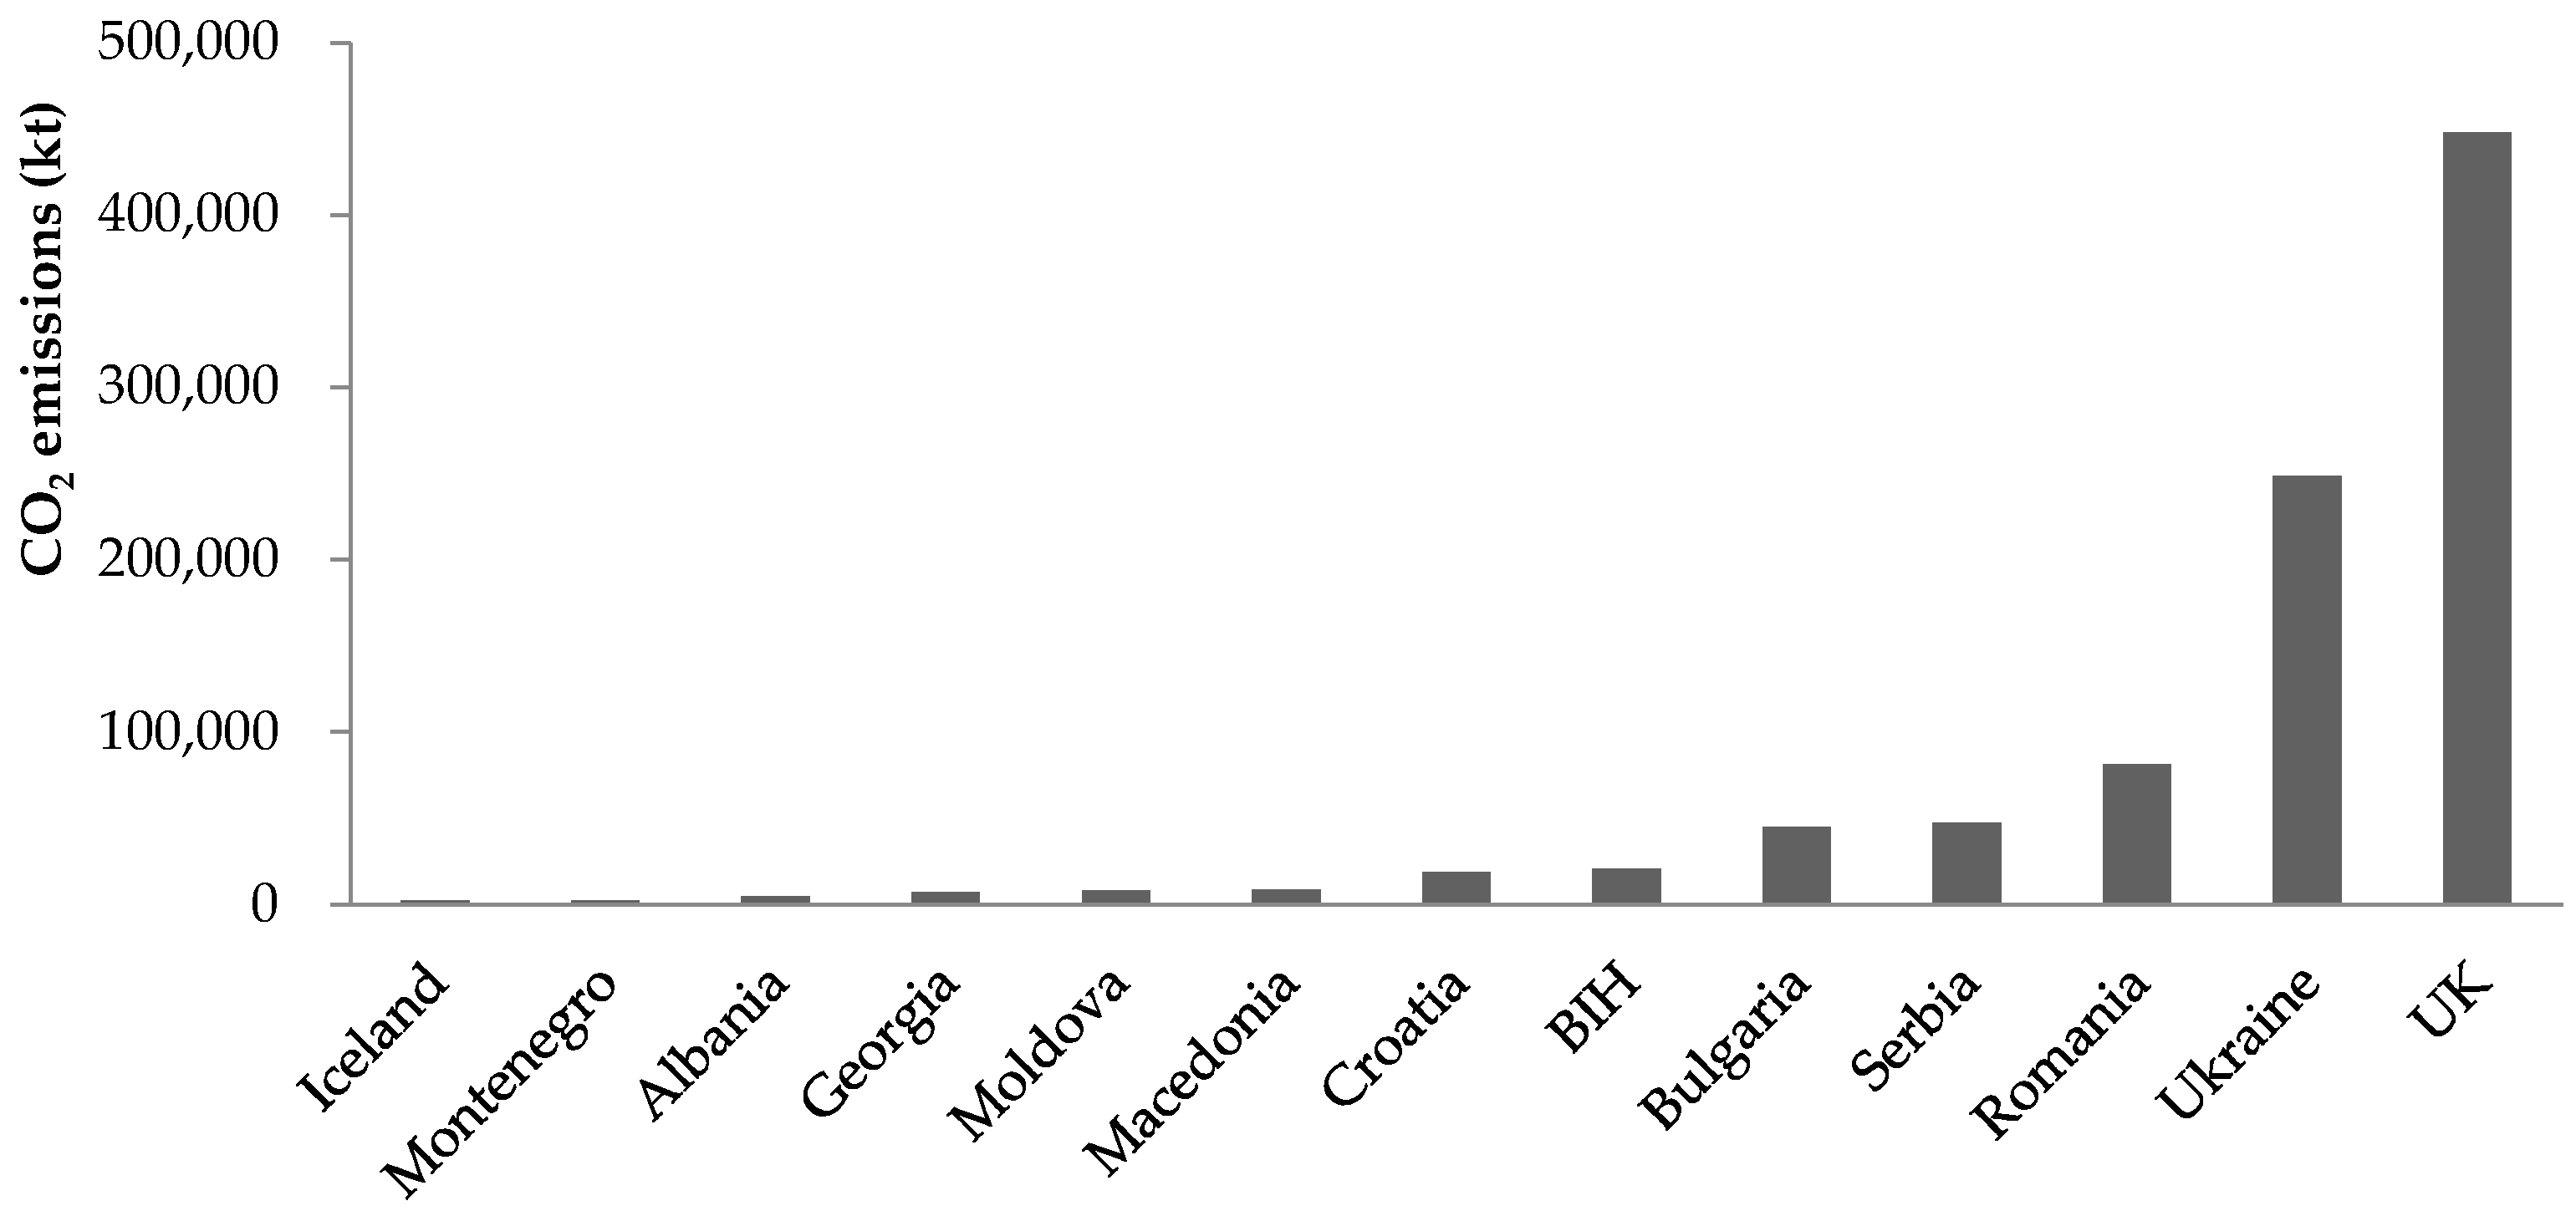
| Emission | −3.5794 | −3.8160 | −6.5663 ** | −6.6541 ** | ||
| (−1.1280) | (−1.1983) | (−2.2740) | (−2.2218) | |||
Publisher’s Note: MDPI stays neutral with regard to jurisdictional claims in published maps and institutional affiliations. |
© 2022 by the authors. Licensee MDPI, Basel, Switzerland. This article is an open access article distributed under the terms and conditions of the Creative Commons Attribution (CC BY) license (https://creativecommons.org/licenses/by/4.0/).
Share and Cite
Xu, Y.; Zhai, D. Impact of Changes in Membership on Prices of a Unified Carbon Market: Case Study of the European Union Emissions Trading System. Sustainability 2022, 14, 13806. https://doi.org/10.3390/su142113806
Xu Y, Zhai D. Impact of Changes in Membership on Prices of a Unified Carbon Market: Case Study of the European Union Emissions Trading System. Sustainability. 2022; 14(21):13806. https://doi.org/10.3390/su142113806
Chicago/Turabian StyleXu, Yue, and Dayu Zhai. 2022. "Impact of Changes in Membership on Prices of a Unified Carbon Market: Case Study of the European Union Emissions Trading System" Sustainability 14, no. 21: 13806. https://doi.org/10.3390/su142113806
APA StyleXu, Y., & Zhai, D. (2022). Impact of Changes in Membership on Prices of a Unified Carbon Market: Case Study of the European Union Emissions Trading System. Sustainability, 14(21), 13806. https://doi.org/10.3390/su142113806