Article

Converting Offshore Oil and Gas Infrastructures into Renewable Energy Generation Plants: An Economic and Technical Analysis of the Decommissioning Delay in the Brazilian Case

1
Graduate Program in Maritime Studies, Brazilian Naval War College, Rio de Janeiro 22290-240, Brazil
2
Ocean Engineering Department, Federal University of Rio de Janeiro, Rio de Janeiro 21941-914, Brazil
3
Civil Engineering Department, Federal University of Rio de Janeiro, Rio de Janeiro 21941-907, Brazil
*
Author to whom correspondence should be addressed.
Sustainability 2022, 14(21), 13783; https://doi.org/10.3390/su142113783
Submission received: 1 August 2022 / Revised: 14 October 2022 / Accepted: 20 October 2022 / Published: 24 October 2022
(This article belongs to the Special Issue Advanced Renewable Energy for Sustainability)

Abstract

:
The offshore harnessing of oil and gas resources is made possible by massive infrastructures installed at sea. At the end-of-life stage, in the absence of new uses for offshore installations, decommissioning proceedings usually take place, requiring the removal and final disposal of all materials. In Brazilian waters, decommissioning is hampered by high costs. The offshore wind-power sector has arisen as a new clean power source, in line with worldwide de-carbonization initiatives. In this context, we propose an innovative approach suggesting offshore wind power projects as an alternative to the removal and final disposal of infrastructures, a potential solution to Brazilian offshore decommissioning. In this article we report on the assessment of structures at the end of their lifecycle along with decommissioning cost estimation. Then, we explore wind turbine installation viability along the Brazilian coast and estimate the levelized cost of energy for each wind turbine. Finally, the results allow us to conduct a critical analysis of customary decommissioning versus the repurposing of infrastructures as offshore wind power project sites in two scenarios involving site repurposing. Our main results indicate that the CapEx discount rate of wind power projects offsetting decommissioning is considerable, as are the benefits of delaying decommissioning in terms of reduced carbon emissions and the social effects of increased local employment rates, through the repurposing of offshore oil and gas infrastructures.

1. Introduction

Since the 1960s, oil and gas (O&G) industrial activities have been expanding along the Brazilian coast, demanding the installation of heavy infrastructure, including fixed rigs, pipes, subsea cables, and modules on the seabed to allow hydrocarbons (compounds formed by hydrogen and carbon atoms only; they are the main constituents of oil (and natural gas), whose molecules have thirty or more carbons [1]) to be exploited [2], a process capitalized upon by profit-driven investors and oil companies. In the following decades, what used to be small marine facilities evolved towards large projects in deep and ultra-deep waters. Thus, decommissioning can be deemed as the end-of-life phase of the lifecycle of a project [3], and more precisely, in the offshore O&G field, the plugging and abandonment of wells; the removal of all pipes, subsea cables, and modules; the removal of oil rigs and pedestals; the clean-up of the area; and the final disposal of all materials from these structures [4]. Nowadays, more than half a century after the first oil infrastructure was installed at sea in Brazilian waters, there are several offshore installations reaching the end of their operational life, some of which are already unmanned. This context, combined with Brazilian and international regulations, leads to the need for the decommissioning of idle installations at sea [4], which contrasts with a landscape where, despite the effervescent local debate on the subject, the removal of these structures does not actually occur, causing the number of unused installations at sea to grow [5]. The main obstacle to the removal of installations at sea is the high cost involved, as well as some technical and environmental factors, such as marine-, and ocean-life-related factors. The impacts on life represent an important subject that requires particular attention in potential future research.
Traditionally, decommissioning occurs by removing and recycling the structures, returning the environment to its natural state; however, there are alternatives, such as conversion to a new purpose, especially to the offshore wind energy sector.
The electric energy generated from hydrocarbon sources is forecasted to decline by 2050 worldwide [6] and the further development of renewable energy sources, such as wind, ocean renewable energy, and concentrated solar power, is expected. According to the International Renewable Energy Agency, renewable energy production is forecasted to be dominated by solar and wind power plants by 2050 in the electricity generation sector [6].
About 0.7% of the energy reaching the Earth’s surface from the Sun is converted into wind energy (the total power supplied by the Sun to the Earth is estimated to be 1.8 × 10¹⁷ W, of which 1.3 × 10¹⁵ W is converted to wind energy available on the surface of the Earth [7]), whose kinetic energy can be converted to electricity by turbines without emissions [7]. Despite the current efforts to reduce GHG (green house gas) emissions, to increase decarbonization initiatives, and to develop the decommissioning of offshore O&G structures, hydrocarbons are likely to continue to play a key role in the global energy and electricity matrix. Considering the energy transition process, the energy mix scenario [8,9], and the objective of globally achieving zero net emissions by 2050 [10], renewable energy sources are among the main alternatives for the energy transition. These may be the best option for the repurposing of O&G infrastructures, which would involve renewable energy production, leading to a greener economy [11], with potential synergies with other ocean industries, among which offshore wind energy stands out. Scheme 1 shows possible scenarios of offshore wind energy development according to a study by the International Energy Agency (IEA).
The New Policies Scenario (NPS) shows the evolution of the global energy system in line with existing policy frameworks and announced intentions, offshore oil production edges higher, while gas surges ahead to become—in energy-equivalent terms—the largest component of offshore output. In the Sustainable Development Scenario (SDS) the world gets on track to attain its climate, air quality and energy access goals, the balance of offshore activity shifts, but the overall level remains substantial. By the 2030s, offshore investment in this scenario—currently heavily weighted towards oil—is split into three roughly equal parts as oil and (to a lesser extent) gas output, while offshore electricity generation grows twice as fast and provides 4% of global power generation by 2040 [12].
It is estimated that approximately one-third of the total life costs (operation, maintenance, and service costs) of an offshore wind project can be favorably impacted upon by significant synergies with the O&G supply chain, by making it possible to electrify O&G offshore operations by installing wind farms nearby or by means of floating turbines, thus reducing the need to operate diesel or gas generators on the platform, reducing GHG emissions and air pollutants, and facilitating the energy transition, with platforms providing bases for wind farms [10]. The use of a wind source is one of the most promising alternatives used to produce blue energy; plant design must include an analysis of the wind potential in the platform areas, with additional investigations that include measurements of the wind potential at a specific location and height, in addition to its modeling. In terms of economic viability, the use of a wind source involves a joint venture project to delay the decommissioning process of the existing infrastructure, and the use of blue energy. The proposed alternatives represent technically viable and environmentally acceptable options, where the integration between wind energy and the oil industry represents the technological transition to a clean and sustainable blue energy economy [13].
The manufacturing of equipment for the offshore wind power industry requires high-performance materials that can face many years of service under extreme conditions. Among the material engineering and manufacturing processes analyzed in many important studies, we highlight the following: the process of layer-by-layer deposition of thermoplastic materials known as fused filament fabrication (FFF), which expands the manufacturing capacity [14]; the use of a five-axis deposition machine avoiding costs related to the removal of supporting steel structures [15]; techniques known as laser powder bed fusion (L-PBF), for the manufacturing of high-precision metal components [16], and shape retrieval tools (SRTs), for searching for and identifying 3D models [17]; and wire arc additive manufacturing methods for the rapid deposition of metallic materials [18]. Despite the relevance of the engineered manufacturing of steel structures, this subject is left for further studies to investigate to focus on the economic aspects of decommissioning and wind power at sea in Brazil.
Over the last decade there has been growing interest from the public in respect of sustainable energy, which is energy harvested from renewable sources; the use of sustainable energy enables reductions in the emission of GHG and the impact on the marine environment and enhances the de-carbonization of the industry. In this context, as an alternative to costly removal and disposal, one question arises: is the conversion of O&G infrastructure for the generation of renewable energy at sea economically viable as a sustainable alternative to removal and disposal? There is a need to consider, as hypotheses, the existence of policies favoring renewable projects; the availability of the necessary renewable energy for offshore projects from the economic perspective; the absence of regulatory obstacles to conversion as an alternative to disposal; and the possibility to repurpose installations as renewable projects as an alternative to traditional decommissioning, which represents high costs and negative impacts on the environment [19].
In this article, we address the economic and technical aspects of the conversion of O&G facilities into wind power generation offshore projects, the sustainability agenda, field abandonment options, and applicable regulation, by investigating specific aspects of the conversion of Brazilian O&G installations in the decommissioning phase as of 2021 into offshore wind power energy production units via repurposing subsea structures. Inflation, deflation, exchange rate variation, and revenue are not considered; only invested capital (CapEx) and operation and maintenance costs (OpEx) for decommissioning and conversion are considered. We also aim to address the decommissioning problem in Brazil, where there are two clusters of oil and gas projects (Potiguar basin and Campos basin) with a number of oil and gas facilities waiting for decommissioning, with the aging structures having been left abandoned at sea. Taking that starting point into account, the analysis of the investment offset is restricted to the viability of wind power projects in these two regions.
We verify the following: existence of public policies related to the abandonment of fields that are tailored to marine environmental conservation and the enhancement of the de-carbonization of the industry; the absence of institutional barriers and the need for clear regulation regarding the repurposing of offshore O&G facilities; the presence of sufficient wind energy for offshore projects in some Brazilian coastal regions; and the potential for maritime structure conversion into renewable projects by considering the investments, which are similar to those required for traditional decommissioning.

2. Methodological Approach and Results

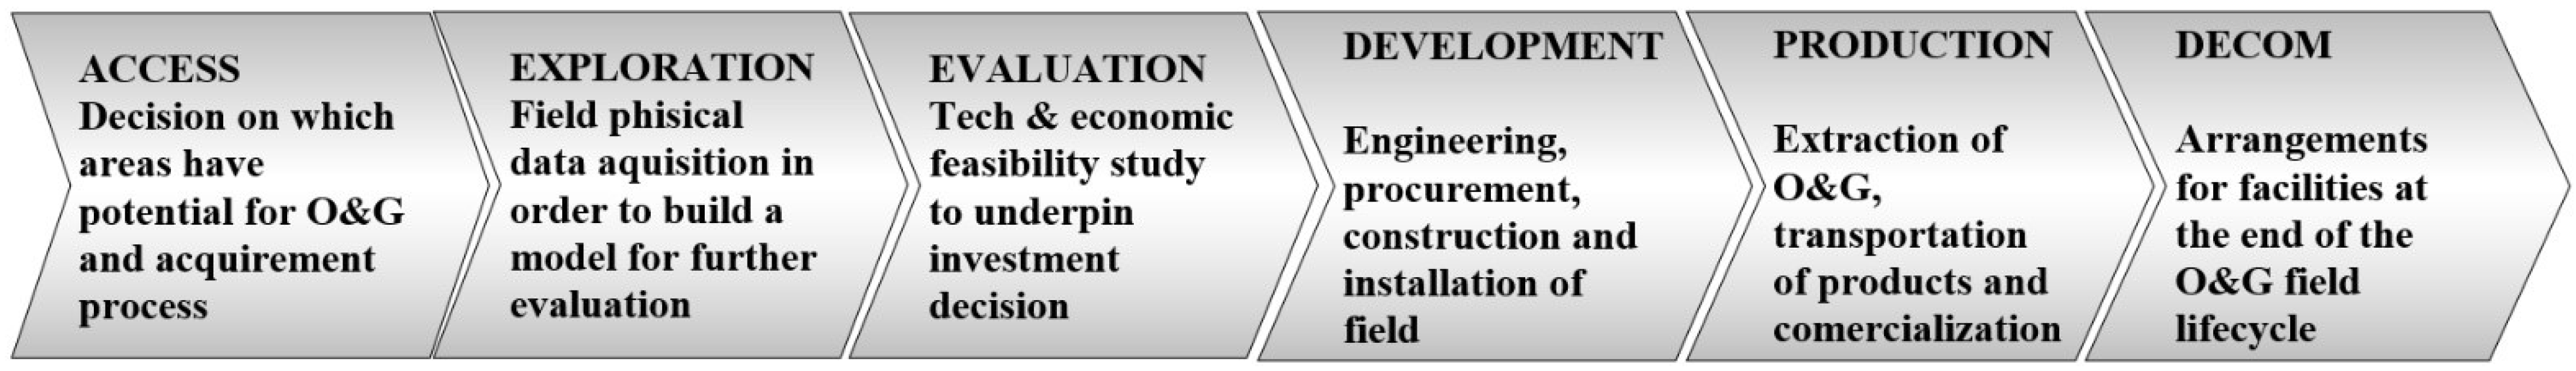
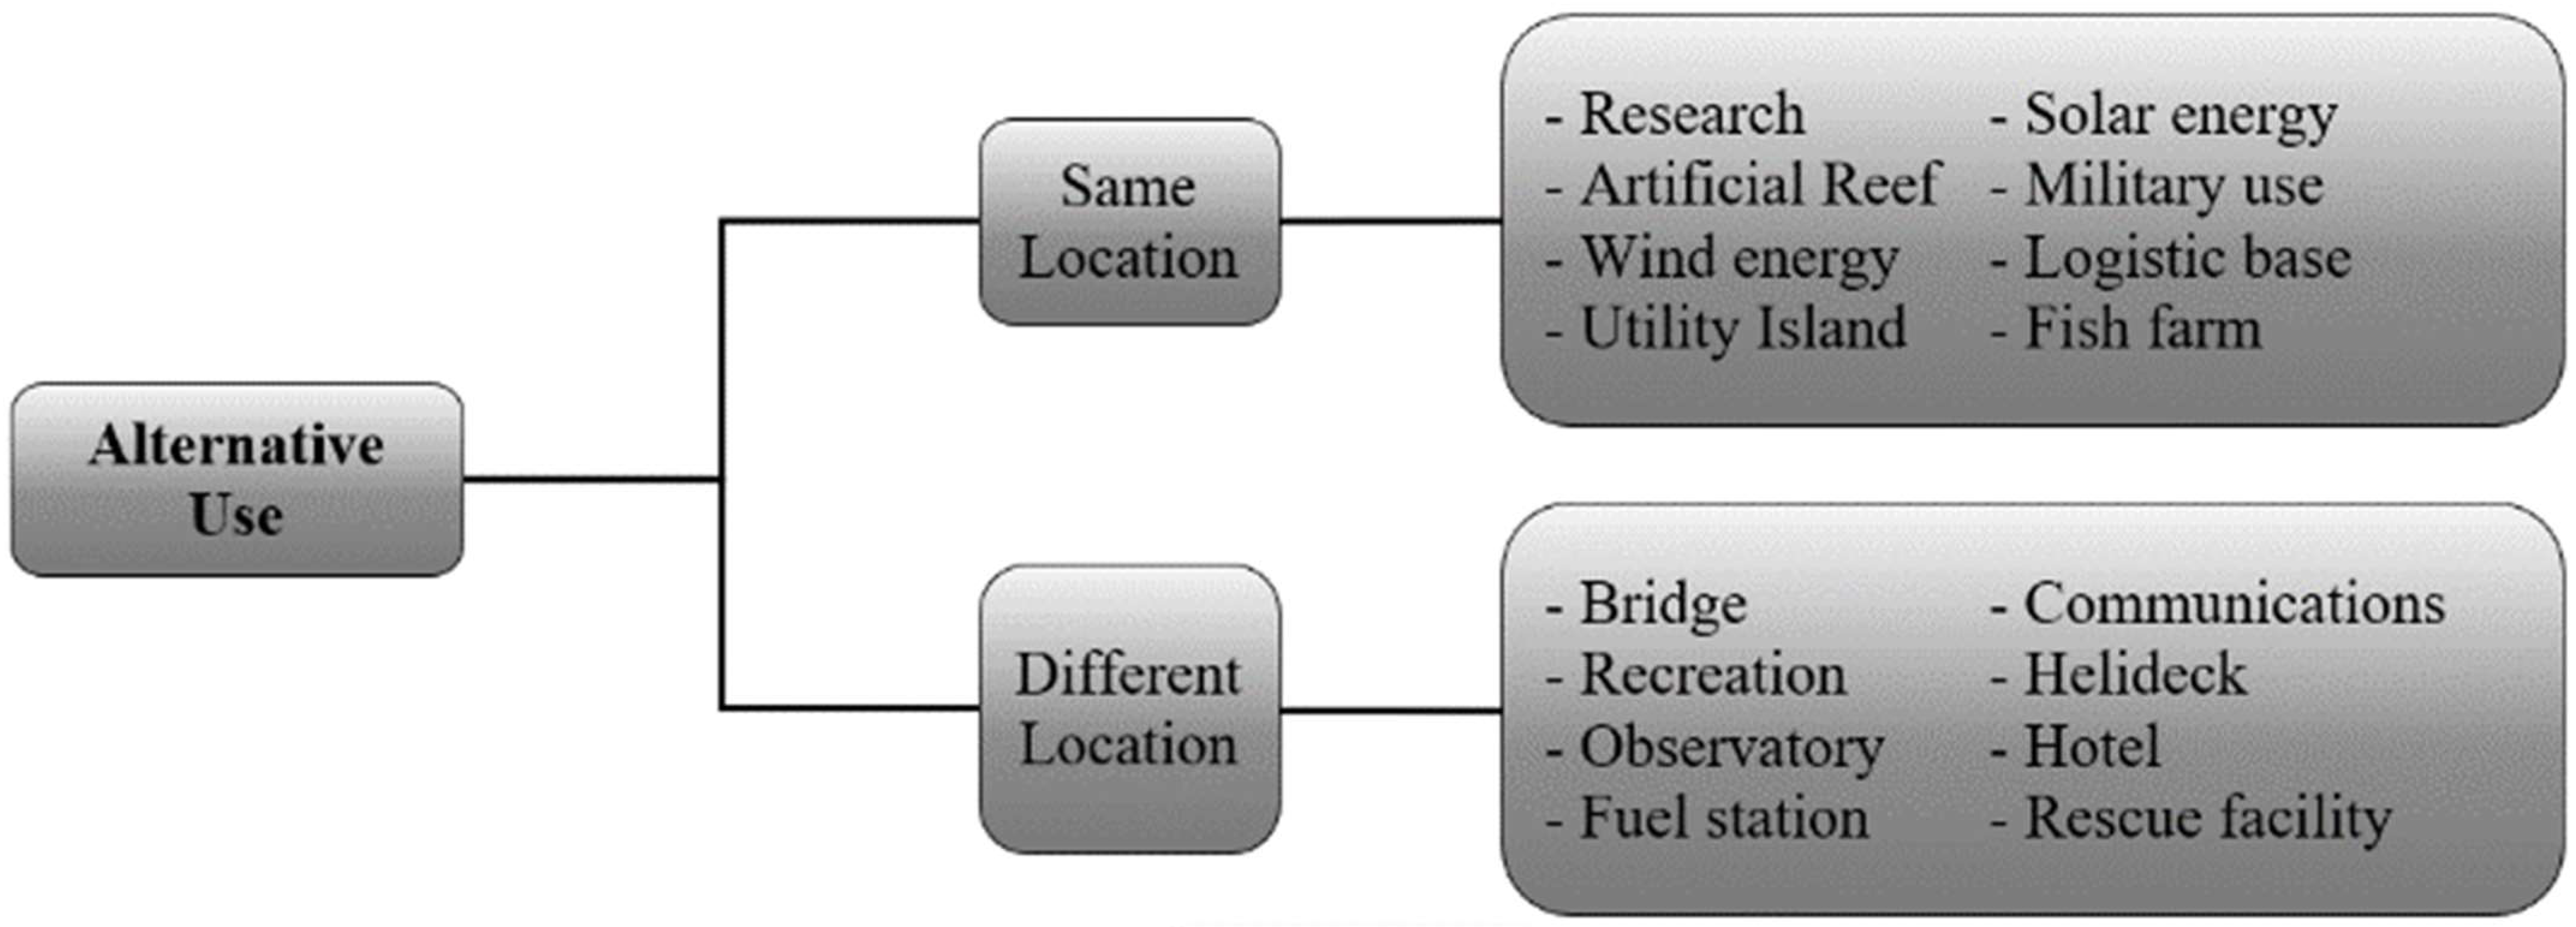
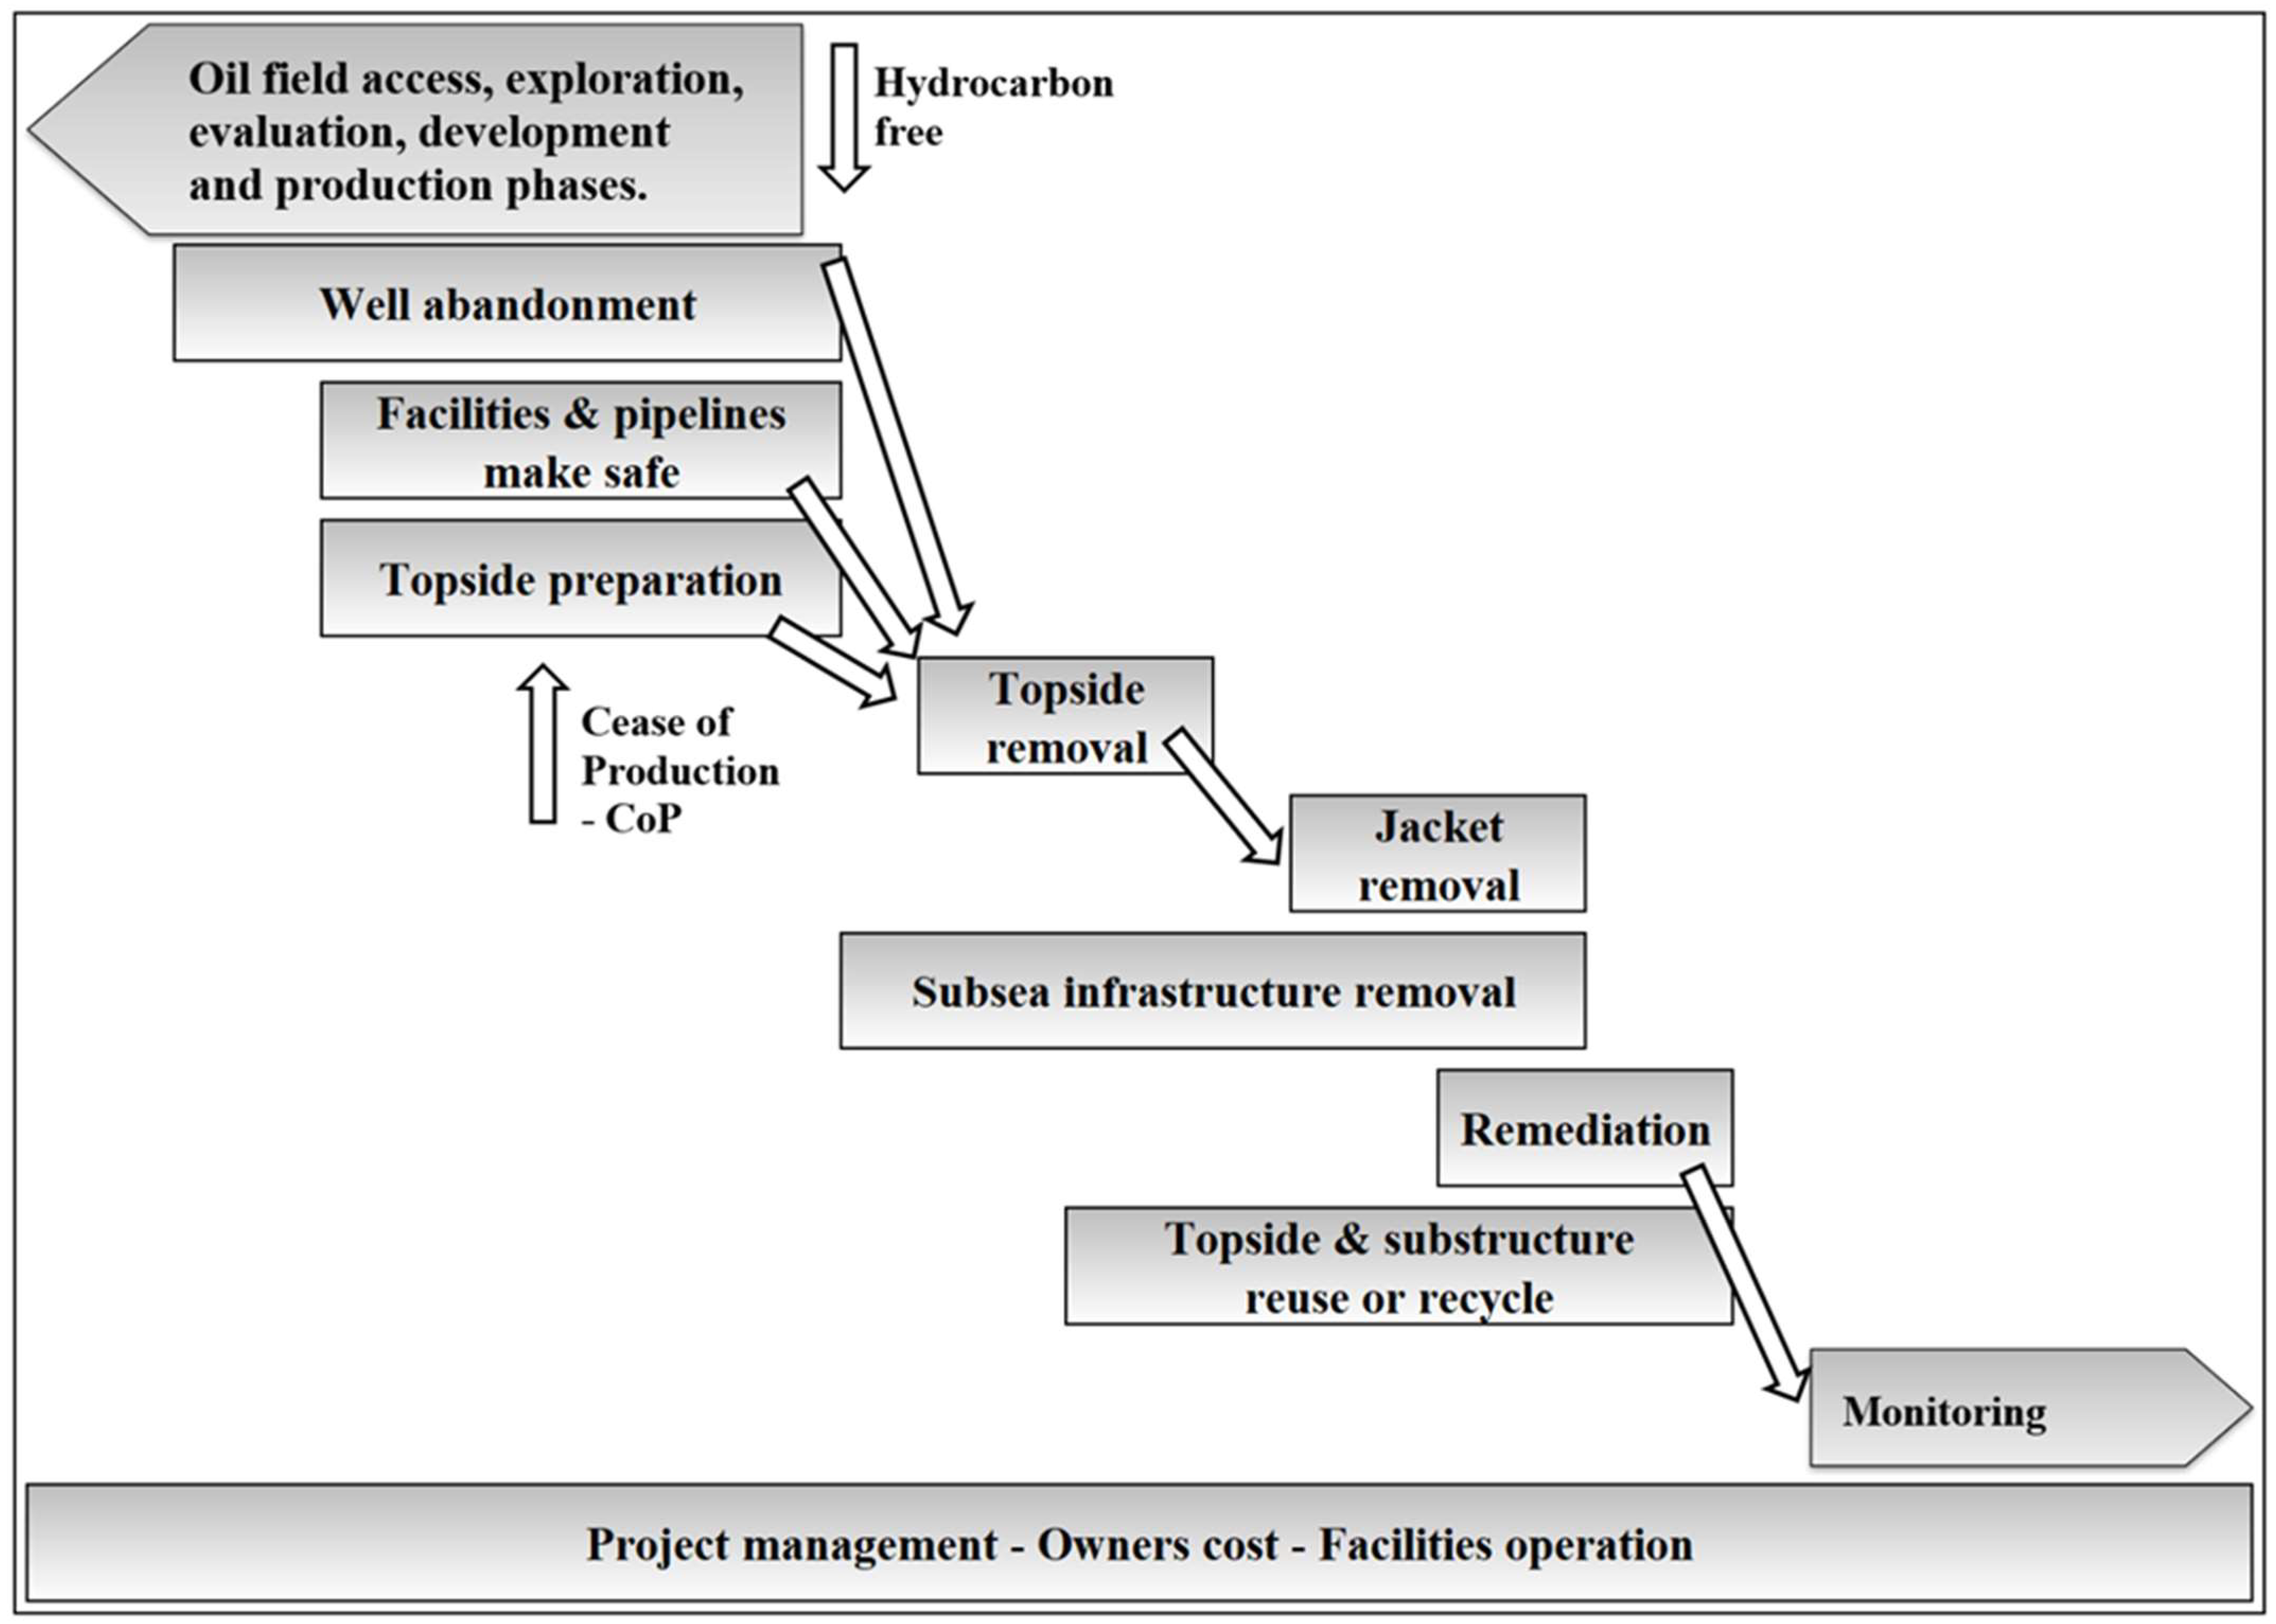
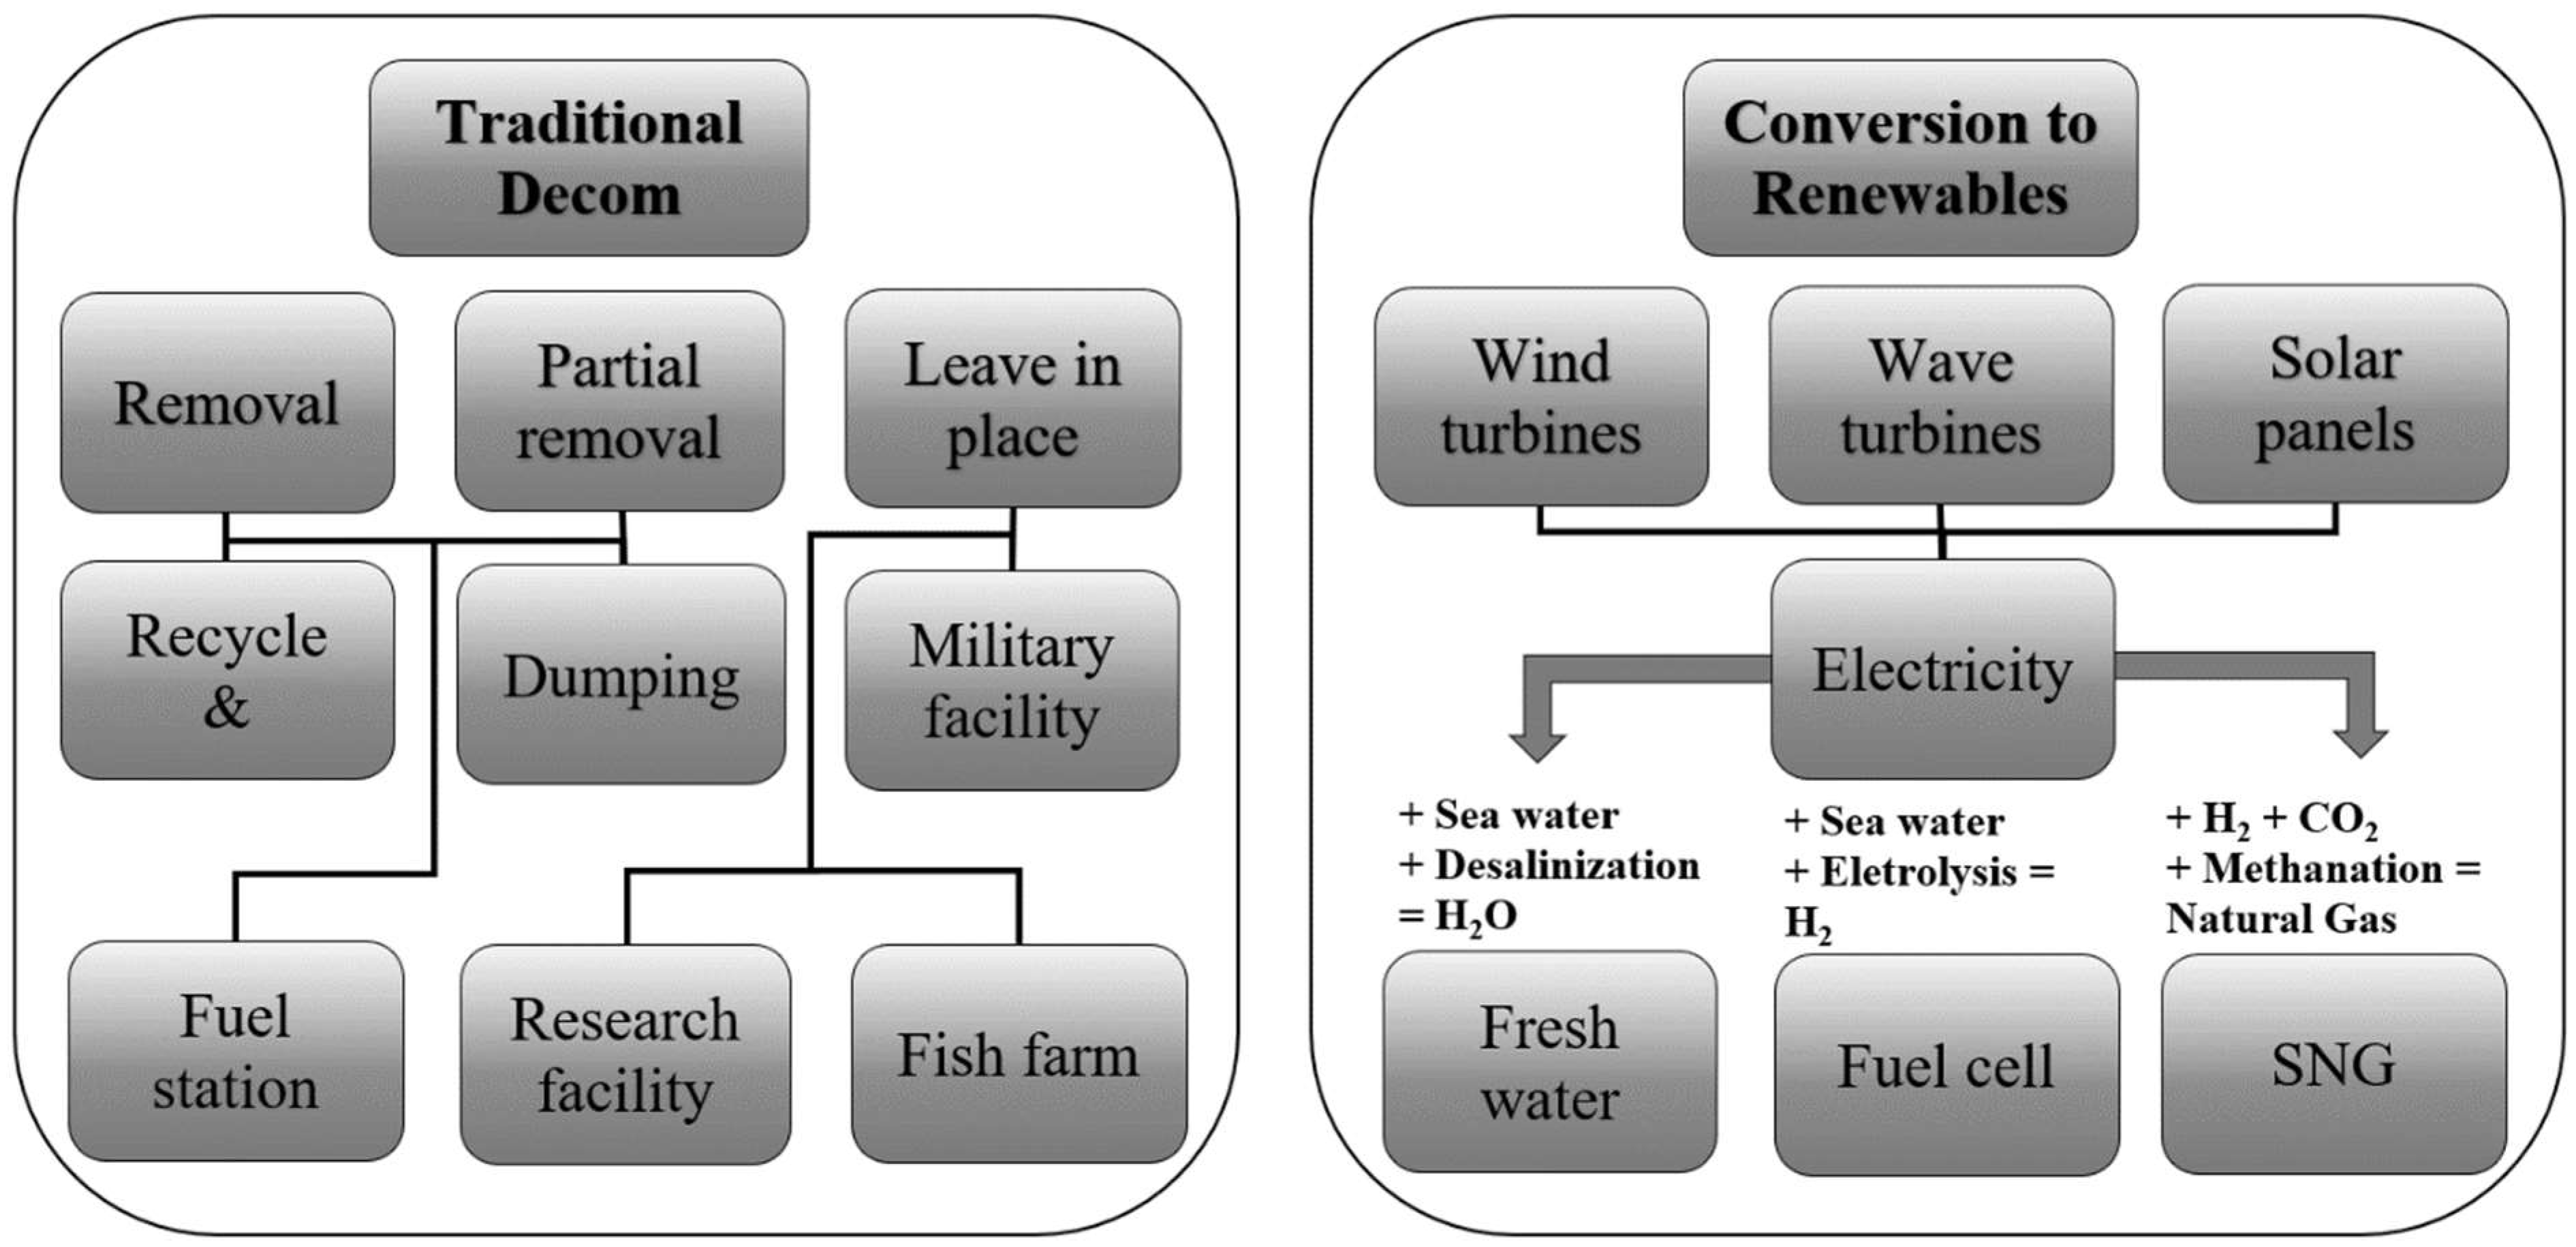
2.1. Decommissioning

The life cycle of an offshore hydrocarbon extraction project has six phases: enabling access to fields or areas to be exploited; the exploration of reservoirs; technical and economic feasibility assessments; the development and physical installation of the structures; production, which can last for decades; and finally, the abandonment of the field, when the installations should be removed and their constituent materials, now residues, supposedly disposed of [20]. Figure 1 illustrates the life cycle of a marine O&G field.
Decommissioning proceedings are widespread across many energy industries (e.g., nuclear, civil, naval, transport, wind, road, and mining), and currently represent a very relevant area in the O&G sector [19]. The relevance of decommissioning is closely related to the maturity of each given sector. Offshore wind farm interest groups are mostly focused on efficiency gains, attributing a secondary role to end-of-life analyses [21]; however, nuclear energy operators have deep concerns in respect of the decommissioning of installations. Such activity is forecasted to experience considerable growth from now until 2040 [12]; therefore, the end of O&G offshore structures has become a worldwide concern [19].
Legal compliance is the starting point for decommissioning planning. Both international and local regulations require the case-by-case evaluation of each decommissioning project, balancing the removal of structures with the prevention of the side effects derived from leaving unused installations at sea. This process is needed to ensure safety in relation to surface and subsurface navigation, the marine environment, ocean living resources, maritime persons, and fishing activities, as well as ensuring human health and legitimate uses of the sea, including sovereign rights to exploit the sea, subsea resources, and mankind’s heritage, and preventing the transboundary movement of hazardous wastes [22,23,24,25]. Notwithstanding the above, there are some disadvantages to the removal of structures, mostly from an environmental perspective.
While many studies have focused on the effects of the prolonged presence of maritime structures in marine ecosystems [26,27,28], comparatively less is known about the effects of installation removal and alternative solutions. In the case of offshore installations removal, ecological considerations in respect of biodiversity, biomass production, conservation, and carbon footprints are raised [29], usually advocating against the full removal of installations. The removal of structures may cause many side effects, such as the elimination of biomass from the site; the suppression of the safe work exclusion zone [23], where structures de facto work as marine protected areas; the disturbance of oil sediments from drill cutting due to trawling in former safety zones; the transport and unintended spread of non-native species during the removal of subsea structures; the generation of greenhouse gases by burning fuel on tow-ships and recycling facilities; replacement energy (i.e., the theoretical amount necessary to produce new materials that replace the materials left at sea [29]); and the disturbance of the subsea ecosystem during subsea works [29].
Several studies have addressed decommissioning alternatives for O&G offshore installations, and their scope keeps growing as anthropogenic activity expands, from traditional removal and disposal to artificial reefs, utility islands, military facilities, bridge construction, launch pads for space rockets, research facilities, etc. Regardless of the economic activity, decommissioning decisions are often highly complex. This is due to the diversity of the operational and local parameters, as well as the multitude of stakeholders involved, who generally have conflicting interests [19]. The alternative uses of offshore installations can be employed at the same location, in which case there is no need to move structures and less disturbance to the subsea environment is observed, or at another location, in which case transportation efforts at sea are required. The selection of an alternative use for O&G installations is normally a multi-criterion decision, taking into consideration existing structures and proposals of feasible courses of action for each structure, the identification of people and organizations that may interfere with the project, the technologies, and procedures available on the market, and the legal constraints [19]. Figure 2 shows some alternative uses for decommissioned offshore facilities, based on economic feasibility studies of North Sea cases.
According to Chandler et al. [30], when an O&G field becomes unviable, the offshore infrastructure needs to be decommissioned. This includes several installations on a variable scale. (i) Platforms, composed of support structures and topsides, vary from small, shallow structures to heavy structures in deep waters [31]. (ii) Floating facilities, such as ships, are alternative hosts for equipment production and facilities. (iii) Subsea equipment and support structures include wellheads, manifolds, and termination structures for pipelines. (iv) Pipelines consist of internal pipelines for the transmission of hydrocarbons from well networks to refinery facilities; export pipelines that send O&G to the coast; other smaller pipelines that supply injected chemicals to facilitate the flow in the main pipelines; cables that supply electricity, hydraulics, and communication via wires or fibers; and spools or jumpers (short lengths of ducts) to connect subsea installations. (v) Auxiliary installations include additional structures installed on the ocean floor (heavy concrete mattresses, stones transported from the earth, or other dense structures placed in pipelines to improve stability) and other types of structures placed in pipeline routes to create undulations that facilitate the relief of thermal expansion. (vi) Finally, wells connect wellheads to the hydrocarbon production reservoir, with a bore lined with several steel pipe columns.

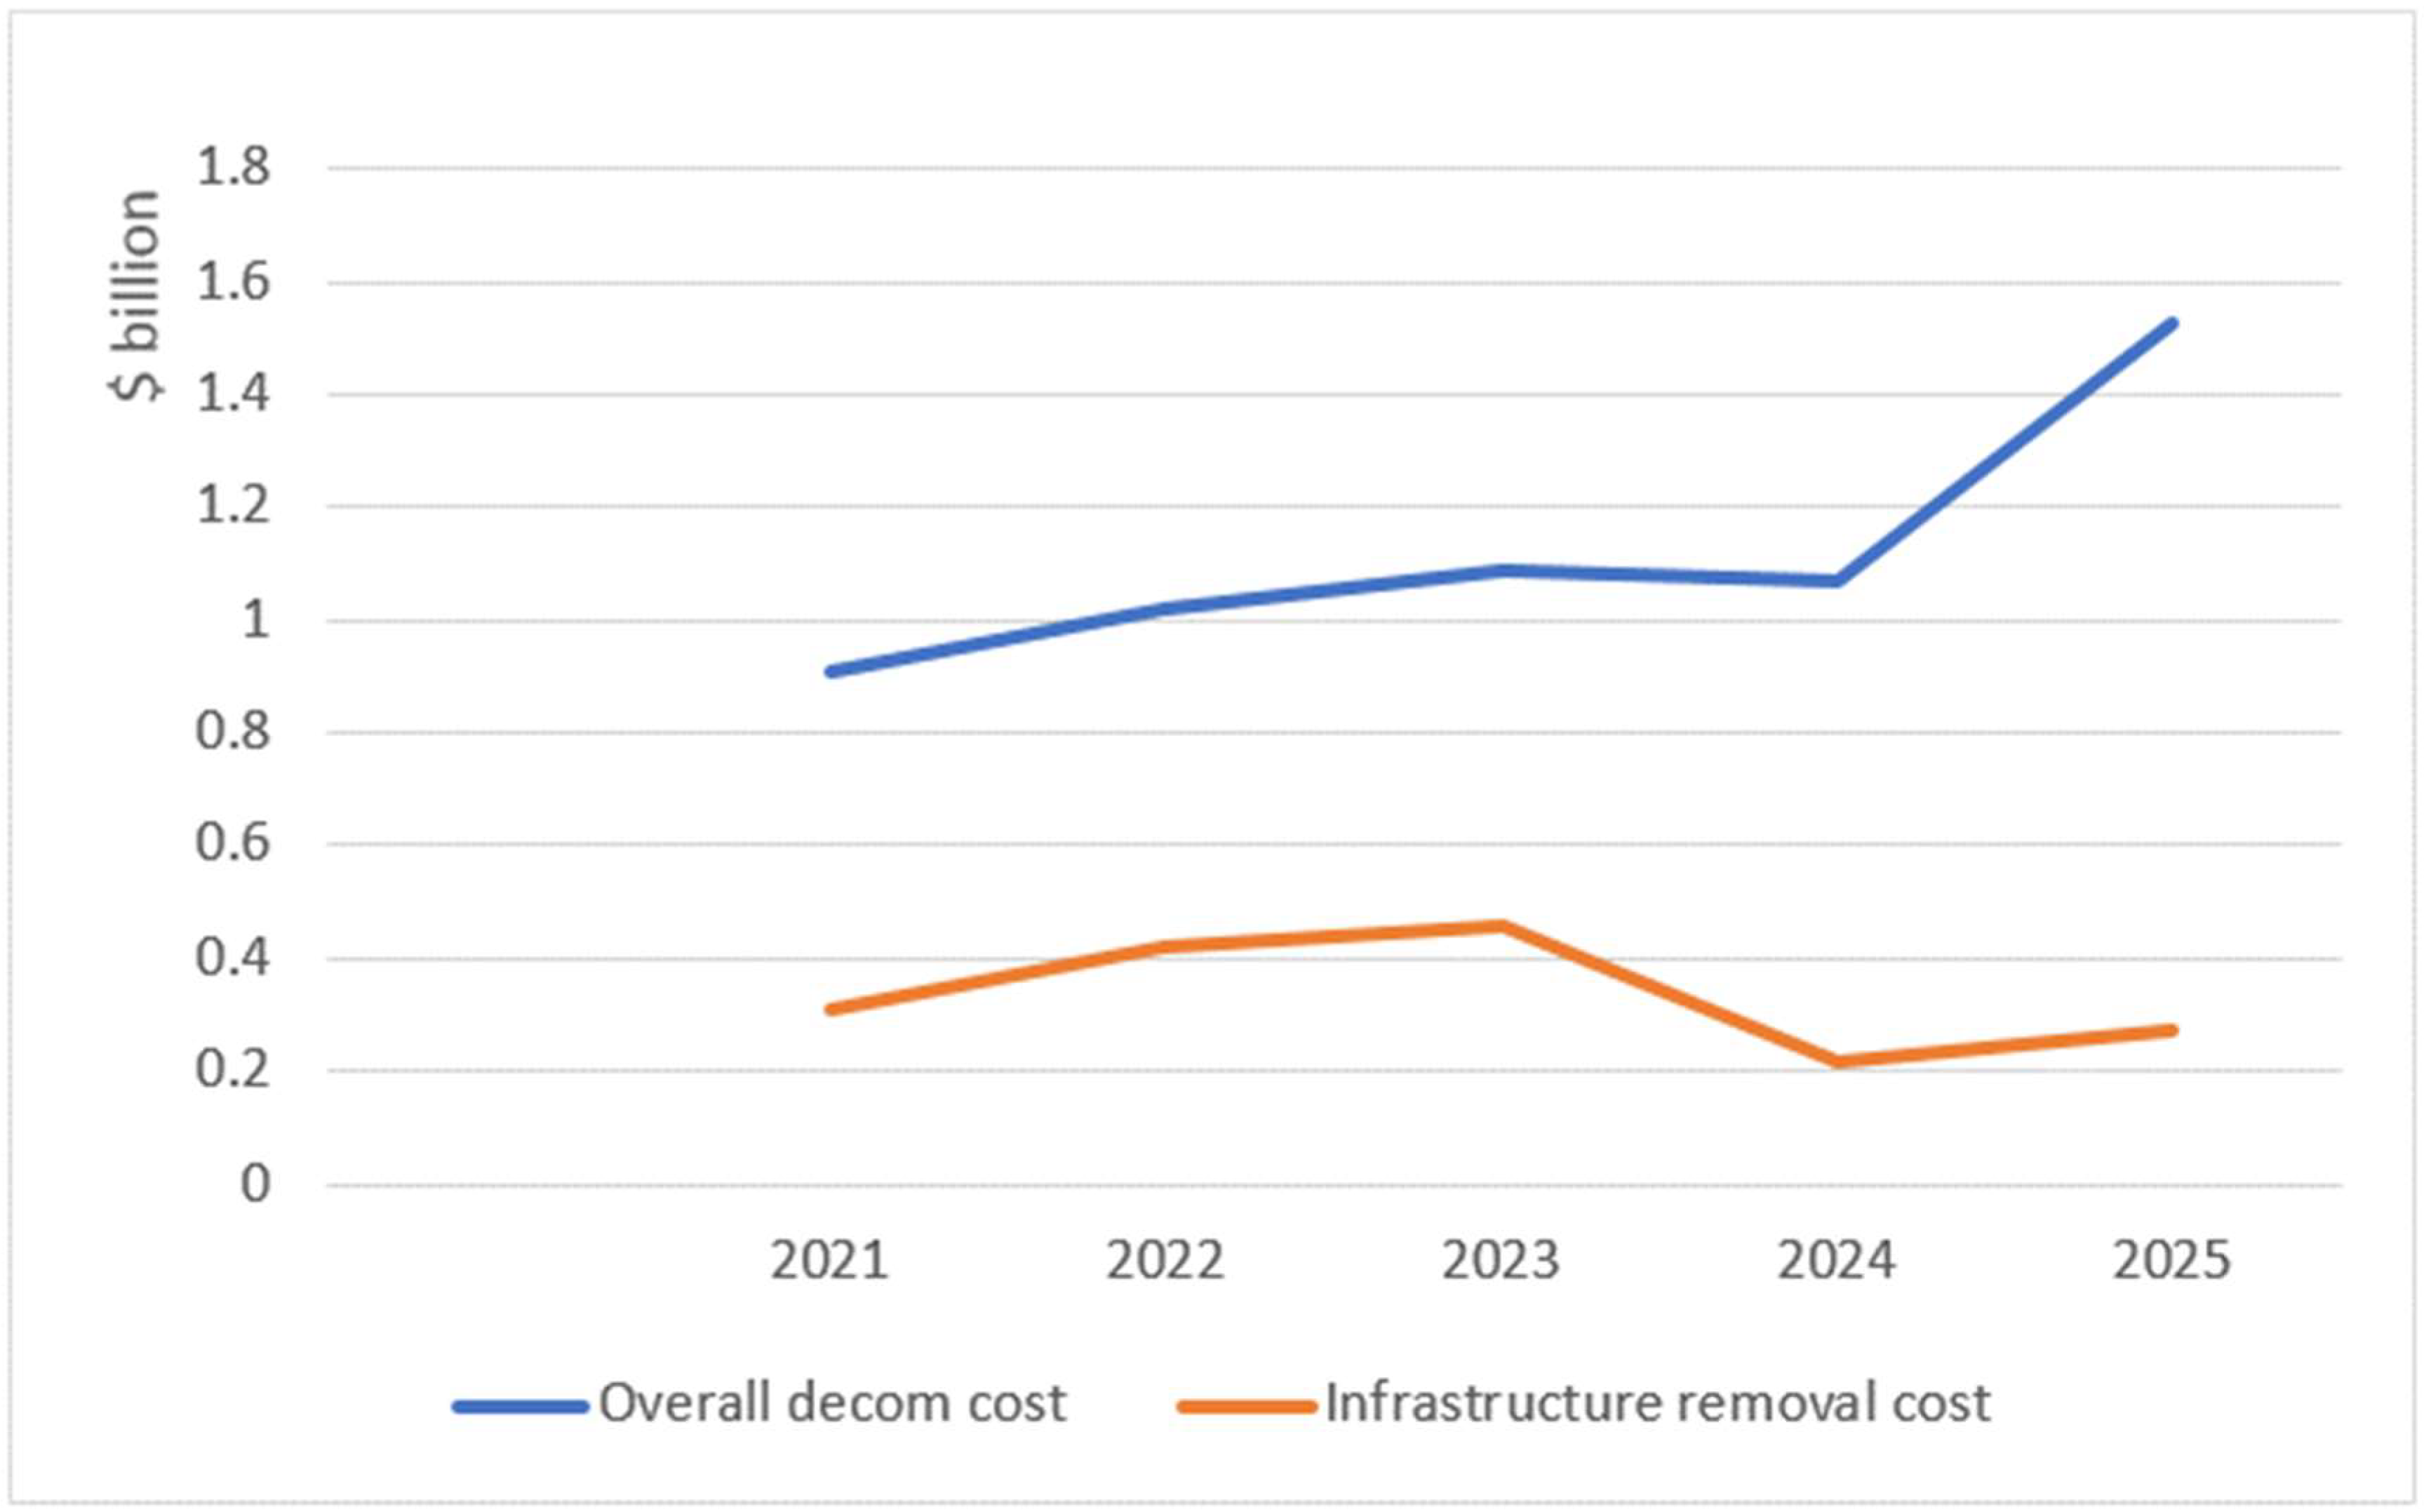
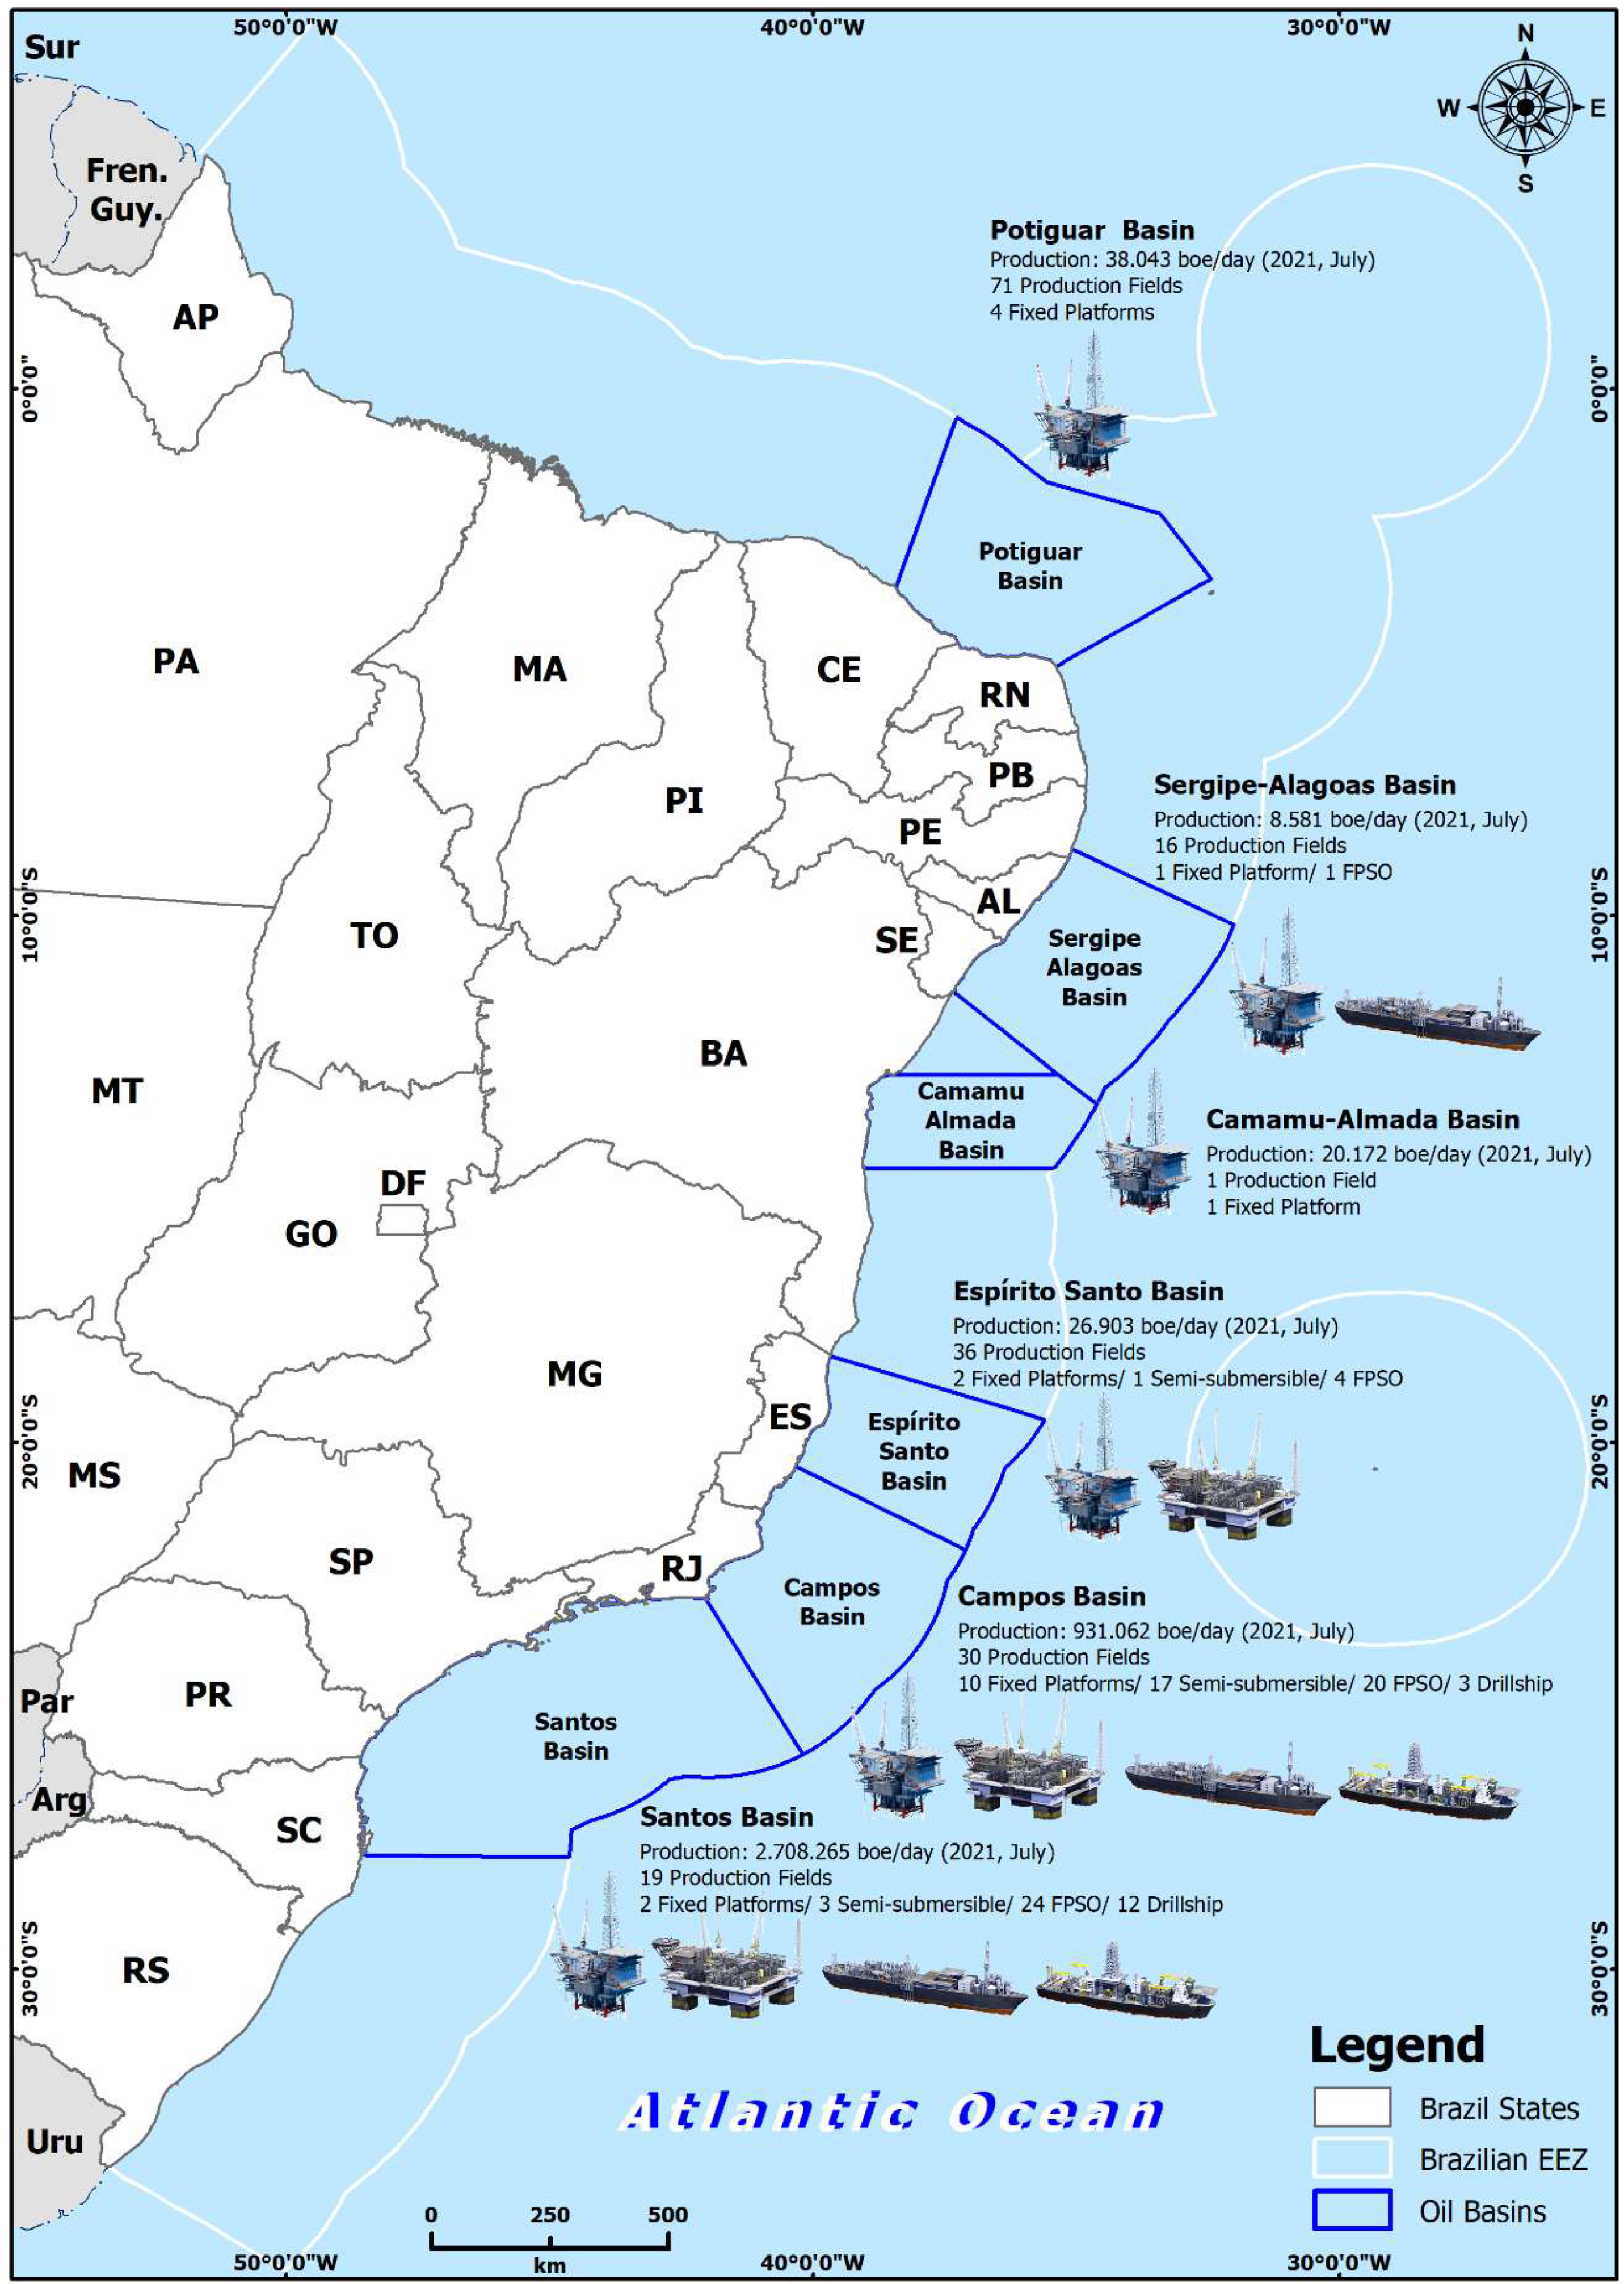
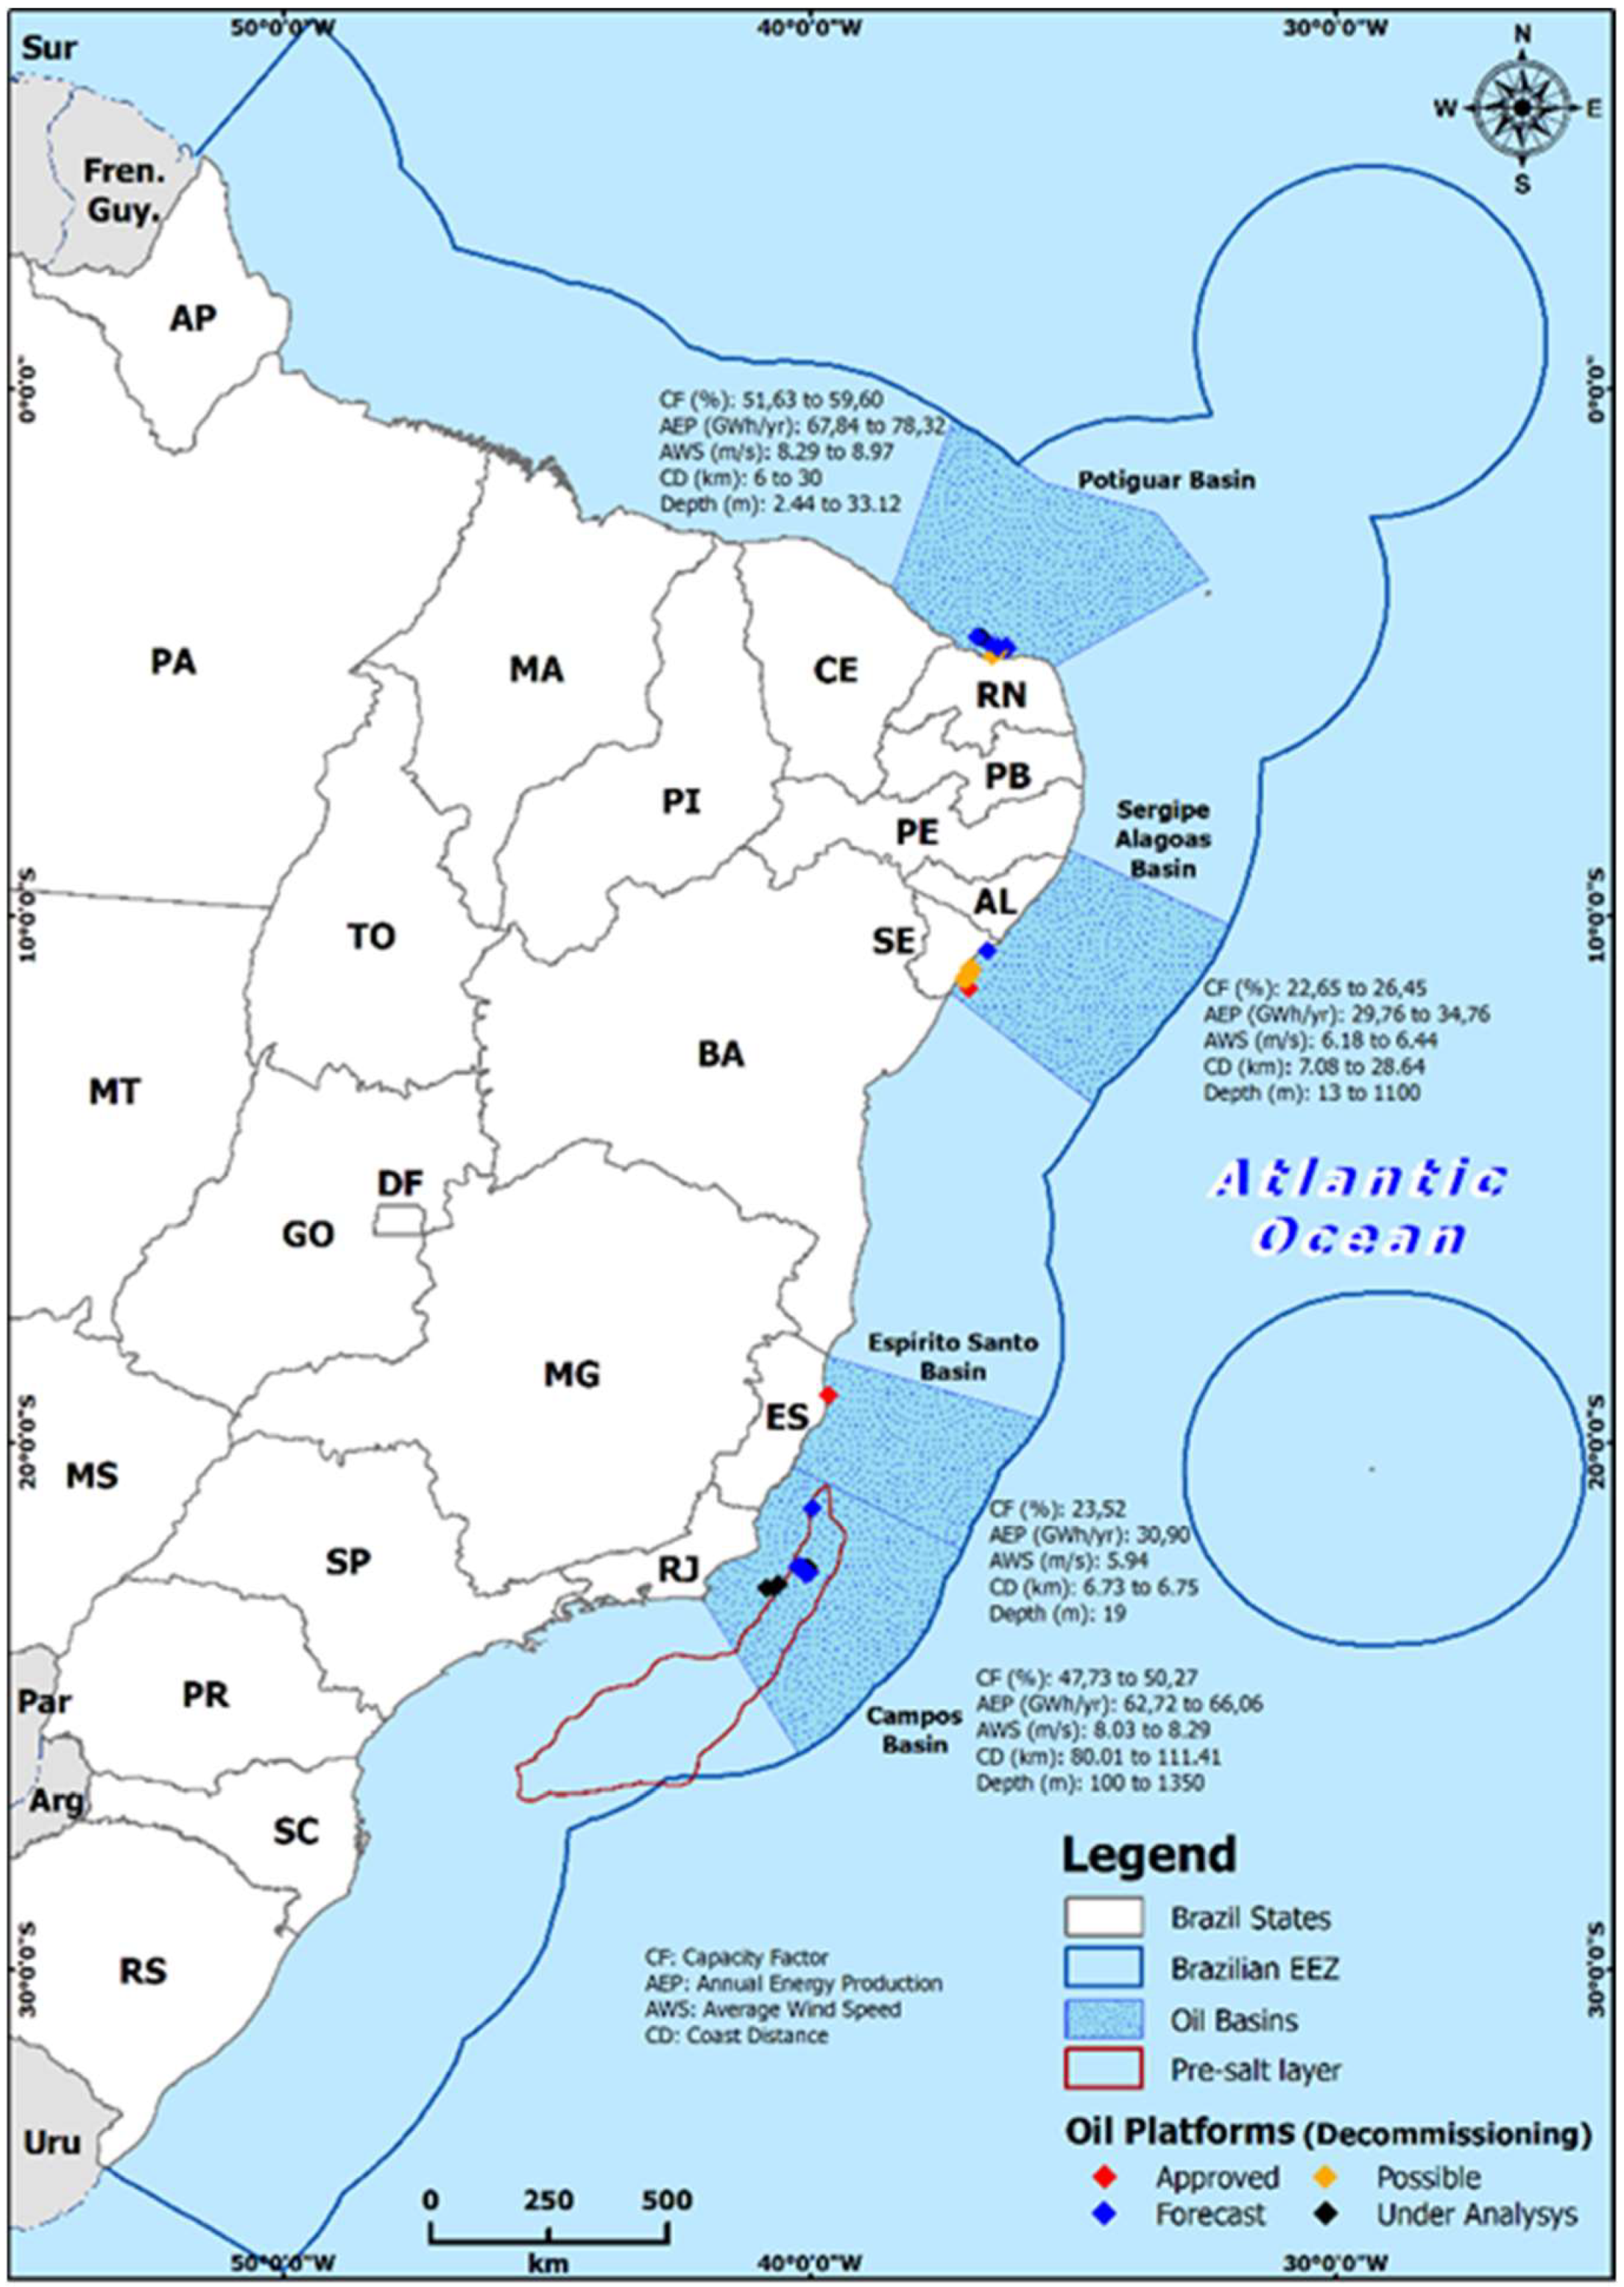
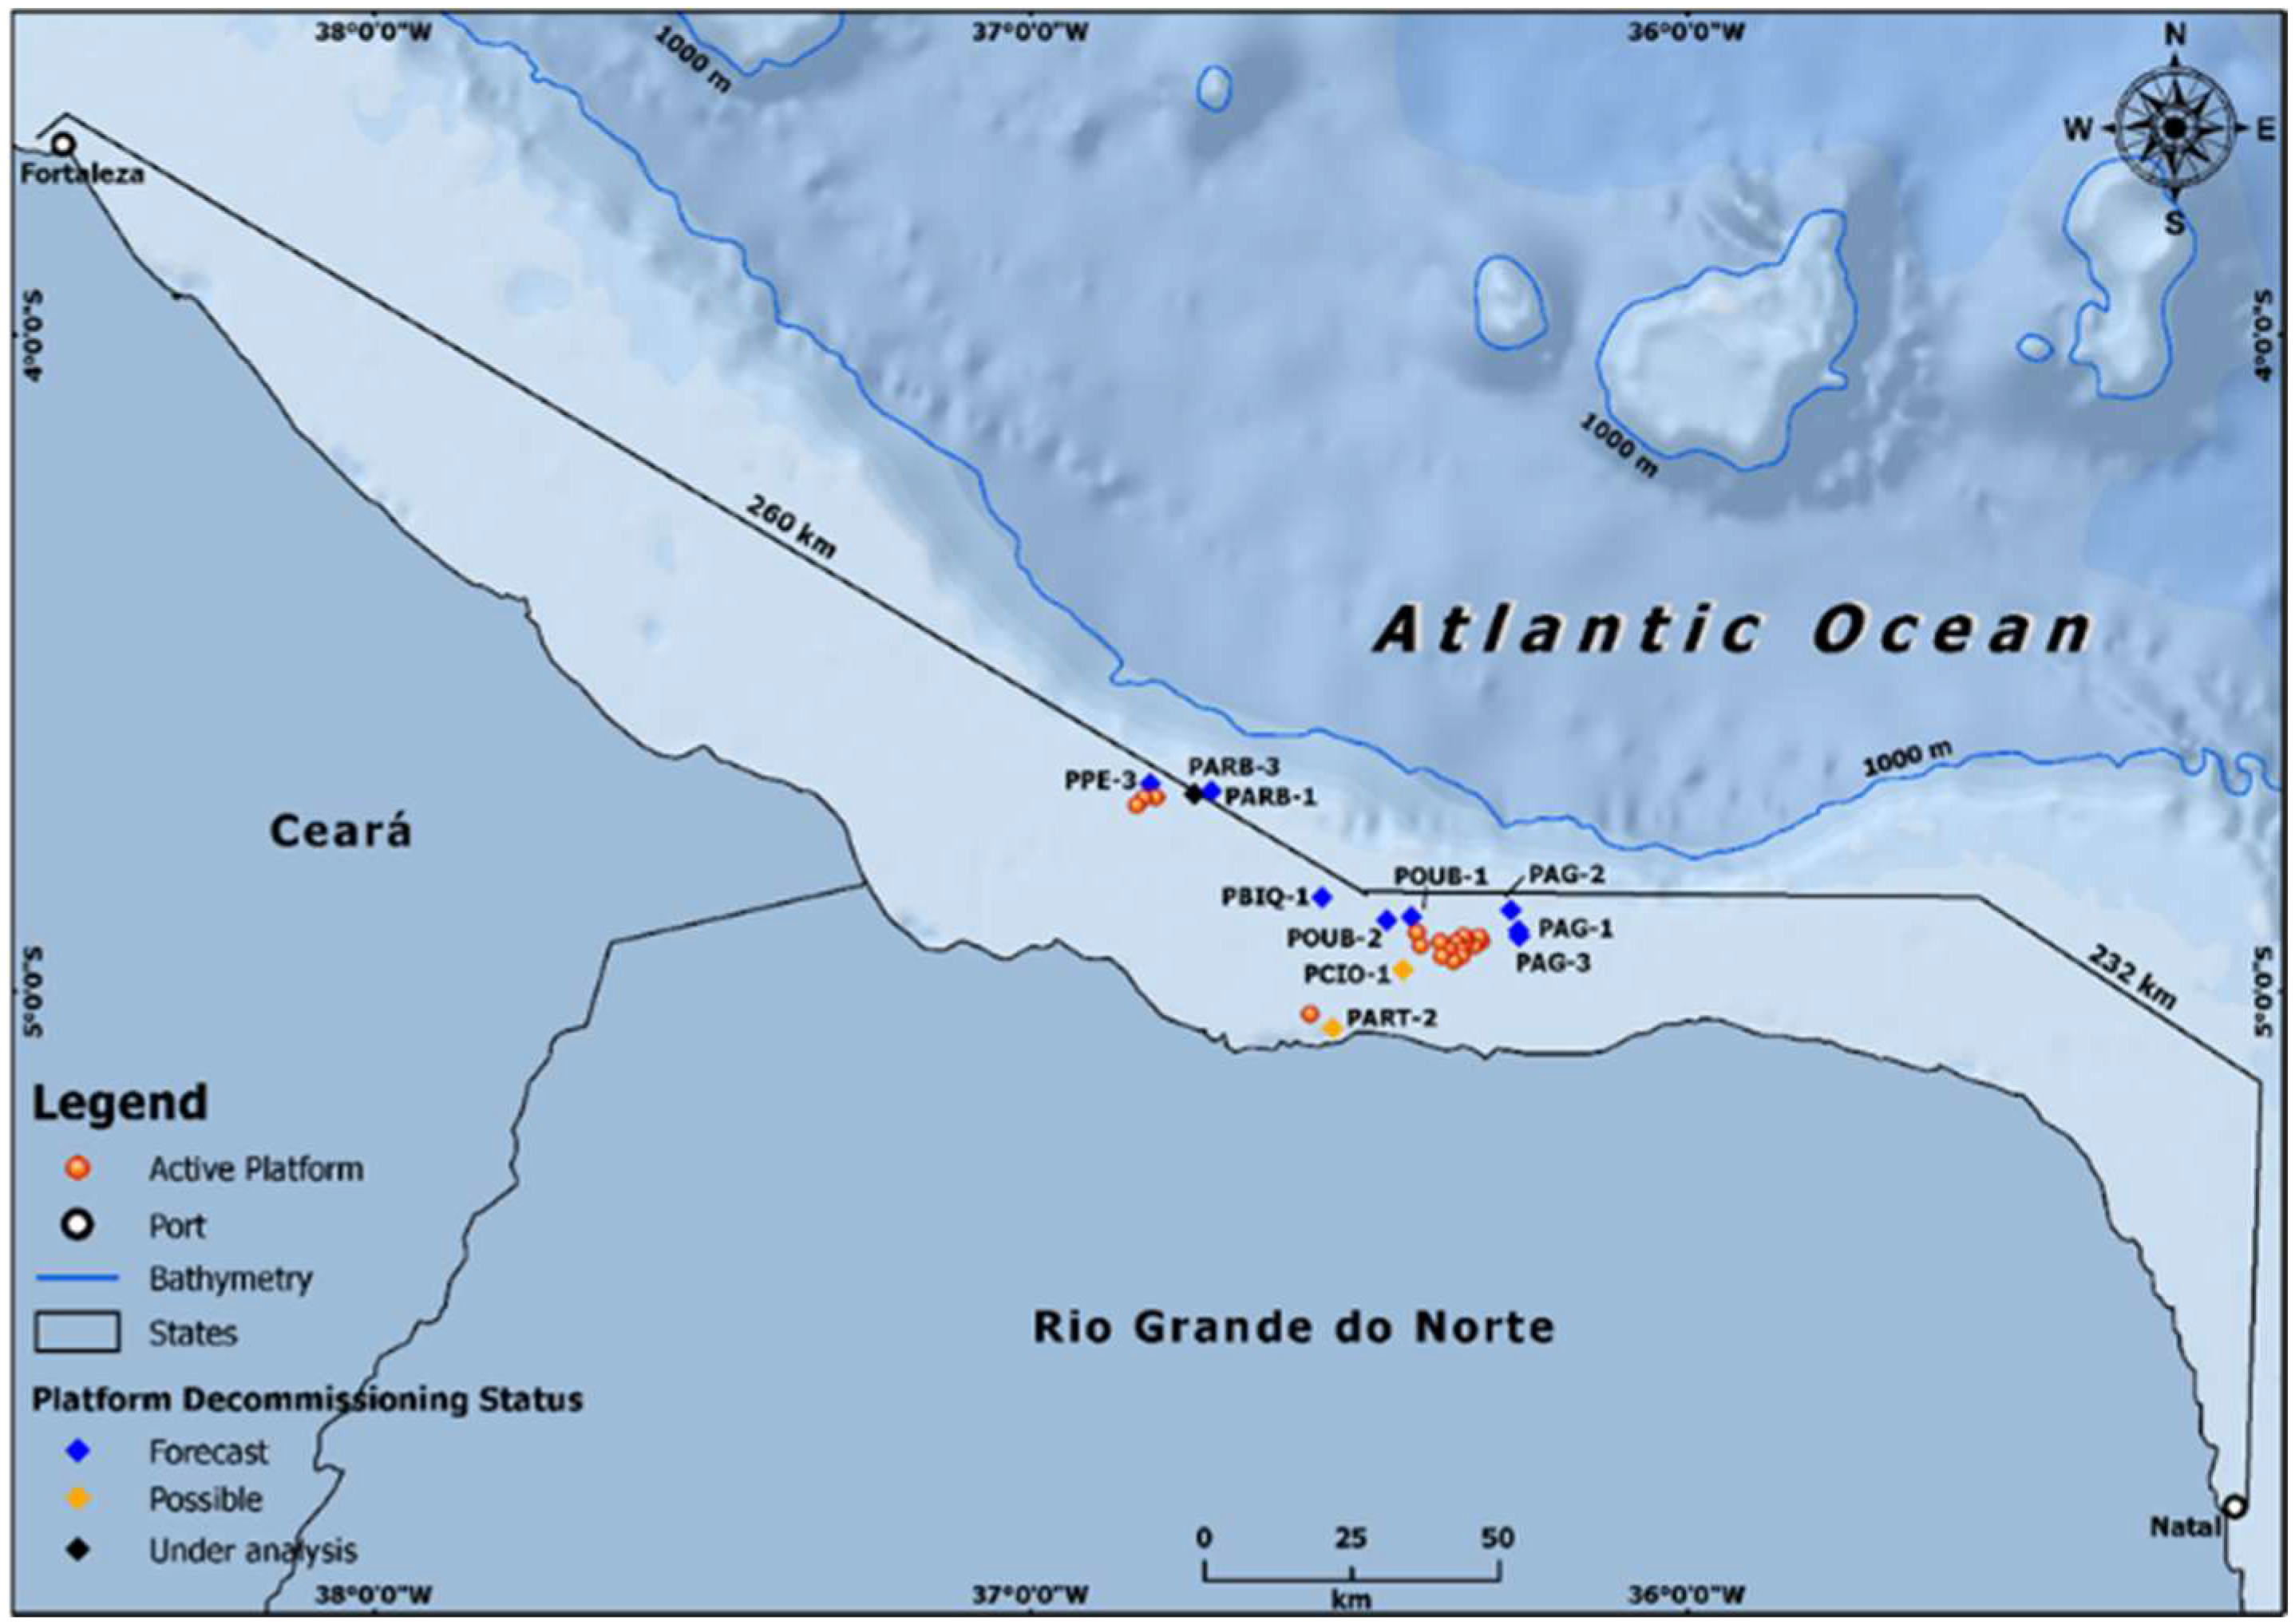
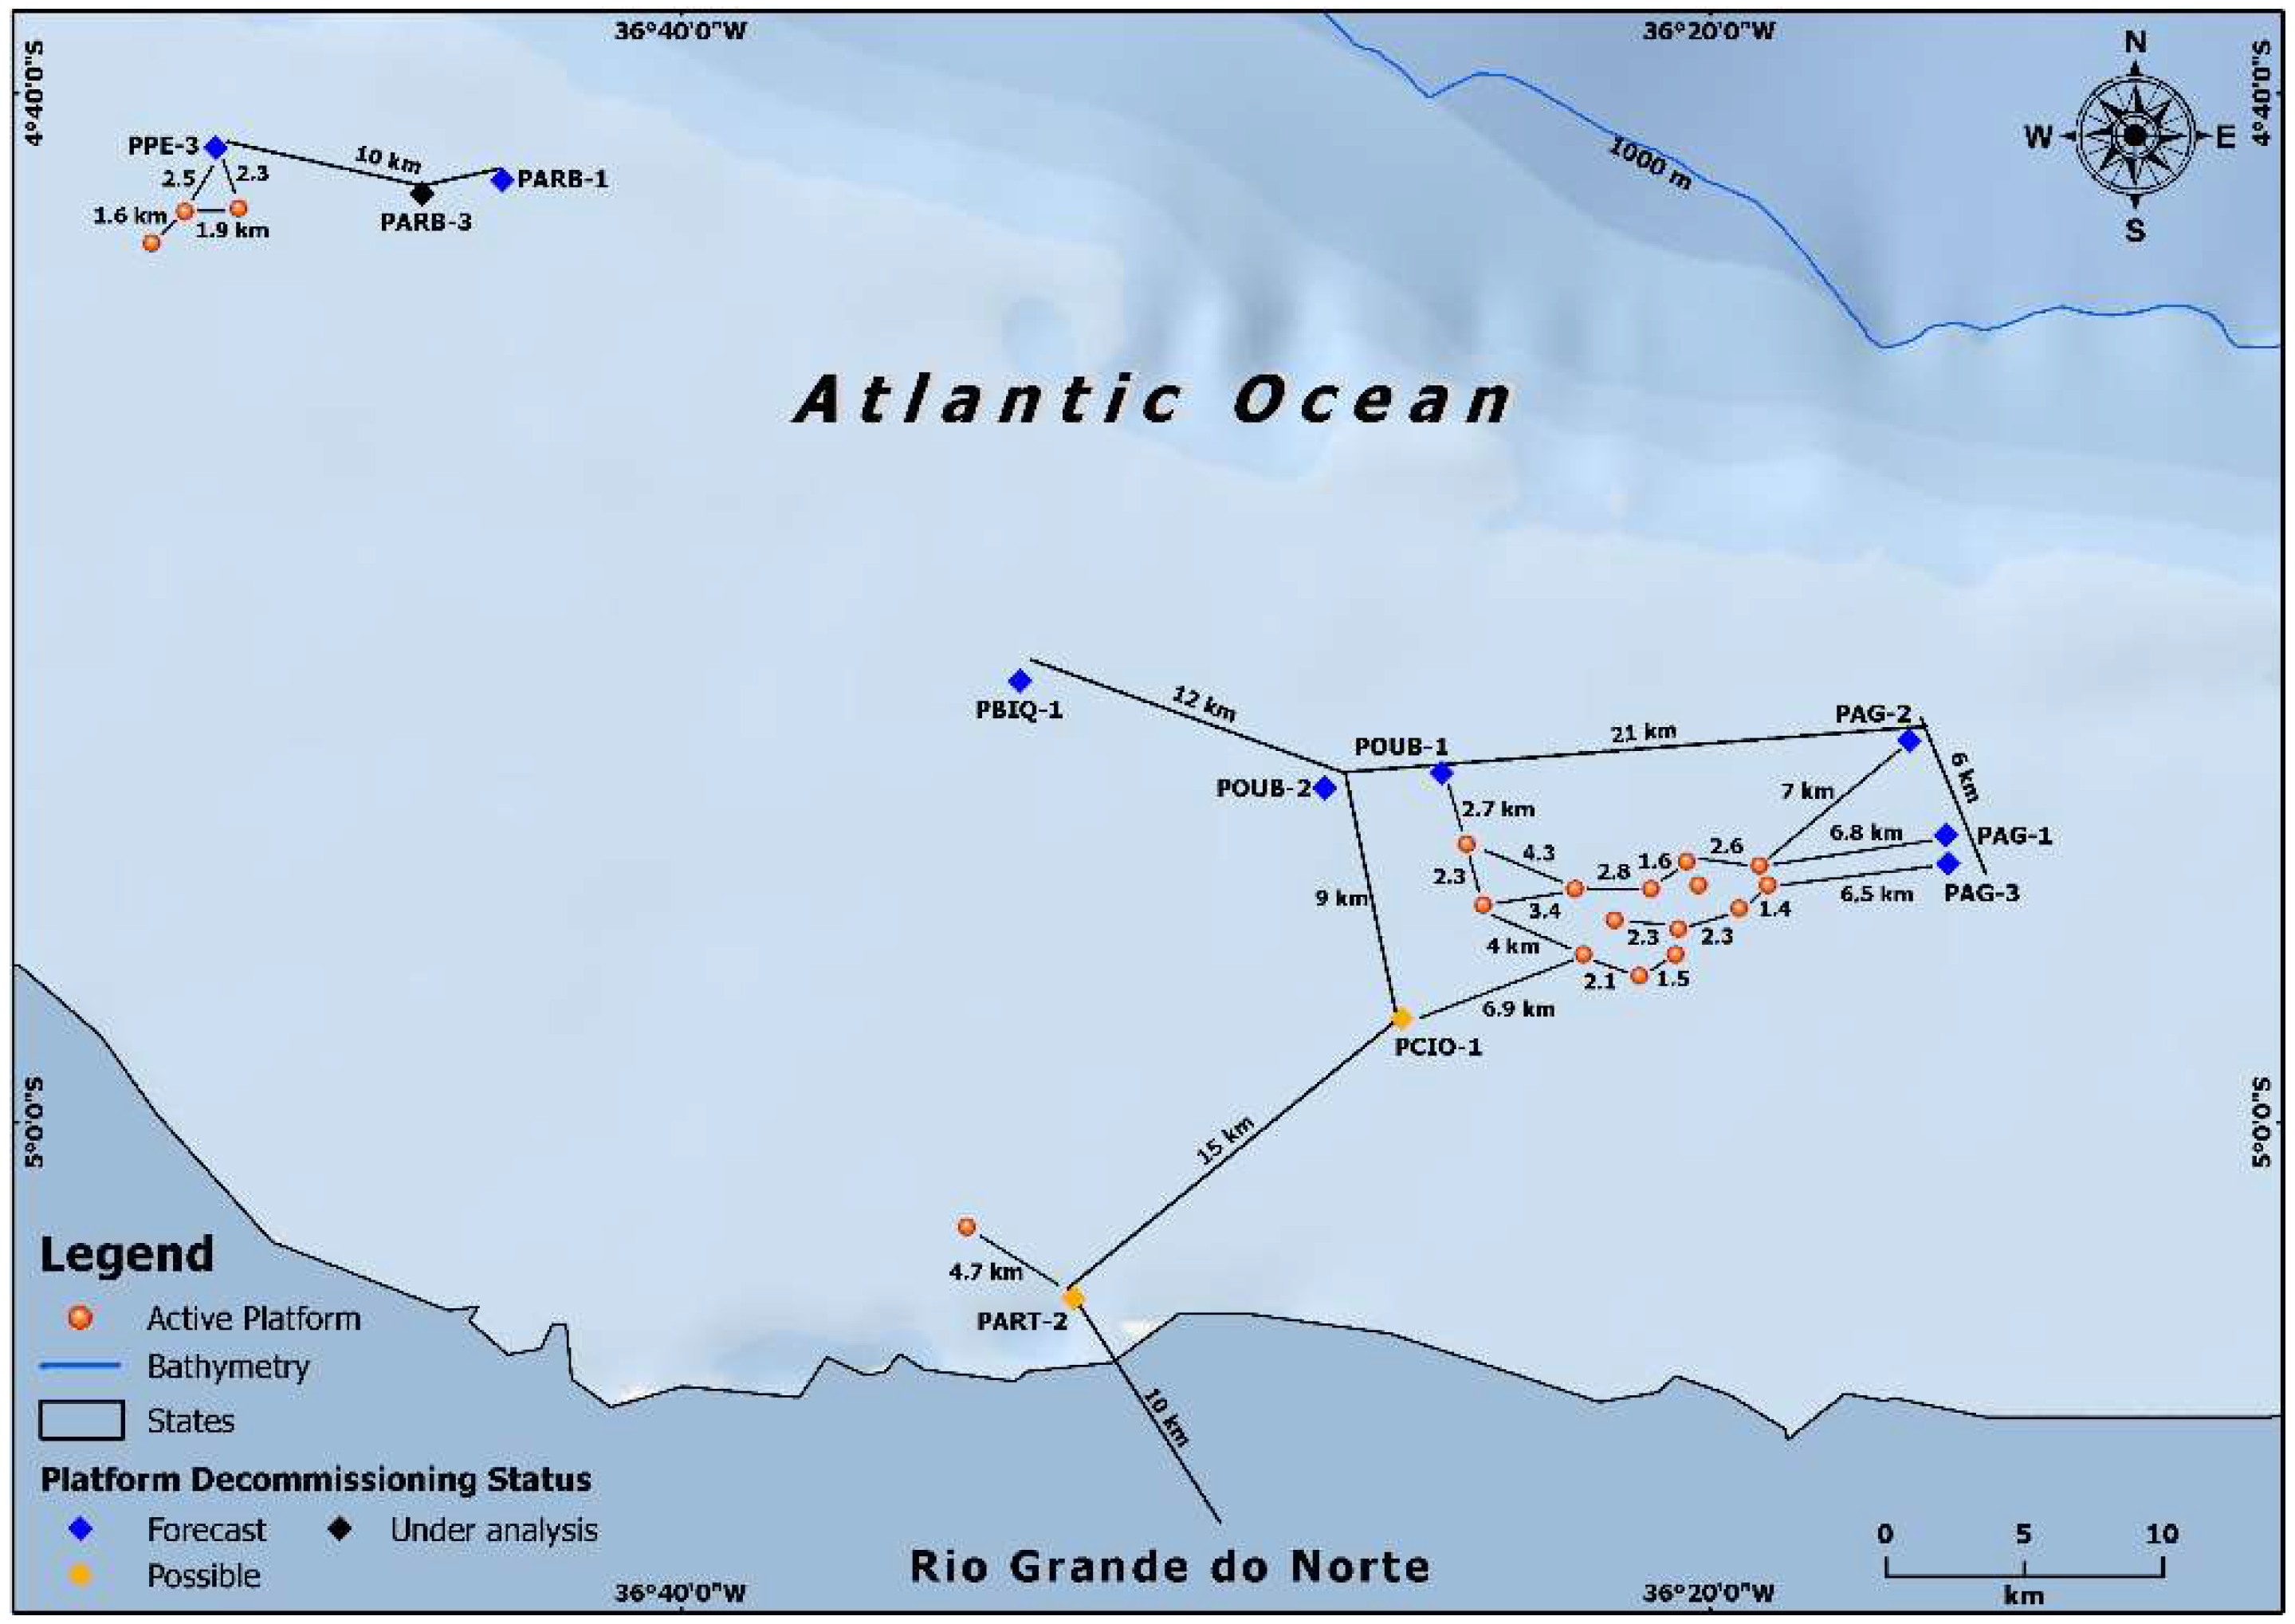
2.2. Brazilian Context

With approximately 210 million inhabitants, a territorial extension equivalent to twice the European Union, and 8500 km of coast, Brazil, the eighth-largest economy, is currently one of the world’s cleanest energy suppliers [6]. However, there is an important challenge, i.e., the balancing of economic growth with pressures on the natural environment in a sustainable way. The expansion of oil production and the growth in greenhouse gas (GHG) emissions are current trends observed in Brazil, where a robust maritime O&G industrial park has grown over the years. The management of these challenges involves the de-carbonization of current energy matrices in a transition from an intensive fossil fuel model to a system oriented towards renewable energy, since a non-renewable, carbon-based matrix is logically unsustainable in the long run, ceteris paribus. Nonetheless, the considerable cost of the abandonment of maritime fields still hinders the execution of decommissioning in Brazil, increasing risks related to an ever-growing number of uninhabited structures at sea.

Infrastructure Removal Cost Analysis
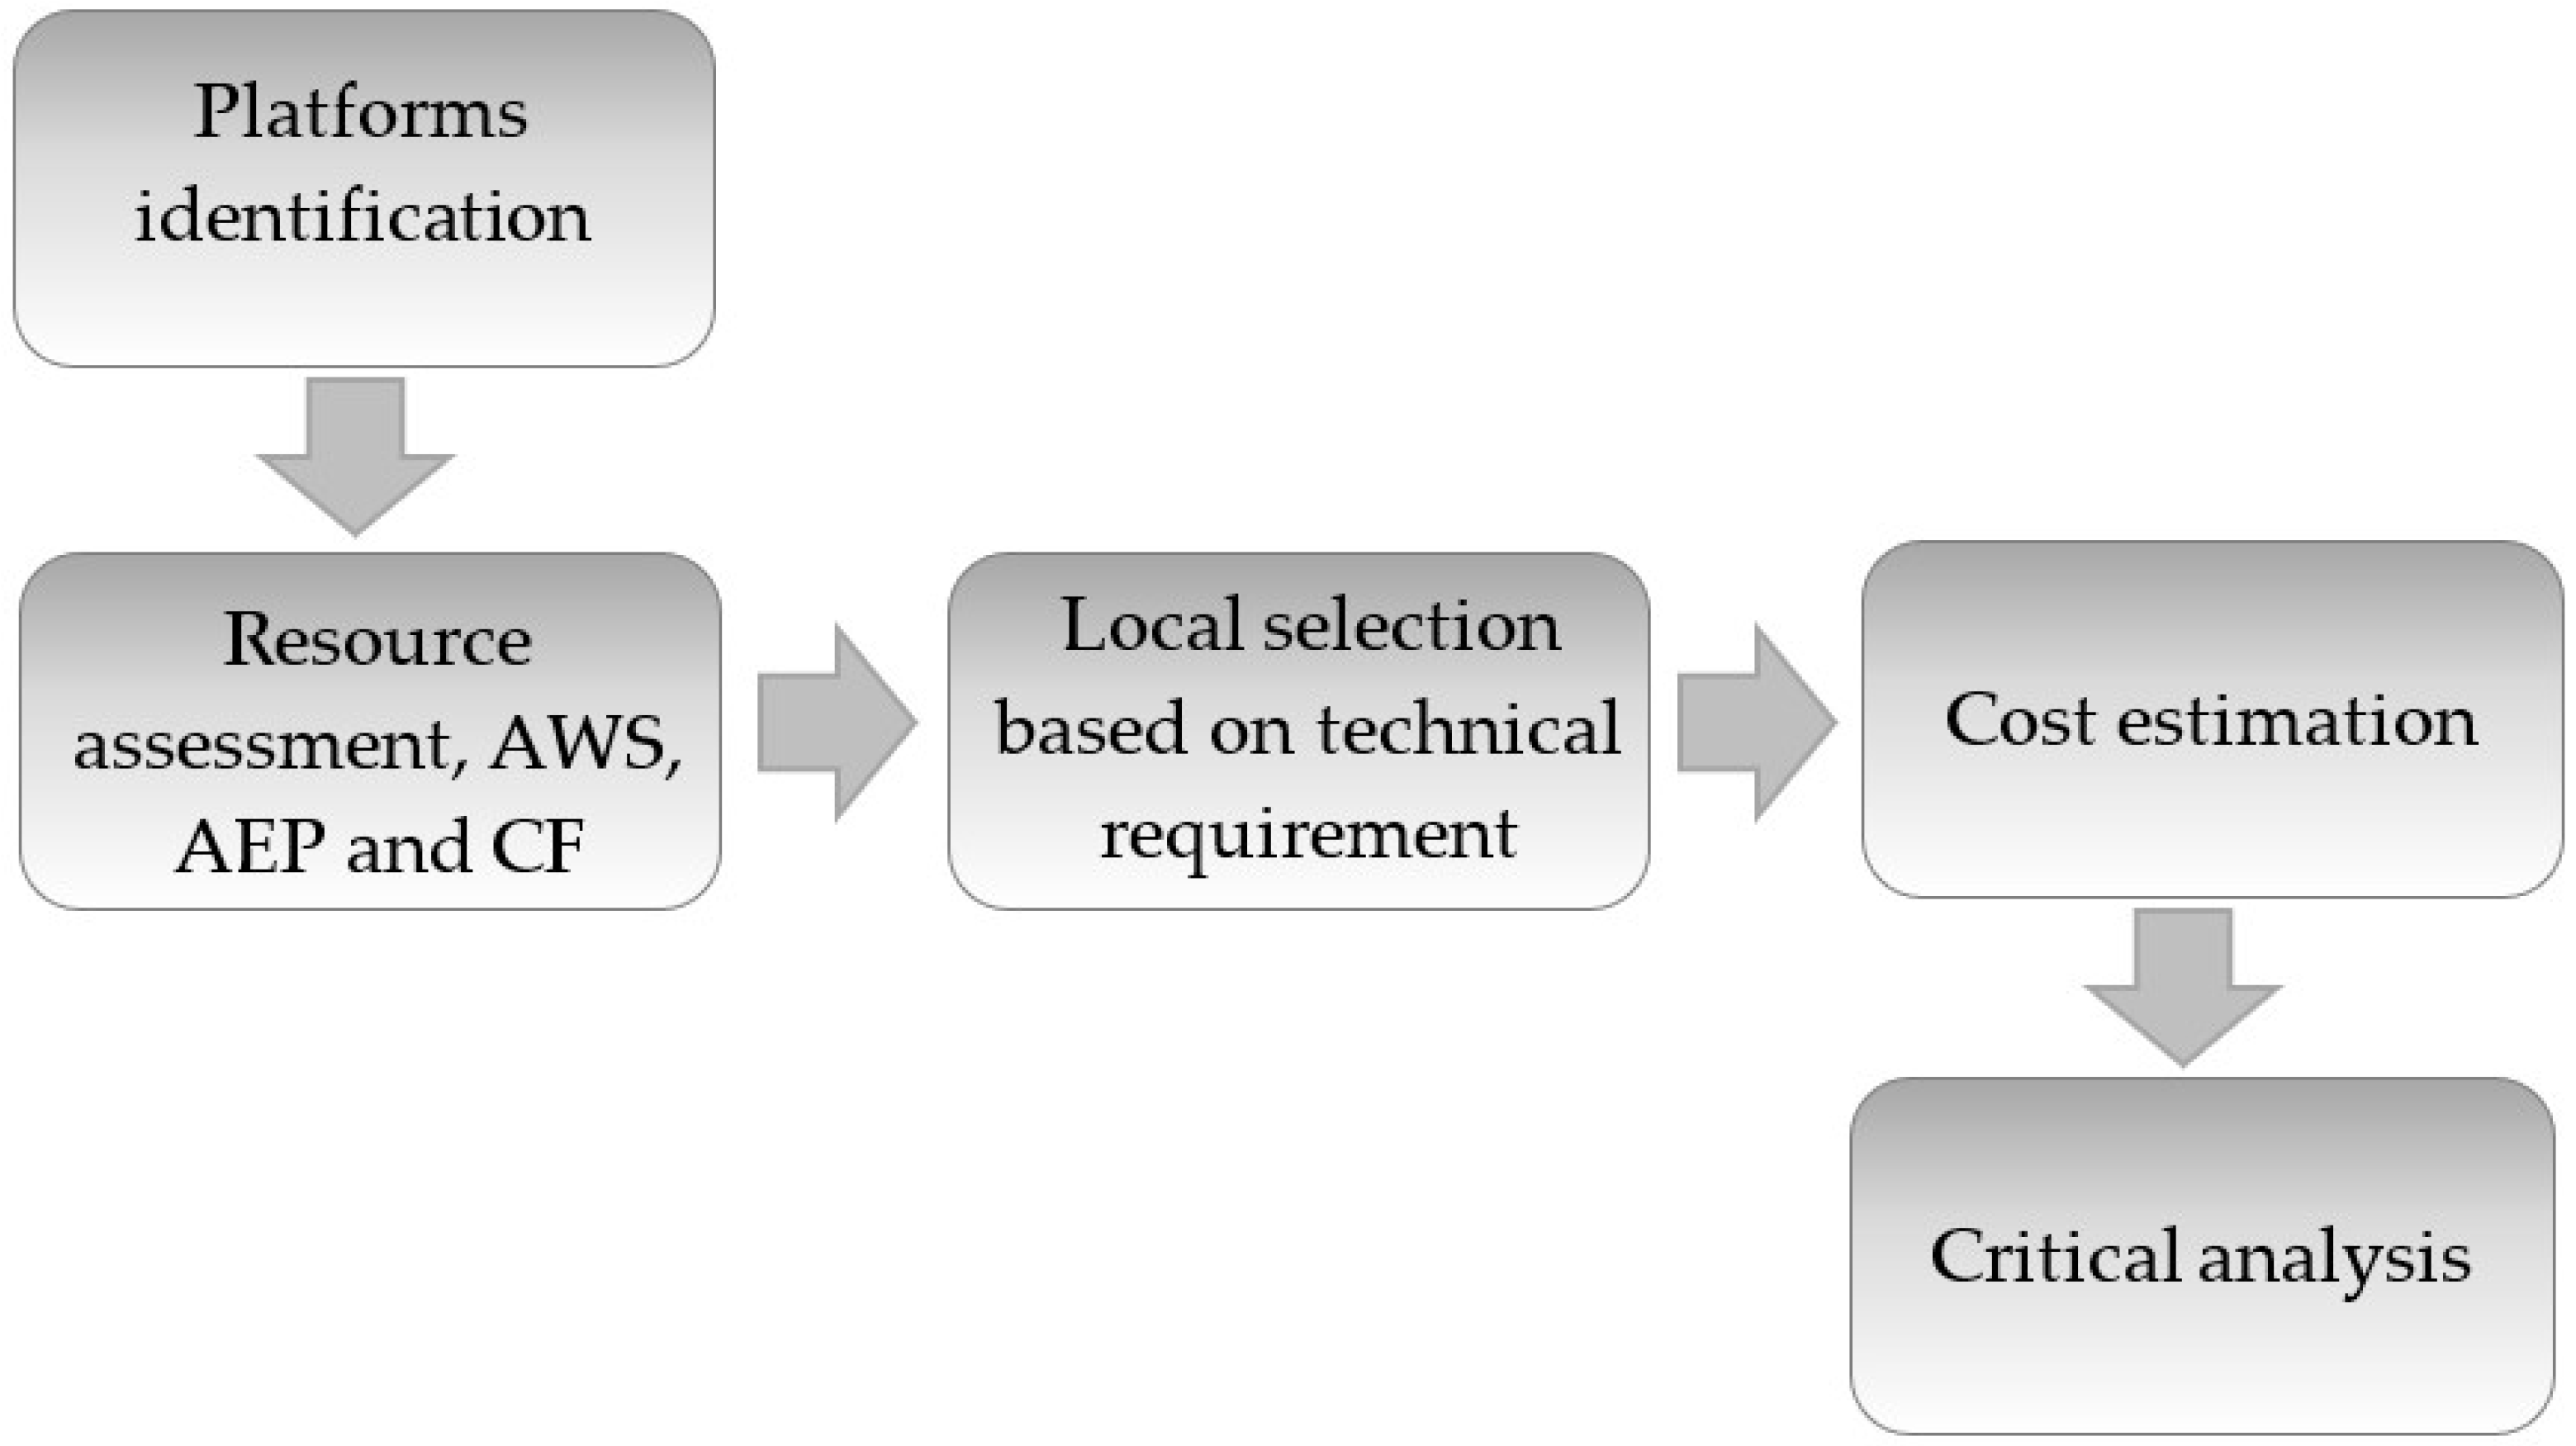
In this section, a cost analysis is carried out, focusing on the infrastructure removal of offshore O&G facilities. Additionally, we analyze the cost of offshore wind facility installation. The two cost-analyses complement each other and can be compared to forecast the economic viability of O&G facility conversion into renewable energy projects. To conduct this comparison, the selected research approach includes the analysis of the costs relative to two options for a specific Brazilian O&G region; that is, infrastructure removal versus offshore wind project development.
Based on the decommissioning cost structure model developed by the Oil and Gas Authority (OGA). The Oil and Gas Authority’s role is to “regulate and influence the oil, gas, and carbon storage industries. We help drive North Sea energy transition, realizing the significant potential of the UK Continental Shelf as a critical energy and carbon abatement resource. We hold industry to account on halving upstream emissions by 2030”; the North Sea Transition Authority is a business name of the Oil and Gas Authority; source, “NSTA what we do” (available at https://www.nstauthority.co.uk/about-us/our-mission-statement/; accessed on 30 August 2022), the largest component is well abandonment (plug and abandonment; P&A), representing 48% of total decommissioning spends. This is followed by owner costs, encompassing project management, running facilities, and operational costs (14%); subsea infrastructure removal, including site remediation and ongoing monitoring (14%); topside, including making safe, preparation, and removal (13%); subsea infrastructure removal 9%); and finally, onshore recycling and disposal (2%) [32]. Infrastructure removal therefore represents around 38% of the overall decommissioning expenditure, while P&A represents 48%, and the remaining 14% of costs are owner expenses throughout the whole project. OGA and Caprace [33] utilize the following terms: well abandonment, site remediation, making safe, topside, and subsea infrastructure. Their model is based on approximations of a standard case (fixed platform) in the North Sea, and it is important to adapt the model according to each subsea production field inventory (semi-submersible or floating rigs, number of wells, length of pipes, subsea equipment) and local specifics (economy, requirements, resources) [32].
In 2017, the ANP commissioned a study on the regulatory regime of O&G field abandonment activity to the British government, as part of the “Oil & Gas Decommissioning—From the UK’s North Sea to the Brazilian Atlantic” project, which aimed to identify the UK’s experience and regulatory best practices, technical and safety procedures, and environmental impacts associated with the decommissioning of oil and natural gas exploration and production facilities [34]. In this study, conducted by English consultancy ARUP, the method of sequencing the decommissioning activities consisted of an analytical structure used as a starting point and base reference for the design and structuring of decommissioning projects, establishing the subdivisions and alignment of activities, thus allowing the resources, costs, scope, and time of these activities to be better estimated, budgeted, and planned, as is traditionally performed in project management. Figure 3 exemplifies a typical decommissioning activity sequence on field abandonment.
There is a shortage of Brazilian decommissioning economic data, notably due to the lack of execution, academic studies, and publications; nonetheless, the ANP disclosed reports showing a long-term-estimated (low accuracy—20-year timeframe) sum of 9.1 billion USD. The conversion rate from Reais to US Dollars performed for all figures using the Brazilian Central Bank exchange rate is USD 1 = BRL 5.5; source, https://www.bcb.gov.br/conversao (accessed on 10 October 2021) in necessary investments between 2020 and 2040, equivalent to USD 454.5 million per year in a hypothetical even distribution (although it is known that the total estimated cost is not evenly distributed across the years, it is important to highlight that this cost changes proportionally to the yearly demand), for the removal of 100 O&G topsides and corresponding subsea infrastructures [35]. Additionally, the KINCAID long-term market study estimated expenses of USD 7.6 billion between 2020 and 2040, or 381.8 million USD/year, for the decommissioning of a similar number of facilities [36]. Although neither study shows the breakdown costs at the infrastructure removal and P&A levels, showing essentially overall decommissioning expenditures derived from high-level estimates, the figures are high enough to be relevant to the Brazilian sea economy. As shown by Carvalho [37], the sector of services at sea contributed 11 billion USD to the sea-related GDP in 2015. Considering field abandonment as part of the family of services at sea results in an increase of between USD 381.8 and 454.5 million, which is up to 4% of the financial volume of services at sea per year, showing the relevance of the forecasted economic growth through decommissioning activities to the sea-related GDP in the Brazilian economy.
The mid-term-estimated decommissioning economic data from oil field operators can be gathered from the ANP report; field operators disclose the main field activities through an Annual Work Plan, where the decommissioning activity cost estimates are also described, with the operators’ expense decommissioning forecasts becoming public. For a 5-year timeframe, overall expenditures of USD 5.6 billion for subsea field decommissioning in Brazil could be estimated given the figures for each year and cost breakdown. For instance, for the year 2021, operators reported 300 million USD for infrastructure removal out of 900 million USD for overall P&A decommissioning expenses for the removal of 17 topsides and their respective subsea infrastructures. In Scheme 2, the costs estimated by operators from 2021 to 2025 are shown [38].
By analyzing the mid-term figures for infrastructure removal, a value of 17.6 million USD can be obtained for infrastructure removal as an average value for the decommissioning costs of each of the 17 topsides and their respective subsea infrastructures (although it is known that the total estimated cost is not evenly distributed across all the infrastructures to be removed, it is important to highlight that this cost changes according to each specific subsea oil field design and platform specification).
Lastly, we consider a cost reference regarding the decommissioning process of the Cação field, composed of three interconnected, small, fixed topsides, PCA-01, PCA-02, and PCA-03, installed at a 19 m water depth, whose production started in August 1978. The operator confirmed the end of the concession contract in 2015 [39] due to the negative cash flows of the project. Within the end of production, the operator proceeded to the early return of the concession, formalized to ANP on 17 March 2014 [40,41,42]. In 2019, the operator of the Cação field announced the result of the bidding (number 7002423988) for infrastructure removal, and the winning value was USD 38.3 million [41,43]. The values of the other proposals in this bidding are shown in Table 1. The result of this bidding set the cost of the infrastructure removal of the Cação field, including small rigs in shallow water, topside, and substructures, at USD 12.7 million.
Currently, the Brazilian coast has 40 concessions that are responsible for most of national production and are located at different depths in the ocean across 253 fields [40]. The existing offshore infrastructures in Brazilian jurisdictional waters are shown in Scheme 3, which also highlights the production by basin of all offshore fields in 2021, as well as the number and type of platforms in each basin, demonstrating the concentration of facilities in Brazil’s southeastern cluster (states of São Paulo, Rio de Janeiro, and Espírito Santo) and northeastern cluster (states of Ceará and Rio Grande do Norte).
Table 2 shows, based on the information collected from governmental agencies and the literature [33,43,44,45,46,47,48,49,50,51,52,53,54], that, at the end of 2020, there were 86 platforms installed on the continental shelf, of which 44 were in some stage of the decommissioning process, classified as follows: approved, 4 units; under analysis, 5 units; forecasted, 18 units; and possible, 17 units [35,43,44].
Repurposing involves considerable engineering effort and investment; it also works as a temporal and financial barrier to full removal and disposal once it moves the decommissioning expenses and efforts to the years to come, generating further revenue for the project, adding replacement energy gains, and shrinking offshore installation costs for operators of renewable energy source plants [30]. Another important consideration in decommissioning-postponing campaigns regards overall emissions; if we consider that all current efforts towards industry de-carbonization will be successful, leading to a less carbon-intense industry, we can assume that future emissions generated due to the removal of the same facilities will be lower than the emissions that would be generated now, resulting in overall lower net GHG emissions to the atmosphere throughout the years, as well as the postponing of residual carbon release to the future. This scenario forecasts a future in which hydrogen (recognized as a promising and attractive energy carrier that could be used to de-carbonize the sectors responsible for global warming [55]), batteries, or other sustainable alternatives to fossil fuels propel vessels, and in which final disposal facilities may use environmentally friendly technology in an energy matrix that is less carbon-dependent than the present industry setup.
The conversion of structures into renewable energy facilities can take place for the sake of the economic returns of the operators, the pursuit of long-term sustainability goals, and energy supply needs, taking advantage of ducts for the transportation of products to places of consumption [11]. Figure 4 shows the traditional abandonment model alongside options for repurposing as renewable energy production units, as well as some options in both modes for end-of-life proceedings for O&G installations at sea.

2.3. Methodology

In this section we address the technical viability of repurposing O&G platforms as wind energy harnessing units. Additionally, we present a cost estimation of the process and compare it with the costs of platform decommissioning. Figure 5 shows the flowchart of the study process. First, we identified all the platforms that are to be decommissioned, based on the information presented by the ANP (Table 2). Subsequently, through a resource assessment study, we determined the wind velocity, annual energy production, and capacity factor of a 15 MW wind turbine installed on each platform. Then, we excluded locations that did not meet the technical requirements for offshore wind power production, and we employed a simplified cost estimation process to calculate the levelized cost of energy of each wind turbine. Finally, we compared the results to the decommissioning process. Through a critical analysis, we discuss different aspects, including economy, policies, and regulations regarding decommissioning and platform repurposing.

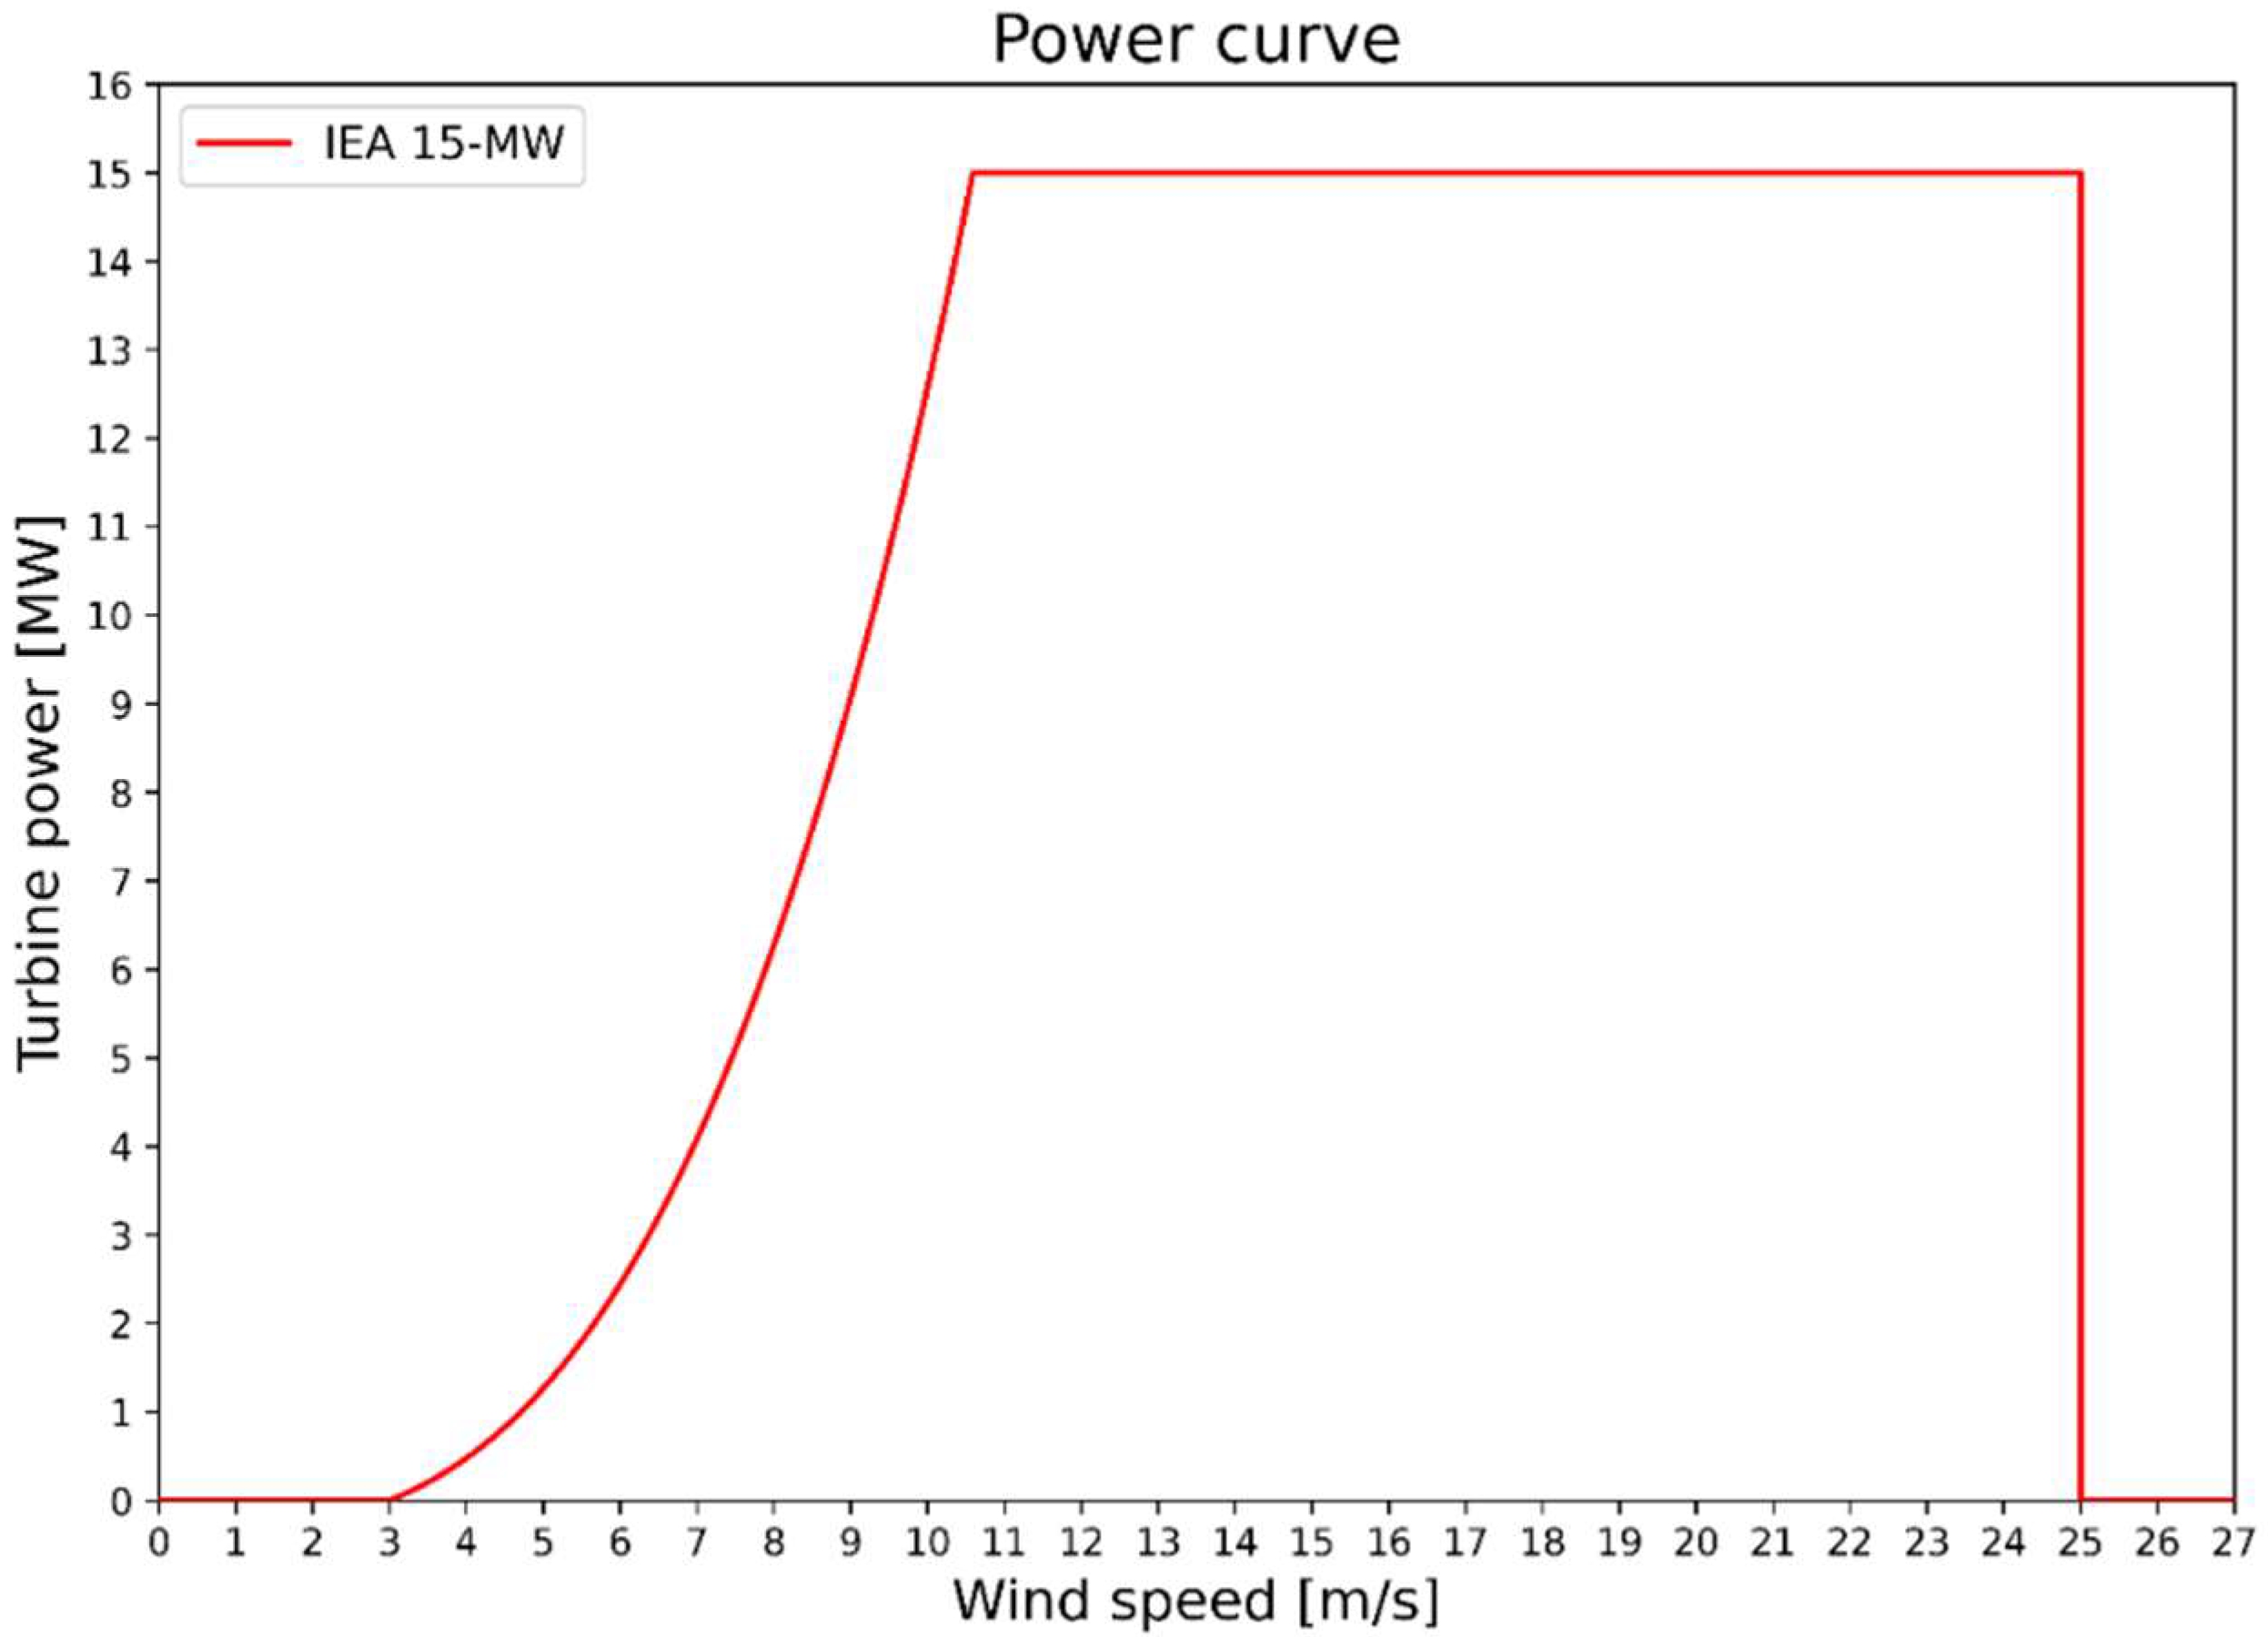
2.3.1. Resource Assessment

To assess the wind resource potential at selected points, we utilized wind speed data at a height of 100 m from the fifth-generation European Centre for Medium-Range Weather Forecasts (ECMWF) atmospheric reanalysis (ERA5) [56]. The ERA5 global model has a horizontal resolution of 0.25° × 0.25°, which is approximately 27.75 km, and an hourly temporal resolution with 137 vertical model levels. The period of the wind data used covers the year 2019. Horizontal-axis wind turbines (HAWTs) are currently the most common turbine type. The HAWT assembly encompasses a rotor and blades fitted to the hub. The shafts connect the hub gearbox and the generator. This design comes in a range of diameter sizes, from 2.5 m (1 KW) for home uses to more than 100 m (>10 MW) for offshore applications [57]. The annual wind speed (AWS) average of approximately 6.5 m/s or higher sets the limit for the economic viability of wind projects [57].
As the hub of the wind turbine employed is at 150 m, the wind speed needs to be extrapolated from the native 100 m height through the log law using Equation (1) [58,59]. Some considerations are necessary, such as the neutral stability of the atmosphere and a constant ocean surface roughness coefficient of Z* = 0.0002 m.
v   Z =   v ref Z Z * Z ref Z *
where v(Z) represents the calculated wind speed and vref is the wind speed at Zref obtained from the dataset.
The IEA 15 MW [60] HAWT with three blades presents values of 3.0, 10.59, and 25 m/s for cut-in, rated speed, and cut-off, respectively, as shown in Scheme 4.
To model the wind temporal distribution, the Weibull probability density function is defined. The shape (k) and scalar (c) parameters are calculated through Equations (2) and (3), respectively. Thus, the Weibull density probability function, f(v), is estimated using Equation (4) [58,59].
k   = σ v ¯ 1.086
c   = v ¯ Γ 1 + 1 k
f v = k c v c k 1 exp v c k
where f(v) indicates the probability of a determined wind speed ( v ¯ ) occurring.
Equation (5) is used to calculate turbine production through the turbine power curve and Weibull function integrated across the wind-speed spectrum. Then, using Equation (6) and considering a one-year period, we obtain the annual energy production (AEP). Thus, using Equation (7), we can determine the capacity factor (CF) that represents the technical feasibility.
P t = 0 P v f v dv
AEP   = P t T
CF   = AEP P n T
where v is the mean wind speed and T is the number of hours in one year (8760 h).

2.3.2. Cost Estimation

To analyze the feasibility of wind turbine installation, as part of the decommissioning proposal, the levelized cost of energy (LCOE) is calculated. The LCOE reproduces the cost per unit of produced energy considering the total capital expenditure (CapEx), the annual cost of operation and maintenance (OpEx), and the annual energy production, including possible losses [61,62]. The LCOE can be calculated using Equation (8).
LCOE   = CapEx + t = 1 n OpEx t 1 + r t   t = 1 n Annual   Energy   Production t 1 + r t
where t is each year in the lifetime, n is the lifetime of 20 years, and r is considered equal to 4%.
To install a single turbine on a platform, some features directly affecting the final energy cost must be considered. First, there is no necessity of works on the substructures prior to wind power facilities, which decreases the installation costs. However, the operation of wind turbine installation loses efficiency, as it requires, for example, a vessel trip to transport a single unit. The electrical interconnection between the turbines required in a wind farm is disregarded in this paper. In this study, we propose two scenarios: the first without energy exportation to the shore and the second considering energy exportation to the shore. In the following sections, we present the steps necessary to calculate the CapEx and OpEx.
One turbine is placed on each production unit. Some considerations are made in respect of production losses, such as 95% availability, 7% aerodynamic losses, 1% electrical losses, and other losses (3%) associated with the gross annual production [63].

2.4. Capital Expenditure

Project development: This step consists of all activities preparatory for project development (PD). The value of 184,050 USD/MW is considered for the risks, resources, environmental impacts, and other factors [64,65,66,67,68,69,70,71,72,73,74].
Turbine and tower: A mean cost of 1,441,725 USD/MW is applied to represent the turbine and tower (TT) costs in the projects [64,65,66,67,68,69,70].
Offshore installation: Despite the reduced costs to install a single turbine, the process loses efficiency; for example, because the vessel trip could carry up to nine units. Equation (9) is used to calculate the infrastructure cost of the offshore installation (OI) process.
Installation USD MW = CPD   . day transport   +   day install     Turbine   Capacity   MW
where 〖day〗 (install) is assumed to be three days spent for installation. Equation (10) estimates 〖day〗 (transport).
day transport   = 2   .   D   86 , 400   .   V
where D is the distance from the coast (m) and V is the speed of the vessel, assumed to be 7.2 m/s [63] or 14 kn.
The cost per day (CPD) represents the value of the vessel responsible for installation and is considered to be USD 306,819 [71]. Currently, the CPD plus fuel of an offshore support vessel (OSV) through the last tender on the Brazilian market was USD 144,757 [72].
Electrical installation: Infrastructure electrical installation (EI) is considered to have a mean value of 415,208 USD/MW [64,68,69,70,73].
Export cables: We consider two scenarios for export cables (ECs): energy transferred to a nearby offshore project and energy transmitted to the land power grid. A cost of export cables of 719 USD/m is added to the projects [74,75].

2.5. Operational Expenditure

Operation and maintenance: With the distance from the port (D), we can calculate the cost of operation and maintenance (O&M) using Equation (11) [76].
O&M = 0.3132D2 + 171.72D + 54,448.2
Contingency: To anticipate increases in the offshore project budget that can occur during its lifetime of construction and operation, we consider a contingency rate of 10% of the total CapEx budget [77].
Insurance: This is essential in an offshore project due to the risks involved. A value of 53,600 USD/MW is considered to cover these risks in all phases of the project [64,69,73].

3. Discussion

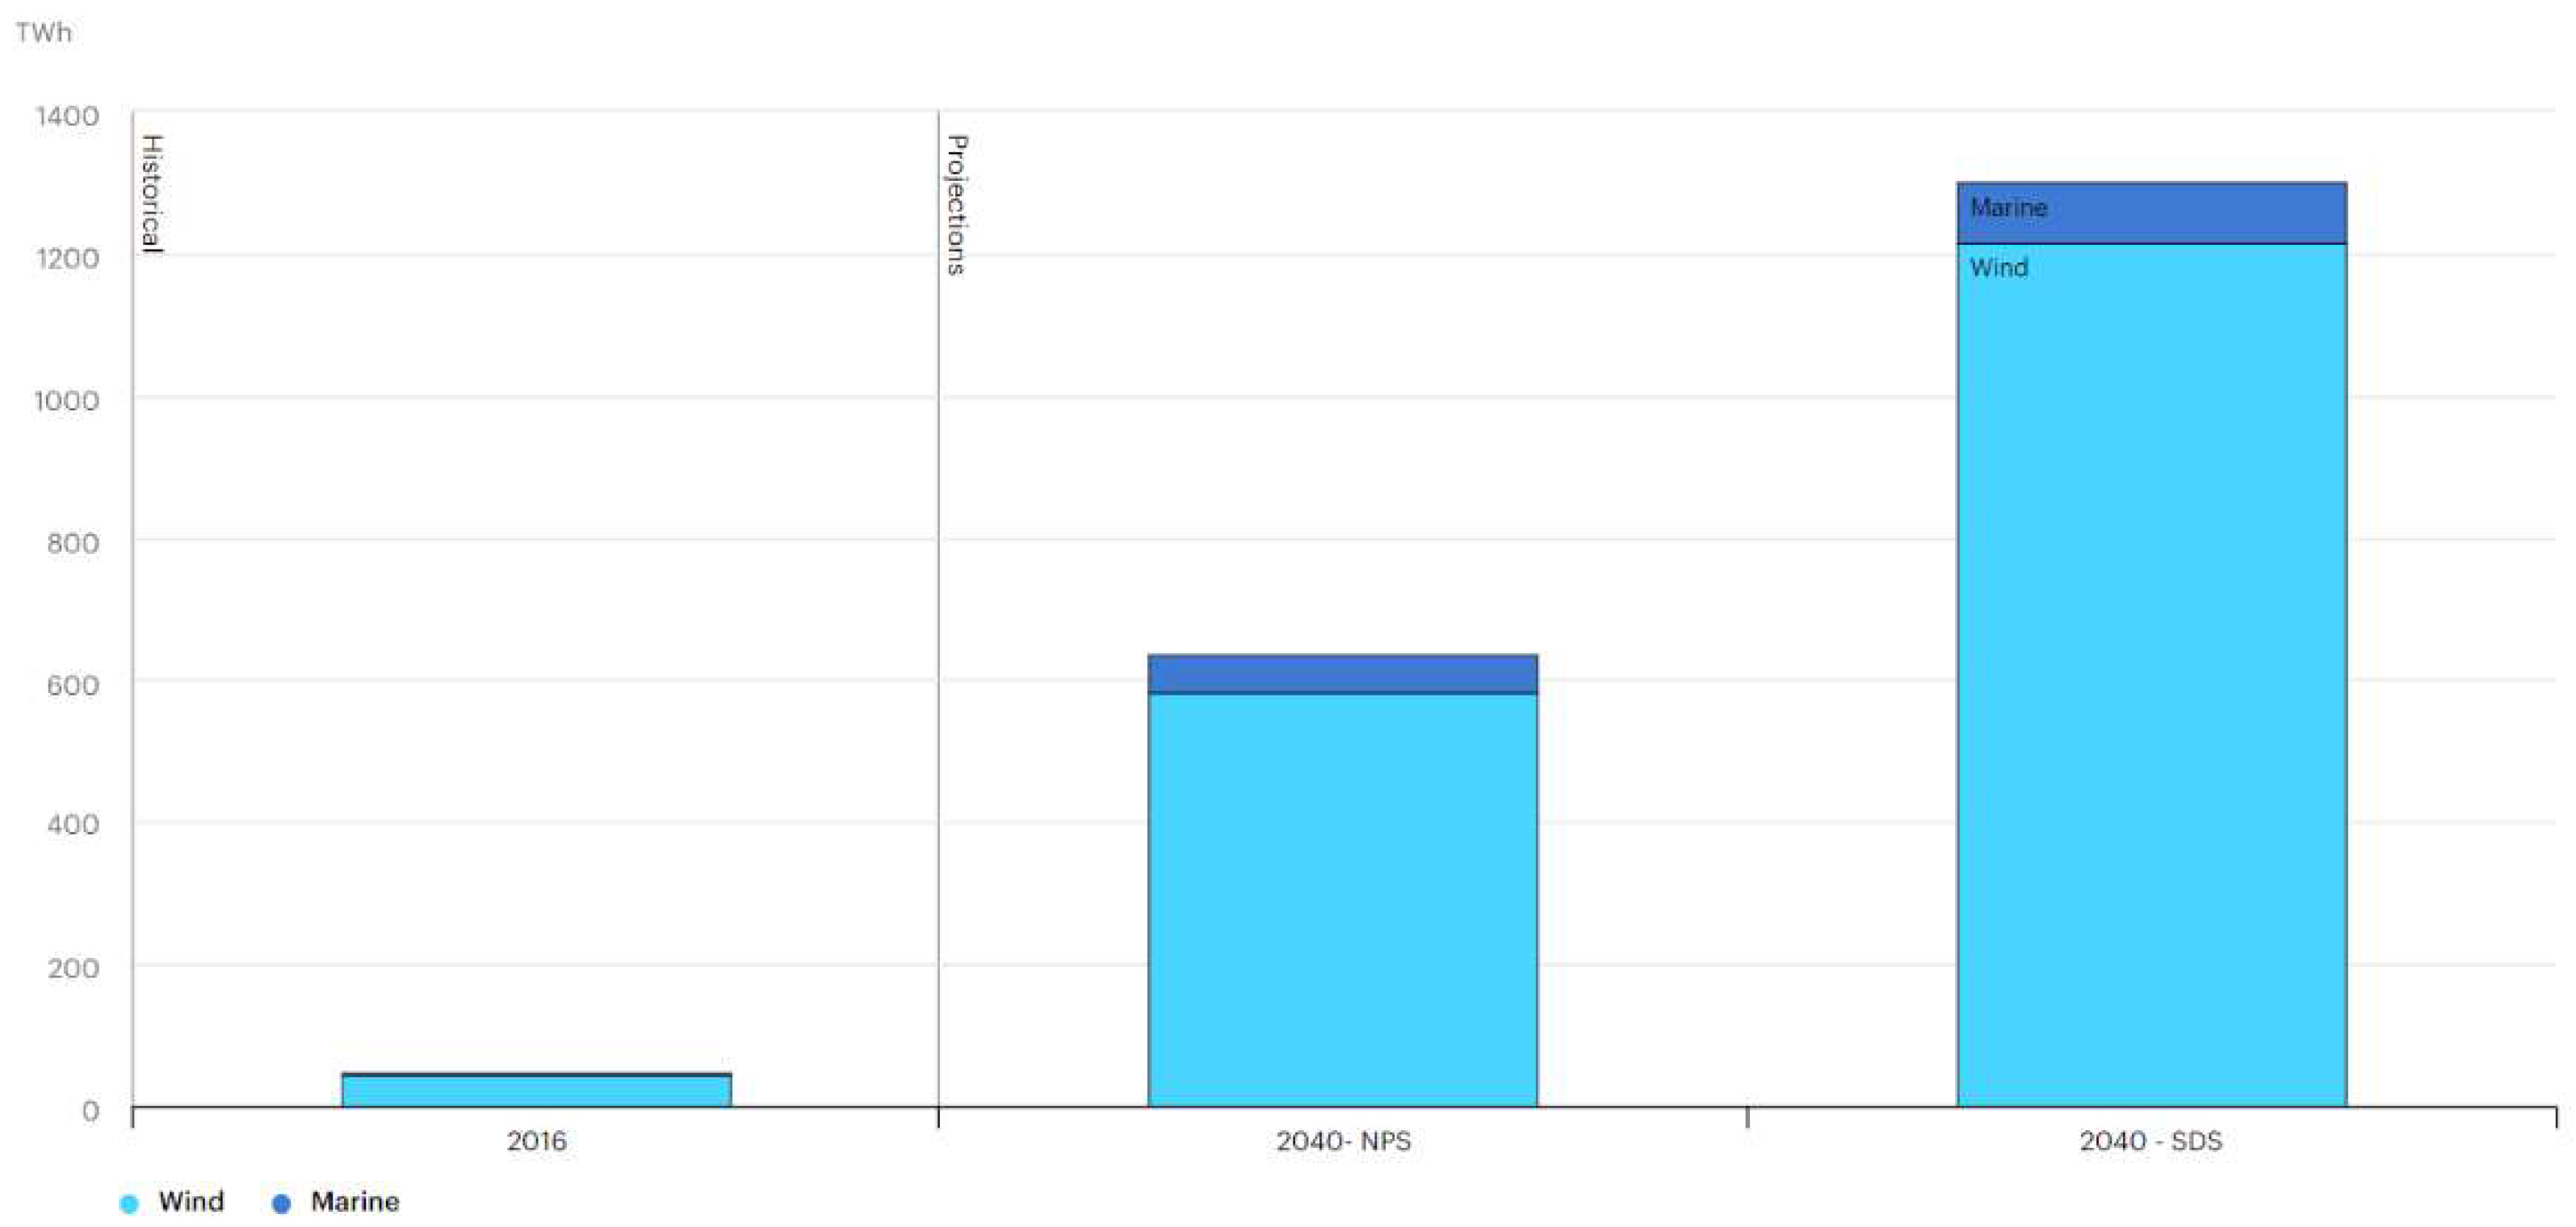
3.1. Suitability of Sites to Be Decommissioned for Offshore Wind Projects

Many aspects are involved in the selection of an O&G site; a detailed analysis before final investment decisions is required, allowing commencement of the project (i.e., reservoir traits, distance from shore, water depth, soil type, subsea geotechnics, etc.). Using similar proceedings and by adopting data from Brazilian O&G infrastructure sites undergoing decommissioning, as detailed in Table 2, we can set specific sites according to the main environment characteristics related to wind power generation, such as AWS, AEP, and CF, as well as distance from the shore and water depth, in order to conduct comprehensive visualization and analysis to both select the most promising sites to be converted to wind power generation units and exclude the unviable ones from the study.
AWS criterion: By setting 6.5 m/s as the lower limit for the economic viability of an offshore wind power project, the analysis shows that the sites located in the Sergipe Alagoas (SEAL) basin, with AWSs from 6.18 to 6.44 (Piranema Spirit, PRB-1, PCB-2, PCB-3, PCM-4, PCM-5, PCM-6, PCM-8, PCM-10, PDO-1, PDO-2, PDO-3, PGA-2, PGA-4, PGA-5, PGA-7, and PGA-8), and the ones located in the Espirito Santos basin, with an AWS of 5.94 (PCA-1, PCA-2, PCA-3, and Capixaba), are recognized as unattractive from the economic perspective for conversion into renewable energy facilities, while the Potiguar (8.29 to 8.97) and Campos basins (8.03 to 8.29) meet the AWS criterion. Scheme 5 shows sites to be decommissioned along with data relevant to the design of offshore wind power projects.
Substructure suitability criterion: The analysis focuses on the conversion of fixed structures (steel jacket, concrete base, or caisson) by only considering the locations that meet the AWS criterion. The Potiguar basin is noted as only having fixed substructures in a total of 11 sites (PARB-3, PPE-3, PBIQ-1, PAG-1, PAG-2, PAG-3, POUB-1, POUB-2, PARB-1, PART-2, and PCIO-1), while Campos basin has none (P-7, P-12, P-15, P-18, P-19, P-20, P-26, P-32, P-33, P-35, P-37, P-47, FPSO Rio de Janeiro, FPSO Brasil, FPSO Rio das Ostras, and FPSO Marlin Sul are all floating units—FSO, FPSO, or semi-submersible). Floating wind farm projects require an entirely different analysis in terms of offsetting wind power project costs against decommissioning costs; for this reason, floating wind units are not considered in this article, though the Campos basin units show great energy potential in terms of AWS. The most suitable sites to be decommissioned and in which to install wind power facilities are the 11 sites located in the Potiguar basin, due to the AWS and fixed base criteria.
Maritime criterion: The distance from shore support is another important factor, especially considering installation, fuel, and the hire cost of vessels and port facilities to transport and install offshore wind facilities; from the factory or port of arrival to the final sea locations, the logistics must be carefully planned.
The port of operation needs to be part of the financial assessment, since it needs to be capable of operating with offshore support vessels (OSVs) large enough to carry offshore turbines, pedestals, and blades, as well as laying electric cables and performing offshore lifting and assembly. This is where draft and port facilities become relevant, particularly when leaving ports fully loaded. Port evaluation also takes into consideration road access, due to the transportation of odd-sized cargo to the docks before lifting it to the vessel deck. The closest ports to the Potiguar cluster of sites to be decommissioned are Guamaré and Areia Branca, both with a low draft of around 2 m [78]; therefore, they are not suitable as land bases for offshore wind power projects. Although more distant, the ports of Fortaleza (13 m draft, 260 km from site to be decommissioned) and Natal (11 m, 232 km from site to be decommissioned) have sufficient draft [78], good road access, and heavy-lift capabilities, making them suitable land bases for such projects. Scheme 6 shows ports and average distances to the Potiguar cluster of sites to be decommissioned.

3.2. Offshore Wind Project Cost Analysis

Potiguar CapEx calculations consider units of 15 MW HAWTs installed at sea and take into consideration PD, TT, OI, EI, ECs, contingency, and insurance installation costs in two scenarios: a 1-turbine project, considering only 1 turbine; and an 11-turbine project, considering 1 turbine in each of the 11 turbine installation sites.
PD is calculated as the cost per MW times the total project MW, and TT and EI cost calculations follow the same criteria. Contingency is obtained by adding 10% to PD, TT, OI, EI, and ECs. Insurance per MW times total project MW is then added to the total project cost. OI reflects the updated Brazilian CPD, with a distance of 232,000 m between the Potiguar site to be decommissioned and the Natal port and a 3-day installation period per unit assembly, executed by a vessel capable of transporting and installing up to nine units per voyage at a transit speed of 14 kn.
The two EC options are offshore supply, as an electric power source for nearby O&G projects, and land supply, consisting of connecting the wind projects to the land electric grid. The distance is determined according to the relative distances between each specific unit to be decommissioned and nearby land. For the 1-turbine wind project, the distances assumed are 18,000 m from land and 6000 m from nearby offshore projects, while for the 11-turbine wind project, these are assumed to be a total of 83,000 m from land and 73,000 m from nearby offshore units, as shown in Scheme 7. The summary of the CapEx for wind power projects in the two scenarios is presented in Table 3.
Table 3. CapEx for offshore wind projects in Potiguar sites to be decommissioned.
1-Turbine ProjectUSD/MWHAWTMW/TurbinemContingencyInsurance/MWTotal Cost
Project developmentUSD 184,050115 10%USD 2680.00 USD 3,036,825
Turbine and towerUSD 1,441,725USD 23,788,463
Electrical installationUSD 415,208USD 6,850,932
Offshore installationUSD 36,149USD 596,459
USD/m
Onshore supply el. cablesUSD 719 18,000USD 14,236,200
Offshore supply el. cablesUSD 719 6000USD 4,745,400
One 15 MW HAWT—land supply USD 48,549,078
One 15 MW HAWT—offshore supply USD 39,058,278
11-Turbine ProjectUSD/MWHAWTMW/TurbinemContingencyInsurance/MWTotal cost
Project developmentUSD 184,0501115 10%USD 2680.00 USD 33,405,075
Turbine and towerUSD 1,441,725USD 261,673,088
Electrical installationUSD 415,208USD 75,360,252
Offshore installationUSD 36,149USD 596,459
USD/m
Onshore supply el. cablesUSD 719 83,000USD 65,644,700
Offshore supply el. cablesUSD 719 73,000USD 57,735,700
One 15 MW HAWT—land supply USD 39,738,343
One 15 MW HAWT—offshore supply USD 39,019,343

4. Conclusions

In this study, the cost of installation removal and the CapEx for wind power projects were found to be of the same magnitude. Specifically, the discount rate relative to the installation of wind power projects offsetting the removal costs is between 32% and 45% when assuming the range of decommissioning costs to be from USD 12.7 million to USD 17.6 million, against the required USD 39 million CapEx for wind power projects. Therefore, the latter represents a very attractive alternative from an investment perspective when compared with an offshore wind power project starting from zero.
The industry is currently carbon intensive, with vessels, trucks, ports, machinery, and facilities in general being mostly driven by hydrocarbon engines. Considering the worldwide efforts to reduce GHG emissions and the emergent need to limit the temperature rise through international initiatives such as the United Nations’ Sustainable Development Goals (SDGs) (https://sdgs.un.org/goals, accessed in 6 June 2022), Conference Of the Parties (COP) (https://unfccc.int/process/bodies/supreme-bodies/conference-of-the-parties-cop, accessed on 6 April 2022), and IMO GHG Strategy (https://www.imo.org/en/MediaCentre/HotTopics/Pages/Reducing-greenhouse-gas-emissions-from-ships.aspx, accessed on 6 April 2022) pushing the industry towards a less carbon-based matrix, one can propose that moving “decommissioning emissions” to the future would benefit the environment and support de-carbonization initiatives. If the same efforts are carried out in a less carbon-based future, this would result in lower overall emissions to the atmosphere.
In economic terms, the repurposing of offshore facilities for new energy projects replacing the decommissioning of facilities supports local employment and social development by maintaining offshore activity, where Brazil holds great potential. Despite the need for the regulatory development of offshore renewable power activity [80], there are several wind farms under environmental authority evaluation in Brazil [81], proving the economic interest in this energy sector and Brazil’s potential in terms of offshore wind energy. Ideally, such regulatory developments should deliver an investment-friendly regulatory framework, helping the local renewable industry to prosper by attracting foreign investment and fostering technology and human capital, while underpinning industry de-carbonization. Solar panels, a well-known renewable energy source, were not addressed in this article due to the limits of current research. However, considering the relevance of solar panels for the decarbonization of the energy sector and for the energy matrix as a whole, we consider the extension of current research towards benchmarking solar energy, as well as wind farms, as a potential solution for old O&G fields at sea, including the output issue and the production scale of different renewable energy sources.
One of this article’s most relevant aspects is the analysis of a specific region of Brazil, including the addressing of the decommissioning aspect and potential renewable projects, with both being feasible solutions, expanding knowledge in alignment with market economic assumptions. The assessment of the potential synergy between offshore wind power projects and decommissioning requirements, using an economically driven approach, embodies the novelty of the research method proposed by the authors, while at the same time contributing to both the international debate and the expansion of knowledge relevant to the energy transition, presenting a potential new dialogue between the fossil fuel and renewable energy sectors.
By giving new life to offshore O&G platforms due to be decommissioned, Brazil can promote the advancement of offshore renewable energy in line with the ongoing energy transition aimed at mitigating greenhouse gas emissions in the energy sector.

Author Contributions

Conceptualization, J.B. Methodology, J.B. and M.S. Validation, T.S. and S.E. Formal analysis, M.S. Investigation, J.B. and T.S. Resources, J.B., T.S. and M.S. Data curation, J.B. and M.S. Writing—original draft preparation, J.B., T.S., M.S., C.S. and L.F.A.T. Writing—review and editing, T.S., C.S. and L.F.A.T. Visualization, C.S. Supervision, J.B., T.S., M.S. and S.E. Project administration, J.B. and M.S. Funding acquisition, J.B. All authors have read and agreed to the published version of the manuscript.

Funding

This research received no external funding.

Institutional Review Board Statement

Not applicable.

Informed Consent Statement

Not applicable.

Acknowledgments

The 3rd and 6th authors acknowledge the support from Carlos Chagas Foundation—FAPERJ to the research project Wave Energy Converters for Electrical Generation and Seawater Desalination—Contract No. E-26/210.796/2021 (262842).

Conflicts of Interest

The authors declare no conflict of interest.

References

  1. Pedrolo, C. Hydrocarbons. Available online: http://www.infoescola.com/quimica-organica/hidrocarbonetos (accessed on 6 June 2022).
  2. Petrobras. Our History. Available online: https://petrobras.com.br/en/about-us/our-history/ (accessed on 6 June 2022).
  3. Martins, C.F. The Decommissioning of Offshore Production Structures in Brazil, Monograph-Postgraduate Course in Environmental Engineering; Federal University of Espírito Santo: Vitória, Brazil, 2015. [Google Scholar]
  4. ANP. Resolution 817/2020. Available online: https://www.in.gov.br/web/dou/-/resolucao-n-817-de-24-de-abril-de-2020-254001378 (accessed on 6 June 2022).
  5. Braga, J. Demobilization of the Field of Petroleum in Brazil: Lessons Learned from the North Sea. Master in Maritime Studies Dissertation, Naval War College, Rio of Janeiro, Brazil, 2018. Available online: https://www.repositorio.mar.mil.br/handle/ripcmb/844617 (accessed on 6 June 2022).
  6. Shadman, M.; Silva, C.; Faller, D.; Wu, Z.; Of Freitas Assad, L.P.; Landau, L.; Levi, C.; Estefen, S.F. Ocean Renewable Energy Potential, Technology, and Deployments: A Case Study of Brazil. Energies 2019, 12, 3658. Available online: https://www.mdpi.com/1996-1073/12/19/3658/htm (accessed on 6 June 2022). [CrossRef] [Green Version]
  7. Gustavson, M.R. Limits to Wind Power Utilization. Science 1979, 204, 13–17. [Google Scholar] [CrossRef]
  8. Li, L.; Taeihagh, A. An in-depth analysis of the evolution of the policy mix for the sustainable energy transition in China from 1981 to 2020. Appl. Energy 2020, 263, 114611. [Google Scholar] [CrossRef]
  9. Kalair, A.; Abas, N.; Saleem, M.S.; Kalair, A.R.; Khan, N. Role of energy storage systems in energy transition from fossil fuels to renewables. Energy Storage 2020, 3, e135. [Google Scholar] [CrossRef] [Green Version]
  10. IEA. International Energy Agency. Net Zero by 2050: A Roadmap for the Global Energy Sector. Available online: https://www.iea.org/reports/net-zero-by-2050.2021 (accessed on 6 June 2022).
  11. Leporini, M.; Marchetti, B.; Corvaro, F.; Polonara, F. Reconversion of Offshore Oil and Gas Oilrigs into Renewable Energy Sites Production: Assessment of Different Scenarios. Renew. Energy 2019, 135, 1121–1132. Available online: https://www.sciencedirect.com/science/article/abs/pii/S0960148118315209 (accessed on 7 July 2022). [CrossRef]
  12. IEA. International Energy Agency. Offshore Energy Outlook 2018: World Energy Outlook Special Report. 2018. Available online: https://www.iea.org/reports/offshore-energy-outlook-2018 (accessed on 7 July 2022).
  13. Sedlar, D.K.; Vulin, D.; Krajačić, G.; Jukić, L. Offshore gas production infrastructure reutilization for blue energy production. Renew. Sustain. Energy Rev. 2019, 108, 159–174. [Google Scholar] [CrossRef]
  14. Xiao, X.; Roh, B.-M.; Zhu, F. Strength Enhancement in Fused Filament Fabrication via the Isotropy Toolpath. Appl. Sci. 2021, 11, 6100. [Google Scholar] [CrossRef]
  15. Xiao, X.; Joshi, S. Process planning for five-axis support free additive manufacturing. Addit. Manuf. 2020, 36, 101569. [Google Scholar] [CrossRef]
  16. Xiao, X.; Roh, B.-M.; Hamilton, C. Porosity management and control in powder bed fusion process through process-quality interactions. CIRP J. Manuf. Sci. Technol. 2022, 38, 120–128. [Google Scholar] [CrossRef]
  17. Xiao, X.; Joshi, S.; Cecil, J. Critical assessment of Shape Retrieval Tools (SRTs). Int. J. Adv. Manuf. Technol. 2021, 116, 3431–3446. [Google Scholar] [CrossRef]
  18. Xiao, X.; Waddell, C.; Hamilton, C.; Xiao, H. Quality Prediction and Control in Wire Arc Additive Manufacturing via Novel Machine Learning Framework. Micromachines 2022, 13, 137. [Google Scholar] [CrossRef]
  19. Martins, I.D.; Moraes, F.F.; Távora, G.; Soares, H.L.F.; Infante, C.E.; Arruda, E.F.; Bahiense, L.; Caprace, J.; Lourenço, M.I. A Review of the Multicriteria Decision Analysis Applied to Oil and Gas Decommissioning Problems. Ocean Coast. Manag. 2020, 184, 105000. Available online: https://www.sciencedirect.com/science/article/abs/pii/S0964569119302960 (accessed on 6 June 2022). [CrossRef]
  20. Dourado, J.D.A. Risk and Opportunities in Oil Exploration in Brazil and South Atlantic. Ph.D. Thesis in Geology, Federal University of Rio de Janeiro, Rio de Janeiro, Brazil, 2007. Available online: http://livros01.livrosgratis.com.br/cp058178.pdf (accessed on 6 June 2022).
  21. Welstead, J.; Hirst, R.; Keogh, D.; Robb, G.; Bainsfair, R. Research and Guidance on Restoration and Decommissioning of Onshore Wind Farms; Scottish Natural Heritage Commissioned Report No. 591; Scottish Natural Heritage: Inverness, Scotland, 2013. [Google Scholar]
  22. IMO. Convention on the Prevention of Marine Pollution by Dumping of Wastes and other Matter. United Kingdom. 1972. Available online: https://wwwcdn.imo.org/localresources/en/OurWork/Environment/Documents/PROTOCOLAmended2006.pdf (accessed on 6 June 2022).
  23. UN. United Nations Convention on the Law of the Sea. Montego Bay. 1982. Available online: https://www.un.org/depts/los/convention_agreements/texts/unclos/unclos_e.pdf (accessed on 6 June 2022).
  24. UNEP. Basel Convention. Basel. 1992. Available online: https://www.basel.int/Portals/4/Basel%20Convention/docs/text/BaselConventionText-e.pdf (accessed on 6 June 2022).
  25. IMO. Resolution A.672(16)—Guidelines and Standards for the Removal of Offshore Installations. United Kingdom. 1989. Available online: http://www.imo.org/en/KnowledgeCentre/IndexofIMOResolutions/Assembly/Documents/A.672(16).pdf (accessed on 6 June 2022).
  26. Bishop, M.J.; Mayer-Pinto, M.; Airoldi, L.; Firth, L.B.; Morris, R.L.; Loke, L.H.; Hawkins, S.J.; Naylor, L.A.; Coleman, R.A.; Chee, S.Y.; et al. Effects of ocean sprawl on ecological connectivity impacts and solutions. J. Exp. Mar. Biol. Ecol. 2017, 492, 7–30. [Google Scholar] [CrossRef] [Green Version]
  27. Cordes, E.E.; Jones, D.O.; Schlacher, T.A.; Amon, D.J.; Bernardino, A.F.; Brooke, S.; Carney, R.; Deleo, D.M.; Dunlop, K.M.; Escobar-Briones, E.G.; et al. Environmental impacts of the deep-water oil and gas industry: A review to guide management strategies. Front. Environ. Sci. 2016, 4, 58. [Google Scholar] [CrossRef]
  28. Heery, E.C.; Bishop, M.J.; Critchley, L.P.; Bugnot, A.B.; Airoldi, L.; Mayer-Pinto, M.; Sheehan, E.V.; Coleman, R.A.; Loke, L.H.L.; Johnston, E.L.; et al. Identifying the consequences of ocean sprawl for sedimentary habitats. J. Exp. Mar. Biol. Ecol. 2017, 492, 31–48. [Google Scholar] [CrossRef]
  29. Sommer, B.; Fowler, A.M.; Macreadie, P.I.; Palandro, D.A.; Aziz, A.C.; Booth, D.J. Decommissioning of Offshore Oil and Gas Structures—Environmental Opportunities and Challenges. Sci. Total Environ. 2018, 658, 973–981. Available online: https://www.sciencedirect.com/science/article/abs/pii/S0048969718350551?via%3Dihub (accessed on 6 June 2022). [CrossRef]
  30. Chandler, J.; White, D.; Techera, E.J.; Gourvenec, S.; Draper, S. Engineering and legal considerations for decommissioning of offshore oil and gas infrastructure in Australia. Ocean. Eng. 2017, 131, 338–347. [Google Scholar] [CrossRef] [Green Version]
  31. Lakhal, S.Y.; Khan, M.I.; Islam, M.R. An “Olympic” framework for a green decommissioning of an offshore oil platform. Ocean. Coast. Manag. 2009, 52, 113–123. [Google Scholar] [CrossRef]
  32. OIL & GAS AUTHORITY—OGA. UKCS Decommissioning Cost Estimate Report. United Kingdom. 2017. Available online: https://www.ogauthority.co.uk/media/4742/ukcs-decommissioning-cost-report-v2.pdf (accessed on 10 July 2021).
  33. CAPRACE; Davi, J. Overview of the Decommissioning of Offshore Structures. Rio of Janeiro: COPPE—UFRJ. 2017. Available online: https://drive.google.com/drive/folders/0BwlfGm7AYy5hTV8tRUxlOGdfSjA (accessed on 6 July 2022).
  34. ANP. Project Oil & Gas Decommissioning—From the UK’s North Sea to the Brazilian Atlantic. Rio de Janeiro. 2018. Available online: https://www.gov.br/anp/pt-br/centrais-de-conteudo/apresentacoes-e-palestras/2018/projeto-oil-gas-decommissioning-2013-from-the-uk2019s-north-sea-to-the-brazilian-atlantic/ (accessed on 6 July 2022).
  35. ANP. Decommissioning in Brazil: Opportunities and Challenges. Rio of Janeiro. 2019. Available online: https://www.gov.br/anp/pt-br/centrais-de-conteudo/apresentacoes-e-palestras/2019/descomissionamento-no-brasil-oportunidades-e-desafios (accessed on 6 July 2022).
  36. KINCAID. Decommissioning of Oilrigs. VIII Maritime Law Workshop. 2019. Available online: https://www.marinha.mil.br/tm/sites/www.marinha.mil.br.tm/files/file/noticias/Decomissioning%20de%20Oilrigs.pdf (accessed on 20 July 2020).
  37. Carvalho, A.B. Economy of the Sea: Concept, Value and Importance for Brazil. Ph.D. Thesis, Pontifical Catholic University of Rio Grande do Sul, Porto Alegre, Brazil, 2018. [Google Scholar]
  38. Annual Work Plan. Regulatory Requirement in Brazil. Available online: https://app.powerbi.com/view?r=eyJrIjoiZjFlMWI0MDgtNWNiNC00OTZlLWI3NGQtOGM3MjQwODhjMTMwIiwidCI6IjQ0OTlmNGZmLTI0YTYtNGI0Mi1iN2VmLTEyNGFmY2FkYzkxMyJ9 (accessed on 6 July 2022).
  39. Petrobras. Program of Deactivation of Facilities in the Production Phase: Field of Production of Cação; Version, A., Ed.; ANP Contract N. 48000.003735/97-91; Petrobras: Rio de Janeiro, Brazil, 2015. [Google Scholar]
  40. PETROBRAS. SIC Petrobras Protocol N.05032/2017. 2017. Electronic mail (e-mail) received by <[email protected]> on. 3 October 2017. [Google Scholar]
  41. PETRONECT. Contract ICJ 5900.0113994.19.2. Disclosure Report—Decommissioning of Fixed Cação Oilrigs. 2019. Available online: https://transparencia.petrobras.com.br/licitacoes-contratos/contratos (accessed on 7 July 2022).
  42. Brazilian Navy. Platforms, Drill Ships, FPSO and FSO Report. Ports and Coasts Directorate. 2021. Available online: https://www.marinha.mil.br/dpc/sites/www.marinha.mil.br.dpc/files/decl_conform/PLATAFORMAS%2520PETR%25C3%2593LEO17SET2021.pdf (accessed on 20 June 2022).
  43. ANP. Executive Summary of Development Plans. Rio of Janeiro. 2021. Available online: https://www.gov.br/anp/pt-br/assuntos/exploracao-e-producao-de-oleo-e-gas/gestao-de-contratos-de-e-p/fase-de-producao/planos-de-desenvolvimento (accessed on 7 July 2020).
  44. MARINHA DO BRASIL—MB. Reports of the Oil Rigs, Drill Ships, FSP e FPSO. 2022. Available online: https://www.marinha.mil.br/dpc/sites/www.marinha.mil.br.dpc/files/PLATAFORMAS%20PETR%C3%93LEO06JUL2022.pdf (accessed on 7 July 2022).
  45. AUKE VISSER. Bright Jewel. Available online: http://www.aukevisser.nl/supertankers/VLCC%20T-V/id1124.htm (accessed on 7 July 2022).
  46. AUKE VISSER. Esso Freeport. Available online: http://www.aukevisser.nl/inter-2/id295.htm (accessed on 7 July 2022).
  47. AUKE VISSER. FPSO Marlim Sul. Available online: http://www.aukevisser.nl/supertankers/FPSO-FSO/id657.htm (accessed on 7 July 2022).
  48. AUKE VISSER. Petrobras 32. Available online: http://www.aukevisser.nl/supertankers/FPSO-FSO/id523.htm (accessed on 7 July 2022).
  49. AUKE VISSER. Petrobras 35. Available online: http://www.aukevisser.nl/supertankers/FPSO-FSO/id521.htm (accessed on 7 July 2022).
  50. AUKE VISSER. Petrobras 37. Available online: http://www.aukevisser.nl/supertankers/FPSO-FSO/id580.htm (accessed on 7 July 2022).
  51. AUKE VISSER. Petrobras 33. Available online: http://www.aukevisser.nl/supertankers/FPSO-FSO/id542.htm (accessed on 7 July 2022).
  52. AUKE VISSER. Settebello. Available online: http://www.aukevisser.nl/supertankers/id63.htm (accessed on 7 July 2022).
  53. SHIPSPOTTING. Che Guevara. Available online: http://www.shipspotting.com/gallery/photo.php?lid=307109 (accessed on 7 July 2022).
  54. SEVANS SP. Piranema Spirit. Available online: https://sevanssp.com/piranema-spirit/ (accessed on 7 July 2022).
  55. Guilbert, D.; Vitale, G. Hydrogen as a Clean and Sustainable Energy Vector for Global Transition from Fossil-Based to Zero-Carbon. Clean Technol. 2021, 3, 881–909. [Google Scholar] [CrossRef]
  56. Hersbach, H.; Bell, B.; Berrisford, P.; Hirahara, S.; Horányi, A.; Muñoz-Sabater, J.; Nicolas, J.; Peubey, C.; Radu, R.; Schepers, D.; et al. The ERA5 global reanalysis. Q. J. R. Meteorol. Soc. 2019, 146, 1999–2049. [Google Scholar] [CrossRef]
  57. Center for Sustainable Systems—CSS. Wind Energy Factsheet. University of Michigan. 2021. Pub. No. CSS07-09. Available online: https://css.umich.edu/factsheets/wind-energy-factsheet (accessed on 7 July 2022).
  58. Rao, K.R. Wind Energy for Power Generation: Meeting the Challenge of Practical Implementation; Springer Nature: Berlin/Heidelberg, Germany, 2019; p. 1443. ISBN 9783319751344. [Google Scholar]
  59. EMEIS, S. Wind Energy Meteorology: Atmospheric Physics for Wind Power Generation, 2nd ed.; Springer: Berlin/Heidelberg, Germany, 2018; p. 255. ISBN 9783319728599. [Google Scholar]
  60. Gaertner, E.; Rinker, J.; Sethuraman, L.; Zahle, F.; Anderson, B.; Barter, G.E.; Abbas, N.J.; Meng, F.; Bortolotti, P.; Skrzypinski, W.; et al. IEA Wind TCP Task 37: Definition of the IEA 15-Megawatt Offshore Reference Wind Turbine (No. NREL/TP-5000-75698); National Renewable Energy Lab (NREL): Golden, CO, USA, 2020. [Google Scholar]
  61. Kumar, S.V.A.; Nagababu, G.; Sharma, R.; Kumar, R. Synergetic use of multiple scatterometers for offshore wind energy potential assessment. Ocean. Eng. 2020, 196, 106745. [Google Scholar] [CrossRef]
  62. Heptonstall, P.; Gross, R.; Greenacre, P.; Cockerill, T. The cost of offshore wind: Understanding the past and projecting the future. Energy Policy 2012, 41, 815–821. [Google Scholar] [CrossRef]
  63. Bjerkseter, C.; Ågotnes, A. Levelized Cost of Energy for Offshore Floating Wind Turbine Concepts. Master’s Thesis, Department of Mathematical Sciences and Technology, University of Life Sciences, Poznań, Poland, 2013; p. 206. [Google Scholar]
  64. Mone, C.; Hand, M.; Bolinger, M.; Rand, J.; Heimiller, D.; Ho, J. 2015 Cost of Wind Energy Review (No. NREL/TP-6A20-66861); National Renewable Energy Lab. (NREL): Golden, CO, USA, 2017. [Google Scholar]
  65. Valpy, B.; Hundleby, G.; Freeman, K.; Roberts, A.; Logan, A. Future Renewable Energy Costs: Offshore Wind: 57 Technology Innovations That Will Have Greater Impact on Reducing the Cost of Electricity from European Offshore Wind Farms. BVG Associates, Inno Energy. 2017. Available online: https://bvgassociates.com/wp-content/uploads/2017/11/InnoEnergy-Offshore-Wind-anticipated-innovations-impact-2017_A4 (accessed on 6 June 2022).
  66. Beiter, P.; Musial, W.; Smith, A.; Kilcher, L.; Damiani, R.; Maness, M.; Scott, G. A Spatial-Economic Cost-Reduction Pathway Analysis for US Offshore Wind Energy Development from 2015–2030 (No. NREL/TP-6A20-66579); National Renewable Energy Lab. (NREL): Golden, CO, USA, 2016. [Google Scholar]
  67. Hurley, W.L.; Nordstrom, C. Pelastar cost of energy: A cost study of the Pelastar floating foundation system in UK waters. In Offshore Wind Floating Platform Demonstration Project FEED Study; Energy Technologies Institute: Loughborough, UK, 2014; p. 12004. [Google Scholar]
  68. Hassan, D. The Great Barrier Reef-Maritime Spatial Planning. Environ. Policy Law 2013, 43, 259. [Google Scholar]
  69. CRAFT, G. Offshore Wind Cost Reduction Pathways Study; Technical Report; The Crown State: London, UK, 2013. [Google Scholar]
  70. Scottish Enterprise. Offshore Wind Key Facts; Scottish Enterprise: Glasgow, Scotland, 2011. [Google Scholar]
  71. Dalgic, Y.; Lazakis, I.; Turan, O. Vessel Charter Rate Estimation for Offshore Wind O&M Activities. In Proceedings of the 15th International Congress of the International Maritime Association of the Mediterranean IMAM 2013, Coruna, Spain, 14–17 October 2013. [Google Scholar]
  72. PETROBRAS. Portal de Transparência—PLSV Contracts. Available online: https://transparencia.petrobras.com.br/licitacoes-contratos/contratos (accessed on 7 July 2022).
  73. Crown Estate. A guide to an offshore wind farm. Power 2010, 2010, 1–70. [Google Scholar]
  74. Gonzalez-Rodriguez, A.G. Review of offshore wind farm cost components. Energy Sustain. Dev. 2017, 37, 10–19. [Google Scholar] [CrossRef]
  75. Green, J.; Bowen, A.; Fingersh, L.J.; Wan, Y.H. Electrical Collection and Transmission Systems for Offshore Wind Power. In Offshore Technology Conference; OnePetro: Richardson, TX, USA, 2007. [Google Scholar]
  76. Nagababu, G.; Kachhwaha, S.; Savsani, V. Estimation of technical and economic potential of offshore wind along the coast of India. Energy 2017, 138, 79–91. [Google Scholar] [CrossRef]
  77. Heidari, S. Economic Modelling of Floating Offshore Wind Power: Calculation of Levelized Cost of Energy. Master’s Thesis, Mälardalen University, School of Business, Society and Engineering, Industrial Economics and Organisation, Västerås, Sweden, 2017; p. 82. [Google Scholar]
  78. Brazilian Navy Hydrography Center. Raster Navigation Chart. Available online: https://www.marinha.mil.br/chm/dados-do-segnav/cartas-raster (accessed on 7 July 2022).
  79. Google Earth. Available online: https://earth.google.com/web/@-4.21116555,-36.82512656,192.53708252a,776223.40078332d,35y,17.83350564h,0.48119176t,0r (accessed on 7 July 2022).
  80. BRASIL; Federal Senate. Bill n° 576: Discipline the Granting of Authorizations for the Use of Offshore Energy Potential. Brasilia. 2021. Available online: https://www25.senado.leg.br/web/atividade/materias/-/materia/146793 (accessed on 7 July 2022).
  81. IBAMA. Offshore Wind Complexes. Brasilia. 2021. Available online: https://www.ibama.gov.br/laf/consultas/mapas-de-projetos-em-licenciamento-complexos-eolicos-offshore (accessed on 7 July 2022).
Scheme 1. Offshore wind and marine power generation by scenario, 2016–2040 [12].
Sustainability 14 13783 sch001
Figure 1. Life cycle of a marine O&G field.
Sustainability 14 13783 g001
Figure 2. Alternative uses of fixed O&G installations.
Sustainability 14 13783 g002
Figure 3. Field abandonment decommissioning activities.
Sustainability 14 13783 g003
Scheme 2. Five-year Brazilian decommissioning investment forecast.
Sustainability 14 13783 sch002
Scheme 3. Oil basins, production volume, fields, and platform types along the Brazilian coast. Sources: [40,42].
Sustainability 14 13783 sch003
Figure 4. Traditional decommissioning vs. repurposing as renewable energy production units.
Sustainability 14 13783 g004
Figure 5. Flowchart of the study process.
Sustainability 14 13783 g005
Scheme 4. Power vs. speed curve for 15 MW turbine.
Sustainability 14 13783 sch004
Scheme 5. Sites under decommissioning in Brazil vs. wind and environmental data. Sources: [40,42].
Sustainability 14 13783 sch005
Scheme 6. Distances between nearby ports and Potiguar basin sites to be decommissioned [43,44,79].
Sustainability 14 13783 sch006
Scheme 7. Potiguar decommissioned site EC distances [43,44,79].
Sustainability 14 13783 sch007
Table 1. Cação oil field decommissioning bidding results.
SupplierEqualized Global Value (USD)
Triunfo Logística Ltd.a. 38,354,483.95
Westshore do Brasil Ltd.a.38,475,813.30
Allseas Brasil S/A41,650,179.51
Empresa Construtora do Brasil S/A43,994,646.09
Saipem do Brasil Ltd.a.46,933,383.02
Alphatec S/A51,147,663.48
Sapura Energy do Brasil Ltd.a.52,290,464.91
McDermott do Brasil Ltd.a.74,797,895.42
Sacanb Engenharia Ltd.a.78,752,539.48
SS Naval Serviços Ltd.a.203,492,008.78
All companies are based on Rio de Janeiro, Brazil.
Table 2. Oil rigs undergoing the process of decommissioning.
ProductionType of
Platform
Field of
Operation
SedimentaryDecom. StatusWater Depth (m)LatitudeLongitudeBuiltAge
UnitBasin2019Year
Piranema SpiritFPSOPiranemaSergipeApproved1100−11:22:12,282−36:59:18,444200613
PCA-1JacketCaçãoEspírito SantoApproved19−19.09927−39.65423197841
PCA-2JacketCaçãoEspírito SantoApproved19−19.09927−39.65423197841
PCA-3JacketCaçãoEspírito SantoApproved19−19.09927−39.65423198633
P-7Semi SubBicudoCamposUnder Analysis162−22.75961−40.68359197445
P-12Semi SubLinguadoCamposUnder Analysis100−2,276,002−40.81648198138
P-15Semi SubPiraúnaCamposUnder Analysis250−22.67892−40.60436198237
PARB-3JacketArabaianaPotiguarUnder Analysis30−4.699183−36.7506200118
P-33FPSOMarlimCamposUnder Analysis780−22:22:15,714−40:01:37,609197841
P-18Semi SubMarlimCamposForecast910−22:25:38,135−40:01:49,135199425
P-19Semi SubMarlimCamposForecast770−22:23:29,307−40:03:23,333198336
P-20Semi SubMarlimCamposForecast610−22:21:28,298−40:05:26,945199227
P-26Semi SubMarlimCamposForecast990−22:28:02,870−40:01:49,854198435
P-32FSOMarlimCamposForecast163−22:20:51,042−40:14:31,830197445
P-35FPSOMarlimCamposForecast850−22:26:08,914−40:04:11,622197445
P-37FPSOMarlimCamposForecast905−22:29:02,411−40:05:51,419197643
P-47FPSOMarlimCamposForecast190−22:20:31,080−40:11:42,754197643
CapixabaFPSOJubarteEspírito SantoForecast1350−21:14:16,783−39:57:46,397197445
PRB-1JacketSalgoSergipeForecast13−10:39:12,455−36:38:02,530197841
PPE-3JacketPescadaPotiguarForecast25−04:41:03,913−36:49:29,409200118
PBIQ-1CaissonBiquaraPotiguarForecast20−04:51:25,280−36:33:37,815200514
PAG-1JacketAgulhaPotiguarForecast16−04:54:25,412−36:15:46,281197841
PAG-2Concret GravityAgulhaPotiguarForecast16−4.876266−36.2688197841
PAG-3JacketAgulhaPotiguarForecast16−4.916317−36.25618198534
POUB-1CaissonOeste de UbaranaPotiguarForecast17−04:53:13,779−36:25:59,970200514
POUB-2CaissonOeste de UbaranaPotiguarForecast17−04:53:30,122−36:27:10,815200514
PARB-1JacketArabaianaPotiguarForecast30−4.694716−36.72458200118
PART-2JacketAratumPotiguarPossible6−5.057−36.53963198435
PCB-2JacketCaiobaSergipePossible27−11:00:01,656−36:55:29,285197445
PCB-3JacketCaiobaSergipePossible27−10.99598−36.92368197841
PCM-4JacketCamorimSergipePossible18−10:59:07,736−36:57:53,042197544
PCM-5JacketCamorimSergipePossible20−10:59:58,193−36:58:19,505197742
PCM-6JacketCamorimSergipePossible26−10:58:59,914−36:55:58,199198435
PCM-8JacketCamorimSergipePossible28−10:59:17,025−36:56:16,719198534
PCM-10JacketCamorimSergipePossible21−10:58:38,748−36:57:04,099198930
PCIO-1JacketCiobaPotiguarPossible6−04:57:59,395−36:25:18,197200514
PDO-1JacketDouradoSergipePossible27−11:05:54,130−36:57:35,127197445
PDO-2JacketDouradoSergipePossible28−11:06:53,946−36:57:59,440198336
PDO-3JacketDouradoSergipePossible28−11:07:06,721−36:58:48,867197445
PGA-2JacketGuaricemaSergipePossible25−11:09:52,004−37:03:09,486197148
PGA-4JacketGuaricemaSergipePossible24−11:07:54,130−37:02:51,362197445
PGA-5JacketGuaricemaSergipePossible25−11:09:13,012−37:03:42,995197445
PGA-7JacketGuaricemaSergipePossible27−11:12:08,177−37:04:46,675198930
PGA-8JacketGuaricemaSergipePossible38−11:10:38,947−37:01:06,846198930
Publisher’s Note: MDPI stays neutral with regard to jurisdictional claims in published maps and institutional affiliations.

