Article

Assessing the Factors Impacting Transport Usage of Mobility App Users in the National Capital Territory of Delhi, India

Department of Transport Planning, School of Planning and Architecture, 4, Block-B, Indraprastha Estate, New Delhi 110002, India
*
Author to whom correspondence should be addressed.
Sustainability 2022, 14(21), 13768; https://doi.org/10.3390/su142113768
Submission received: 21 August 2022 / Revised: 27 September 2022 / Accepted: 13 October 2022 / Published: 24 October 2022
(This article belongs to the Special Issue New Perspectives on Transportation Mode Choice Decisions)

Abstract

:
Smartphone-based mobility apps have created a smartphone-enabled ecosystem of mobility services in developed countries and are slowly picking up pace in the Global South. Against this backdrop, this study used Latent Class Cluster Analysis to empirically investigate the impacts of mobility apps on transport usage patterns in Delhi by classifying users into three latent clusters based on socioeconomic characteristics, smartphone app usage, attitudes, and transport usage. Cluster 1 consisted of users with low app usage, and higher usage of public transport and intermediate public transport; Cluster 2 consisted of multimodal users with high app usage; and Cluster 3 consisted of users with moderate app usage and heavy reliance on private vehicles. Furthermore, the detailed characteristics of each latent class and factors affecting the individual’s probability of being classified into these clusters are discussed. It was found that younger users with higher education, more smartphone experience, medium-to-high household income and lower vehicle ownership had a very high probability of being classified as a multimodal traveler. Furthermore, the attitudes and preferences of users belonging to these clusters towards their choice of transport are discussed, along with a brief policy discussion for encouraging new app-based mobility services such as MaaS.

1. Introduction

In the last decade, technological advancements have significantly influenced transport [1], and emerging technologies are changing the means of interaction with others. Information and Communication Technologies (ICTs), in particular, have become readily available and are changing mobility patterns through their impacts on day-to-day travel-related decisions [2]. For instance, ICT makes it easier to reorganize daily tasks by providing alternatives for both work- and non-work-related activities (such as social networking and shopping), affecting how people travel daily [3]. ICT makes information easily accessible, which could potentially alter the nature and extent of daily travel and activity [4]. Smartphones have emerged as revolutionary ICT devices offering travel support and solutions for their users. Useful real-time information such as travel time, available modes, fares, schedules, etc., are easily accessible through these smartphones. These applications, usually referred to as “apps”, provide information about nearby eateries, tourist attractions, civic gatherings, etc., to facilitate various travel-related activities. They also provide users with alternatives to physical travel through platforms such as social media and messaging apps, video streaming apps, shopping apps, banking and finance apps, etc. Additionally, apps provide access to alternative and new transport services, including shared mobility (like ridesharing and car sharing), which may make it easier for groups to travel.
India already has 748.32 million smartphone users as of 2020 [5]. In 2020, the smartphone penetration rate reached 54%, which is tremendous growth considering it was only 23% in the year 2016, and it is estimated to reach 96% by the year 2040 [6]. In 2019, more than 95% of the revenue from the entire online taxi services market in India was generated from the app-only based model of online taxi services [7]. The market for online taxi services had a value of INR 30.72 billion in 2020 and is projected to increase at a compound annual growth rate of 12.93% between 2021 and 2025, reaching INR 55.15 billion by 2025 [7]. One of the key drivers currently fueling the market’s growth is the increased use of smartphones in India, with high-speed internet connectivity and an increase in investments by foreign institutional investors (FII) in the country’s online taxi sector [7].
The way people use smartphone apps for travel is constantly evolving. Apps are becoming important for managing and self-regulating transportation and other systems in smart cities. Therefore, the rise of the smartphone is associated with a number of sociotechnical advances that have the potential to permanently reshape physical mobility networks in the direction of higher sustainability. They may significantly improve the effectiveness of current systems and deliver much more appealing and practical alternatives to the use of fossil fuel-powered private cars, such as cycling, conventional urban rail transit, bus rapid transit, public bike share programs, and “free-floating” car sharing schemes [8,9]. Smartphone users are increasingly using apps for various transportation applications. More and more people use their smartphones to start a trip, direct a trip, check the departure time of the next bus, train, or subway, hail a taxi, or use the services of an app-based taxi aggregator. In developed countries, this has created a smartphone-enabled ecosystem of mobility services called Mobility-as-a-Service (MaaS), a platform that combines different transportation modes and services into a single app.
An example of MaaS is “Whim” in Helsinki (Finland), through which travelers can plan and pay for trips across a variety of modes, including public transport, bike share, taxis, carpool/car share, etc. The need to toggle between apps is eliminated, and everything needed for travelling is right there when one opens Whim, making it highly convenient and easy to use. This single app has driven users towards multimodality, and they are shifting towards sustainable mobility patterns [10]. Such platforms have either already been deployed or are under trial in many cities across the world such as Whim (in Helsinki, Finland, as mentioned), ISTmobil (in Weiz, Steiermark, Austria), Moovit (in Canada, United States, Italy, Israel, etc.), Umo Mobility (in San Diego, CA, USA), Lilium (in Weßling, Germany), SkedGo (in Sydney, Australia), UbiGo (in Stockholm, Sweden), etc. Even in India, work on a smartphone-enabled connected mobility platform has already started. The Ministry of Housing and Urban Affairs (MoHUA) of the Government of India, in collaboration with industry partners, is working to establish a framework to introduce smartphone-enabled connected mobility platforms in Indian cities for integrating all forms of shared transportation through a single app with multiple functions, including route/mode choices and payment gateways [11]. Owing to rapidly increasing internet and smartphone penetration in all the regions of the country, as a result of the lowering of the costs of data and handsets, along with other flagship government projects such as “Smart Cities Mission” [12,13] and “Digital India” [14], it is not going to be long when use cases based on these platforms start emerging in Indian cities in an attempt to shift users towards sustainable travel options.
However, the market for smartphones and their applications is still developing, and it is unclear how they influence the choice of transport, especially in a developing country such as India. Thus, the demand for new mobility services in the future is unknown [15]. Therefore, examining the baseline relationship between the usage of smartphone-based transport apps and transport system usage may provide insights into the potential impact of smartphone app usage on people’s transport preferences. Such research could aid in policy development measures for smartphone-related travel enhancements and alternatives, such as carpooling, shared mobility, etc. [16], further contributing towards a low-carbon future of urban transport. Modern research has shown that the use of ICT devices has changed daily activities and travel decisions, such as the time of the activity, start time, destination selection, selection of transportation mode, selection of route, etc. [2,17,18]. The versatility of smartphone apps is changing the way people travel every day. People can use various smartphone apps for work, shopping, banking, etc., instead of physically travelling. Smartphone apps can also become a popular source of information about various places and attractions, local festivals, and community events, leading to taking trips to new places and attending social gatherings. Smartphone users can use reviews and ratings for new places to decide whether to visit them. Users may even get encouraged to participate in community events due to readily available information about local activities [16]. Basically, with the advent of mobility apps, users now also have various transport options to cater to these new mobility requirements.
Since smartphone app usage is growing and affecting how people move, it is important to concentrate on gaining a better understanding of how smartphone app usage affects people’s everyday transport choices. However, the use of these apps and how they affect users’ mobility choices may differ across smartphone users, depending on their level of technology ownership, generational diversity, sociodemographic characteristics and preferences [19]. By examining how smartphone app usage affects people’s daily transport choices in a developing country, this study adds to the body of existing work. In this context, the study explores the following research questions: (1) What are the factors that significantly influence different transport choices of individuals due to their smartphone app usage? (2) What variations exist across the transport choices of different user groups? To address these questions, this study makes use of Latent Class Cluster Analysis (LCCA) to probabilistically classify smartphone users into groups with similar transport usage patterns, using a rich set of covariates, including socioeconomic characteristics, smartphone app usage patterns, and attitudes and preferences, while maximizing the diversity of these patterns between groups. Furthermore, the mentioned covariates have been discussed as factors affecting individuals’ probabilities of belonging to the latent clusters.

2. Literature Review

With an average of 40 apps downloaded per person each month, India has emerged as one of the largest markets for mobile apps [20]. Since Apple released its iOS app store in 2008, enabling other mobile companies to publish mobile applications by establishing standards, mobile apps have come a long way. These standardized apps were used to surf websites by customers on their smartphones. The few earliest mobile apps were meant for purposes such as e-mail, managing contacts, calendars, weather reports, etc., and were later followed by apps meant for mobile gaming, banking and ticketing. The six primary categories of mobile apps include lifestyle apps, utility apps, apps for social networking services, entertainment apps, productivity apps and news information apps [21]. In India, transport-related apps are the seventh-most popular smartphone app category. The use of transportation apps can help with traffic-related issues, and make commuting more convenient, sustainable and enjoyable. Until recently, only navigation and location-based features were available on transport apps. Today, however, there is already a wide range of applications for transportation, including ones for logistics, parking, route planning, navigation, shared mobility, payments, etc. An interesting study found that using a smartphone app might change commuters’ behaviour to be more environmentally friendly [22]. Similarly, research using two end-user mobile applications and no external infrastructure confirmed the viability of the apps for transportation needs [23].
There is a plethora of studies, particularly in industrialized nations, on how ICT-enabled applications affect travel. Numerous research investigated the impact of sociodemographic variables on ICT use, and found that the majority of internet users are students and people in their 20 s and 30 s [24]. Most mobile phone users [25] and smartphone users [18] are likewise in the same age groups. Men are more likely than women to utilize the internet [24]. However, the use of smartphones was found to be gender-neutral, according to a US poll of St. Louis metro passengers [18]. With increase in income, the online activity of users has also increases [24]. The likelihood of possessing a cell phone also increases with income [25,26]. However, a different study discovered that money was a less important predictor of smartphone ownership [18]. A poll of US travelers found that the online booking and purchasing of travel-related products and services, such as accommodations and tickets, significantly increased [27]. San Francisco Bay Area researchers investigated the use of the internet for virtual activities such online banking, maintenance and discretionary spending [24], and found that even though using the internet shortened commutes, maintenance chores and trip frequency increased.
Aiding decision makers and other stakeholders in creating policies that promote more sustainable travel is one of the main goals of research on travel behavior [28,29]. This includes, among other things, limiting the use of automobiles, and promoting the use of bicycles and public transportation. ICT-based applications such as smartphone apps facilitate intermodal and multimodal travel [30]. Users can select the form of transportation that best suits their needs, as well as their own time and financial budget [31]. It is getting less desirable to possess a car, as smartphones and new kinds of transportation become more widespread [30]. There is currently an increasing interest in examining the variability of behavior within individuals, whereas historically, research has focused on explaining differences in behavior between individuals [32,33,34,35,36]. Finding out whether or not passengers constantly utilize the same mode, or if they switch between modes—that is, their extent of multimodality—is of particular importance. In contrast to a habitual traveler who utilizes a single mode exclusively regardless of context, multimodality can be seen as a reflection of the conscious choice process of a traveler who selects a mode based on context [37]. Understanding the characteristics of the multimodal group is crucial from a policy standpoint in order to encourage more of this type of behavior. There is evidence that suggests multi-mode users are more likely than single-mode users to change their behavioral profiles over time [38].
In studies of travel behavior, multimodality is generally ignored, in part because it is challenging to obtain the necessary data and create more complicated models [39]. However, recently, a small but expanding body of study looked into characteristics linked to multimodal travel behavior. Multimodality was observed to be disproportionately high in adolescents, the elderly and persons living in population centers [40]. Additionally, it was observed that lower-income Americans exhibit less multimodality [41]. In Germany, it was observed that a rise in multimodality among people between the ages of 18 and 29 was accompanied by a decrease in car use among the same cohort, which contributes to the flattening trend of car use overall [42]. Some investigations were based on modelling approaches and estimate latent class choice models [43]. They showed that various multimodal travel behaviors are related to the sensitivity to journey times and long-term decisions about travel. Additionally, several researchers claim that people who consistently utilize the same method of transportation may have an incomplete understanding about other modes. People who only use their cars, for example, frequently underestimate the amount of time it takes to commute by public transportation. In this context, it was observed that, on average, the perception of car travelers about travel time by public transport exceeded actual values by 46% [44]. In contrast, passengers who also utilized other modes of transportation got familiar with them and may have somewhat overestimated or underestimated their performance. For example, it is theorized that strong automobile users who also utilize public transportation (PT) could have different attitudes towards public transport than strong car users who just use cars [45,46]. The nature of various multimodal clusters was also studied [45], but the analysis was limited to a few socioeconomic factors. The multimodality orientation for a given journey was captured via a latent variable that Diana (2010) used as an explanatory variable for the decision to switch transport modes for a hypothetical future trip of the same kind [47]. Mode-specific cognitive and affective attitudes were included in the model as additional explanatory factors; however, there was no direct correlation between the attitudinal variables and the multimodality orientation.
Thus, some research is conducted on multimodality and the factors affecting it. However, a very limited number of studies investigated the effects of the use of ICT-based systems such as smartphone apps on the usage of various modes of transport and multimodality. A study conducted in California, USA, found that millennials are significantly more multimodal, and that they appear to adapt more readily to modern technological innovations and to the use of smartphones in particular. They also seem to use the internet and/or smartphone apps more frequently to identify potential destinations (such as restaurants, cafés and other places), learn how to get to new places, and decide which modes of transportation, or combinations of multiple modes, to use for a trip [48]. Additionally, they claim to use their smartphones more frequently when travelling and accept new smartphone-based mobility services more frequently than Gen Xers, particularly in urban areas. [49]. According to some studies, smartphone-enabled mobility services such as MaaS may encourage modal shifts away from the use of private vehicles and towards public transportation [50], while they also contribute to the increase in the travel satisfaction of users [51]. MaaS has consequently received a lot of attention recently, to the point that it is anticipated to fuel a mobility revolution equivalent to the invention of the private car in the 20th century [52,53]. However, a self-selection effect has been observed among individuals participating in the research associated with early pilots of MaaS [54]. It is unclear if the general population will follow the mode shifts shown by individuals in these MaaS pilots and whether public transportation will play a larger part in urban MaaS schemes than on-demand services.
From this review of the literature, it was observed that a comprehensive understanding of the effects of app usage patterns by various user groups, with differing socioeconomic characteristics, attitudes and preferences, on multimodality is lacking, and it is unclear what kind of users would be willing to shift to new mobility services such as MaaS. As far as the authors are aware, no equivalent research was ever conducted in Indian cities.

3. Materials and Methods

3.1. Study Area

Delhi’s National Capital Territory (NCT) was chosen as the study area. It has strong arguments for being considered as a case study, including its operation of nearly all platforms and aggregators, presence of important policymakers and their ministries, and variety of travel options, including the metro, rails, public buses, private buses, auto-rickshaws and informal three-wheelers. As per the Census of India (2011), more than 18.9 million people [55] live in 1483 sq. km (11,320 persons/sq. km) and are mostly urban (97.5%). The per capita income is relatively higher in Delhi (INR 401,982) compared to other Indian cities, and ranks third after the provinces of Sikkim and Goa [56]. It also has a literacy rate of 86.2%. The telecommunications network is well-established in Delhi. It has high teledensity, with 52.4 million wireless subscribers [57]. This makes this city the perfect location for introducing smartphone apps for various travel requirements such as deciding when to depart, mode choice online shopping, etc. [58], and the city currently has several such platforms (Table 1).

3.2. Data and Variables

The primary data used in this study were collected through an online survey of smartphone users. The survey was conducted between September 2021 and December 2021, and a sample of 530 people, representative of the sociodemographic structure of the NCT of Delhi as per the Census of India (2011) [55], was collected. The following were the components of the questionnaire:
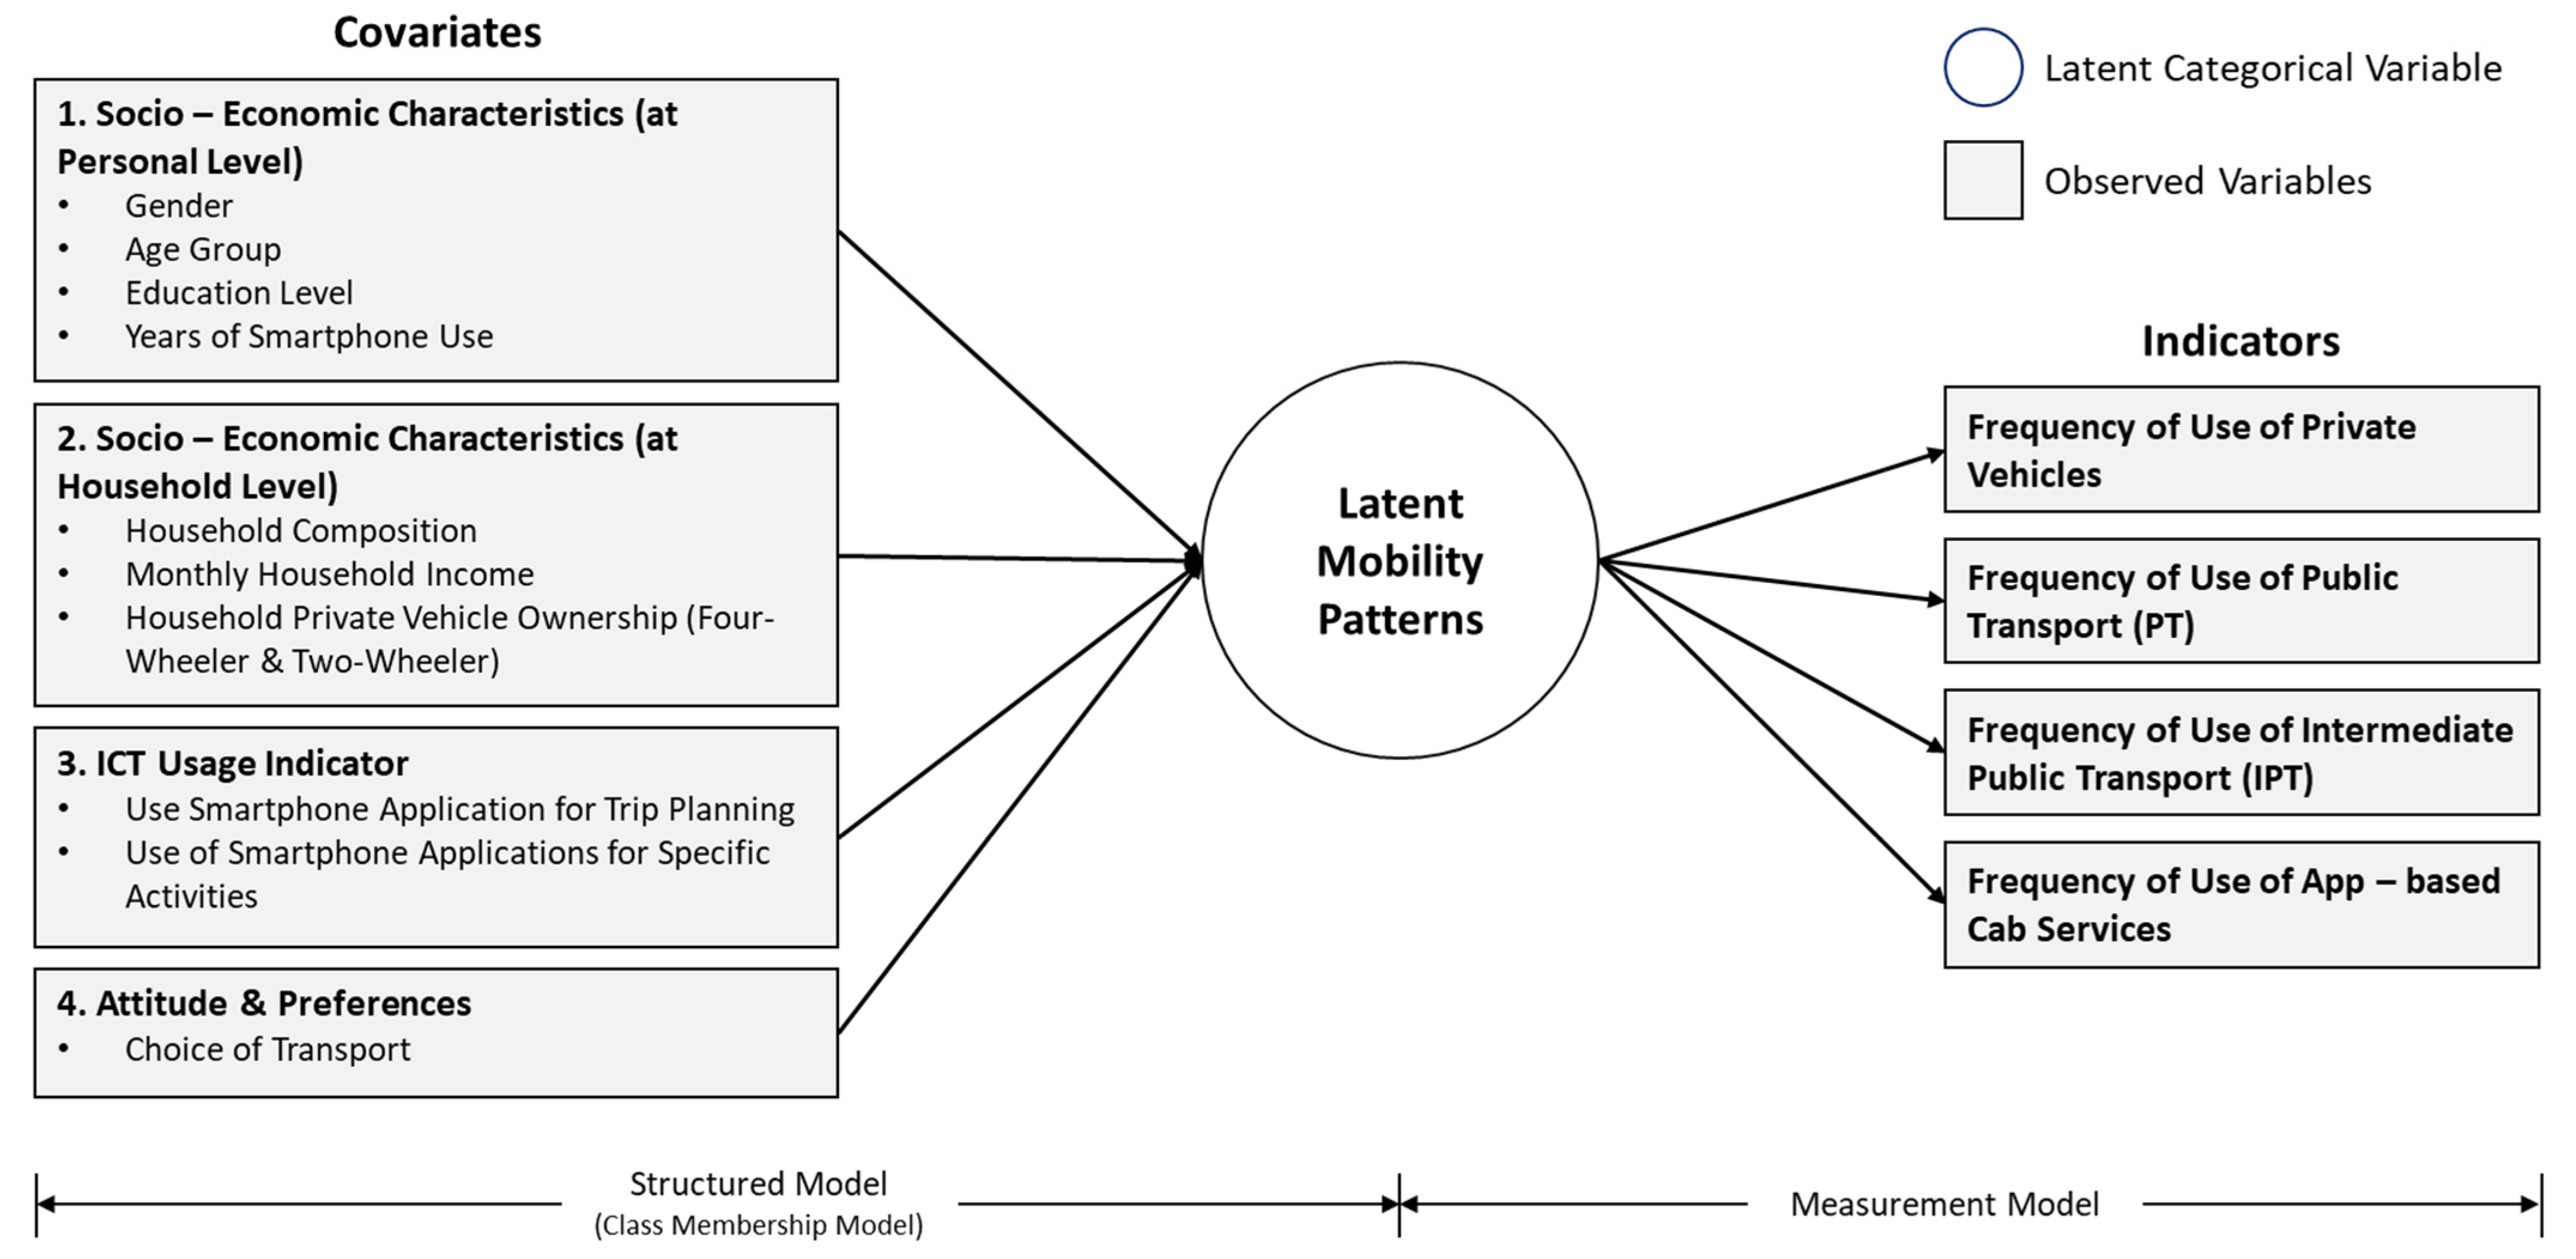
  • Transport Usage: As previously mentioned, Delhi has a variety of travel options, but the four main types of systems considered in this study were private vehicles (including four- and two-wheeled motor vehicles), public transport (including bus and metro services), intermediate public transport or “IPT” services (including autorickshaws and battery-powered rickshaws) and app-based shared mobility services. Respondents were asked questions about their propensity to use the aforementioned modes of transport on a Likert scale, with the responses of “Never”, “Rarely”, “Sometimes”, “Often” and “Always”.
  • Socioeconomic Data: Personal-level details, such as gender, age group (users below 18 years of age were considered in this study), educational qualifications and years of smartphone use, and household-level details, including household composition (with or without children below 18 years of age), monthly household income, four-wheeler ownership and two-wheeler ownership, were recorded. The personal and household-level socioeconomic information was recorded as categorical choices.
  • Smartphone App Usage: Responses were collected from smartphone users concerning their frequency of use of smartphone apps for activities associated with trip planning, such as deciding the departure time for a trip, deciding on destinations, selecting the transportation mode, performing essential tasks online instead of traveling to a designated location and, communicating and coordinating, and other travel-impacting purposes, such as navigation, checking the schedule of public transport, online shopping, etc. Information was collected on a Likert scale, with the responses of “Never”, “Rarely”, “Sometimes”, “Often” and “Always”.
  • Attitude: The dataset included respondents’ degrees of agreement with 12 statements about their attitudes and preferences on a Likert-type scale, with the responses of “Strongly Disagree”, “Slightly Disagree”, “Neutral”, “Slightly Agree” and “Strongly Agree”.

3.3. Methods

3.3.1. Chi-Square Test of Association

A chi-square test was performed to assess the association between the socioeconomic parameters and usage frequency of the transport modes. An SPSS software package was to perform this analysis, and apart from gender (Table 2), all the personal-level and household-level variables showed a strong association with the frequency of use of transport modes.
Apart from the frequency of use of public transport, gender had a significant relationship (p < 0.01) with the frequency of use of the modes. Cramér’s V, a measure of the effect size for the chi-square test of independence, was used to assess the strength of association between gender and the frequency of use of transport systems for the significant relationships; that is, it measures the degree to which the two categorical fields are associated [59]. Here, the measurement of effect size in each significant relationship was close to 0.2, which means that although the results are statistically significant, the fields are only weakly associated [60].

3.3.2. Exploratory Factor Analysis (EFA)

EFA has been used as a variable reduction technique for the statements recording attitudes and preferences, and accounts for the common variance among them [61]. An SPSS software package was used to perform this analysis. Statements having low value of factor loading (less than 0.4 in this study) were considered statistically significant [62]. Table 3 shows the statements along with the estimated factor loadings.
It was observed that none of the statements had a factor loading of less than 0.4 and could be considered for further analysis. The data suitability for EFA was investigated using Kaiser–Meyer–Olkin (KMO) model fit measures, along with Bartlett’s test of sphericity [62]. A KMO of 0.936 has been obtained, showing good sample adequacy [63], and the result of Bartlett’s testing was less than 0.001, indicating a good relationship between the indicators for the EFA.

3.3.3. Latent Class Cluster Analysis (LCCA)

LCCA has been used to probabilistically classify smartphone app users into traveler groups, each characterized by somewhat similar patterns of mode use, while also maximizing their heterogeneity across groups. The model classifies individuals in different clusters based on unobserved (latent) variables that describe their responses for a set of observed indicators [64]. Compared to more simple techniques, this analytical approach has several advantages for identifying multimodal travel behaviors. As travel multimodality cannot simply be reduced to a one-dimensional measure such as HHI or Shannon’s Entropy, LCCA aims to quantify multimodality as a whole rather than creating a single (composite) index. Instead, it classifies individuals into latent classes on the basis of multiple indicators that reflect each class’s unique mode usage patterns. Second, this method evaluates an individual’s probability of being classified into various latent classes, in contrast to deterministic classification approaches. Each of these classes displays a unique profile which includes the average frequency of use for the various modes. In particular, this is the mean of a set of sample-wide probability-weighted indicator variables [65].
The model includes two sub-models which are simultaneously estimated. A multinomial logit model is used in one sub-model to estimate the probability that the individual i (with the covariates xi) belongs to the latent class c. The other sub-model estimates specific means and standard deviations for J indicators for each class, yij (j = 1, 2, 3, …, J), or arrayed into the vector yi that is the monthly frequencies of transport mode usage, and also assumes that the indicators will have a normal distribution. The equation below represents the entire model [66].
P ( y i | x i ) = c = 1 C P ( c | x i )   j = 1 J P ( y i j | c )
The results include two sets of estimations for the parameter: the active covariate coefficients specific to the class; and, the averages and standard deviations of the indicators specific to the class. The statistical significance of a given covariate in a multinomial logit model setting determines whether it accounts for the probability of a commuter’s membership in a particular class. The relationships between the indicators, the active and inactive variables, and the latent structure of mobility styles are shown in Figure 1.
The LCCA was performed using the Latent GOLD software package, which performs this analysis within an interactive graphics environment [67]. Gender was considered an inactive covariate because of its weak association with the frequency of use of transport systems. Moreover, the value of the factor loading for the first statement, “It does not matter what type of mode I use if it is suitable for my travel needs”, was approximately 0.4, and it was also considered an inactive covariate. These covariates were coded such that they did not directly contribute to the LCCA model but were still used as analysis parameters.

4. Results

The model was executed in Latent GOLD, with a different number of specified latent classes, and the best among those models was determined by information criteria. The software reports useful criteria (Table 4) such as the Akaike Information Criterion (AIC) and the Bayesian Information Criterion (BIC) (for formulas, see [68,69]). A better model fit is associated with low values for these criteria.
The three-class solution was chosen as the best, after analyzing several alternatives, based on the lower AIC and BIC information criterion values. Out of all the samples, 41% were classified in Cluster 1, 34% in Cluster 2 and the remaining 25% in Cluster 3 (Figure 2).

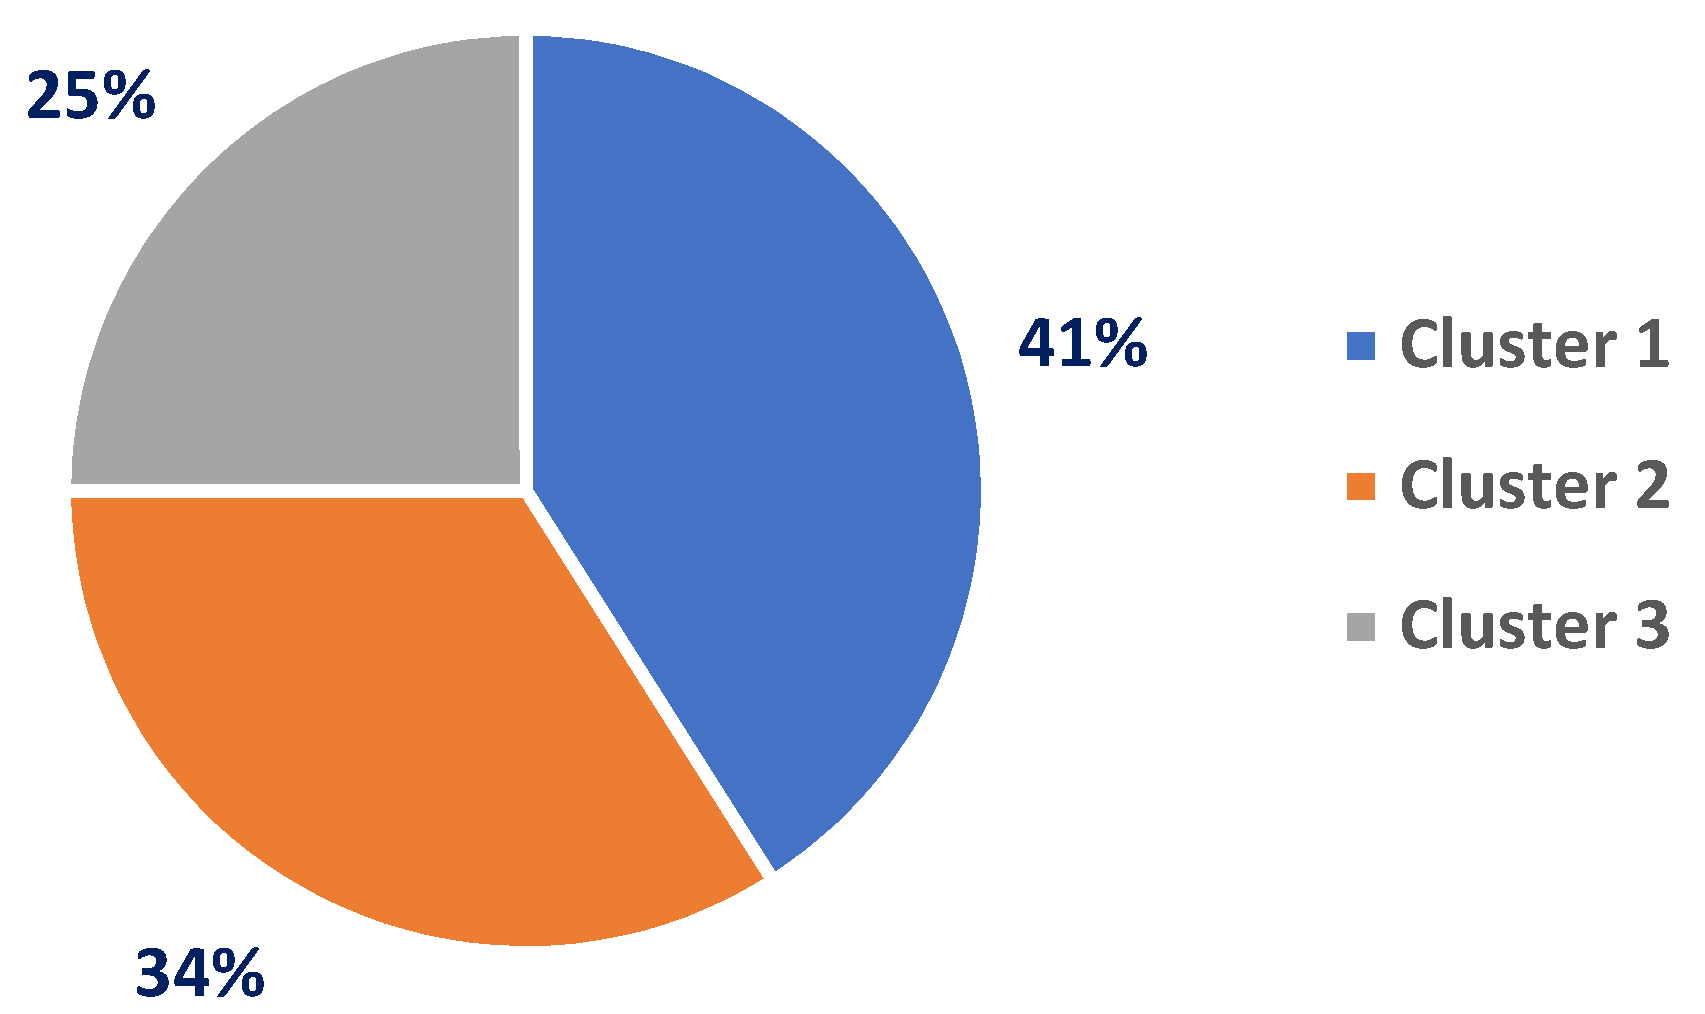
4.1. Cluster-Wise Transport Mode Usage

Figure 3 shows the frequency profiles for using various modes of transport considered in the study for the respondents clustered into the three latent class clusters. The darker shades represent higher usage of transport modes.
It was observed that the respondents classified in Cluster 1 showed a very high reliance on public and intermediate public transport, less dependence on private vehicles and no usage of app-based cabs/taxis. In contrast, the ones classified in Cluster 2 show a significant dependence on all modes of transport. Finally, respondents in Cluster 3 show a higher reliance on private vehicles. Thus, the three latent classes can be named as follows:
  • Cluster 1 PT and IPT Users;
  • Cluster 2 Multimodal Travelers;
  • Cluster 3 Private Vehicle Users.
All the active and inactive covariates were then classified under these latent classes as per the LCCA model.

4.2. Cluster Profiles for App Usage

Figure 4 shows the profiles for the frequency of smartphone app usage for trip planning activities by the respondents clustered into the three latent classes. Although most respondents reported a very high dependence on app usage for communication and coordination, respondents who stated “Never” to “Sometimes” for all the trip planning purposes had a high probability of being classified as PT and IPT users. On the other hand, those who stated “Often” to “Always” for all purposes had a high probability of being classified as multimodal travelers. The respondents classified as private vehicle users stated varied responses between “Rarely” and “Often”.
The following are the cluster-wise app usage patterns for trip planning purposes:
  • PT and IPT Users: As stated, respondents showed a high dependence on communication and coordination, as most stated that they “Always” or “Often” use them. Most respondents stated that they never used smartphone apps to decide when to depart, choose a mode of transport, make route selections and perform tasks online. In comparison, a relatively higher proportion of users stated that they used apps to decide trip destinations on rare occasions.
  • Multimodal Travelers: Respondents showed a very high dependence on communication and coordination, as all of them stated that they “Always” use them. To decide trip destinations, choose a mode of transport, make route selections and perform tasks online, most respondents stated that they “Often” or “Always” used smartphone apps. For deciding when to depart, the largest share of respondents stated that they used apps sometimes.
  • Private Vehicle Users: Respondents showed a high dependence on apps for communication and coordination. To decide when to depart, choose a mode of transport and perform tasks online, most users showed medium dependence on app usage, and a large proportion reported “Rarely” to “Sometimes”. For deciding trip destinations, a majority of respondents stated that they used apps “Sometimes” or “Often”.
Figure 5 shows the profiles for the frequency of smartphone app usage for other travel-impacting purposes by the respondents clustered into the three latent classes. Although most respondents reported a very high dependence on app usage for scheduling meetups using social networking apps, respondents who stated “Never” to “Sometimes” had a higher probability of getting classified as PT and IPT users for all the trip planning purposes. On the other hand, those who stated “Often” to “Always” had a high probability of being classified as multimodal travelers. The respondents classified as private vehicle users had varied responses between “Rarely” and “Often”.
The following are the cluster-wise app usage patterns for other travel-impacting purposes:
  • PT and IPT User: The respondents in this cluster stated that they never used apps for reserving taxis/cabs. As stated, the respondents showed a high dependence on scheduling meetups, as most stated that they “Always” or “Often” used them. Most respondents said they never used smartphone apps for navigation and online banking. In comparison, a relatively higher proportion of users stated that they used apps for online shopping on rare occasions. The respondents showed the least dependence on the purpose of checking PT schedules.
  • Multimodal Traveler: Respondents showed a very high dependence on scheduling meetups as they all stated that they “Always” used them. For reserving taxis/cabs, most respondents stated that they sometimes used smartphone apps. Less dependence on apps was observed for checking PT schedules, but it was still more than the other clusters. For navigation, online shopping and online banking, a large share of respondents stated a high reliance on apps.
  • Private Vehicle User: Most respondents showed a limited dependence on apps for reserving taxis/cabs, which was more than Cluster 1. To decide when to depart, choose a mode of transport and perform tasks online, most users showed a medium dependence on app usage, and a large proportion reported “Rarely” to “Sometimes”. For deciding trip destinations, most respondents stated that they used apps “Sometimes” or “Often”.
From the analysis of app usage patterns for both types of purposes, it was inferred that users with a lower dependence on apps had a high probability of getting classified in Cluster 1 as PT and IPT users, ones with a higher dependence on apps had a high probability of getting classified in Cluster 2 as multimodal travelers, and ones with a medium dependence on apps had a high probability of getting classified in Cluster 3 as private vehicle users.

4.3. Class Memberships

In addition to depicting the three latent class clusters of travelers, an attempt was made to analyze the mentioned covariates as factors which affect the probabilities of individuals to belong to these clusters.

4.3.1. Socioeconomic Characteristics

Table 5 shows the probabilities of respondents being classified in a cluster depending upon their socioeconomic characteristics.
The following are the characteristic-wise cluster probabilities:
  • Gender: It was observed that for both male and female respondents, the probability of getting classified as a PT and IPT user (41.5% and 41.6%, respectively) was slightly higher than multimodal travelers and significantly higher than private vehicle users.
  • Age Group: Younger users (18 to 34 years) had a higher probability (60%) of getting classified as a multimodal traveler and no probability of getting classified as private vehicle users. The respondents of the 35 to 44 years age group had equal probability (40% each) of getting classified as PT and IPT users or private vehicle users. Respondents of older age groups, of 45 to 54 years and 55 to 64 years, had a higher probability (60% and 56%, respectively) of getting classified as private vehicle users, and respondents of age 65 years and above had a high probability (60%) of getting classified as PT and IPT users.
  • Educational Qualification: Respondents with higher educational qualifications had a high probability (71.7%) of getting classified as a multimodal travelers, and conversely, those with lesser educational qualifications had a high probability (81.7%) of getting classified as PT and IPT users.
  • Number of Years of Smartphone Use: Experience with smartphone usage was a major contributor to app usage, and all users with less than three years of experience were PT and IPT users. Although users with 3 to 5 years of experience with smartphone use also had a high probability (86.9%) of getting classified as PT and IPT users, there was also some probability (13.1%) of getting classified as a multimodal traveler. Users with more than five years of smartphone use experience had a 47.9% probability of getting classified as a multimodal users, 37.9% probability of getting classified as private vehicle users, and still had a 14.2% probability of getting classified as PT and IPT users.
  • Household Composition: Respondents with children below 18 years of age had a slightly higher probability (36.3%) of being classified as multimodal travelers, and those with children below 18 had a higher probability (46.6%) of being classified as PT and IPT users.
  • Monthly Household Income: Respondents with a monthly income of less than INR 20,000 were classified as PT and IPT users. Those earning INR 20,000 to 50,000 were highly likely (49.1%) to be classified as multimodal travelers. Among the high-income households, those belonging to ones with an income of INR 50,000 to 100,000 had a slightly higher probability of being classified as private vehicle users (50.9%) than multimodal travelers (49.1%). Interestingly though, there was a significantly high probability (70.8%) for respondents belonging to households earning more than INR 100,000 monthly to be classified as multimodal travelers.
  • Vehicle Ownership: Respondents belonging to households with no four-wheeler or two-wheeler vehicle ownership had a very high probability (91.8% and 89.6%, respectively) of being classified as PT and IPT users. However, the ownership of even a single four-wheeler or two-wheeler ensured that they had a high probability (48.9% and 38.9%, respectively) of being classified as private vehicle users and a significant probability (47.6% and 36.1%, respectively) of being classified as multimodal users. Respondents belonging to households with more than two vehicles had a very high probability of being classified as private vehicle users.

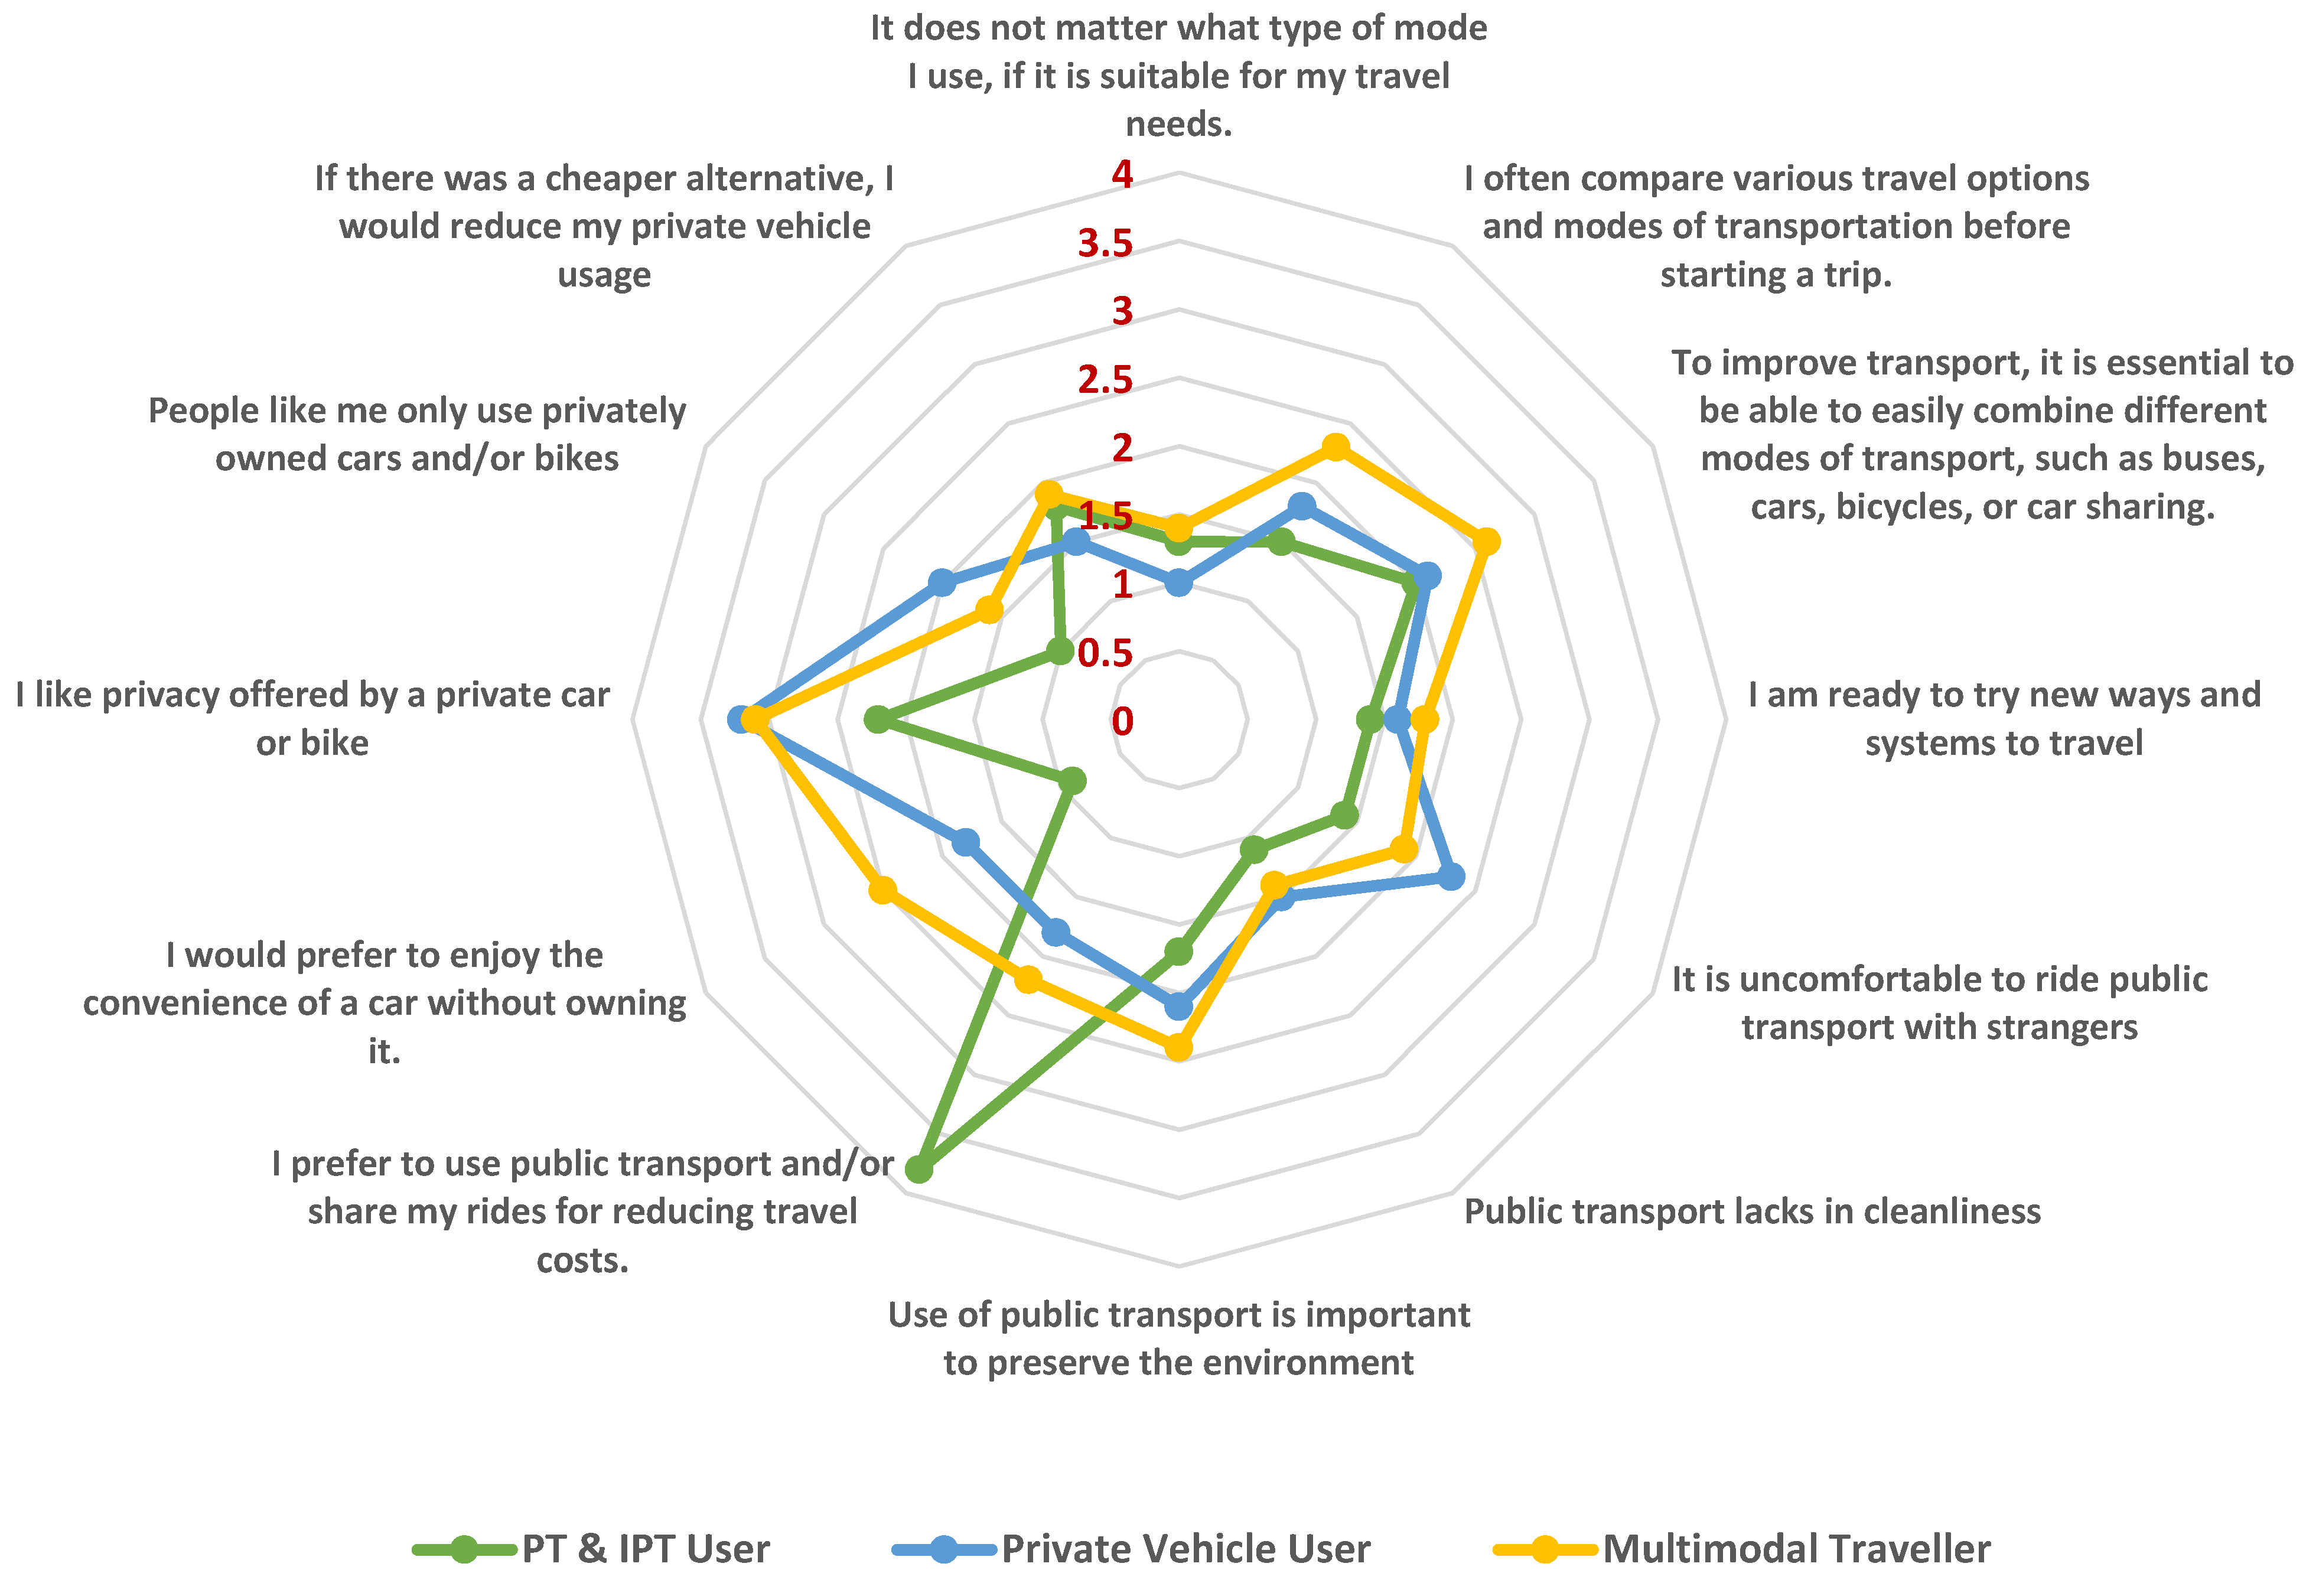
4.3.2. Attitudes and Preferences

The associations of respondents’ attitudes and preferences with class membership were also studied separately. Figure 6 shows the latent class cluster-wise weighted mean exploratory factor analysis scores for statements relating to the choice of travel. Statements excluded from the LCCA were also included in the radar graphs for a more comprehensive overview of all the studied aspects.
Respondents who compared travel options, chose the mode of transport per their travel needs and were willing to try new travel modes had a very high probability of being clustered as multimodal travelers who also highly rated multimodality. As per the responses, these users had a high probability of being pro-environment, felt a little uncomfortable riding with strangers and were most likely to reduce their car dependence if a cheaper alternative was provided, preferably something that could provide the convenience of a car without owning one. They gave some consideration to reducing trip costs by using public transport and shared mobility services. However, if a respondent was highly cost-sensitive, there was a high probability of being classified as a PT and IPT user who had the most stated disagreement with all the statements. The users who were more inclined towards vehicle ownership, less comfortable with public transport and moderately willing to try new services, had a high probability of getting classified as private vehicle users.

5. Discussion

In this section, the key findings of the study are discussed, and some policy recommendations for each cluster are also provided:
  • The PT and IPT Users cluster included respondents who were primarily dependent on the usage of public transport and intermediate public transport. It comprised either younger or very old users with lower educational qualifications and belonging to low-income households. They had less experience using smartphones and showed less dependence on app usage for transport needs. These users were susceptible to the cost of travel which made them captive to their choice of transport, and they were not willing to make different mobility choices unless they were technologically accessible to them and cheaper than the existing system of their choice. Thus, their choices were not based on other concerns such as comfort, cleanliness, privacy or environmental friendliness. They strongly preferred traditional transit over other new modes. Previous studies have shown that people who utilize public transportation are less likely to switch from using fixed public transportation to using pooled on-demand options [70], or to adopt services such as MaaS [71], which is in line with the observations for the “PT and IPT Users” made in this study. This may be a result of lower-income people often using public transportation more often [72,73], for whom the new mobility services may be perceived as potentially expensive. In fact, of the three identified groups, “Multimodal Travelers” had the greatest average willingness-to-pay score, while “PT and IPT Users” had the lowest desire to pay.
  • The Multimodal Travelers cluster included respondents who chose to travel with various transport modes depending upon their requirements. It primarily comprised highly educated younger users belonging to medium- and high-income households. They had extensive experience with the use of smartphones and showed a very high dependence on app usage for their transport needs. They often compared the different travel options available to them, including the combination of modes for their trips, and were even willing to try new mobility choices. Even though they were slightly uncomfortable with the prospect of riding with strangers and the cleanliness of public transport was a concern to them, they acknowledged that the use of public transport was essential for preserving the environment and were very open to the idea of shared mobility where they could get the convenience of a private vehicle without the need to own them. These socioeconomic traits have also been observed among early adopters of shared forms of transportation [49,74,75,76], as well as generally among multimodal individuals. Additionally, it was observed that individuals in this cluster more frequently chose their mode of transportation based on trip information rather than just their preferred or regular means of transportation. As a matter of fact, some research shows that multimodal individuals have more complex strategies for choosing transport options, and they possess weaker travel habits [77]. In turn, this makes it easier to implement innovative mobility solutions such as MaaS.
  • The Private Vehicle Users cluster included respondents dependent on private modes of transport. It comprised medium- to old-age users primarily belonging to medium- and high-income households. They had moderate experience with using smartphones and showed a medium dependence on app usage depending on specific purposes. The existing literature identifies two main barriers to the potential adoption of new mobility services such as MaaS: (a) high private vehicle ownership and (b) low technology adoption [78]. This is somewhat in line with the findings of this paper, with the caveat that moderate technology adoption was observed among private vehicle users for smartphone-based online activities such as shopping, banking and scheduling meetups. They also showed moderate usage of navigation services. Additionally, a strong sense of ownership, as well as low environmental and financial sensitivity, have also been found in the literature as important variables that deter individuals from moving away from car-centric behavior and into adopting new mobility solutions [79,80,81,82,83]. In this study, however, although private vehicle users also showed the mentioned strong sense of ownership, they somewhat also acknowledged the importance of public transport for improving the environment. They were less inclined to try new mobility options compared to multimodal users due to their high degree of discomfort in riding with strangers. Previous research suggests that new mobility options for these users should be promoted as an alternative only in the absence of private transport rather than as a complete replacement of vehicles [82]. However, as per the findings of this study, although they were more inclined towards owning a vehicle, they were moderately more willing to try new services such as MaaS. So, there is a possibility for some shift.

6. Conclusions

In this research, latent class analysis was to probabilistically classify smartphone users into three traveler groups (or clusters) in the National Capital Territory of Delhi, each characterized by similar usage, whilst maximizing the heterogeneity between the groups. It was observed that respondents categorized in Cluster 1 showed a very high reliance on public transport and intermediate public transport, very low reliance on private vehicles, and no use of taxis/app-based taxis. On the other hand, those classified in Cluster 2 showed a significant dependence on all modes of transport. Finally, Cluster 3 respondents showed a greater reliance on private vehicles. From the analysis of app usage patterns for trip planning activities and other travel-impacting purposes, it was concluded that users with lower app dependency had a high probability of getting classified in Cluster 1, as PT and IPT users. Users with a higher app dependency had a high probability of getting classified in Cluster 2 as multimodal travelers, and those with a moderate app dependency were most likely to be classified in Cluster 3 as private vehicle users.
In addition to depicting the three latent class clusters of travelers, an attempt was made to analyze the mentioned covariates as factors which affect the probabilities of individuals to belong to these clusters, especially for the multimodal users with high app usage. It was observed that male and female respondents were relatively less likely to be classified as multimodal travelers than PT and IPT users. Younger respondents were more likely to be classified as multimodal travelers and less likely to be classified as private vehicle users. In addition, respondents with a higher education were highly likely to be classified as multimodal travelers. Smartphone usage experience is a major contributor to app usage, and users with more than five years of smartphone usage experience were very likely to be classified as multimodal users. Respondents who belonged to households with children under 18 years of age were slightly more likely to be classified as multimodal travelers. The respondents who earned INR 20,000 to INR 50,000 had a greater chance of being classified as multimodal travelers. Among the families with a high income, those who belonged to households with an income between INR 50,000 and INR 100,000 had a slightly higher possibility of being classified as a user of private vehicles than as multimodal travelers. It is interesting, however, that there was a considerably high possibility that the respondents belonging to households who earned more than INR 100,000 monthly would be classified as multimodal travelers. The ownership of four-wheeled or two-wheeled vehicles ensured that respondents had a high possibility of being classified as a user of private vehicles and a strong possibility of being classified as a multimodal user too. Multimodal travelers compared travel options, chose the mode of transport per their travel needs and were willing to try new travel methods. As per the responses, these users were pro-environment, felt a little uncomfortable riding with strangers and were most likely to reduce their car dependence if a cheaper alternative was provided, preferably something that could provide the convenience of private transport modes such as cars and bikes without owning them.
These results can potentially aid in the introduction of new app-based mobility concepts, such as MaaS, for providing efficient mobility solutions tailored to the requirements of various user groups. Although environmental awareness is not a necessity for the adoption of these services, it can be argued that these platforms can bring value to users by boosting reliability, lowering prices and facilitating multimodal travel. They also have the potential to create more sustainable transport systems by making public transport more attractive and helping stimulate modal transfers. They can also facilitate more inclusivity by addressing the potential needs of neighboring and adjacent areas that do not have sufficient access to public transport. Based on these insights, the results of the study can also help policymakers in making effective policies for the adoption of these services.
For PT and IPT users, policymakers should ensure that the traditional forms of public transport and IPT are not compromised while introducing a smartphone-oriented mobility ecosystem, and the new systems must be integrated around the existing transit options as an additional choice for the users. Given incentives, coupled with an increasing familiarity with smartphones and cost-saving alternatives, these users may even be willing to shift to the newer travel platforms. For multimodal travelers, cost is also not a big issue, and they can become early adopters and significant users of the new smartphone-based mobility platforms while reducing the private vehicle use of other modes. Furthermore, given their attitudes towards traditional transport, we can expect them to (slightly) reduce their usage of public transport by shifting to app-based on-demand services. Focusing on practical benefits that services such as MaaS offer, awareness campaigns can help this group shift away from private transport while also avoiding substantial departures from the usage of public transport based on environmental sensitivity. Although cost is not a problem for private vehicle users as well, inducing a behavioral shift is very difficult with this group, and MaaS-like services would have to be pitched to them as an alternative to some travel purposes, coupled with incentives.
At present, however, the scope of the study is limited to the context of a huge megalopolis such as the NCT of Delhi. Due to the nationwide push towards digitalization, smartphone penetration is increasing in all parts of the country, especially in large- and medium-sized cities. App-based shared mobility services are already available in most of these cities. So, as a future scope of work, assessing the factors impacting transport usage of mobility app users in those metropolises and cities, along with assessing other megalopolises such as Mumbai, Kolkata, Bengaluru, etc., would provide more comprehensive results and help in making better policies for aiding in the adoption of new mobility services.

Author Contributions

Conceptualization, K.S. and S.G.; methodology, K.S. and S.G.; software, K.S.; validation, K.S. and S.G.; formal analysis, K.S.; investigation, K.S. and S.G.; resources, K.S.; data curation, K.S.; writing—original draft preparation, K.S.; writing—review and editing, K.S. and S.G.; visualization, K.S.; supervision, S.G. All authors have read and agreed to the published version of the manuscript.

Funding

This research received no external funding.

Institutional Review Board Statement

Not applicable.

Informed Consent Statement

Informed consent was obtained from all subjects involved in the study.

Data Availability Statement

The data presented in this study are available upon request from the corresponding author. The data are not publicly available as they are part of ongoing doctoral research.

Conflicts of Interest

The authors declare no conflict of interest.

References

  1. Giannopoulos, G.A. The application of information and communication technologies in transport. Eur. J. Oper. Res. 2004, 152, 302–320. [Google Scholar] [CrossRef]
  2. Mokhtarian, P.L.; Tal, G. Impacts of ICT on Travel Behaviour: A Tapestry of Relationships. Sage Handb. Transp. Stud. 2013, 14, 241–260. [Google Scholar]
  3. Couclelis, H. Housing and the New Geography of Accessibility in the Information Age. Open House Int. 2003, 28, 7–13. [Google Scholar]
  4. Harvey, A.S.; Taylor, M.E. Activity settings and travel behaviour: A social contact perspective. Transportation 2000, 27, 53–73. [Google Scholar] [CrossRef]
  5. Number of Smartphone Users in India in 2010 to 2020, with Estimates Until 2040. Available online: https://www.statista.com/statistics/467163/forecast-of-smartphone-users-in-india/ (accessed on 13 July 2021).
  6. Smartphone Penetration Rate in India from 2010 to 2020, with Estimates Until 2040. Available online: https://www.statista.com/statistics/1229799/india-smartphone-penetration-rate/ (accessed on 13 July 2021).
  7. ReportLinker, Online Taxi Services Market in India 2020. Available online: https://www.reportlinker.com/p05881870/Online-Taxi-Services-Market-in-India.html (accessed on 11 December 2020).
  8. Geels, F.W. A socio-technical analysis of low-carbon transitions: Introducing the multi-level perspective into transport studies. J. Transp. Geogr. 2012, 24, 471–482. [Google Scholar] [CrossRef]
  9. Lyons, G. Transport’s digital age transition. J. Transp. Land Use 2015, 8, 1–19. [Google Scholar]
  10. Hartikainen, A.; Pitkänen, J.-P.; Riihelä, A.; Räsänen, J.; Sacs, I.; Sirkiä, A.; Uteng, A. WHIMPACT—Insights from the World’s First Mobility-as-a-Service (MaaS) System; Ramboll: Copenhagen, Denmark, 2019. [Google Scholar]
  11. Cities Forum, MaaS India. Available online: https://www.citiesforum.org/maas-india/ (accessed on 13 July 2021).
  12. MoHUA, About Smart Cities Mission. 2015. Available online: https://smartcities.gov.in/about-the-mission (accessed on 15 June 2022).
  13. Deokar, R. Smart Transportation: Bringing Smart Cities into Reality. Available online: http://bwsmartcities.businessworld.in/article/Smart-Transportation-Bringing-smart-cities-into-reality/17-03-2020-186418/ (accessed on 17 March 2020).
  14. Meit, Y. India’s Trillion Dollar Digital Opportunity; Ministry of Electronics and Information Technology, Government of India: New Delhi, India, 2019. [Google Scholar]
  15. Brazil, W.; Caulfield, B. Does green make a difference: The potential role of smartphone technology in transport behaviour. Transp. Res. Part C Emerg. Technol. 2013, 37, 93–101. [Google Scholar] [CrossRef]
  16. Khan, N.A.; Habib, M.A.; Jamal, S. Effects of smartphone application usage on mobility choices. Transp. Res. Part A Policy Pract. 2020, 132, 932–947. [Google Scholar] [CrossRef]
  17. Kaplan, S.; Monteiro, M.M.; Anderson, M.K.; Nielsen, O.A.; Dos Santos, E.M. The role of information systems in non-routine transit use of university students: Evidence from Brazil and Denmark. Transp. Res. Part A Policy Pract. 2017, 95, 34–48. [Google Scholar] [CrossRef]
  18. Windmiller, S.; Hennessy, T.; Watkins, K.E. Accessibility of Communication Technology and the Rider Experience: Case Study of Saint Louis, Missouri, Metro. Transp. Res. Rec. J. Transp. Res. Board 2014, 2415, 118–126. [Google Scholar] [CrossRef]
  19. Julsrud, T.E.; Denstadli, J.M. Smartphones, travel time-use, and attitudes to public transport services—Insights from an explorative study of urban dwellers in two Norwegian cities. Int. J. Sustain. Transp. 2017, 11, 602–610. [Google Scholar] [CrossRef]
  20. Mannan, L. With over 1 B Installs, and $400 M In-App Revenue, India Has a Booming App Economy, Yourstory.com. 8 March 2018. Available online: https://yourstory.com/2018/03/1-b-installs-400-m-app-revenue-india-booming-app-economy/amp (accessed on 17 September 2022).
  21. Matteo. What Are the Different Types of Mobile Apps? Duckma.com. 2018. Available online: https://blog.duckma.com/en/types-of-mobile-apps/ (accessed on 17 September 2021).
  22. Dio, S.D.; Gennusa, M.L.; Peri, G.; Rizzo, G.; Vinci, I. Involving people in the building up of smart and sustainable cities: How to influence commuters’ behaviors through a mobile app game. Sustain. Cities Soc. 2018, 42, 325–336. [Google Scholar] [CrossRef]
  23. Torres-Sospedra, J.; Avariento, J.; Rambla, D.; Montoliu, R.; Casteleyn, S.; Benedito-Bordonau, M.; Gould, M.; Huerta, J. Enhancing integrated indoor/outdoor mobility in a smart campus. Int. J. Geogr. Inf. Sci. 2015, 29, 1955–1968. [Google Scholar] [CrossRef]
  24. Srinivasan, K.K.; Athuru, S.R. Modeling Interaction Between Internet Communication and Travel Activities: Evidence from Bay Area, California, Travel Survey 2000. Transp. Res. Rec. J. Transp. Res. Board 2004, 1894, 230–240. [Google Scholar] [CrossRef]
  25. Bhat, C.R.; Sivakumar, A.; Axhausen, K.W. An analysis of the impact of information and communication technologies on non-maintenance shopping activities. Transp. Res. Part B Methodol. 2003, 37, 857–881. [Google Scholar] [CrossRef] [Green Version]
  26. Mondschein, A. Passeggiata Nuova: Social Travel in the Era of the Smartphone; Working Paper: Rudin Center for Transportation Policy and Management; New York University: New York, NY, USA, 2011. [Google Scholar]
  27. Xiang, Z.; Wang, D.; O’Leary, J.T.; Fesenmaier, D.R. Adapting to the Internet: Trends in Travelers’ Use of the Web for Trip Planning. J. Travel Res. 2014, 54, 511–527. [Google Scholar] [CrossRef]
  28. Banister, D. The sustainable mobility paradigm. Transp. Policy 2008, 15, 73–80. [Google Scholar] [CrossRef]
  29. van Wee, B.; Annema, J.A.; Banister, D. The Transport System and Transport Policy: An Introduction; Edward Elgar Publishing: Cheltenham, UK, 2013. [Google Scholar]
  30. Konrad, K.; Wittowsky, D. Virtual mobility and travel behavior of young people—Connections of two dimensions of mobility. Res. Transp. Econ. 2018, 68, 11–17. [Google Scholar] [CrossRef]
  31. Tully, C.; Alfaraz, C. Youth and mobility: The lifestyle of the new generation as an indicator of a multi-local everyday life. Appl. Mobilities 2017, 2, 182–198. [Google Scholar] [CrossRef]
  32. Heinen, E.; Chatterjee, K. The same mode again? An exploration of mode choice variability in Great Britain using the National Travel Survey. Transp. Res. Part A Policy Pract. 2015, 78, 266–282. [Google Scholar] [CrossRef] [Green Version]
  33. Jones, P.; Clarke, M. The significance and measurement of variability in travel behaviour. Transportation 1988, 15, 65–87. [Google Scholar] [CrossRef]
  34. Kitamura, R.; Yamamoto, T.; Susilo, Y.O.; Axhausen, K.W. How routine is a routine? An analysis of the day-to-day variability in prism vertex location. Transp. Res. Part A Policy Pract. 2006, 40, 259–279. [Google Scholar] [CrossRef] [Green Version]
  35. Lavery, T.; Páez, A.; Kanaroglou, P. Driving out of choices: An investigation of transport modality in a university sample. Transp. Res. Part A Policy Pract. 2013, 57, 37–46. [Google Scholar] [CrossRef]
  36. Schlich, R.; Axhausen, K.W. Habitual travel behaviour: Evidence from a six-week travel diary. Transportation 2003, 30, 13–36. [Google Scholar] [CrossRef]
  37. Aarts, H.; Verplanken, B.; Knippenberg, A.V. Predicting Behavior from Actions in the Past: Repeated Decision Making or a Matter of Habit? J. Appl. Soc. Psychol. 2006, 28, 1355–1374. [Google Scholar] [CrossRef]
  38. Kroesen, M. Modeling the behavioral determinants of travel behavior: An application of latent transition analysis. Transp. Res. Part A: Policy Pract. 2014, 65, 56–67. [Google Scholar] [CrossRef]
  39. Clifton, K.; Muhs, C.D. Capturing and Representing Multimodal Trips in Travel Surveys: Review of the Practice. Transp. Res. Rec. J. Transp. Res. Board 2012, 2285, 74–83. [Google Scholar] [CrossRef]
  40. Nobis, C. Multimodality: Facets and Causes of Sustainable Mobility Behavior. Transp. Res. Rec. J. Transp. Res. Board 2007, 2010, 35–44. [Google Scholar] [CrossRef]
  41. Blumenberg, E.; Pierce, G. Multimodal travel and the poor: Evidence from the 2009 National Household Travel Survey. Transp. Lett. 2014, 6, 36–45. [Google Scholar] [CrossRef]
  42. Kuhnimhof, T.; Buehler, R.; Wirtz, M.; Kalinowska, D. Travel trends among young adults in Germany: Increasing multimodality and declining car use for men. J. Transp. Geogr. 2012, 24, 443–450. [Google Scholar] [CrossRef]
  43. Vij, A.; Carrel, A.; Walker, J.L. Incorporating the influence of latent modal preferences on travel mode choice behavior. Transp. Res. Part A Policy Practicevol. 2013, 54, 164–178. [Google Scholar] [CrossRef]
  44. Van Exel, N. Could you also have made this trip by another mode? An investigation of perceived travel possibilities of car and train travellers on the main travel corridors to the city of Amsterdam, The Netherlands. Transp. Res. Part A Policy Pract. 2009, 43, 374–385. [Google Scholar] [CrossRef]
  45. Diana, M.; Mokhtarian, P.L. Desire to change one’s multimodality and its relationship to the use of different transport means. Transp. Res. Part F Traffic Psychol. Behav. 2009, 12, 107–119. [Google Scholar] [CrossRef]
  46. Diana, M.; Mokhtarian, P.L. Grouping travelers on the basis of their different car and transit levels of use. Transportation 2009, 36, 455–467. [Google Scholar] [CrossRef]
  47. Diana, M. From mode choice to modal diversion: A new behavioural paradigm and an application to the study of the demand for innovative transport services. Technol. Forecast. Soc. Change 2010, 77, 429–441. [Google Scholar] [CrossRef] [Green Version]
  48. Circella, G.; Fulton, L.; Alemi, F.; Berliner, R.M.; Tiedeman, K.; Mokhtarian, P.L.; Handy, S. Part I: Investigating the Environmental Concerns, Lifestyles, Mobility-Related Attitudes and Adoption of Technology of Young Adults in California. In What Affects Millennials Mobility; National Center for Sustainable Transportation: Davis, CA, USA, 2016. [Google Scholar]
  49. Circella, G.; Alemi, F.; Tiedeman, K.; Berliner, R.M.; Lee, Y.; Fulton, L.; Mokhtarian, P.L.; Handy, S. Part II: The Impact of Residential Location, Individual Preferences and Lifestyles on Young Adults’ Travel Behavior in California. In What Affects Millennials’ Mobility? National Center for Sustainable Transportation: Davis, CA, USA, 2017. [Google Scholar]
  50. Karlsson, M.; Sochor, J.; Aapaoja, A.; Eckhardt, J.; König, D. Deliverable 4—Impact Assessment: MAASiFiE project funded by CEDR. In Proceedings of the Conference of European Directors of Roads (CEDR), Brussels, Belgium, 10 April 2017. [Google Scholar]
  51. Sochor, J.; Karlsson, I.C.M.; Strömberg, H. Trying Out Mobility as a Service: Experiences from a Field Trial and Implications for Understanding Demand. Transp. Res. Rec. J. Transp. Res. Board 2016, 2542, 57–64. [Google Scholar] [CrossRef]
  52. Goodall, W.; Fishman, T.D.; Bornstein, J.; Bonthron, B. The Rise of Mobility as a Service; Deloitte University Press: New York, NY, USA, 2017. [Google Scholar]
  53. Shaheen, S.; Totte, H.; Stocker, A. Future of Mobility White Paper; Institute of Transportation Studies at UC Berkeley: Berkeley, CA, USA, 2018. [Google Scholar]
  54. Strömberg, H.; Rexfelt, O.; Karlsson, I.M.; Sochor, J. Trying on change—Trialability as a change moderator for sustainable travel behaviour. Travel Behav. Soc. 2016, 4, 60–68. [Google Scholar] [CrossRef]
  55. MHA. Census of India; Ministry of Home Affairs, Government of India: New Delhi, India, 2011. [Google Scholar]
  56. Planning Commission. Economic Survey of Delhi 2021–2022; Government of NCT of Delhi: New Delhi, India, 2022. [Google Scholar]
  57. TRAI. Press Release No.12/2022—Highlights of Telecom Subscription Data; Telecom Regulatory Authority of India: New Delhi, India, 2022. [Google Scholar]
  58. Jamal, S.; Habib, M.A.; Khan, N.A. Does the Use of Smartphone Influence Travel Outcome? An Investigation on the Determinants of the Impact of Smartphone Use on Vehicle Kilometres Travelled. Transp. Res. Procedia 2017, 25, 2690–2704. [Google Scholar] [CrossRef]
  59. Liebetrau, A.M. Measures of Association; SAGE Publications Inc.: London, UK, 1983. [Google Scholar]
  60. Cohen, J. Statistical Power Analysis for the Behavioral Sciences, 2nd ed.; Routledge: New York, NY, USA, 1988. [Google Scholar]
  61. Williams, B.; Onsman, A.; Brown, T. Exploratory factor analysis: A five-step guide for novices. Australas. J. Paramed. 2010, 8, 1–13. [Google Scholar] [CrossRef] [Green Version]
  62. Field, A. Discovering Statistics Using IBM SPSS Statistics, 4th ed.; SAGE Publications Ltd.: London, UK, 2013. [Google Scholar]
  63. Hutcheson, G.D.; Sofroniou, N. The Multivariate Social Scientist—Introductory Statistics Using Generalized Linear Models; SAGE Publications Ltd.: London, UK, 1999. [Google Scholar]
  64. Molin, E.; Mokhtarian, P.; Kroesen, M. Multimodal travel groups and attitudes: A latent class cluster analysis of Dutch travelers. Transp. Res. Part A Policy Pract. 2016, 83, 14–29. [Google Scholar] [CrossRef] [Green Version]
  65. Lee, Y.; Circella, G.; Mokhtarian, P.L.; Guhathakurta, S. Are millennials more multimodal? A latent class cluster analysis with attitudes and preferences among millennial and Generation X commuters in California. Transportation 2020, 47, 2505–2528. [Google Scholar] [CrossRef]
  66. Vermunt, J.K.; Magidson, J. Latent Class Cluster Analysis. Applied Latent Class Analysis; Hagenaars, J.A., McCutcheon, A.L., Eds.; Cambridge University Press: Cambridge, MA, USA, 2002; pp. 89–106. [Google Scholar]
  67. Garson, G.D. Software Review: Latent Gold. Soc. Sci. Comput. Rev. 2001, 19, 369–378. [Google Scholar] [CrossRef]
  68. Akaike, H. Factor analysis and AIC. Psychometrika 1987, 52, 317–332. [Google Scholar] [CrossRef]
  69. Schwarz, G. Estimating the Dimension of a Model. Ann. Stat. 1978, 6, 461–464. [Google Scholar] [CrossRef]
  70. Al-Ayyash, Z.; Abou-Zeid, M.; Kaysi, I. Modeling the demand for a shared-ride taxi service: An application to an organization-based context. Transp. Policy 2016, 48, 169–182. [Google Scholar] [CrossRef]
  71. Ho, C.Q.; Hensher, D.A.; Mulley, C.; Wong, Y.Z. Potential uptake and willingness-to-pay for Mobility as a Service (MaaS): A stated choice study. Transp. Res. Part A Policy Pract. 2018, 117, 302–318. [Google Scholar] [CrossRef]
  72. Hensher, D.A. The imbalance between car and public transport use in urban Australia: Why does it exist? Transp. Policy 1998, 5, 193–204. [Google Scholar] [CrossRef] [Green Version]
  73. Ryley, T.J.; Stanley, P.A.; Enoch, M.P.; Zanni, A.M.; Quddus, M.A. Investigating the contribution of Demand Responsive Transport to a sustainable local public transport system. Res. Transp. Econ. 2014, 48, 364–372. [Google Scholar] [CrossRef] [Green Version]
  74. Clewlow, R.; Mishra, G.S. Shared Mobility: Current Adoption, Use, and Potential Impacts on Travel Behavior. In Proceedings of the Transportation Research Board 96th Annual Meeting, Washington, DC, USA, 8–12 January 2017. [Google Scholar]
  75. Dias, F.F.; Lavieri, P.S.; Garikapati, V.M.; Astroza, S.; Pendyala, R.M.; Bhat, C.R. A behavioral choice model of the use of car-sharing and ride-sourcing services. Transportation 2017, 44, 1307–1323. [Google Scholar] [CrossRef]
  76. Shaheen, S.A.; Cohen, A.P.; Martin, E.W. Public Bikesharing in North America: Early Operator Understanding and Emerging Trends. Transp. Res. Rec. J. Transp. Res. Board 2013, 2387, 83–92. [Google Scholar] [CrossRef]
  77. Verplanken, B.; Aarts, H.; Van Knippenberg, A. Habit, information acquisition, and the process of making travel mode choices. Eur. J. Soc. Psychol. 1998, 27, 539–560. [Google Scholar] [CrossRef]
  78. Alonso-González, M.J.; Hoogendoorn-Lanser, S.; van Oort, N.; Cats, O.; Hoogendoorn, S. Drivers and barriers in adopting Mobility as a Service (MaaS)—A latent class cluster analysis of attitudes. Transp. Res. Part A 2020, 132, 378–401. [Google Scholar] [CrossRef]
  79. Burkhardt, J.E.; Millard-Ball, A. Who is Attracted to Carsharing? Transp. Res. Rec. J. Transp. Res. Board 2006, 1986, 98–105. [Google Scholar] [CrossRef]
  80. Efthymiou, D.; Antoniou, C.; Waddell, P. Factors affecting the adoption of vehicle sharing systems by young drivers. Transp. Policy 2013, 29, 64–73. [Google Scholar] [CrossRef]
  81. Lane, C. PhillyCarShare: First-Year Social and Mobility Impacts of Carsharing in Philadelphia, Pennsylvania. Transp. Res. Rec. J. Transp. Res. Board 2005, 1927, 158–166. [Google Scholar] [CrossRef]
  82. Paundra, J.; Rook, L.; van Dalen, J.; Ketter, W. Preferences for car sharing services: Effects of instrumental attributes and psychological ownership. J. Environ. Psychol. 2017, 53, 121–130. [Google Scholar] [CrossRef] [Green Version]
  83. Zheng, J.; Scott, M.; Rodriguez, M.; Sierzchula, W.; Platz, D.; Guo, J.Y.; Adams, T.M. Carsharing in a University Community: Assessing Potential Demand and Distinct Market Characteristics. Transp. Res. Rec. J. Transp. Res. Board 2009, 2110, 18–26. [Google Scholar] [CrossRef]
Figure 1. A representation of the LCCA with covariates and indicators.
Sustainability 14 13768 g001
Figure 2. Percentages of samples classified into various clusters by the LCCA model.
Sustainability 14 13768 g002
Figure 3. Cluster-wise Transport Mode Usage Patterns.
Sustainability 14 13768 g003
Figure 4. Cluster probabilities of respondents based on their Usage of Trip Planning Activities.
Sustainability 14 13768 g004
Figure 5. Cluster probabilities of respondents based on their Usage of other Travel-Impacting Purposes.
Sustainability 14 13768 g005
Figure 6. Weighted mean EFA scores for choice of travel.
Sustainability 14 13768 g006
Table 1. Types of Smartphone Apps available in Delhi for Travel Needs.
App TypeTravel RequirementsExamples
Travel Apps for Trip Planning ActivitiesDeciding Departure TimeMap services (Google, Apple, etc.)
Deciding Trip DestinationBookMyShow, Zomato, etc.
Selecting Mode of TransportMap services (Google, Apple, etc.), One Delhi App, etc.
Selection of RouteMap services (Google, Apple, etc.)
Communicating and CoordinatingSocial networking services, chat services, etc.
Online Taskse-Tickets (IRCTC, BookmyShow, PayTM, etc.), smartcard recharging (Paytm, Phonepay, etc.)
Travel Apps for Other Travel-Impacting PurposesReserving Taxis/CabsOla, Uber, Rapido, Zoomcar, Volar, etc.
Checking Bus/Metro SchedulesMap services (Google, Apple, etc.), One Delhi App, etc.
NavigationMap services (Google, Apple, etc.)
Online ShoppingShopping (Amazon, Myntra, etc.), food delivery (Swiggy, Zomato, etc.) and quick grocery delivery (Swiggy, Instamart)
Virtual ActivitiesBanking (UPI, internet banking, etc.), education (EdX, Byjus, Unacademy, etc.) and utilities (Urban Company)
Scheduling MeetupsSocial networking services, chat services, video conferencing (Facebook, WhatsApp, Zoom, etc.)
Source: Authors.
Table 2. Chi-Square test for Gender and Frequency of Use of Transport Systems.
Transport System Assessed for Frequency of UseGender
Pearson’s Chi-Square:
Asymptotic Significance (Two-Sided)
Cramér’s V
Private vehicleLess than 0.010.234
Public transport0.874-
Intermediate public transportLess than 0.010.214
App-based cab servicesLess than 0.010.168
Table 3. Statements for assessing the Attitudes of Smartphone Users towards their Choice of Transport.
StatementsFactor Loadings
1.It does not matter what type of mode I use, if it is suitable for my travel needs.0.4
2.I often compare various travel options and modes of transportation before starting a trip.0.7
3.To improve transport, it is essential to be able to easily combine different modes of transport, such as buses, cars, bicycles or car sharing.0.6
4.I am ready to try new ways and systems to travel.0.6
5.It is uncomfortable to ride public transport with strangers.0.6
6.Public transport lacks in cleanliness.0.5
7.Use of public transport is important to preserve the environment.0.5
8.I prefer to use public transport and/or share my rides for reducing travel costs.0.8
9.I would prefer to enjoy the convenience of a car without owning it.0.6
10.I like privacy offered by a private car or bike.0.7
11.People like me only use privately owned cars and/or bikes.0.6
12.If there was a cheaper alternative, I would reduce my private vehicle usage.0.6
Table 4. Evaluation of the information criteria for models with a different number of classes.
Number of Classes1234
AIC36,00535,56235,24535,553
BIC38,12037,67737,36037,668
Table 5. Cluster probabilities of respondents based on socioeconomic characteristics.
Socioeconomic CharacteristicsLatent Classes (Clusters)
Cluster 1:
PT and IPT Users
Cluster 2:
Multimodal Travelers
Cluster 3:
Private Vehicle Users
Gender <Inactive>
Male41.5%33.8%24.7%
Female41.6%33.7%24.7%
Age Group
18 to 24 Years40%60%0%
25 to 34 Years40%60%0.0%
35 to 44 Years40%20%40%
45 to 54 Years40%0%60%
55 to 64 Years44%0%56%
65 Years and above60%0%40%
Educational Qualification
High (undergraduate degree or more)4.4%71.7%23.9%
Medium (high school education)27.7%36.5%35.8%
Low (less than high school education)81.7%0%18.3%
Experience with Smartphone Use
Less than 1 Year100%0%0%
1 to 3 Years100%0%0%
3 to 5 Years86.9%13.1%0%
More than 5 Years14.2%47.9%37.9%
Household Composition
With Children below 18 Years35.9%36.3%27.9%
Without Children below 18 Years46.6%31.5%21.9%
Monthly Household Income
Less than INR 5000100%0%0%
INR 5000 to 20,000100%0%0%
INR 20,000 to 50,0007.5%49.1%43.4%
INR 50,000 to 100,0000%49.1%50.9%
More than INR 100,0000%70.8%29.2%
Four-Wheeler Ownership
None91.8%0%8.2%
One3.5%47.6%48.9%
Two0%38.2%61.8%
Three or More0%26.3%73.7%
Two-Wheeler Ownership
None89.6%0%10.4%
One25%36.1%38.9%
Two or More2.3%40.2%57.6%
The bold values represent the highest value for each row.
Publisher’s Note: MDPI stays neutral with regard to jurisdictional claims in published maps and institutional affiliations.

