Abstract
The economic benefits of rail development are well researched, but the social effects of rail are largely understudied, especially in China. We analyze the association between educational attainment level and urban rail development using the 2000 and 2010 census data from Central Guangzhou, China, and a linear mixed-effects modeling approach. Our results indicate that the change in education level is greater in rail neighborhoods than in non-rail neighborhoods in the central area of Guangzhou, and that the rail/metro-induced effect on educational attainment level is evidenced. This research contributes to the existing literature by exploring a new method for this line of research and providing empirical evidence of social changes in a city that has experienced rapid economic growth and pioneered rail development in China, a developing country. The limitations and implications of the research are discussed.
1. Introduction
The urban rail system has played an important role in urban traffic system and has reshaped urban developments by expanding urban scale, updating urban functions, changing land-use patterns, increasing land value, improving human settlement, reducing energy and carbon dioxide emissions, and promoting urban renewal or urban regeneration [1,2,3,4]. As of 2018, there were a total of 26,900 rail stations and 26,100 km of rail lanes in 493 cities around the world [5]. Many city governments have also implemented transit-oriented developments (TOD) around rail stations. Common TOD characteristics are high density and mixed-use developments that are integrated with commercial, tourism, sports, education, residence and other developments [6]. The widespread TODs have changed urban built environment around rail stations, as old residential areas, businesses, and abandoned factories are replaced by new uses. By improving the surrounding environment and accessibility, many areas around the rail stations have experienced an increase in job opportunities and regional amenities. As a result, an increasing number of residents from upper socio-economic classes, especially those with higher education levels and more disposable income, choose to live near the rail stations [7,8,9,10]. Scholars term these phenomena as TOD-induced or transit/Metro-induced gentrification [7,11,12,13].
China has experienced tremendous development during the last few decades. Urban population and urban land use had expanded about 4 and 8 times, respectively, from 1980 to 2018. An increasing number of Chinese cities built their rail systems to meet the increasing transport, housing and other demands associated with rapid urban growth and to maintain urban sustainability. It is reported that more than 43 cities owned rail systems and more than 30 cities planned to build a metro system in 2019 [14,15]. Most Chinese cities have implemented the TOD model in their rail system design. It is believed that TOD development can not only reduce urban traffic congestion, but also promote real estate development and bring large revenues growth for local governments, which are critical to maintaining urban sustainability [16,17]. The urban built environment and socio-economic composition in neighborhoods near rail stations have changed [18]. However, studies of TODs in Chinese cities have largely focused on the physical, economical, and environmental effects but less on social effects. Using Guangzhou, one of the largest cities with a major metro system located in the south of China, as a case study, this study examines if metro/rail-induced educational change occurs in the city using a linear mixed-effects modeling approach as well as the 2000 and 2010 census data of Guangzhou. We contribute to the existing literature by exploring a new method for this line of research and providing empirical evidence of metro/rail-induced social effects in a city that is one of the few pioneers in rail development in China.
In the following, we briefly review the studies on rail/metro-induced effects in China. Following the description of our research design, we present our research results. We conclude the paper with a discussion of the research implications and limitations.
2. Chinese Urban Rail Development, Effects, and Studies
2.1. Definitions of Gentrification
The term gentrification was originally used to describe the influx of gentry in lower-income neighborhoods in London during the 1950s and 1960s [19]. Today, the meaning of gentrification has been enriched and broadened to describe the diverse forms and processes based on different economic, political, and geographical circumstances from a sustainability’s perspective. Contemporary studies use the term to illustrate the spatial transformation phenomenon of the old and broken central areas into new commercial, official, or other uses with higher values and, simultaneously, the social process of residential neighborhoods with low-income, disadvantaged social groups being replaced by affluent classes [13,20,21].
A number of researchers use “cultural gentrification” for the phenomenon of new residents or visitors with higher education or socio-economic status being attracted by new cultural facilities such as flagship developments [22,23], sports arenas [24], convention centers [25] and office complexes [26]. Others consider changes in the commercial environment of neighborhoods as “commercial and retail gentrification” [27,28]. Scholars also note that once operated, lands located close to metro stations tend to have a much higher probability of redevelopment than lands located farther away [29]. They term this type of change “transit- or metro-induced gentrification” [12,30,31,32,33,34].
2.2. Urban Rail Development in China
Metro/rail-induced effects are relatively new phenomena in Chinese cities. Compared to western cities, such effects are driven by government-led urban developments. Government power, in combination with market forces, has been the main force behind the urbanization and city rail developments in China, and has shaped Chinese social and spatial stratification [21,35,36]. Studies have argued that China’s urbanization has been motivated by land development and land finance, which has become a much easier and quicker source for local governments. Land revenues account for about 51% of the overall government revenue in many Chinese cities [37]. Consequently, land-centered urban policies including rail and TOD developments have been one prominent force behind the spectacular expansion of Chinese cities since the mid-1990s [38].
In the last several decades, Chinese governments have invested significant resources in urban rail systems. As of 2017, China owns four of the top 10 longest urban rail systems in the world [39]. Many cities have also promoted transit-oriented-developments (TOD) around urban rail stations. For example, Guangzhou planned to increase the rate of commute by public transport to 75% through the metro system [40]. As the main government-led urban developments, urban rail system and TODs have played a significant role in shaping the spatial distributions of urban demographic, social, and economic activities, as well as the built environment in Chinese cities. Particularly, metro/rail-induced social effects are often seen as a process accompanying government-led urban renewal, whereby vulnerable households are removed or relocated from prime locations of the city to make residential and/or consumption space for the new rich. The sociocultural change in the Chinese urban context is evidenced by the strengthened market mechanism in housing distribution, though the overall housing conditions are improved [21,36,41].
2.3. Studies of Rail/Metro-Induced Effects in China
An increasing number of studies have begun to focus on the impacts of rail systems and TODs in China in recent years. However, most of the studies focus mainly on travel patterns or traffic effects, housing prices and land values, as well as land-use or environmental issues. Fewer studies consider the social effects of city rail systems. Studies on the traffic effects of the Chinese city rail systems generally indicate that the urban rail systems have positive influences on travel behavior and transport accessibility. In most Chinese mega-cities (e.g., Beijing, Shanghai and Guangzhou), rail systems have largely expanded residents’ travel range and shortened travel time, and thus became an efficient mechanism in urban commuting. Urban rail systems have also increased job and residential accessibility [42,43]. Studies of rail travel pattern indicate that there has been a significant increase in commute passenger flow between central area and peripheral area [44]. Factors such as CBD location, commercial land use, residential land use, the number of entrances or exits, and walking accessibility from job or residential locations to rail stations all affect transit ridership [45]. The rail impacts on travel have implications for air quality, especially when old and high emission vehicles are widely used or when cars are a major source of air pollution.
Studies on the economic effects of the rail system in China by and large conclude that construction of the new metro significantly increases land prices and changes the land-use structure. For example, Liu and Feng (2009) evaluated the land-use structure around five rail/metro stations before and after metro construction in Shenzhen [46]. Their study showed that land use tended to be comprehensive as transport accessibility improved around metro stations. Such findings are supported by recent studies in Zhengzhou, Guangzhou and Wuhan [47,48,49]. On the other hand, a study of Beijing by Zhao et al. (2018) indicated that, while land deals are associated with metro development, there is no clear relationship between metro development and land-use types or land intensification [50].
Studies also found that land price and housing value around rail stations or along rail corridors increased in many cities, though the intensity varied in different locations and at different stages of rail planning, construction, and operation [47,48,49,51,52,53]. Studies of commercial developments indicated that urban rail generally accelerated developments around transfer stations and in central business districts [54,55,56,57,58,59,60,61]. Commercial land and new towns expanded radially, along with metro corridors and stations [58,59].
Despite this awareness, fewer studies have focused on the social effects of the Chinese rail system. Studies of social effects are mostly descriptive. For example, several studies have noted that rail systems were designed to solve the job–housing balance in many Chinese cities [60]. Others highlighted that people with a stable job, aged between 20 and 40 and in middle- or low-income groups, tended to use the rail system more than other groups, and that employees near metro stations mainly worked in IT, finance and general office jobs, of which the proportion of employees with a bachelor’s degree or above was close to 63% [61,62]. Another report based on Baidu Smarteye big data showed that the M5 metro line in Tianjin had attracted young, white-collar, and high-income population people. Between December 2018 and June 2019, the population growth rate along the corridor was higher than the city average. About 74% of the population along the corridor were 44 and younger. The income level and vehicle ownership of the rail riders were lower than the averages of the population living along the corridor. The proportion of rail riders who were engaged on technology activities was lower than those living along the corridor, while the proportion of rail riders who were self-employed was higher that the portion of those living along the corridor [63].
Using a hedonic model and data from Beijing in 2007 and 2010, Zheng and Kahn (2013) found that land prices near public infrastructure are higher than those further away [18]. Their results of parsimonious regression models also indicate that education attainment and income levels at the zonal level are higher in areas close to Olympic Park and new subway stops than other areas. These studies suggest that demographic and social changes may have occurred around rail stations or along metro line corridors in Chinese cities, as people with higher education, younger, and stable occupations tend to gather around rail stations. However, some of these studies are descriptive. The studies of social effects of rail/metro are largely limited in number and scope.
In sum, along with the rapid development of the Chinese city rail systems, the urban socio-economic structure has experienced dramatic changes. However, current studies focus more on the traffic and economic effects of urban rail systems in China and pay less attention to the social effects. Although a number of studies have shown the sociodemographic characteristics in areas around rail systems in many Chinese cities, there is a lack of empirical studies on the possible rail/metro-induced social effects in China. This study attempts to fill this void with a focus on education change.
3. Research Design
The literature on the rail/metro-induced effects has suggested that the socially and economically disadvantaged population are likely to be pushed out and replaced by the dominant race/ethnicity, well-educated, and the wealthier groups in neighborhoods with good or improved access to transportation, amenities convenient for daily life, and new housing due to rising housing prices and unaffordability. This research, by and large, follows this conventional wisdom.
3.1. Research Scope
This study covers the Guangzhou Central City area, as shown in Figure 1, excluding the neighborhoods that are occupied by public facilities or designated as public spaces with no residents (e.g., Pearl River, and Baiyun Mountain), as well as those with no data. The unit of analysis is “neighborhood unit”, referred to in Chinese as Jü Uai Huai (居委会) as defined by the Guangzhou municipal, China. A Jü Uai Huai is the basic autonomous organization of self-management, self-education, and self-service by local residents. The population size of a Jü Uai Huai in high-density, well-developed large or medium-sized cities is about 4000~5000 [64], which is somewhat similar to the average size of census tract in the United States. The 2000 and 2010 census data are the most recent data at the Jü Uai Huai level in central area of Guangzhou, the Chinese seventh census data in 2020 were not available for public use at the time this research commenced. In addition, the majority of the rail stations are in the central area. Such data limitations dictate the scope of this study.
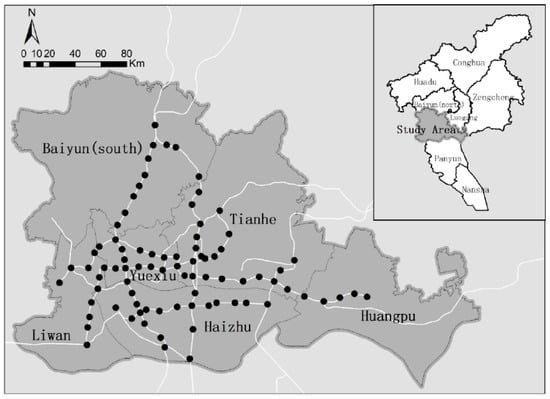
Figure 1.
Study area.
The total sample size for this research is 2375 Jü Uai Huai in the study area (Figure 1). The study area is the most densely populated and economically dynamic area of Guangzhou, with a total population of 6.9851 million according to the 2010 census, which accounts for about 48% of the entire city, including all suburban counties. The Jü Uai Huai in the study area range from the minimum of 0.015 km2 to the maximum of 9.57 km2, with an average of 0.49 km2 each. Eighty Jü Uai Huai in the study area have rail stations, of which 16 Jü Uai Huai had rail stations prior to 2000.
3.2. Analysis Approach
We first tested the differences in sociodemographic characteristics between 2000 and 2010 by t-test. To further investigate the differences and control for other confounding factors, we adopted a Linear Mixed-Effects regression model for this study and compare the results with the conventional Ordinary Least Square (OLS) modeling technique.
As noted earlier, this research focuses on the rail/metro-induced social effects using the census data in 2000 and 2010 for the study area. The key interest is the “rail” effect, and it involves data at two points in time, which presents the issues of repeated measurements and data dependency. The mixed-effects model is more efficient for the research due to a number of reasons. First, the mixed-effects model allows for data dependency and can handle endogeneity or interdependency, making it suitable for the data in this study. Second, it has the option of applying maximum likelihood (ML) or restricted maximum likelihood (RMLE) estimation. This option is plausible as “ML and RMLE methods … give asymptotically efficient estimates for unbalanced as well as balanced designs” [65] (p. 32). Third, compared to the fixed- and the random-effects modeling approaches, the mixed-effects model has the advantage of taking both fixed and random effects and other potentially relevant covariates into account and “bringing all these kinds of longitudinal effects straightforwardly into the statistical model” [66]. The model produces both fixed- and random-effects parameters. A general model specification of a linear mixed model (LMM), according to Cameron and Trivedi [67], is illustrated in Equation (1):
where x′it is the vector of regressors, (αi β′i)′~(β, ∑), Ԑit is an idiosyncratic error.
In this research, social effect was measured by the percentage of the population with a bachelor’s or higher education degree rather than a measure of the race/ethnicity composition used in case studies in the United States. There are two main reasons for choosing this as the measurement of social effect. Unlike the United States, where the population consists of people with diverse cultural backgrounds and from various race/ethnic groups, the majority of the population in China is Han. There is very little diversity of race/ethnicity in China. Income would have been a good measure of class in this line of research. However, income data were not available at the Jü Uai Huai level. Since income in general is highly correlated with education level and data were readily available, we used education as a proxy for income.
Following the conventional wisdom on rail/metro-induced effects, we hypothesized that neighborhoods with rail stations, on average, would have a higher percentage of the population with a bachelor’s or higher degrees than other neighborhoods due to their financial ability to purchase higher priced housing near rail stations, controlling for other sociodemographic, real estate development and time factors. The key independent variables, “rail station” and “year”, which capture the difference between rail and non-rail neighborhoods and change over time, as well as other controlling variables and the expected relationships to the dependent variable, are listed in Table 1. Neighborhoods with rail stations are coded as 1, others as 0. Similarly, the year 2010 is coded as 1, year 2000 as 0. Other variables are all in the percentage of the total in a neighborhood.

Table 1.
Description of independent variables.
4. Results
In this section, we first present the results of changes in all neighborhoods in the study area between 2000 and 2010, followed by the results of changes in neighborhoods with rail stations. The model results are discussed at the end of the section.
4.1. Urban Development between 2000 and 2010
Like many cities in China, Guangzhou as a whole had experienced rapid population growth, from 9,943,000 in 2000 to 12,700,800 in 2010. The growth rate was about 28%, which ranked right after the top ten cities with the highest growth rate in China. Although lower than the growth in Guangzhou as a whole, the central city of Guangzhou in our study experienced about a 21% growth in population between 2000 and 2010. The population growth was significant, as it was higher than many cities in China [68,69].
Neighborhood demographic and economic characteristics in the central city also changed significantly, as shown in Table 2. The percentage of immigrants in the study area actually declined from slightly over 49% in 2000 to less than 48% in 2010. This trend is similar to that in other Chinese mega-cities. For example, in Beijing, the large-scale transformation of the old city that started in the 1990s accelerated the migration of the inner-city population to the Fourth Ring Road and beyond. While overall population in the city increased from 2000 to 2010, the immigrant increases in outside areas were higher than those in the core area of Beijing [70]. The percentage of immigrants in the core area within the Fourth Ring Road decreased from about 39% in 2000 to about 27% in 2010, while the percentage in the area between the Fourth and Sixth Ring Road increased from about 46% in 2000 to about 57% in 2010 [71].
Table 2.
Comparisons in development indicators between rail neighborhoods and all neighborhoods in Central Guangzhou, from 2000 to 2010.
Population aged in the study period and labor force in the study area decreased as shown in Table 2. For example, the percentage of the population aged 65 and over in all neighborhoods, on average, grew from about 7% in 2000 to almost about 9% in 2010. On the other hand, there was a decrease in the percentage of the population in the labor force, from about 80% in 2000 to about 77% in 2010. On the other hand, education levels also increased, as the average percentage of the population with a college or higher degree among all neighborhoods in the study area changed from about 15% in 2000 to 25% in 2010. Industrial makeup also became less labor-intensive and more intellectually focused. For example, the percentage of the population engaged in agriculture and manufacturing decreased from about 30% in 2000 to 19% in 2010, while the percentage of the population engaged in research and technology activities tripled during the same period. Housing had become more commercialized, as the percentage of households owning commercial housing in 2010 increased to more than double the percentage in 2000. In comparison, low-price rental housing only increased by about 7%. Residential housing construction continued to increase, as the percentage of housing units built in 2000 and later increased from about 54% to about 66% during the same period. All the changes, except for the change in immigrants, are statistically significant at the 0.0001 level.
4.2. Developments around Rail Stations between 2000 and 2010
Overall, the changes in rail neighborhoods are similar to the changes in all neighborhoods in the study area (referred to as citywide hereinafter) with different magnitudes and some exceptions (Table 2). Similar to citywide changes, while the average percentage of immigrants in rail neighborhoods decreased from 52% in year 2000 to about 47% in 2010, the difference is insignificant at the 0.05 level. The statistics in Table 2 also illustrate the phenomena of significant changes in the aging population, reductions in the percentage of the population in the labor force, and agriculture and manufactory activities. Moreover, the statistics show increases in education level, new building construction, and commercial housing purchases. These changes, except for the change in low-priced rental housing between 2000 and 2010 in rail neighborhoods, are significant at the 0.0001 level or better.
However, the population in rail neighborhoods is, on average, younger and more educated compared to the population citywide in both years. The average percent of new housing units in rail neighborhoods was also higher than the citywide percent. On the other hand, the average percentage of low-price rental housing in rail neighborhoods was lower than the citywide average. These changes are shown in the last three columns in Table 2, both in terms of difference and ratio. The results suggest that rail neighborhoods experienced changes that are somewhat different from all neighborhoods in our study area.
4.3. Social Change in Neighborhoods with Easy Access to Rail Transit
Are the changes, especially education changes, between 2000 and 2010 in rail neighborhoods significantly different from the overall changes in the study area? Could the developments around rail stations be attributed to the change in education attainment level? To further investigate the possible rail/metro-induced social effects, we first examined the correlations among all variables, then developed models for testing. Table 3 shows the Pearson’s correlation coefficients and significance levels among the variables. As expected, the pairwise correlation between education and variable such as immigrants, research and technology, commercial housing, low-price rental housing, and new construction variables are significant at the 0.001 level. While the correlations between education and age and labor are statistically significant at the 0.001 level, the relationship signs are not as expected. Most importantly, the correlation analysis indicates that the age variable is highly correlated with the immigrant and labor variables; hence, it was excluded from the modeling analyses.
Table 3.
Correlation coefficients among variables.
We first tested the mixed-effects model that includes all the variables listed in Table 1, except for the age variable, due to collinearity. We also ran a conventional Ordinary Least Square (OLS) model with the variables corresponding to model one in order to compare the results and model efficiency. The model results are presented in Table 4.
Table 4.
Model results.
The Akaike’s Information Criterion (AIC) statistics indicate that the mixed-effects model is more efficient than the OLS model. The results indicate that both models exhibit consistent results. The relationships between the dependent variable and all independent variables are in line with the hypotheses. Most variables are statistically significant at the 0.05 or higher levels. The results also indicate that the coefficients of the OLS model are mostly greater than the coefficients of the mixed-effects model, except for the key variables of location and time, which suggests that the OLS model may overestimate the effects of most control variables while underestimate the effects of the location and time variables.
Overall, the variables measuring labor force, research and technology sector employment, commercialized housing and newly built housings are positively related to the dependent variable, while variables measuring immigrants, population engaging in agriculture and manufactory activities, and low-price renting are negatively associated with the dependent variable. Specifically, as seen in the mixed-effects interaction model, the coefficient for the percentage of labor force is about 0.55, meaning that, all else being equal, a 1% increase in labor force is associated with about 0.55% increase in the percentage of the population with college and higher degrees. Similarly, a 1% increase in migration population is associated with about 0.18% decrease in population with high education levels, controlling for the effects of other variables. All else being equal, a 1% increase in the percentage of population engaging in research technologies is associated with about a 1.36% increase in the percentage of the population with college-level and higher degrees. On the other hand, a 1% increase in the percentage of population engaging in agriculture and manufactory activities is associated with about a 0.25% decrease in the percentage of the population with college-level and higher degrees. The coefficients for those variables measuring housing are −0.08 for percentage low-price rent, 0.03 for percentage households buying commercial housing, and 0.12 for percentage living in newly built housing after 2010, as seen in Table 4, and their associations with the dependent variable can be interpreted accordingly.
All else being equal, the time variable is significantly positively associated with the dependent variable at the 0.001 level. Specifically, the results of the mixed-effects model indicate that controlling for the effects of other variables, the percent of population with college or higher degrees in year 2010 was about 7.8% higher than the one in 2000, all else being equal. Similarly, the effect of rail variable is significant at the 0.05 level, indicating that rail neighborhoods on average had about 2.2% of the population with college or beyond more than the percentage in other neighborhoods after controlling for other and the unobserved effects. This result reaffirms the observation from the descriptive analysis.
5. Summary and Discussions
We conducted an empirical study of metro/rail-induced social changes in Guangzhou, China, a city that has experienced quick city rail system development, but its social effects have not been fully investigated in previous studies. We found that, overall, socio-demographic, industrial structure and real estate development in Guangzhou experienced significant changes between 2000 and 2010. Specifically, the population aged, education levels increased, the industrial structure moved towards research and technology and away from agriculture and manufactory, and the percentage of households living in commercial housing and low-price rental housing increased. Meanwhile, new housing development continued. On the other hand, the percentage of immigrants and the labor force decreased during the study period. All changes, except for the change in immigrants, are statistically significant at the 0.001 level. The changes in the rail neighborhoods between 2000 and 2010 by and large followed the same trends as those in the study area overall, with different magnitudes. However, the change in low-price rental housing was not statistically significant at the 0.05 level.
Our model results indicate that controlling for labor, migration, industrial structure, as well as real estate developments, neighborhoods with rail stations experienced a higher increase in the population with college or higher education degrees than in other neighborhoods. The findings of upward changes in the sociodemographic structure in rail station neighborhoods from this study likely suggest a metro/rail-induced social effect in the Guangzhou urban central area. The results are similar to the result in Beijing, as shown in the study by Zheng and Kahn [18].
There are two main reasons for these results. On one hand, new people with higher education degrees moved into areas with easy access to rail because individuals in this group usually have an official or business occupation. The workplaces of offices or businesses are mostly located in the central area, where parking spaces are limited and the cost of parking is high. For example, the floor-areas of A-class office buildings in the central business district (CBD) accounted for more than 90% of the total office buildings with the same class, while parking space was only about 54% of the total in 2018. The highest parking fee in the CBD was 328 RMB/Day compared to 26 RMB/Day in other areas [72]. Additionally, the city government encouraged railway travel for low-carbon purposes. Hence, rail provides a convenient, fast, and cheap mode of travel. Close proximity to rail transit is, therefore, a desired feature that drives up housing costs near rail stations. In addition, this group of individuals can afford the newer housing with higher purchasing or rent prices. Together, these forces lead to changes in education level near rail stations, as described in the rail/metro-induced gentrification theory.
The results may signal a possible limitation in current planning practices and policies that focus on land-use-driven finance. Planners and policymakers at least need to be mindful of the potential social effects when planning for new rail developments and the revitalization of neighborhoods around rail stations or along rail lines in the near future.
We contribute to the literature with new empirical evidence on the social effect in terms of education level and by employing a modeling technique that has not been used in this line of research before. As demonstrated above, this study is based on secondary data from the Chinese census in 2000 and 2010 due to data constraints. The conclusions require further validation with newer and more complete data. There are opportunities to explore other methods and modeling techniques, such as Difference-in-Difference (DID), in this line of research [73]. It should also be noted that the political and economic context for this case study is unique. Many other forces, such as public policies, administrative regulations, registration restrictions, market mechanisms, etc., also play key roles in shaping urban and infrastructure developments and the spatial distributions of population and economic activities. The extents of these impacts vary from one factor to another. Future studies could further the investigation when these data are available.
Author Contributions
The authors confirm contribution to the paper as follows: study conception and design: J.L. and C.Y.; data collection: C.Y. and J.Y.; literature search and review: C.Y., J.L. and J.Y.; analysis and interpretation of results: J.L. and C.Y.; draft manuscript preparation: J.L. and C.Y. All authors have read and agreed to the published version of the manuscript.
Funding
This research was funded by the National Natural Science Foundation of China, title of “The impact and evolution processes of urban renewal on social equity of public space from supply demand perspective” (No. 41871156).
Institutional Review Board Statement
Not applicable.
Data Availability Statement
The main data source for this study was the National Bureau of Statistics (NBS), China. The data are publicly available at http://www.stats.gov.cn/tjsj/pcsj/rkpc/5rp/index.htm, http://www.stats.gov.cn/tjsj/pcsj/rkpc/6rp/indexch.htm (accessed on 15 June 2021).
Acknowledgments
The authors would like to acknowledge the funding support by the National Natural Science Foundation of China. We would also like to thank Chen Dangran, a student at the South China Agricultural University, for his help in drawing the figure. The valuable comments and suggestions from the three anonymous reviewers help to improve the quality of this paper. Any remaining errors are the responsibility of the authors.
Conflicts of Interest
The authors declare no conflict of interest.
References
- Baker, D.M.; Lee, B. How Does Light Rail Transit (LRT) Impact Gentrification? Evidence from Fourteen US Urbanized Areas. J. Plan. Educ. Res. 2019, 39, 35–49. [Google Scholar] [CrossRef]
- Padeiro, M.; Ana, L.; Nuno, M.C. Transit-oriented development and gentrification: A systematic review. Transp. Rev. 2019, 39, 733–754. [Google Scholar] [CrossRef]
- Sun, Y.; Schonfeld, P.; Guo, Q. Optimal extension of rail transit lines. Int. J. Sustain. Transp. 2018, 12, 753–769. [Google Scholar] [CrossRef]
- Carlos, E.S.; de Andrade, M.D.A. The Role of Rail Transit Systems in Reducing Energy and Carbon Dioxide Emissions: The Case of The City of Rio de Janeiro. Sustainability 2016, 8, 150. [Google Scholar] [CrossRef]
- Han, B.M.; Zhang, D.W. Statistics and Analysis of Urban Rail Transit Operation in the World. Urban Rapid Rail Transit 2019, 32, 9–14. (In Chinese) [Google Scholar]
- Hess, D.B.; Almeida, T.M. Impact of Proximity to Light Rail Rapid Transit on Station-Area Property Values in Buffalo, New York. Urban Stud. 2007, 44, 1041–1068. [Google Scholar] [CrossRef]
- Pollack, S.; Bluestone, B.; Billingham, C. Maintaining Diversity in America’s Transit Rich Neighborhoods: Tools for Equitable Neighborhood Change; Dukakis Center for Urban and Regional Policy, Northeastern University: Boston, MA, USA, 2010. [Google Scholar]
- Transit Cooperative Research Program (TCRP). Transit-Oriented Development in the United States: Experiences, Challenges, and Prospects; TCRP Report 102; The National Academies of Sciences, Engineering, and Medicine: Washington, DC, USA, 2004. [Google Scholar]
- Transit Cooperative Research Program (TCRP). Effects of TOD on Housing, Parking, and Travel; TCRP Report 128; The National Academies of Sciences, Engineering, and Medicine: Washington, DC, USA, 2008. [Google Scholar]
- Tiebout, C. A pure theory of local expenditure. J. Political Econ. 1956, 64, 416–424. [Google Scholar] [CrossRef]
- Bardaka, E.; Delgado, M.S.; Florax, R.J.G.M. Causal identification of transit-induced gentrification and spatial spillover effects: The case of the Denver light rail. J. Transp. Geogr. 2018, 71, 15–31. [Google Scholar] [CrossRef]
- Kahn, M.E. Gentrification trends in new transit-oriented communities: Evidence from 14 cities that expanded and built rail transit systems. Real Estate Econ. 2007, 35, 155–182. [Google Scholar] [CrossRef]
- Lees, L.; Slater, T.; Wyly, E.K. Gentrification; Routledge: New York, NY, USA, 2008. [Google Scholar]
- Huadao Zhonghe News. The Latest Inventory of 76 Cities Allowed to Build Rail Transit. 17 December 2019. Available online: http://www.crcc-urcc.com/news_712.html (accessed on 7 April 2020).
- Wikipedia. List of Rail Systems. 2020. Available online: https://zh.wikipedia.org/zh-hans/%E5%9C%B0%E9%90%B5%E5%88%97%E8%A1%A8 (accessed on 7 April 2020).
- Zhang, X.S.; Hu, Z.H.; Ye, X.F. Study on the scope of interest impact of urban rail transit development. J. Tongji Univ. Nat. Sci. Ed. 2005, 33, 1118–1121. (In Chinese) [Google Scholar]
- Zhao, P.; Li, S. Suburbanization, land use of TOD and lifestyle mobility in the suburbs: An examination of passengers’ choice to live, shop and entertain in the metro station areas of Beijing. J. Transp. Land Use 2018, 11, 195–215. [Google Scholar]
- Zheng, S.; Kahn, M.E. Does government investment in local public goods spur gentrification? Evidence from Beijing. R. Estate Econ. 2013, 41, 1–28. [Google Scholar] [CrossRef]
- Glass, R.L. London: Aspects of Change; MacGibbon & Kee: London, UK, 1964. [Google Scholar]
- Aalbers, M.B. Introduction to the forum: From third to fifth-wave gentrification. Tijdschr. Econ. Soc. Geogr. 2019, 110, 1–11. [Google Scholar] [CrossRef]
- He, S. Three waves of state-led gentrification in China. J. Soc. Econ. Geogr. 2019, 110, 26–34. [Google Scholar] [CrossRef]
- Boyer, M.C. Cities for Sale: Merchandising History at South Street Seaport. In Variations on a Theme Park: The New American City and the End of Public Space; Hill and Wang: New York, NY, USA, 1992; pp. 181–204. [Google Scholar]
- Garcia, B. Deconstructing the city of culture: The long-term cultural legacies of Glasgow1990. Urban Stud. 2005, 42, 841–868. [Google Scholar] [CrossRef]
- Chapin, T. Sports Facilities as Urban Redevelopment Catalysts: Baltimore’s Camden Yards and Cleveland’s Gateway. J. Am. Plan. Assoc. 2004, 70, 193–209. [Google Scholar] [CrossRef]
- Sanders, H.T. Convention myths and markets: A critical review of convention center feasibility studies. Econ. Dev. Q. 2002, 16, 195–210. [Google Scholar] [CrossRef]
- Fainstein, S. The Just City; Cornell University Press: Ithaca, NY, USA, 2011. [Google Scholar]
- Brown-Saracino, J. Social Preservationists and the Quest for Authentic Community. City Community 2004, 3, 135–156. [Google Scholar] [CrossRef]
- Chapple, K.; Jacobus, R. Retail Trade as a Route to Neighborhood Revitalization. In Urban and Regional Policy and Its Effects; Pindus, N., Wial, H., Wolman, H., Eds.; Brookings Institution Press: Washington, DC, USA, 2009; Volume 2, pp. 19–68. [Google Scholar]
- Vichiensan, V.; Wasuntarasook, V.; Hayashi, Y.; Kii, M.; Titipakorn Prakayaphun, T. Urban Rail Transit in Bangkok: Chronological Development Review and Impact on Residential Property Value. Sustainability 2022, 14, 284. [Google Scholar] [CrossRef]
- Horner, M.W.; Murray, A.T. Spatial Representation and Scale Impacts in Transit Service Assessment. Environ. Plan. B Plan. Des. 2004, 31, 785–797. [Google Scholar] [CrossRef]
- Calvo, F.J.; de Oña, J.; Arán, F.; Nash, A. Light Rail Transit Experience in Madrid, Spain Effects on Population Settlement and Land Use. Transp. Res. Rec. 2013, 2353, 82–91. [Google Scholar] [CrossRef]
- Cervero, R.; Kang, C.D. Bus rapid transit impacts on land uses and land values in Seoul, Korea. Transp. Policy 2011, 18, 102–116. [Google Scholar] [CrossRef]
- Hurst, N.B.; West, S.E. Public transit and urban redevelopment: The effect of light rail transit on land use in Minneapolis, Minnesota. Reg. Sci. Urban Econ. 2014, 46, 57–72. [Google Scholar] [CrossRef]
- Lin, J.J.; Chung, J.C. Metro-induced gentrification: A 17-year experience in Taipei. Cities 2017, 67, 53–62. [Google Scholar] [CrossRef]
- Fu, Q.; Zhu, Y.; Ren, Q. The downside of marketization: A multilevel analysis of housing tenure and types in reform-era urban China. Soc. Sci. Res. 2015, 49, 126–140. [Google Scholar] [CrossRef] [PubMed]
- Wu, F. State dominance in urban redevelopment: Beyond gentrification in urban China. Urban Aff. Rev. 2016, 52, 631–658. [Google Scholar] [CrossRef]
- Liu, Y.; Yue, W.; Fan, P.; Peng, Y.; Zhang, Z. Financing China’s suburbanization: Capital accumulation through suburban land development in Hangzhou. Int. J. Urban Reg. Res. 2016, 40, 1112–1133. [Google Scholar] [CrossRef]
- Lin, G.C.S. Reproducing spaces of Chinese urbanisation: New city-based and land-centred urban transformation. Urban Stud. 2007, 44, 1827–1855. [Google Scholar] [CrossRef]
- Union Internationale des Transports Publics (UITP). “World Metro Figures 2018—Statistic Brief” (PDF). Available online: https://cms.uitp.org/wp/wp-content/uploads/2020/06/Statistics-Brief-World-metro-figures-2018V3_WEB.pdf (accessed on 8 May 2021).
- Guangzhou Municipal Government (GMG). Guangzhou Master Plan (2011–2020); The Version Submitted to the Ministry of Housing and Urban-Rural Development; Ministry of Housing and Urban-Rural Development: Beijing, China, 2015.
- Li, S.M.; Song, Y.l. Redevelopment, displacement, housing conditions and residential satisfaction: A study of Shanghai. Environ. Plan. A 2009, 41, 1090–1108. [Google Scholar] [CrossRef]
- Huang, X.Y.; Zhang, S.; Cao, X.S. Spatial-temporal evolution of Guangzhou subway accessibility and its effects on the accessibility of public transportation services. Prog. Geogr. 2014, 33, 1078–1089. (In Chinese) [Google Scholar]
- Xu, Y.Y.; Ta, N.; Li, X. Study on the attraction scope of urban commuting and employment center based on metro card swiping data. Humanities 2017, 32, 93–101. (In Chinese) [Google Scholar]
- Chen, J.J. Change rule of weekend passenger flow of Guangzhou Metro based on cluster analysis. Traffic Transp. 2019, 32, 141–147. (In Chinese) [Google Scholar]
- Lv, D.J.; Li, S.Y.; Tan, Z.Z.; Wu, Z.F.; Gao, F.; Liu, X.P. Fine-scale modeling of multi-dimensional influencing factors in transit ridership at metro stations: A case study of Guangzhou. Geogr. Geo-Inf. Sci. 2019, 35, 58–65. (In Chinese) [Google Scholar]
- Liu, B.K.; Feng, C.C. Impact of urban rail transit on land use structure around the station. Urban Dev. Res. 2009, 16, 149–155. (In Chinese) [Google Scholar]
- Zhang, D.F.; Jiao, J.J. How Does Urban Rail Transit Influence Residential Property Values? Evidence from An Emerging Chinese Megacity. Sustainability 2019, 11, 534. [Google Scholar] [CrossRef]
- Tan, Z.Z.; Li, S.Y.; Li, X. Spatio-temporal effects of urban rail transit on complex land use change. Acta Geogr. Sin. 2017, 72, 850–862. (In Chinese) [Google Scholar]
- Wang, K.; Song, Z.J.; Yang, J. Impact of urban cross river rail transit on the differentiation of residential land: A case study of Wuhan, Hubei Province. Urban Transp. China 2018, 16, 32–42. (In Chinese) [Google Scholar]
- Zhao, P.J.; Yang, H.Z.; Kong, L.; Liu, Y.S.; Liu, D. Disintegration of metro and land development in transition China: A dynamic analysis in Beijing. Transp. Res. Part A 2018, 116, 290–307. [Google Scholar] [CrossRef]
- Li, Z. The impact of metro accessibility on residential property values: An empirical analysis. Res. Transp. Econ. 2018, 70, 52–56. [Google Scholar] [CrossRef]
- Wang, L. Research on the impact of urban rail transit on housing price: Quantitative analysis based on the characteristic price model. Reg. Res. Dev. 2009, 28, 57–70. (In Chinese) [Google Scholar]
- Wang, Y.N.; Yun, Y.X.; Guo, L.J. Research on the value-added of real estate along the line by rail transit based on time-space effect—Taking Tianjin as an example. Urban Plan. 2015, 39, 71–75. (In Chinese) [Google Scholar]
- Lin, G.; Zhang, X.Y.; Ma, Y.Y. The Influence of Metro System on Commercial Space Structure along the Line in Guangzhou. Prog. Geogr. 2008, 27, 104–111. (In Chinese) [Google Scholar]
- Chen, P.Y. Jiaoyufication and Its Socio-Spatial Consequences in Urban China. Urban Dev. Stud. 2015, 22, 55–60. (In Chinese) [Google Scholar]
- Wei, Z.; Yu, Y.; Yu, B.J. The evolution of urban spatial form in Wuhan under the guidance of subway. Huazhong Archit. 2016, 34, 80–85. (In Chinese) [Google Scholar]
- Zhang, X.; Liu, X.X.; Hang, J.Q.; Yao, D.B.; Shi, G.P. Do Urban Rail Transit Facilities Affect Housing Prices? Evidence from China. Sustainability 2016, 8, 380. [Google Scholar] [CrossRef]
- Huang, W.; Qi, X.H. The influence of subway on the spatial pattern of Fuzhou main urban area. World Geogr. Res. 2017, 26, 86–95. (In Chinese) [Google Scholar]
- Huang, D.; Feng, J. Digital evaluation method of commercial value of urban subway stations. J. Earth Inf. Sci. 2019, 21, 327–336. (In Chinese) [Google Scholar]
- Sun, B.D.; Li, N.F.; Song, J.J.; Wu, X.S. A study on the impact of job-housing balance on commute travels: An empirical test of a traditional idea in the field of urban planning. J. Urban Plan. 2010, 191, 55–60. (In Chinese) [Google Scholar]
- Wang, W.J.; Gan, H.C. Car or public transit? Analysis on travel mode choice behavior. Urban Transp. China 2010, 8, 36–40. [Google Scholar]
- Niu, W. “Urban Dynamic from the Perspective of Urban Rail Station”. Report from the Institute of Vanke Urban Studies. 2016. Available online: https://mp.weixin.qq.com/s/CnWy5ubs7lp0CfVgs3SyxA (accessed on 6 June 2021).
- Wan, T.; Kan, C.C.; Gao, X.; Lu, Q. Analysis of Commuter Population along Tianjin Metro M5 based on Baidu Huiyan Big Data. 2019. Available online: https://posts.careerengine.us/p/6080d99a2331b213b0c99b5c (accessed on 16 June 2021).
- Residents Committee. Available online: https://zh.wikipedia.org/wiki/%E5%B1%85%E6%B0%91%E5%A7%94%E5%91%98%E4%BC%9A (accessed on 1 August 2022).
- Garson, G.D. Hierarchical Linear Modeling: Guide and Applications; Sage Publications: Thousand Oaks, CA, USA, 2013; p. 32. [Google Scholar]
- Baayen, R.H.; Davidson, D.J.; Bates, D.M. Mixed-effects modeling with crossed random effects for subjects and items. J. Mem. Lang. 2008, 59, 390–412. [Google Scholar] [CrossRef]
- Cameron, A.C.; Trivedi, P.K. Microeconometrics Using Stata; Stata Press: College Station, TX, USA, 2009; Volume xl. [Google Scholar]
- National Bureau of Statistics (NBS), China. The Fifth Population Census. 2001. Available online: http://www.stats.gov.cn/tjsj/pcsj/rkpc/5rp/index.htm (accessed on 15 June 2021).
- National Bureau of Statistics (NBS), China. The Sixth Population Census. 2011. Available online: http://www.stats.gov.cn/tjsj/pcsj/rkpc/6rp/indexch.htm (accessed on 15 June 2021).
- Ni, N.; Yi, C.D.; Gao, B.Y. Spatial Restructuring of Population in Beijing from 2000–2010. Urban Dev. Stud. 2012, 19, 32–38. (In Chinese) [Google Scholar]
- Huang, D.B.; Lu, C. Evolution characteristics of population spatial pattern in Beijing City. Sci. Technol. Ind. 2017, 17, 107–122. (In Chinese) [Google Scholar]
- Feng, Y. The parking fees for roads in the six districts of Guangzhou center are set, Southern Metropolis Daily, 24 March 2020. Available online: http://www.oeeee.com/nis/202003/24/604175.html (accessed on 7 April 2020).
- Wang, R.; Ye, L.; Chen, L.W. The Impact of High-Speed Rail on Housing Prices: Evidence from China’s Prefecture-Level Cities. Sustainability 2019, 11, 3681. [Google Scholar] [CrossRef]

Publisher’s Note: MDPI stays neutral with regard to jurisdictional claims in published maps and institutional affiliations. |
© 2022 by the authors. Licensee MDPI, Basel, Switzerland. This article is an open access article distributed under the terms and conditions of the Creative Commons Attribution (CC BY) license (https://creativecommons.org/licenses/by/4.0/).