Abstract
The implementation of the dual-credit policy has had a significant impact on the development of new energy vehicles. Considering the background of the dual-credit policy, this paper examines the concept that demand is influenced by price, consumer low-carbon preference, and concerns regarding endurance. First, we study the pricing decisions of a two-level automobile supply chain consisting of two manufacturers and one dealer and discuss the influence of the dual-credit policy on decision making. Two methods are then used to coordinate the supply chain, and the results are verified by numerical analysis. The results show that: (1) the stronger the concerns of consumers regarding a low-carbon preference and endurance, the better the development of new energy vehicles; (2) raising the integral calculation coefficient and the integral price can increase the demand for, and profits from, new energy vehicles, which can expand the market; and (3) the supply chain can be fully coordinated through Nash negotiations. This paper theoretically demonstrates the impact of factors such as car endurance on corporate decision making, guiding car companies to make pricing decisions based on market conditions.
1. Introduction
In order to promote the development of new energy vehicles, in 2017, China implemented a new policy named the Passenger Car Corporate Average Fuel Consumption and New Energy Vehicle Credit Regulation [1]. Auto companies are assessed and regulated by the fuel vehicle (FV) credits and the new energy vehicle (NEV) credits, defined as the dual-credit policy. For NEVs, the passenger vehicles are driven entirely or mainly by new energy sources, including battery electric vehicles (BEVs), plug-in hybrid electric vehicles (PHEVs) and fuel cell vehicles (FCVs) [1]. The implementation of the dual-credit policy has greatly promoted the development of the new energy vehicle industry, as NEV credits are allowed to be traded between enterprises. In 2020, the top 10 sellers of NEV credits generated a total of 3.33 million positive credits, mainly generated by Tesla (Shanghai), Chery New Energy, and WM Motor, which are all completely transformed new energy vehicle companies [2]. However, since their implementation, the preferential policies for new energy vehicles have been weakening year by year, and the sustainable development of new energy vehicles is facing huge challenges.
Pressures on energy and the environment have resulted in a consensus regarding the development of new energy vehicles across the world. To realize the goal of “lowering carbon dioxide emissions per unit of GDP by 40% to 45% in 2020 compared with 2005” and the historical missions of “corner overtaking” in the auto industry, the Chinese government has also listed the development of the new energy vehicle industry as one of the seven strategic emerging industries [3]. By examining the policy documents on the development of the new energy vehicle industry that have been issued and implemented in China for several consecutive years [4], and comparing the differences in policies between different cities [5], we can reveal the characteristics of the new energy vehicle industry policies; analyze the market performance, industrial technology innovation, and the relationship between production and sales, business model innovation, and policy; and predict the policy development trend in the future. To study some of the appropriate policies and efficacious measures for use by policymakers to promote sustainable development, Ren et al. explored the factors affecting the success of the Chinese new energy vehicle industry using ISM (interpretative structuring modeling) and analyzed the relationship between those factors with DEMATEL (Decision-Making Trial and Evaluation Laboratory) [6].
Other scholars have conducted research on the supply chain of new energy vehicles. The battery is usually the core part of a new energy vehicle. Therefore, Gu et al. established a three-cycle electric vehicle battery recycling closed-loop supply chain to study the differences in return income, sorting rate, and return rate of high-quality and low-quality batteries [7]. Many current studies on the supply chain of new energy vehicles focus on the pricing decisions under a specific market environment or policy [8], such as the carbon emission regulation of new energy vehicles [9] and different government subsidies [10,11]. On the other hand, consumers are heterogeneous. Gong et al. divided consumers into ordinary consumers and green consumers, and analyzed the impact of low-carbon preference and the proportion of green consumers on the decision-making and profits of manufacturers and dealers [12]. In the research of supply chain members, the cooperation between enterprises in battery closed-loop supply chain [13] and the game of supply chain under the resource input cooperation mode [14,15] are both key points.
In order to promote the development of new energy vehicles, China implemented the dual-credit policy in 2017, and a large number of scholars have begun to study the impact of this policy on the development of new energy vehicles. Regarding the effect of dual-credit policy on new energy vehicles, there are studies, respectively, on the impact of credit price [16,17], consumer preferences [18,19], and subsidy downgrading [20,21] on enterprise R&D investment or social welfare [22]. In the study of batteries, Li et al. studied supply chain production decisions and the battery recovery rate under three conditions: the government subsidy policy, the dual-credit policy with FV credits and NEV credits at the same time, and the dual-credit policy only considering NEV credits [23]. Ma et al. compared the advantages of the self-made decision-making model with the outsourcing decision-making model in the industrial chain and found that consumer willingness to pay, the improvement in battery research and development capabilities, and the implementation of the dual-credit policy can promote the development of the new energy vehicle industry [24].
As one of the most important factors affecting the development of new energy vehicles, endurance has always been of great concern to consumers. Many discoveries have been made in the field of new energy vehicle batteries. The endurance of new energy vehicles and consumer demand for endurance can impact the decision making of battery companies and car companies, and its subsidy mechanism can coordinate the supply chain [25]. The technology spillover rate and product differentiation degree influence the battery life of new energy vehicles [26]. Collaborative innovation in the new energy vehicle industry chain can promote improvement in the endurance of new energy vehicles and the development of the new energy vehicle industry [24]. Chen et al. mainly studied the charging pile [27]. They constructed a hierarchical delay layout model to study the number of charging piles in the road network for new energy vehicles with different endurance capabilities, and demonstrated the conclusion through a specific case. By studying the development trend of long-range pure electric vehicles, Zeng et al. found the matching power battery system requirements [28]. Although there have been many studies on the endurance of new energy vehicles, this paper still chooses endurance as the research topic, but the expression of endurance in this paper is innovative compared with previous studies.
At present, research on the endurance of new energy vehicles usually uses the measure of absolute endurance [29], but some studies demonstrate the reference effect and reference point, which also show the relative endurance of new energy vehicles as being reasonable. Yusufcan et al. explored how externally given reference points affect personal preferences, and teased out the differences between the reference effect and the decoy effect [30]. Stewart et al. studied how the variables at the individual level can be applied to the group level by examining the effects of the self-reference effect (SRE) and the group reference effect (GRE) on information recall [31]. Based on previous research on the reference effect, this paper takes the endurance level of fuel vehicles as a reference point to demonstrate the relative endurance of FVs and NEVs. Compared with absolute endurance, relative endurance depicts the endurance relationship between different automotive products more succinctly.
The above literature shows that most of the current research on the impact of the dual-credit policy on the automobile industry has studied the impact of the policy on the decision-making and profits of automobile enterprises. Numerous studies have also taken into account factors such as consumer low-carbon preferences, the emission reduction capabilities of fuel vehicles, and the endurance of new energy vehicles. Referring to the practice of Lu [32], this paper studies the issue in the context of the dual-credit policy with two car manufacturers (manufacturer 1 is an FV manufacturer, and manufacturer 2 is a NEV manufacturer) and a car dealer while considering consumer low-carbon preferences and endurance concerns about pricing decisions together. We use relative endurance to measure car endurance, unlike previous scholars who mostly used cost-sharing contracts and two-part pricing contracts. Moreover, this study uses the Nash negotiation method to demonstrate the coordination strategy of the supply chain.
2. The Model Formulation
2.1. Assumptions and Notations
In this paper, the duopoly car seller’s market consists of manufacturer 1, which produces FVs, and manufacturer 2, which produces NEVs (as shown in Figure 1). Referring to the practice used in Cheng’s work, this study only considers the case where fuel vehicle manufacturers only produce fuel vehicles and new energy vehicle manufacturers only produce new energy vehicles [33]. Both the FV manufacturer and the NEV manufacturer are the dominant players in the supply chain, and the dealers are the decision-followers of the two automakers. The automotive supply chain utilizes a Stackelberg game, where manufacturer 1 and manufacturer 2 determine the wholesale prices of FVs and NEVs, respectively, and dealers determine the retail prices of FVs and NEVs on this basis. In the context of the dual-credit policy, automakers will have credit transactions. The negative corporate average fuel consumption credit (CAFC credit) generated by the production of FVs (short for FV cars) by FV manufacturers can be offset by purchasing CAFC credits. NEV manufacturers sell positive NEV credits generated from producing NEVs (short for NEV cars). Before discussing the model, it is necessary to define some of the main parameters, analyze their practical significance, and summarize the parameters and decision variables (see Table 1).
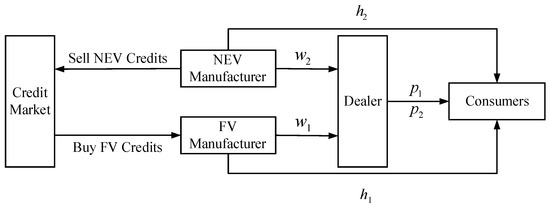
Figure 1.
Two-stage supply chain structure framework.

Table 1.
Parameters and variables.
Assumption 1.
Assume that the production cost of FVs and NEVs is 0 [34,35] (this does not affect our conclusions, only avoids computational complexity).
Assumption 2.
Combined with the actual situation, in order to ensure that the “dual-credit” policy has a restrictive effect on fuel vehicles, it is assumed that the current fuel consumption level of fuel vehicles does not meet the standard, and we only consider the situation b > a [32].
Assumption 3.
The case where the demand for automobile products is 0 is not considered.
Assumption 4.
Manufacturers and retailers in the supply chain have complete and symmetrical information, regardless of inventory or overproduction, or logistics costs.
Assumption 5.
The cross-year carry-over of credits is not considered, and the unit credit value is positively correlated with the car’s endurance level. Assume that the accounting credits for each new energy vehicle are eh2.
Assumption 6.
The superscripts “*, **, and 2*”, respectively, indicate the three situations of “decentralized decision making, centralized decision making, and Nash negotiation”.
2.2. Demand Function
This paper assumes that the utility of consumers purchasing FVs is , and the utility of consumers purchasing NEVs is . According to Zhuo’s work [36], the customer reservation price (v) is uniformly distributed over [0, 1] within the market size (number of customers) from 0 to 1 with a density of 1, which captures individual differences in the product valuation. Consumers will buy the product only when the price of the product is lower than v. The price of new energy vehicles with the same configuration is higher than that of fuel vehicles; for example, the price of the new energy vehicle Lecker 01 is CNY 199,800, and the price of fuel vehicles is CNY 175,800 [37]. Therefore, we assume that the consumer expectation price of new energy vehicles is higher than that of fuel vehicles. Consumer utility is also affected by product price and relative endurance, and the impact of relative endurance on consumer utility is related to consumer concern about endurance. The average cruising range of pure electric passenger vehicles in 2021 is 395 km [1]. Compared with new energy vehicles, civil fuel vehicles usually have continuous mileage of 300–500 km after the fuel tank is filled, while military vehicles can reach 600–800 km [38]. At present, the endurance of new energy vehicles is far less than that of fuel vehicles. We set the endurance of FVs as h1 and that of NEVs as h2. In accordance with [30], we use the relative endurance of FVs and NEVs to replace the actual value, and we take the endurance level of FVs (h1) as the reference point. The relative endurance level of FVs is , and the relative endurance level of NEVs to fuel vehicles can be regarded as . The relative endurance level of NEVs is between 0 and 1: .
When and , the range of v can be obtained: , and consumers will buy FVs. When and , we can obtain and , and consumers will buy NEVs. As the demand for both FVs and NEVs is not 0, it can be obtained as:
, (referring to Appendix A for the specific solution process of the demand function).
2.3. Equilibrium Modeling
2.3.1. Decentralized Decision Making
The profit of an FV manufacturer is obtained by deducting the cost of purchasing credits from the revenue of producing FVs. The profit function of the FV manufacturer is:
The profit of NEV manufacturers consists of two parts: the income from producing NEVs and the income from selling new energy credits. The profit function of NEV manufacturers is:
The dealer’s profit consists of two parts: income from the sale of FVs and income from the sale of NEVs. The dealer’s profit function is:
The automotive supply chain uses a Stackelberg game to decide and firstly by the dealer using reverse induction.
The Hessian matrix of Equation (3) is:
where H is a negative matrix, so there is a unique p1 and p2 that makes Equation (1) take the maximum value. The first derivative of Equation (1) with respect to p1 and p2 is zero, and the simultaneous equations can be obtained as: and .
Theorem 1.
The sale price of fuel vehicles and new energy vehicles is positively correlated with the wholesale price.
Substitute the two price functions into Equations (1) and (2) to obtain the function of profit on wholesale price and solve the optimal decision variables of the two manufacturers through the Nash game. From and , it can be seen that is a concave function of , and is a concave function of . The first derivative of Equations (1) and (2) with respect to and is equal to 0. Let , , and , and solve the optimal solutions simultaneously as:
Substitute the and into the price function to obtain the dealer’s optimal decision as:
Substitute each optimal decision variable into the demand function and profit function to obtain the optimal demand and profit as:
Theorem 2.
With the increasing level of consumer concern about endurance, both new energy vehicle and fuel vehicle manufacturers will increase their endurance, and the fuel vehicle endurance level is greater than that of new energy vehicles. The increase in the endurance level of the fuel vehicle is equivalent to a decrease in the actual fuel consumption of the fuel vehicle. The increase in the endurance level of new energy vehicles will increase the calculation coefficient of new energy vehicle credits. The total amount of credits will increase, and the price of unit credits will decrease.
Under centralized decision making, take the first partial derivative with respect to in , , , , , and (refer to Appendix A for the expressions). To analyze the influence of consumer low-carbon preference on decision making, the parameters are set where three sets of values are taken for analysis. Therefore, the three sets of parameters are set as: y(1), y(2), and y(3). For y(1): , , , , , , , and ; for y(2): , , , , , , , and ; and for y(3): , , , , , , , and .
It can be seen from Figure 2 that when consumers of fuel vehicles have a weak awareness of low-carbon preference, the wholesale price of fuel vehicles increases with the improvement in consumer awareness of low-carbon preference. When consumers of fuel vehicles have a strong awareness of low-carbon preference, the wholesale price of fuel vehicles decreases with the increase in consumer awareness of low-carbon preference. The retail price of fuel vehicles decreases with the increase in consumer awareness of low-carbon preference, and the demand increases with the increase in consumer awareness of low-carbon preference. The wholesale price and retail price of new energy vehicles increase with the increase in consumer awareness of low-carbon preference, and the demand decreases with the increase in consumer awareness of low-carbon preference.
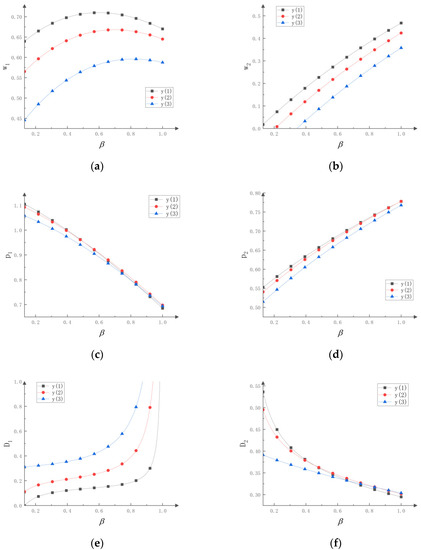
Figure 2.
The effect of on , , , , , and under decentralized decision making. (a) The effect of on the wholesale price of FVs. (b) The effect of on the wholesale price of NEVs. (c) The effect of on the selling price of FVs. (d) The effect of on the selling price of NEVs. (e) The effect of on the demand for FVs. (f) The effect of on the demand for NEVs.
The reason for this result is that the price and demand for vehicles are not determined by a single factor, but by a variety of factors. The increasing awareness of consumer low-carbon preference makes consumers prefer new energy vehicles, which leads to the increase in the price of new energy vehicles and the decrease in the price of fuel vehicles. The change in prices reduces and increases the demand for new energy vehicles and fuel vehicles, respectively. In the study by Lu [32], it also appeared that the demand for fuel vehicles increases with an improvement in consumer low-carbon preference consciousness. This shows that in the current situation where consumer low-carbon awareness is becoming increasingly stronger, the external environment is increasingly developing in the direction of favoring new energy vehicles. Over the past decade, China has been increasingly focused on low-carbon environmental protection, consumer low-carbon awareness has increased significantly, and the sales scale and market penetration rate of NEVs have risen significantly compared with 10 years ago.
Theorem 3.
Under centralized decision making, take the first partial derivative with respect to k in ,,,,, and(refer to Appendix A for the expressions). When,, and, contrarily,and. Whenand, conversely,,,, and.
The impact of consumer endurance concerns on the price and demand for new energy vehicles is related to consumer low-carbon preference. When consumers have a high degree of low-carbon preference, the wholesale price, sales price, and demand for new energy vehicles will increase with the increase in consumer endurance concerns. When consumer low-carbon preference is low, the wholesale price, sales price, and demand for new energy vehicles decrease with the increase in consumer endurance concerns. However, the wholesale price, sales price, and demand for fuel vehicles have all increased with consumer endurance concerns. That is to say, the more consumers have a preference for low carbon, and the more attention they pay to endurance, the more they can promote the development of new energy vehicles.
Theorem 4.
Under centralized decision making, take the first partial derivative with respect to in,,,,, and(refer to Appendix A for the expressions). Whenand, conversely,. Whenand, contrarily,,,,, and.
When the endurance of new energy vehicles is low, the wholesale price and sales price of new energy vehicles increase with the increase in the endurance of new energy vehicles. When the endurance of new energy vehicles is relatively high, the wholesale price and sales price of new energy vehicles decrease with the increase in the endurance of new energy vehicles. However, the wholesale price, sales price, and demand for fuel vehicles all decrease with an increase in the endurance of new energy vehicles; and the demand for new energy vehicles increases with an increase in the endurance of new energy vehicles. When the endurance of new energy vehicles is at a low level, improving the endurance of new energy vehicles can enable new energy vehicles to develop rapidly. The higher the endurance level of new energy vehicles, the more difficult the development of new energy vehicles will be. In general, improving the endurance of new energy vehicles is conducive to the competition between new energy vehicles and fuel vehicles.
Theorem 5.
Under centralized decision making, take the first partial derivative with respect to in,,,,, and. The range of the first derivative of the equilibrium solution with respect to e can be obtained:,,,,, and.
The wholesale price, sales price, and demand for fuel vehicles and the wholesale price and sales price of new energy vehicles decrease with an increase in the integral accounting coefficient. The demand for new energy vehicles increases with an increase in the integral accounting coefficient. That is to say, the higher the integral accounting coefficient of new energy vehicles, the more favorable the development of new energy vehicles.
Theorem 6.
Under centralized decision making, take the first partial derivative with respect to in,,,,, and. The range of the first derivative of the equilibrium solution with respect to b can be obtained:,,,,, and.
The wholesale price and sales price of fuel vehicles and the wholesale price, sales price, and demand for new energy vehicles increase with an increase in the actual fuel consumption of fuel vehicles. The demand for fuel vehicles decreases with an increase in the actual value of the accumulated fuel. That is, the greater the unit fuel consumption of fuel vehicles, the less competitiveness fuel vehicles are relative to new energy vehicles, and the more conducive it is to the development of new energy vehicles.
Theorem 7.
Under centralized decision making, take the first partial derivative with respect to in,,,,, and(refer to Appendix A for the expressions). When,, and, contrarily,and. When,, and, conversely,,,, and.
The influence of the integral price on the price of FVs and NEVs is related to the size of the integral accounting coefficient. When the integral accounting coefficient is small, the wholesale price and sales price of FVs and new NEVs are positively correlated with the integral price, and vice versa. The demand for FVs is negatively related to the integral price, while the demand for NEVs is positively related to the integral price. That is, the higher the integral price, the more conducive it is to the development of NEVs.
China’s dual-credit policy refers to California’s ZEV (zero-emission vehicle) credit trading system. The 2018–2019 credit trading volume in California was only 4% of China’s, but the total amount of credit trading was 436% of China’s because the value of China’s NEV credits is much lower than the unit price of California’s ZEV credits. If China’s NEV credit value could reach the Californian ZEV credit unit price, the credit market would expand nearly 20 times, greatly promoting an improvement in key NEV technologies and industry development.
2.3.2. Centralized Decision Making
Under centralized decision making, both manufacturers and distributors take the maximization of supply chain profits as the goal, and the profit function of the supply chain is:
According to the principle of profit maximization, the equilibrium solutions under centralized decision making are obtained as:
Substitute each equilibrium solution into Equation (4) to obtain the optimal profit under centralized decision making as:
Theorem 8.
When and, contrarily,. Whenand, conversely,., and.
The sale price of cars under centralized decision making is lower than that under decentralized decision making. When the endurance of new energy vehicles is at a high level, the demand for fuel vehicles under centralized decision making is higher than that under decentralized decision making. When the endurance of new energy vehicles is at a low level, the demand for new energy vehicles under centralized decision making is higher than that under decentralized decision making.
Theorem 9.
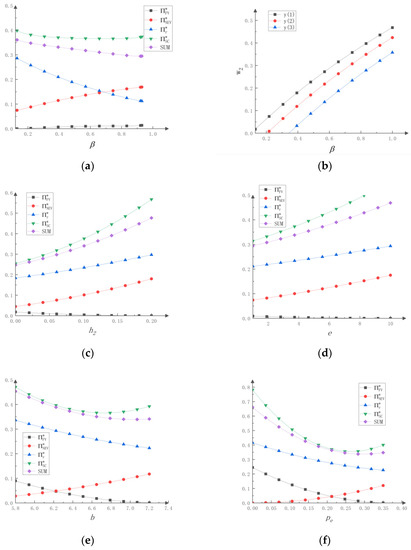
Refer to Theorem 2 to set the parameters:,,,,,,, and. Assume SUM =. The effect of each parameter on profits is obtained as Figure 3.
Figure 3.
The effect of , k, , e, b, and on profits. (a) The effect of on profits. (b) The effect of k on profits. (c) The effect of on profits. (d) The effect of e on profits. (e) The effect of b on profits. (f) The effect of on profits.
It can be seen from Figure 3 that the higher the consumer low-carbon preference, the higher the profits of FV and NEV manufacturers, and the lower the profits of dealers. The higher the level of consumer concern about endurance, the higher the profits of FV manufacturers and dealers, and the lower the profits of NEV manufacturers. The higher the endurance level and integral accounting coefficient of NEVs, the higher the profits of NEV manufacturers and dealers, and the lower the profits of FV manufacturers. The higher the credit value and actual fuel consumption, the higher the profits of NEV manufacturers, and the lower the profits of FV manufacturers and dealers.
When consumer low-carbon preference increases, the price of new energy vehicles increases, the demand decreases, the price of fuel vehicles decreases, and the demand increases. In addition, the increase in the price of new energy vehicles is greater than the impact of the decrease in demand on profits. While the increase in the demand for fuel vehicles is greater than the impact of lower prices on profits, so the profits of both new energy vehicle manufacturers and fuel vehicle manufacturers increase with an increase in low-carbon preference. Since the biggest advantage of fuel vehicles compared with new energy vehicles is the higher level of endurance, the more consumers pay attention to the level of endurance, the lower the benefits of new energy vehicle manufacturers. The greater the endurance level, integral price, and integral accounting coefficient of new energy vehicles, the more inclined policy market conditions and policies are to new energy vehicles, the greater the income of new energy vehicle manufacturers, and the more conducive it is to the development of new energy vehicles. Starting from 2021, technical indicators have been increased in the formula for calculating the credits of NEVs per vehicle, including the endurance adjustment factor, electric consumption adjustment factor, and energy density adjustment factor. New energy vehicle manufacturers should try to improve the endurance of new energy vehicles within a reasonable range, and relevant government departments should adopt appropriate policies to support the development of new energy vehicles while the new energy vehicle market is not yet mature. In the face of increasing competitiveness from new energy vehicles, fuel vehicle manufacturers should also strive to reduce the level of fuel consumption, which will not only be beneficial to their own development but will also have certain environmental benefits.
The overall profit of the automobile supply chain under centralized decision making is greater than the sum of the profits of fuel vehicle manufacturers, new energy vehicle manufacturers, and dealers under decentralized decision making. Under centralized decision making, consumers can buy cars at lower prices, and the automobile supply chain can obtain higher profits. It is clear that it is difficult to achieve Pareto optimality for decentralized decision making in the automotive supply chain without external intervention.
3. Supply Chain Coordination
Since the profit of each member has not yet reached Pareto optimality under decentralized decision making, it is necessary to study supply chain coordination. This study explores the use of revenue-sharing contracts and Nash negotiation for coordination.
3.1. Revenue-Sharing Contract
In the revenue-sharing contract in this study, the car dealers share the FV revenue with the fuel vehicle manufacturers in proportion , and share the NEV revenue with the new energy vehicle manufacturers in proportion . The profit function of each member is as follows.
The profit function of the fuel vehicle manufacturers is:
The profit function of the new energy vehicle manufacturers is:
The dealers’ profit function is:
With decentralized decision making, the optimal solution , , , , , and can be obtained, and the specific expressions of , , , and are shown in the Appendix A. Bringing the optimal solution into , , and , the profit function of each member of the supply chain under the revenue-sharing contract can be obtained as the expression of , , , , and , are more complex, and are not specifically listed here. With regard to solving the two simultaneous equations and , there is no solution. Solving the simultaneous equations , we can obtain the solutions and , and the expression of and are more complex and not specifically listed here (refer to Appendix A).
Theorem 10.
The use of revenue-sharing contracts cannot achieve complete coordination of the supply chain but can achieve a Pareto improvement of the profits of each member of the supply chain. At present, a single coordination mechanism is seldom used in the research on automobile supply chain coordination, and more coordination mechanisms are used in combination. For example, Ke et al. [39] used a combination of three coordination mechanisms to achieve the complete coordination of the supply chain.
This is because the demand for fuel vehicles and new energy vehicles is affected by the prices of the two vehicles at the same time, and a revenue-sharing contract cannot fully balance the profit distribution between the supply chains, so it is difficult to achieve the overall optimality of Pareto. Therefore, it is necessary to further study supply chain coordination using Nash negotiation to achieve the complete coordination of the automobile supply chain.
3.2. Nash Negotiation
The decision function for Nash negotiation between new energy vehicle manufacturers, fuel vehicle manufacturers, and dealers is:
where is the negotiating power of fuel vehicle manufacturers and represents the negotiating power of new energy vehicle manufacturers. In addition, and .
The solution for Equation (8) is equivalent to the solution for Equation (9):
From the first-order optimal conditions, the wholesale price can be obtained as a function of the quantity demanded:
Substitute the expression of and into the profit function and . Under the first-order optimal conditions, equilibrium can be obtained:
At this time, the profits of fuel vehicle manufacturers, new energy vehicle manufacturers, and dealers are , , and , respectively. Their expression is complex and not specifically listed here (refer to Appendix A).
Theorem 11.
It can be found by observing the expression of andthat the stronger the bargaining power of fuel vehicle manufacturers and new energy vehicle manufacturers, the higher the wholesale price of fuel vehicles and new energy vehicles. Since demand has nothing to do with negotiating power, the fuel vehicle and new energy vehicle profits increase with an increase in the bargaining power of fuel vehicle manufacturers and new energy vehicle manufacturers, and the negotiating advantage of the manufacturers will be more significant:,,,, and. The price, demand, and profit after bargaining reach Pareto optimality, and it can be seen that Nash negotiation can be fully utilized to coordinate the automobile supply chain.
To achieve Pareto improvements, the following conditions must be met: , , and . Let and (the specific expressions of , , and are shown in the Appendix A), and and must meet the following conditions:
When , , and , contrarily, and . Clearly, (the specific expressions of are shown in the Appendix A), and because and , so the condition must be met (the specific expressions of and are shown in Appendix A).
Theorem 12.
The size of andis related to the endurance level of new energy vehicles, consumer low-carbon preference, the unit credit price, actual fuel consumption, the credit accounting coefficient, consumer concern about endurance, and other factors.
4. Numerical Analysis
Refer to Theorem 2 to set the parameters as: , , , , , , , and . The impact of the revenue-sharing ratio on the profits of each member of the supply chain, and the impact of consumer endurance concerns and the endurance level of new energy vehicles on manufacturer bargaining power are shown in Figure 4.
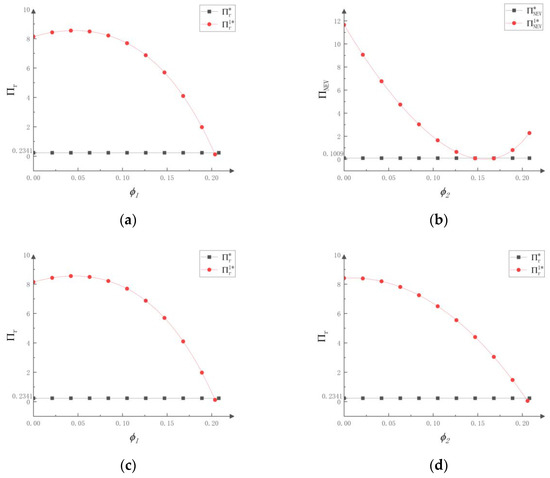
Figure 4.
The influence of and on the profits of automobile manufacturers 1 and 2 and dealers under decentralized decision making and revenue-sharing contracts. (a) The influence of on the profit of automobile manufacturer 1 under decentralized decision making and a revenue-sharing contract. (b) The influence of on the profit of automobile manufacturer 2 under decentralized decision making and a revenue-sharing contract. (c) The influence of on dealer profits under decentralized decision making and a revenue-sharing contract. (d) The influence of on dealer profits under decentralized decision making and a revenue-sharing contract.
As can be seen from Figure 4, when implementing a revenue-sharing contract, the profits of fuel vehicle manufacturers and new energy vehicle manufacturers first decrease and then increase with an increase in the revenue-sharing ratio, while the profits of dealers first increase and then decrease with an increase in the revenue-sharing ratio. This shows that within a certain range, a revenue-sharing contract can achieve a Pareto improvement in each member’s profit.
From Figure 5, it can be seen that decreases as consumer endurance concerns increase, i.e., the optimal bargaining power of fuel vehicle manufacturers decreases but does not change much as consumer range concerns increase, which suggests that consumer endurance concerns do not have a significant impact on the bargaining power of fuel vehicle manufacturers. and decrease with increasing consumer endurance concerns, i.e., the optimal and minimum bargaining power of the new energy vehicle manufacturers decreases rapidly with increasing consumer range concerns. The minimum value at time shows that consumer range concerns significantly affect the bargaining power of new energy vehicle manufacturers, and the more consumers are concerned about the endurance of vehicle products, the less advantageous new energy vehicle manufacturers are when using the Nash negotiating method.
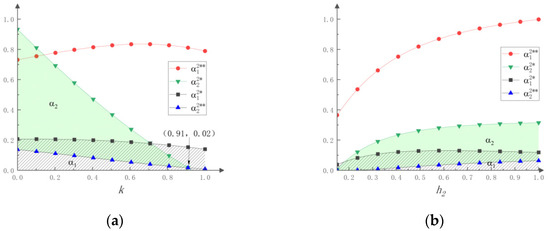
Figure 5.
Effect of k and h2 on α1 and α2. (a) Effect of k on α1 and α2. (b) Effect of h2 on α1 and α2.
increases and then decreases as the endurance of new energy vehicles increases, and the optimal bargaining power of fuel vehicle manufacturers increases and then decreases as consumer range concerns increase. and increase and then decrease as the endurance level of new energy vehicles increases, and the optimal bargaining power of fuel vehicle manufacturers increases and then decreases as consumer range concerns increase.
5. Conclusions
This study examined a supply chain consisting of a fuel vehicle manufacturer producing only fuel vehicles, a new energy vehicle manufacturer producing only new energy vehicles, and a dealership, considering the transactions between the manufacturer and the credit market in the context of the dual-credit policy. Consumer demand for vehicles is influenced by both price and consumer endurance concerns regarding the relative endurance level of the vehicle. Since the profit of each member of the supply chain cannot reach Pareto optimality under decentralized decision making, this paper introduced a revenue-sharing contract and Nash negotiation for Pareto improvement and analyzed the coordination effect with the help of numerical analysis. It demonstrated the influence of parameters such as the endurance of NEVs on the decision making of supply chain members. This study can guide automobile enterprises to make decisions according to the market situation.
The study found that: (1) increased consumer awareness of low-carbon preferences can increase the demand for fuel vehicles, the wholesale and retail prices of new energy vehicles, and the profits for both manufacturers; (2) increased consumer concern about vehicle endurance can increase the price, demand, fuel vehicles profits, and dealer profits; (3) an increase in the endurance of new energy vehicles can increase the profit and demand for new energy vehicles, along with dealer profit; (4) an increase in the crediting factor and credit price will increase the profit and demand for new energy vehicles, while an increase in the crediting factor will also increase the dealer profit; (5) an increase in the real fuel consumption of fuel vehicles can increase the price, demand, and profitability of new energy vehicles; and (6) an equilibrium solution under decentralized decision making has not yet reached Pareto optimality. Revenue-sharing contracts can only achieve profit Pareto improvements for each member, while Nash negotiations can fully coordinate the automotive supply chain. The optimal bargaining power of manufacturers is related to the endurance level of new energy vehicles, consumer low-carbon preferences, the price per credit, the actual value of fuel, the credit accounting factor, and consumer endurance concerns.
Academic contributions: (1) many studies have considered the impact of endurance in the context of the dual-credit system to explore the price and endurance decisions of new energy vehicle manufacturers regarding new energy vehicles. However, in this paper, we innovatively measured the endurance preference of consumers by the ratio of the endurance of new energy vehicles to that of fuel vehicles; (2) in this study, demand was calculated by the consumer surplus value, and the demand function obtained better reflects the actual situation. In the paper by Zhuo [36], the difference in energy consumption per unit between fuel vehicles and new energy vehicles was used as a decision variable to enable the paper to be clearer and more concise, but endurance was not considered. This paper considers both the endurance level of the vehicle and the endurance concerns of consumers; (3) in the literature on new energy vehicles, most of the studies have used cost-sharing and revenue-sharing contracts. In this paper, we introduced Nash bargaining when conventional contractual coordination fails, so that the result can reach Pareto optimality.
Practice Insights: (1) As the concept of new energy vehicles is gaining popularity, consumers are looking to low-carbon products, which is a good opportunity for the development of NEV enterprises. (2) At the early stage of the development of the new energy vehicle industry, the endurance of new energy vehicles is at a low level. At this time, to improve the endurance of NEVs can effectively improve the competitiveness of enterprises, and the return on investment in the endurance of new energy vehicles is great. While the NEV industry is gradually developed and perfected, the development of new energy vehicles becomes increasingly difficult. Therefore, enterprises should firmly grasp the opportunities in the early stages of the development of the NEV industry. (3) The preferential treatment of NEVs in the dual-credit policy is gradually decreasing [19]. Enterprises should gradually reduce, or even discard, dependence on policy preferences and government subsidies, shift their focus to the issues of new energy vehicles, such as technological innovation and endurance improvement, and compensate for the lack of policy preferences through improvements in the car itself. (4) With the development of NEVs, the competitive disadvantage of FVs will become clearer [33], such as the problem of fuel consumption. If FV enterprises want to gain advantages in the competition with NEV enterprises, they must solve the problem of fuel consumption. (5) The bargaining power of manufacturers is not only determined by the performance of the vehicle itself, but also by external circumstances, such as consumer low-carbon preferences and endurance concerns. In addition to improving car products, manufacturers should also monitor market conditions. Dealers should negotiate with manufacturers to make appropriate concessions to promote the overall development of the supply chain.
6. Limitations and Future Research
Limitations: Our research can be further extended in several directions. (1) In the assumptions, we ignore the production and logistics costs, do not consider the situation in which the fuel consumption integral of FVs reaches the standard, and do not consider the inventory or overproduction, or the cross-year carry-over of the integral, which oversimplifies the dynamics of the complex system in the real world. (2) This study only considers a situation in which the manufacturer produces only one product. (3) This study does not consider the reduction in the fuel consumption input by FV manufacturers and the improvement in endurance by NEV manufacturers. (4) This study does not consider the government’s subsidy policy for NEVs. (5) The factor of changing power stations is not considered.
Future research: According to the limitations of our research, the following improvements can be made in future research. (1) Consider that manufacturers produce different models of FVs and NEVs, and their production costs are not the same. (2) Design more realistic and more complex models. Both NEV manufacturers and FV manufacturers can produce NEVs and FVs and are able to buy and sell credits. Consider that credits can be carried forward in the following year and study the impact of the proportional requirements of new energy vehicles in the dual-credit policy. (3) Future research can take the fuel consumption of FVs and the endurance of NEVs as decision variables and introduce variable costs. FV manufacturers can increase their investment in emission reduction, and fuel vehicles may reach average fuel consumption. (4) Study the role of the government in the automobile supply chain and the decline in subsidies for new energy vehicles. (5) Since a change in power station can also affect the endurance of new energy vehicles, we can add replacement stations in the future.
Author Contributions
Conceptualization and methodology, Y.X. and G.Z.; validation, Y.X., X.M. and G.Z.; formal analysis, Y.X.; investigation, X.M.; data curation and writing—original draft preparation, Y.X.; writing—review and editing, X.M. and G.Z. All authors have read and agreed to the published version of the manuscript.
Funding
This research was funded by Philosophy and Social Science Program of Zhejiang Province, grant number 22NDYD040YB and Humanities and Social Sciences Project of Zhejiang University of Technology, grant number SKY-ZX-20210195 and SKY-ZX-20210161.
Institutional Review Board Statement
Not applicable.
Informed Consent Statement
Not applicable.
Data Availability Statement
Data sharing not applicable.
Acknowledgments
The authors are grateful for the guidance of many experts.
Conflicts of Interest
The authors declare no conflict of interest.
Appendix A
Proof of Demand Function.
Conditions for consumers to buy fuel vehicles: and , the range of v can be obtained: .
Conditions for consumers to purchase new energy vehicles: and , we can obtain and . Let , , and .
For the demand for both vehicles to be non-zero, the following condition must be satisfied: , and we can obtain and . Under the conditions of and ,
and
can be obtained from . □
Relevant Derivation in Theorem 2.
Relevant Derivation in Theorem 3.
Relevant Derivation in Theorem 4.
Relevant Derivation in Theorem 7.
Relevant Derivations in the Revenue-Sharing Contract.
Relevant Derivations in the Nash Negotiation.
References
- Ministry of Industry and Information Technology Equipment Industry Development Center. Available online: http://www.miit-eidc.org.cn/art/2022/7/5/art_88_31014.html (accessed on 1 August 2022).
- Tang, B.J.; Liu, J.P. Outlook for the development of China’s new energy vehicle industry. J. Beijing Univ. Technol. (Soc. Sci. Ed.) 2015, 17, 1–6. [Google Scholar] [CrossRef]
- Lin, B.Q.; Li, L. Transformation of China’s energy structure under environmental governance constraints—An analysis based on coal and peak CO2. China Soc. Sci. 2015, 9, 84–107, 205. [Google Scholar]
- Li, S.X.; Liu, Y.Q.; Wang, Y.; Zhang, L. Analysis of China’s new energy vehicle industry development policy based on market performance. China’s Popul. Resour. Environ. 2016, 26, 158–166. [Google Scholar]
- Zhang, L.; Liu, Y. Analysis of New Energy vehicles industry policy in China’s cities from the perspective of policy instruments. Energy Procedia 2016, 104, 437–442. [Google Scholar] [CrossRef]
- Ren, J. New energy vehicle in China for sustainable development: Analysis of success factors and strategic implications. Transp. Res. Part D Transp. Environ. 2018, 59, 268–288. [Google Scholar] [CrossRef]
- Gu, X.; Ieromonachou, P.; Zhou, L.; Tseng, M.-L. Developing pricing strategy to optimise total profits in an electric vehicle battery closed loop supply chain. J. Clean. Prod. 2018, 203, 376–385. [Google Scholar] [CrossRef]
- Xie, J.P.; Li, J.; Yang, F.F. Multi level contract decision optimization of closed-loop supply chain for new energy vehicles. J. Manag. Eng. 2020, 34, 14. [Google Scholar]
- Zhu, X.; Ren, M.; Wu, G.; Pei, J.; Pardalos, P.M. Promoting new energy vehicles consumption: The effect of implementing carbon regulation on automobile industry in China. Comput. Ind. Eng. 2019, 135, 211–226. [Google Scholar] [CrossRef]
- Zhao, J.-H.; Zeng, D.-L.; Che, L.-P.; Zhou, T.-W.; Hu, J.-Y. Research on the profit change of new energy vehicle closed-loop supply chain members based on government subsidies. Environ. Technol. Innov. 2020, 19, 100937. [Google Scholar] [CrossRef]
- Shen, C.R.; Li, L.Z. Research on automobile supply chain decision-making considering government subsidies in the context of new energy. Pract. Cogn. Math. 2019, 49, 79–88. [Google Scholar]
- Gong, B.; Xia, X.; Cheng, J. Supply-Chain Pricing and Coordination for New Energy Vehicles Considering Heterogeneity in Consumers’ Low Carbon Preference. Sustainability 2020, 12, 1306. [Google Scholar] [CrossRef]
- Mu, D.; Yang, J.; Li, X. The influence of closed-loop supply chain enterprise cooperation on the recovery and reuse of power batteries for new energy vehicles. Supply Chain. Manag. 2021, 2, 54–67. [Google Scholar] [CrossRef]
- Shen, M.J. Research on Resource Input Decision of new Energy Vehicle Supply Chain Based on Cooperation and Sharing Mode. Master’s Thesis, China University of Mining and Technology, Beijing, China, 2021. [Google Scholar] [CrossRef]
- Wang, W.B.; Lv, J.; Zhang, M.Y.; Lv, T.; Bian, W.L. Research on resource input strategy of new energy vehicle supply chain under cooperation mode. Ind. Technol. Econ. 2021, 40, 33–41. [Google Scholar]
- Sun, H.F.; Wang, Y. Horizontal competition and cooperation R&D game of new energy vehicle supply chain under the policy of “dual-credits”. Pract. Cogn. Math. 2020, 50, 11. [Google Scholar]
- Zheng, C.; Zhao, H.; Li, Z. Research on R&D subsidy of new energy vehicle industry under dual-credit policy. Res. Manag. 2019, 40, 126–133. [Google Scholar] [CrossRef]
- Tang, H.; Yang, F.; Xu, W.; Zhao, L.Q. Research on the production and pricing of secondary automobile supply chain considering consumer preference under the dual-credit system. Ind. Eng. Manag. 2021, 26, 121–129. [Google Scholar] [CrossRef]
- Yu, X.H.; Ye, Z.X.; Li, M. Subsidy decline-optimization analysis of production decision-making in two-level supply chain under the dual-credit policy. Oper. Manag. 2021, 30, 42–49. [Google Scholar]
- Peng, L.; Li, Y.; Yu, H. Effects of dual credit policy and consumer preferences on production decisions in automobile supply chain. Sustainability 2021, 13, 5821. [Google Scholar] [CrossRef]
- Cheng, Y.W.; Mu, D. Optimization of subsidy strategy for new energy vehicle supply chain based on SD dynamic game. China’s Popul. Resour. Environ. 2018, 28, 11. [Google Scholar]
- Zhang, Q.; Li, Y.M.; Tang, Y.Y. A Study on the Impact of the “Dual-Credit” Policy of New Energy Vehicles on Manufacturers’ Strategies and Social Welfare. Syst. Eng. Theory Pract. 2020, 40, 20. [Google Scholar]
- Li, J.; Ku, Y.; Liu, C.; Zhou, Y. Dual credit policy: Promoting new energy vehicles with battery recycling in a competitive environment? J. Clean. Prod. 2020, 243, 118452. [Google Scholar] [CrossRef]
- Ma, L.; Guo, P.H. Research on endurance decision-making of new energy vehicle industry chain under the dual-credit system. Technol. Manag. Res. 2019, 39, 151–161. [Google Scholar]
- Ma, L.; Zhong, W.J.; Mei, S.E. Research on subsidy strategy of new energy vehicle industry chain based on endurance demand. Syst. Eng. Theory Pract. 2018, 38, 1759–1767. [Google Scholar]
- Ma, L.; Ren, H.W. Research on technological innovation game of new energy vehicles for endurance. Soft Sci. 2018, 32, 73–79. [Google Scholar] [CrossRef]
- Chen, W.W.; Xu, M.Z.; Xing, Q.S. Research on hierarchical delay layout of new energy vehicle charging station considering endurance. Transp. Syst. Eng. Inf. 2020, 20, 156–162. [Google Scholar] [CrossRef]
- Zeng, X.B.; Zhu, H.; Song, K.T.; Xie, F.; Li, Y. Development trend of long-range pure electric vehicles and changes in demand for power battery systems. Era Car 2018, 7, 89–90. [Google Scholar]
- Jia, J.X.; Zhao, X.K. Battery endurance and recovery strategy of new energy vehicle supply chain under government subsidies. J. Syst. Eng. 2022, 37, 14. [Google Scholar]
- Masatlioglu, Y.; Uler, N. Understanding the reference effect. Games Econ. Behav. 2013, 82, 403–423. [Google Scholar] [CrossRef]
- Stewart, D.D.; Stewart, C.B.; Walden, J. Self-Reference Effect and the Group-Reference Effect in the Recall of Shared and Unshared Information in Nominal Groups and Interacting Groups. Group Process. Intergroup Relat. 2007, 10, 323–339. [Google Scholar] [CrossRef]
- Lu, C.; Wang, Q.Q.; Chen, Q. Coordination of automotive supply chain considering price, emission reduction and endurance under the dual-credit policy. Syst. Eng. Theory Pract. 2021, 41, 2595–2608. [Google Scholar]
- Cheng, Y.; Fan, T. Production coopetition strategies for an FV automaker and a competitive NEV automaker under the dual-credit policy. Omega 2021, 103, 102391. [Google Scholar] [CrossRef]
- Li, X.; Ai, X.Z.; Tang, X.W. Technology innovation value and spillover effect based on supply chain competition. J. Syst. Eng. 2017, 32, 10. [Google Scholar]
- Qi, F.; Lu, L.X. Supply Chain Contracting Under Competition: Bilateral Bargaining vs. Stackelberg. Prod. Oper. Manag. 2013, 22, 661–675. [Google Scholar]
- Zhou, D.; Yu, Y.; Wang, Q.; Zha, D. Effects of a generalized dual-credit system on green technology investments and pricing decisions in a supply chain. J. Environ. Manag. 2019, 247, 269–280. [Google Scholar] [CrossRef] [PubMed]
- Home of Cars. Available online: https://car.autohome.com.cn/config/spec/46979.html (accessed on 1 August 2022).
- Internet Weekly. Available online: https://baijiahao.baidu.com/s?id=1710118015542257530 (accessed on 1 August 2022).
- Ke, R.; Zhao, J.H.; Wei, H.R.; Ji, Y.Y. Optimization and Coordination Mechanism of New Energy vehicle supply chain considering Consumer preference. Mech. Des. Res. 2022, 38, 154–160. [Google Scholar] [CrossRef]


Publisher’s Note: MDPI stays neutral with regard to jurisdictional claims in published maps and institutional affiliations. |
© 2022 by the authors. Licensee MDPI, Basel, Switzerland. This article is an open access article distributed under the terms and conditions of the Creative Commons Attribution (CC BY) license (https://creativecommons.org/licenses/by/4.0/).