Article

Evaluation Method and Application of Ecological Sensitivity of Intercity Railway Network Planning

School of Civil Engineering, Lanzhou Jiaotong University, Lanzhou 730070, China
*
Authors to whom correspondence should be addressed.
Sustainability 2022, 14(2), 804; https://doi.org/10.3390/su14020804
Submission received: 9 December 2021 / Revised: 4 January 2022 / Accepted: 7 January 2022 / Published: 12 January 2022

Abstract

:
In the planning stage of the intercity railway network, the ecological sensitivity evaluation of the planning scheme is not only the key content to explore the ecological environmental rationality of the planning scheme but also a scientific means to promote the sustainable development of intercity railway networks. The purpose of this study is to establish an evaluation method that can quantitatively evaluate the ecological sensitivity of intercity railway network planning to put forwards targeted optimization and adjustment suggestions for the planning scheme. Taking the intercity railway network planning of Guizhou Province as an example, its ecological sensitivity is predicted and evaluated. Six types of ecologically sensitive areas were selected as ecological sensitivity evaluation factors, including protected areas, drinking water sources, geological disaster-prone areas, soil erosion areas, cultivated land resource distribution areas and coal resource distribution areas. Based on the GIS overlay method, the quantitative measurement methods of each evaluation factor are established in turn, and the single factor sensitivity evaluation index is obtained. In addition, the weighted superposition model is used to quantitatively calculate the ecological sensitivity of the planned lines of the intercity railway network in Guizhou Province. Finally, the short board factor of each planned line is obtained, and targeted optimization and adjustment suggestions are put forwards. The research content of this paper can provide a theoretical reference for the practical evaluation of the ecological sensitivity of intercity railway network planning.

1. Introduction

The construction of intercity railway networks can greatly shorten intercity travel times and promote regional economic development. However, it will change the current situation of regional land use, causing soil erosion, destroying ecologically sensitive areas, and leading to damage to the regional ecosystem structure and functional decline. Therefore, the regulations on planning environmental impact assessment formulated by China in 2009 stipulate that the intercity railway network should implement planning environmental impact assessment. That is, when preparing the draft plan of an intercity railway network, it will conduct an environmental impact assessment on its schemes and alternatives and apply the evaluation conclusions and suggestions to decision making. This will prevent the huge impact of planning implementation on the regional ecological environment at the source of decision making and promote the sustainable development of intercity railway networks. Compared to traditional project environmental impact assessment (EIA), planning environmental impact assessment has realized the transformation and innovation from the traditional decision-making mode based on economic benefits to the new decision-making mode oriented by sustainable development. According to the Technical Guidelines for Planning Environmental Impact Assessment (2020), evaluation of ecological sensitivity of planning schemes in terms of coordination between planning layout and local ecologically sensitive areas is the key content of EIA of transportation planning. Therefore, ecological sensitivity assessment is the key research content of EIA of intercity railway network planning.
Currently, many studies on ecological sensitivity evaluation have been reported and were mainly focused on the following aspects: (1) ecological sensitivity evaluation of a certain region, such as Jianghan Plain, China [1], Three Gorges Reservoir Area in China [2], Denizli Province, Turkey [3], Pingtan Island (China) and Nile Delta (Egypt) [4], along the Yangtze River in China [5], etc.; (2) Special research should be conducted on sensitive factors, such as soil erosion [6,7,8], geological disasters [9,10,11,12], cultivated land resources [13,14,15], and water resources [16,17,18]; (3) Spatial planning or spatial pattern optimization based on ecological sensitivity analysis, such as the optimization of spatial patterns of resource-based cities [19], optimization of land use spatial patterns [20], urban development boundary planning [21], landscape spatial planning [22], etc.; (4) Ecological sensitivity evaluations of specific projects, such as power grid projects [23], airport reclamation projects [24], and hydroelectric power plant projects [25]. The above research provides a theoretical reference for establishing the evaluation content of the ecological sensitivity of intercity railway network planning and establishing a quantitative measurement method of the ecological sensitivity of intercity railway network planning.
There are few studies on the ecological sensitivity evaluation of intercity railway network planning, and the research contents include evaluation indicators, evaluation methods and evaluation contents. In 2008, Kuang et al. [26] took the Baihe-Helong section of the eastern railway channel in Northeast China as an example, established an evaluation index system from three aspects: ecology, landscape ecology and service function. The ecological impact of railway construction in Changbai Mountain Nature Reserve was evaluated by AHP. In 2010, Mancebo Quintana et al. [27] evaluated the impact of the construction of a Spanish railway network on species survival in the region by calculating the landscape patch connectivity index. In 2014, Qu et al. [28] took the planning of Beijing-Tianjin-Hebei intercity railway network as an example, and from there, three types of sensitive sources (nature reserves, geological disasters and soil erosion) were selected as ecological sensitivity evaluation indicators. In 2015, Du [29] took the intercity railway network planning of the Guanzhong Plain city group as the research object. Through data collection and field investigation, it was concluded that the sensitive factors restricting the implementation of the planning include land resources, nature reserves, water resources and cultural relics. In 2018, Liang [30] selected three types of sensitive sources within the planning scope of the railway network, such as natural reserve, soil erosion and resource loss, as evaluation indicators, and used AHP and comprehensive index method to predict and evaluate the possibility of ecological risk.
The above references have the following characteristics. First, in terms of evaluation indicators, the evaluation indicators proposed in the above references are generally divided into two types: quantitative indicators and qualitative indicators. See Table 1 for details. Second, in terms of evaluation methods, Kuang [26] and Mancebo Quintana [27] adopt quantitative analysis, Du [29] adopts qualitative analysis, and Qu [28] and Liang [30] adopt AHP to quantitatively evaluate the sensitivity of qualitative indicators. Qualitative analysis cannot quickly identify the short board factors of each planned line, which is not conducive to proposing targeted optimization and adjustment suggestions for the planned layout. AHP easily introduces the subjective factors of evaluators. This leads to the lack of objectivity of the evaluation results and affects the scientificity of the evaluation conclusions. Finally, in terms of evaluation content, Qu [28] only carries out sensitivity analysis on each single index and lacks quantitative evaluation on the comprehensive ecological sensitivity of the planned line, which is not conducive to the comparison and selection of multiple schemes in practical evaluation.
Considering the above problems, the purpose of this study is to establish a quantitative evaluation method of ecological sensitivity and put forward hypotheses on this basis: this method can find out the short board factor of each planned line so as to put forward targeted optimization and adjustment suggestions for the planning scheme. Finally, this hypothesis is verified by taking the planning of Guizhou intercity railway network as an example.

2. Materials and Methods

2.1. Description of the Study Area

Guizhou Province is located in the hinterland of Southwest China (103°36′–109°35′ E, 27°37′–29°13′ N). It governs 9 prefecture-level administrative regions (6 prefecture-level cities and 3 autonomous prefectures). The landform types are complex and can be summarized into four types: basin, hill, mountain and plateau. There are many rivers in Guizhou Province, and 984 of them are longer than 10 km. Land resources are mainly mountains and hills, with few plains. There are few land resources available for agricultural development in Guizhou Province, and the per capita cultivated land area in 2019 was only 1.67 mu. Guizhou Province is rich in coal resources and occupies an important position in China. Guizhou Province has a fragile geological environment and is one of the provinces with the most serious geological disasters in China [31].
To cooperate with the urban system development plan and meet the travel needs of intercity passengers, Guizhou Development and Reform Commission proposed to carry out new line planning based on the existing and under construction railway network to form a network layout of “three rings and eight rays” (Figure 1) and achieve the planning goal of “1–2-h traffic circle” between adjacent cities in Guizhou Province. Six new intercity railways with a total scale of 1118 km are planned, including four in recent planning (2021–2030) and two in future planning (after 2030). The suggestions for phased implementation of each new project are shown in Table 2.

2.2. Data Source and Processing

2.2.1. Evaluation Factors and Data Sources

According to the Technical Guidelines for Planning Environmental Impact Assessment (2020), evaluation of ecological sensitivity of planning schemes in terms of coordination between planning layout and local ecologically sensitive areas is the key content of EIA of transportation planning. Therefore, taking the intercity railway network planning of Guizhou Province as an example, according to the types of ecologically sensitive areas proposed in the Technical Specification for Ecological Function Regionalization (2014) and to the relevant documents [2,20] combined with the current situation of ecological environment and natural resources in the study area, six types of ecologically sensitive areas were selected as ecological sensitivity evaluation factors. These areas include protected areas, drinking water sources, geological disaster-prone areas, soil erosion areas, cultivated land resource distribution areas and coal resource distribution areas. According to the distribution characteristics of the evaluation factors in the planning area and the area size of the evaluation factors relative to the planning area, the evaluation factors are divided into target-sensitive points and target-sensitive areas. Target-sensitive points refer to the evaluation factors that are scattered in the planning area and have a small area compared to the planning area, such as nature reserves, scenic spots, forest parks and other protected areas. The target-sensitive area refers to the evaluation factor that is continuously distributed in the planning area and has a large area compared with the planning area. This includes drinking water sources, geological-disaster-prone areas, soil erosion areas, cultivated land resource distribution areas and coal resource distribution areas.
Research data sources: (1) The protected area data come from the main functional zoning of Guizhou Province, the ecological protection red line of Guizhou Province and the distribution map of the ecological protection red line of Guizhou Province issued by the People’s Government of Guizhou Province. (2) The drinking water source data are from the water quality monitoring results of county-level centralized drinking water sources issued by the Department of Ecological Environment of Guizhou Province. (3) The soil erosion area data are from the bulletin of water and soil conservation of Guizhou Province (2019) and the current situation map of water and soil loss in Guizhou Province. (4) The geological disaster susceptibility zone data come from the 13th five-year plan for the prevention and control of geological disasters in Guizhou Province and the zoning map of the geological disaster susceptibility zone in Guizhou, including the high susceptibility zone, medium susceptibility zone and low susceptibility zone. (5) The cultivated land resource distribution area data come from the overall land use planning of Guizhou Province and the current land use map of Guizhou Province. (6) The data of the coal resource distribution area come from the overall plan of mineral resources in Guizhou Province and the coal resource distribution map of Guizhou Province.

2.2.2. Data Processing

The planned new line is only a draft scheme, and its line location has a certain adjustment range. Therefore, the data processing method of target-sensitive points is to take the planned line location as the baseline and take a certain width to both sides to form the line swing range (the swing width is determined according to the expert consultation method). Based on GIS overlay method, the swing range is superimposed with the distribution map of nature reserves, scenic spots, forest parks and other protected areas in the planning area to master the distribution of target-sensitive points within the swing range. The processing steps are shown in Figure 2a. Considering the distribution characteristics of target-sensitive areas, assuming that the line location planning of the new line is the final implementation scheme, the road network planning layout of the study area and the distribution maps of various target-sensitive areas are superimposed successively based on GIS overlay method to identify the location relationship between the new line and various target-sensitive areas. The processing steps are shown in Figure 2b. To carry out spatial superposition analysis on the above distribution maps, first geolocation is carried out for all types of maps, and all maps are unified into the China Geodetic Coordinate System 2000 to meet the accuracy requirements as much as possible.

2.3. Construction of Ecological Sensitivity Evaluation Model

According to the Technical Guidelines for Planning Environmental Impact Assessment (2020), evaluation of ecological sensitivity of planning schemes in terms of coordination between planning layout and local ecologically sensitive areas is the key content of EIA of transportation planning. The greater the number and scale of ecologically sensitive areas involved in the planning route, the worse the coordination between the planning layout and the ecologically sensitive area of the planning area, the greater the probability of causing regional ecological environment problems and the more sensitive the regional ecological environment. Therefore, with the help of the GIS overlay method, the specific situations of various types of ecologically sensitive areas passed by the railway are counted. See Tables S1–S6 in the Supplementary Materials. According to references [32,33], the sensitivity measurement method of each evaluation factor is established in turn to obtain the sensitivity index of the evaluation factors. The evaluation indicator system (Table 3) is composed of the sensitivity index of each evaluation factor. According to The Technical Specification for Ecological Function Regionalization (2014), ecological sensitivity is divided into five levels: insensitive, slightly sensitive, moderately sensitive, highly sensitive and extremely sensitive, as shown in Table 3.

2.3.1. Single Factor Sensitivity Evaluation

(1) Sensitivity Evaluation of Protected Areas
The sensitivity of the protected areas depends on the type, quantity and grade of the protected areas within the swing range of the planned line, which is expressed by the sensitivity index of the protected areas. According to the collected data, there are five types of protected areas in the planning area, including scenic spots, nature reserves, forest parks, geoparks and wetland parks. The calculation formula is as follows [32]:
I p i = j = 1 5 k = 1 4 p j k
where I p i is the sensitivity index of protected area of the article i planned line; p j k represents the sensitivity coefficient of class j protected area at level k ; and the four levels of world level, national level, provincial level and municipal (state) level are correspondingly assigned as 7, 5, 3 and 1.
(2) Sensitivity Evaluation of Drinking Water Source
The sensitivity of drinking water sources depends on the distance between planned lines and drinking water sources and the water quality monitoring level of drinking water sources, which is expressed by the sensitivity index of drinking water sources. The calculation formula is as follows [32]:
I w i = j = 1 n W l j α j
where I w i is the drinking water source sensitivity index of the i planned line and W l j represents the sensitivity coefficient of the j -th water source involved. According to the distance between the planned line and the drinking water source, crossing, adjacent (<0.5 km) and relatively close (<1 km), the values are assigned as 5, 3 and 1, in turn; α j represents the water quality coefficient of the j -th water source involved, and the values for class I, II and III water quality are assigned as 0.5, 0.3 and 0.2, in turn; n represents the number of drinking water sources involved.
(3) Geological Hazard Sensitivity Evaluation
The geological hazard sensitivity depends on the length of the planned line passing through the geological hazard prone area in the planning area, which is expressed by the geological hazard sensitivity index. The calculation formula is as follows [33]:
I g i = s = 1 3 g s l s l × 100 %
where I g i represents the geological hazard sensitivity index of the i planned line; l s refers to the length of the section where the planned line crosses class s prone area (km); g s represents the sensitivity coefficient of various geological-disaster-prone areas, and the three types of geological disaster high prone area, geological disaster medium prone area and geological disaster low prone area are assigned as 0.5, 0.3 and 0.2, in turn; l refers to the planned mileage of the i planned line (km).
(4) Evaluation of Soil Erosion Sensitivity
The soil erosion sensitivity depends on the length of the planned line passing through the soil erosion area in the planning area, which is expressed by the soil erosion sensitivity index. The calculation formula is as follows [32]:
I s i = k = 1 5 s k l k l × 100 %
where l k refers to the length of the section where the planned line crosses the class k erosion area (km); S k refers to the sensitivity coefficient of various erosion areas, and the five erosion areas of severe erosion, extremely strong erosion, strong erosion, moderate erosion and mild erosion are assigned as 0.4, 0.3, 0.15, 0.1 and 0.05, respectively; and l refers to the planned mileage of the i planned line (km).
(5) Sensitivity Evaluation of Cultivated Land Resources
The sensitivity of cultivated land resources depends on the length of the planned line passing through the cultivated land in the planning area, which is expressed by the sensitivity index of cultivated land resources. The calculation formula is as follows [33]:
I c i = p = 1 n l p c p l
where I c i is the cultivated land resource sensitivity index of the i planned line; l p refers to the length of the planned line crossing the cultivated land resource area in County p (km); C p refers to the sensitivity coefficient of cultivated land resources in County p ; according to the per capita cultivated land area of each county, large (>1.2 mu), medium (0.6–1.2 mu) and small (<0.6 mu), it is assigned as 1, 3 and 5, in turn; n indicates the number of counties the planned line crosses; l refers to the planned mileage of the i planned line (km).
(6) Sensitivity Evaluation of Coal Resources
The sensitivity of coal resources depends on the length of the planned line passing through the coal mining area, which is expressed by the sensitivity index of coal resources, and the calculation formula is as follows [33]:
I o i = s = 1 n l s o s l
where I o i represents the coal resource sensitivity index of the i planned line; l s refers to the length of the section where the planned line crosses the s coal mine area (km); and O s refers to the sensitivity coefficient of the s coal mining area. For the three types of coal mine area scales of large (>1 billion tons), medium (500–1 billion tons) and small (<500 million tons), it is assigned as 5, 3 and 1, respectively; n represents the number of coal mining areas crossed by the line; l refers to the planned mileage of the i planned line (km).

2.3.2. Comprehensive Evaluation of Ecological Sensitivity

The sensitivity of the planned line is expressed by the comprehensive ecological sensitivity index. Five sensitivity grades with their corresponding values are presented in Table 4. The weighted superposition model is used to determine the comprehensive index of ecological sensitivity of each planned line. The calculation formula is as follows [34,35,36]:
I i = j = 1 6 C j ω j
where I i represents the comprehensive index of ecological sensitivity of the i planned line; C j represents the sensitivity level assignment of the j -th index; and ω j represents the ecological sensitivity weight of the j -th index, which is comprehensively determined based on the entropy weight method [37,38,39] and analytic hierarchy process [40,41] (Table 3). According to The Main Function Zoning in Guizhou Province and combined with the distribution characteristics of the comprehensive index of ecological sensitivity, the classification standard of the comprehensive index of ecological sensitivity is established, as shown in Table 4.

3. Results and Analysis

3.1. Single Factor Sensitivity Analysis

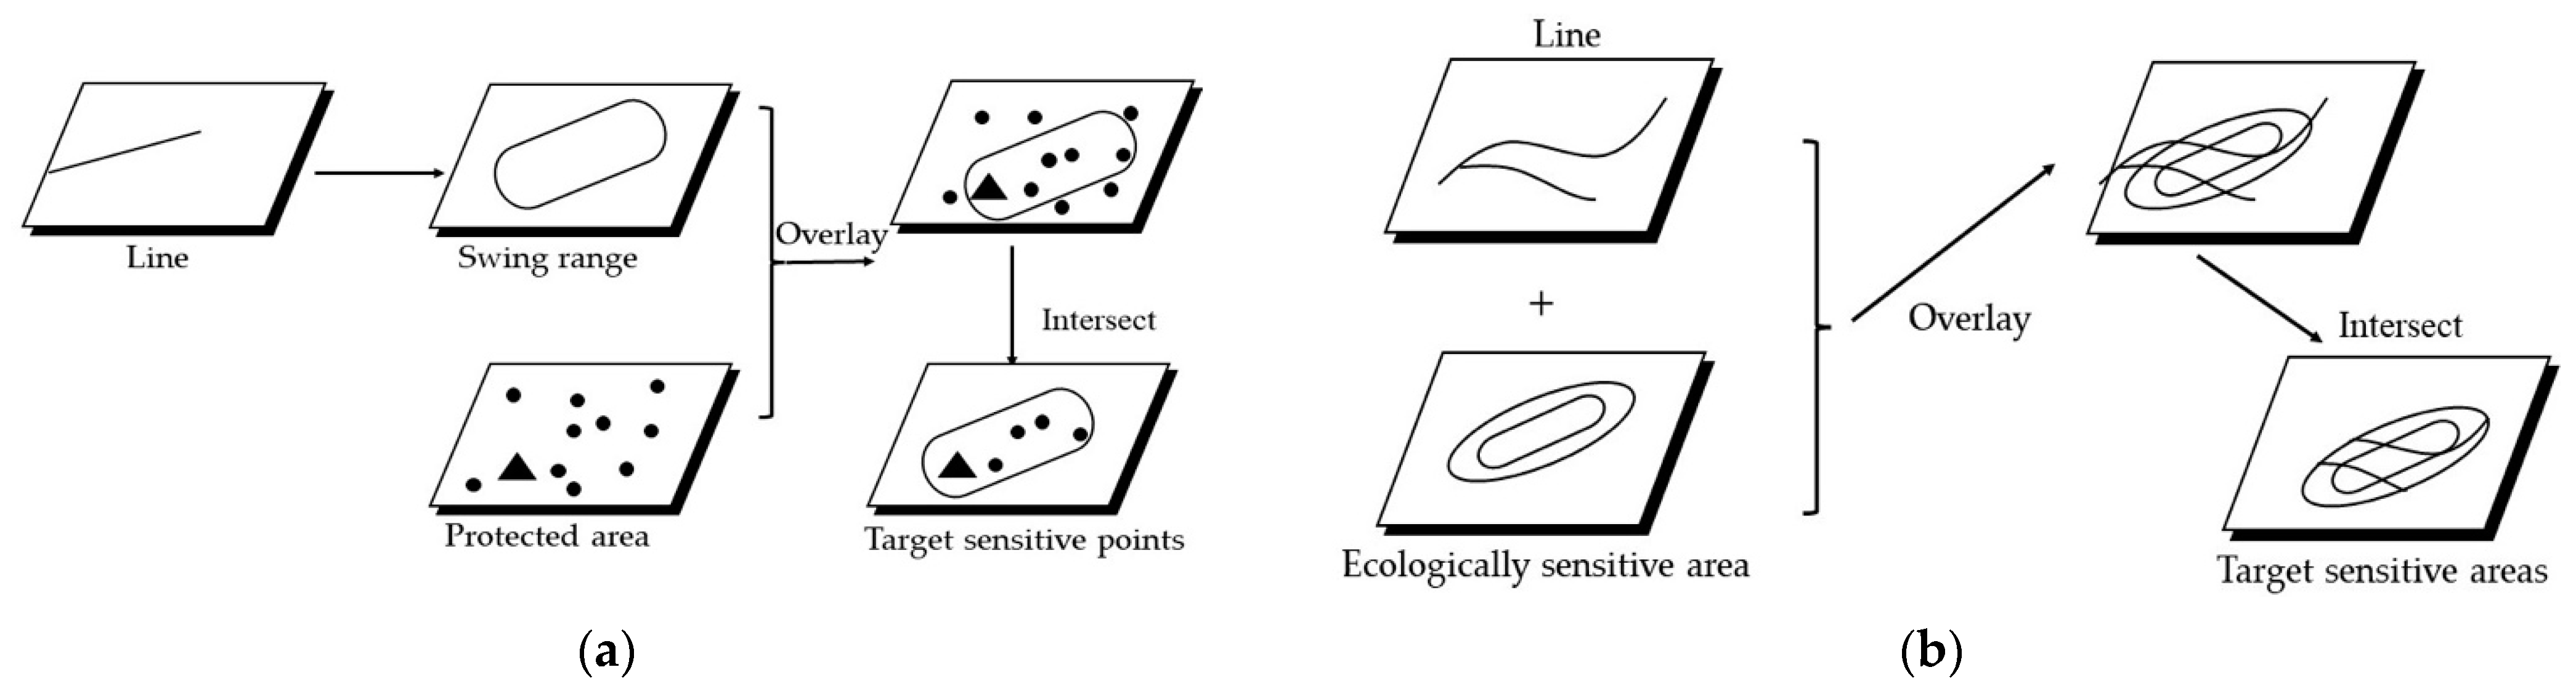
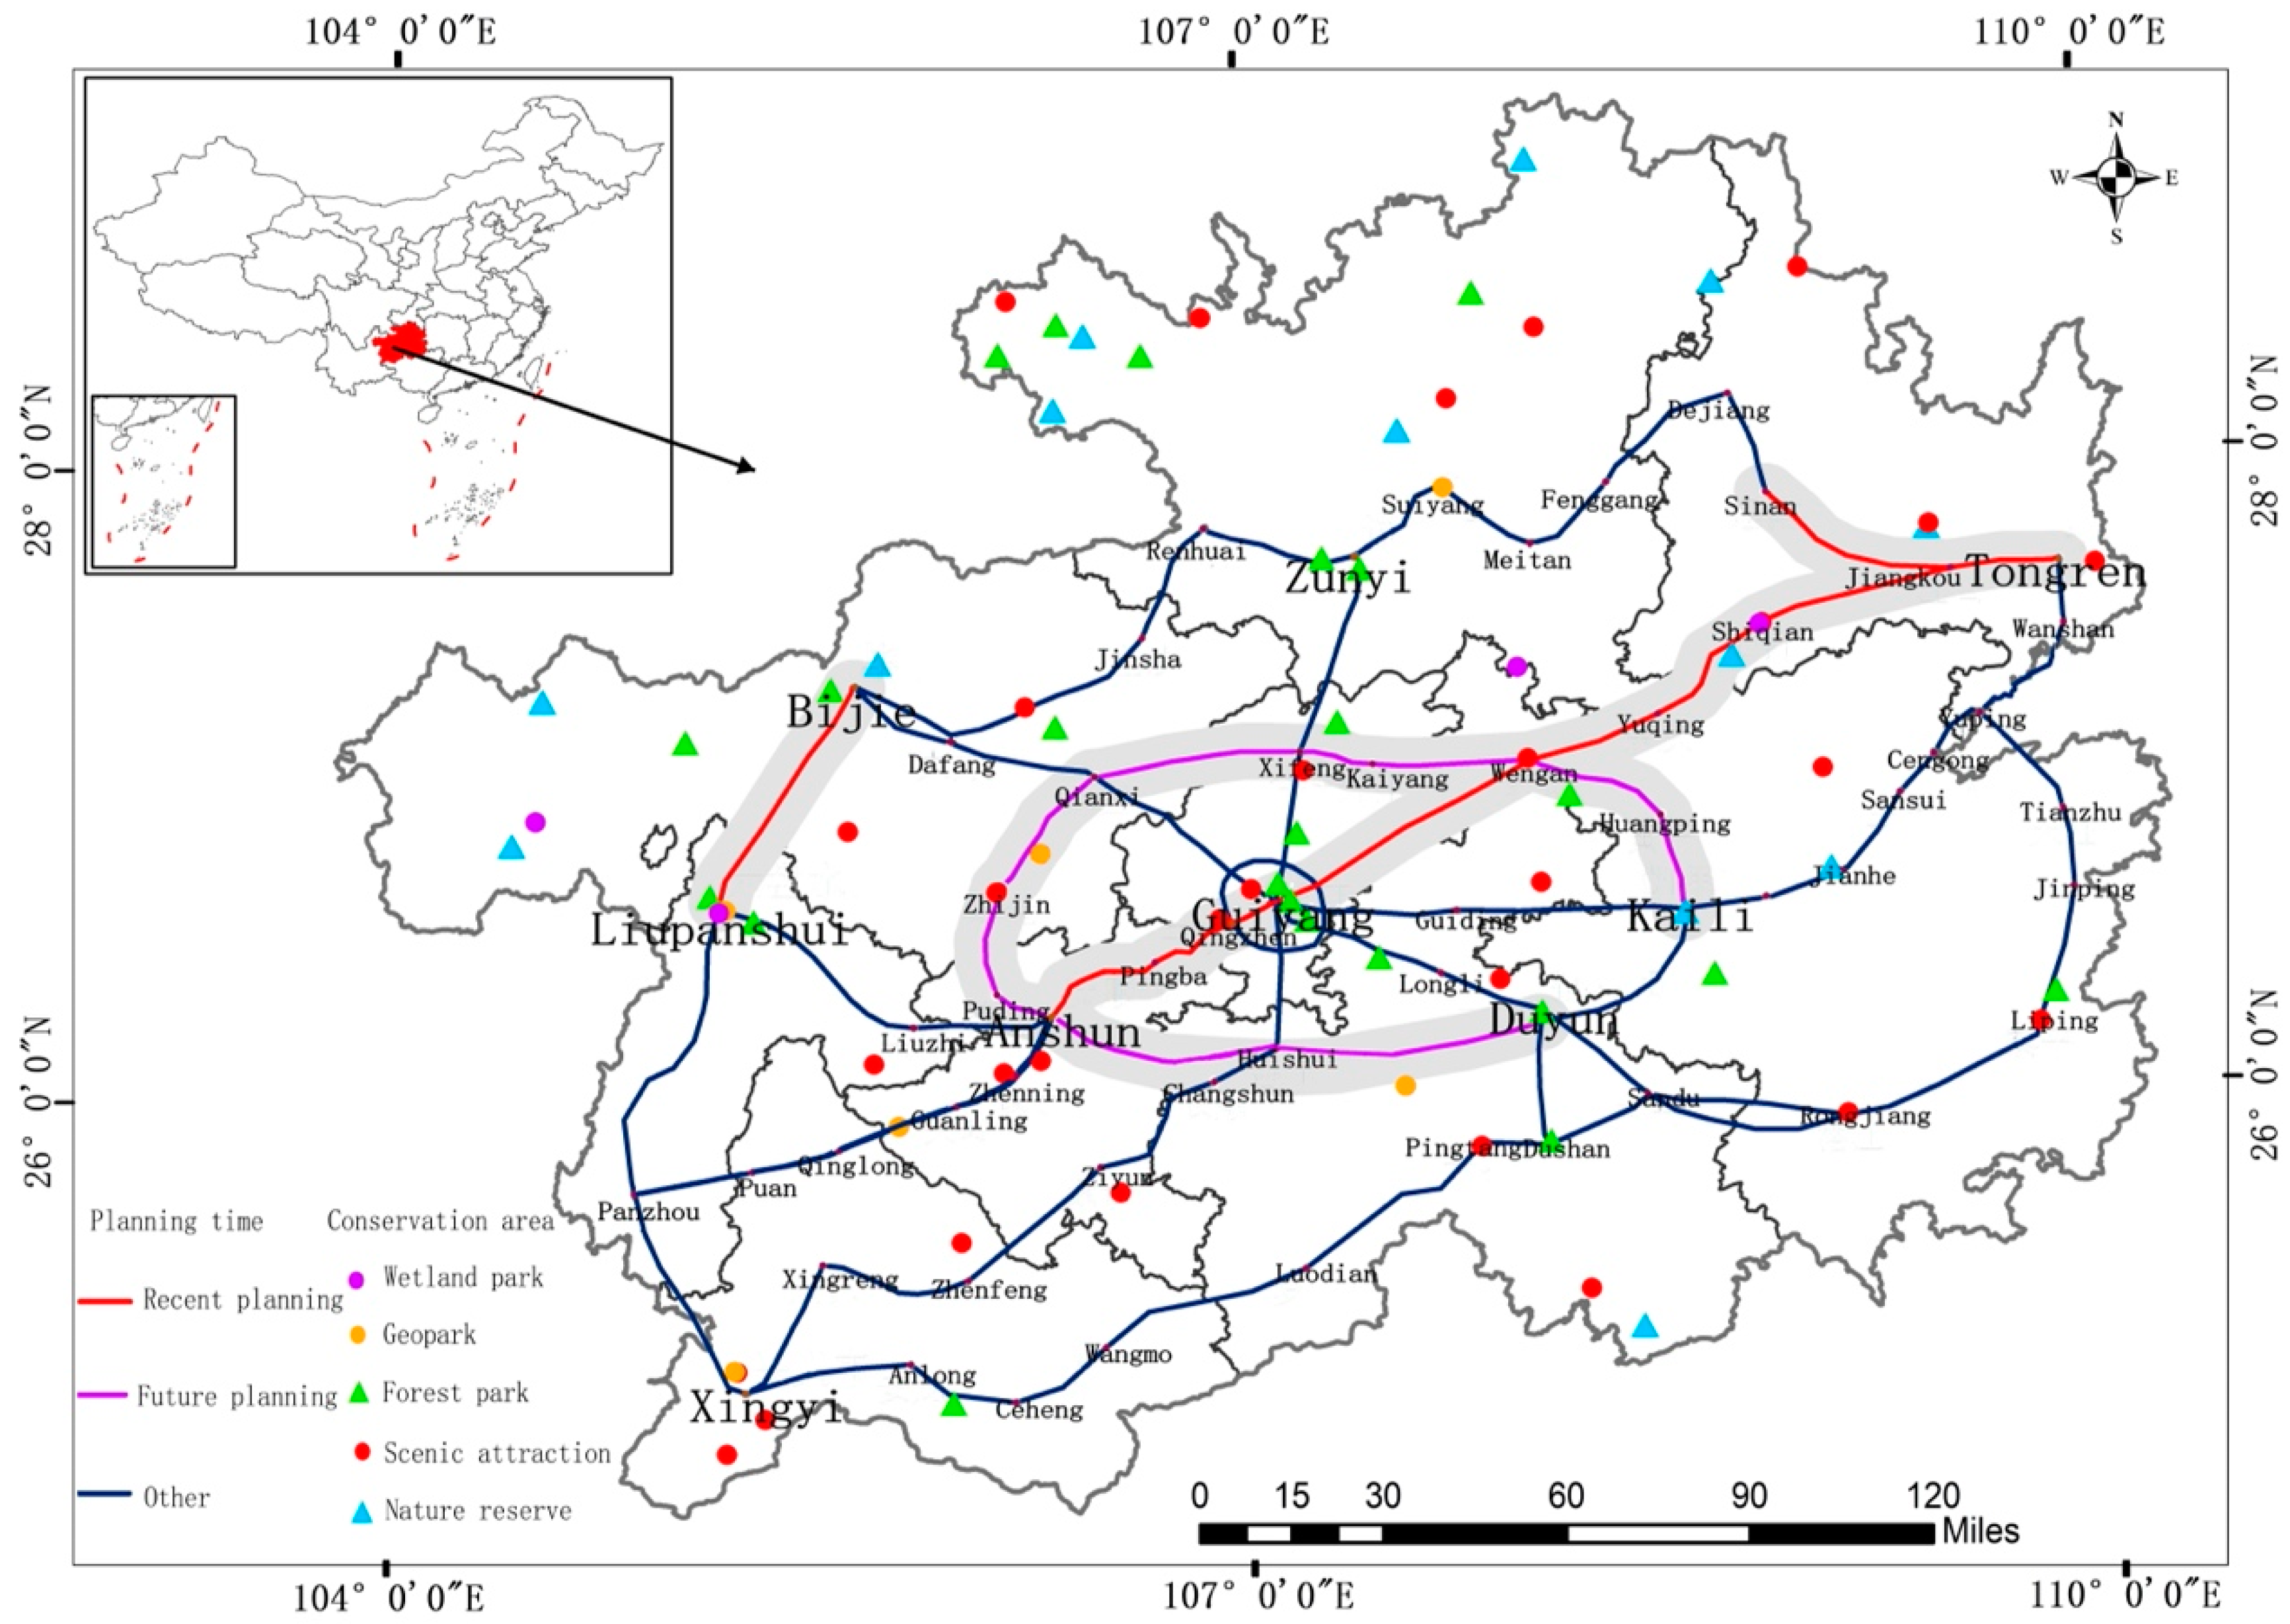
3.1.1. Sensitivity Analysis of Protected Areas

According to the experience value of expert design mentioned in the literature [27], the planned line position is taken as the centerline, and 10 km is taken on both sides to form the swing range of the planned line. According to statistics, there are 17 protected areas within the swing range, including scenic spots, nature reserves, forest parks, geoparks and wetland parks, accounting for 21.8% of the total number of protected areas in the planning area. The specific distribution is shown in Table 5. There are a total of 11 protected areas within the swing range of the planned line in the near future. Among them, the “eighth ray” line involves the largest number of protected areas, which are mainly concentrated in the Guiyang Weng’an section and Yuqing Shiqian section of the line. Among them, the protected areas that may be affected by the Guiyang Weng’an section include Changpoling National Forest Park Luchongguan Forest Park and Weng’an River scenic spot in Guiyang. The nature reserves that may be affected by the Yuqing Shiqian section include the Guizhou Shiqian Foding Mountain Provincial Nature Reserve and Shiqian Yuanyang Lake National Wetland Park. There are a total of six protected areas within the swing range of the line in the long-term planning, among which the L6 line involves the most protected areas, mainly in the Zhijin Xifeng section and Weng’an Kaili section of the line. Among them, the protected areas that may be affected by the Zhijin Xifeng section include Guizhou zhijindong National Geopark, Zhijindong scenic spot and Xifeng scenic spot. The protected areas that may be affected in the Weng’an Kaili section include Zhujiashan National Forest Park and Guizhou Leigongshan National Nature Reserve. According to Figure 3, the distribution of protected areas within the swing range of each planned line is counted, the protected area sensitivity index of each planned line is calculated by Equation (1), and the protected area sensitivity level of each planned line is determined according to Table 3. The evaluation results are shown in Table 6.

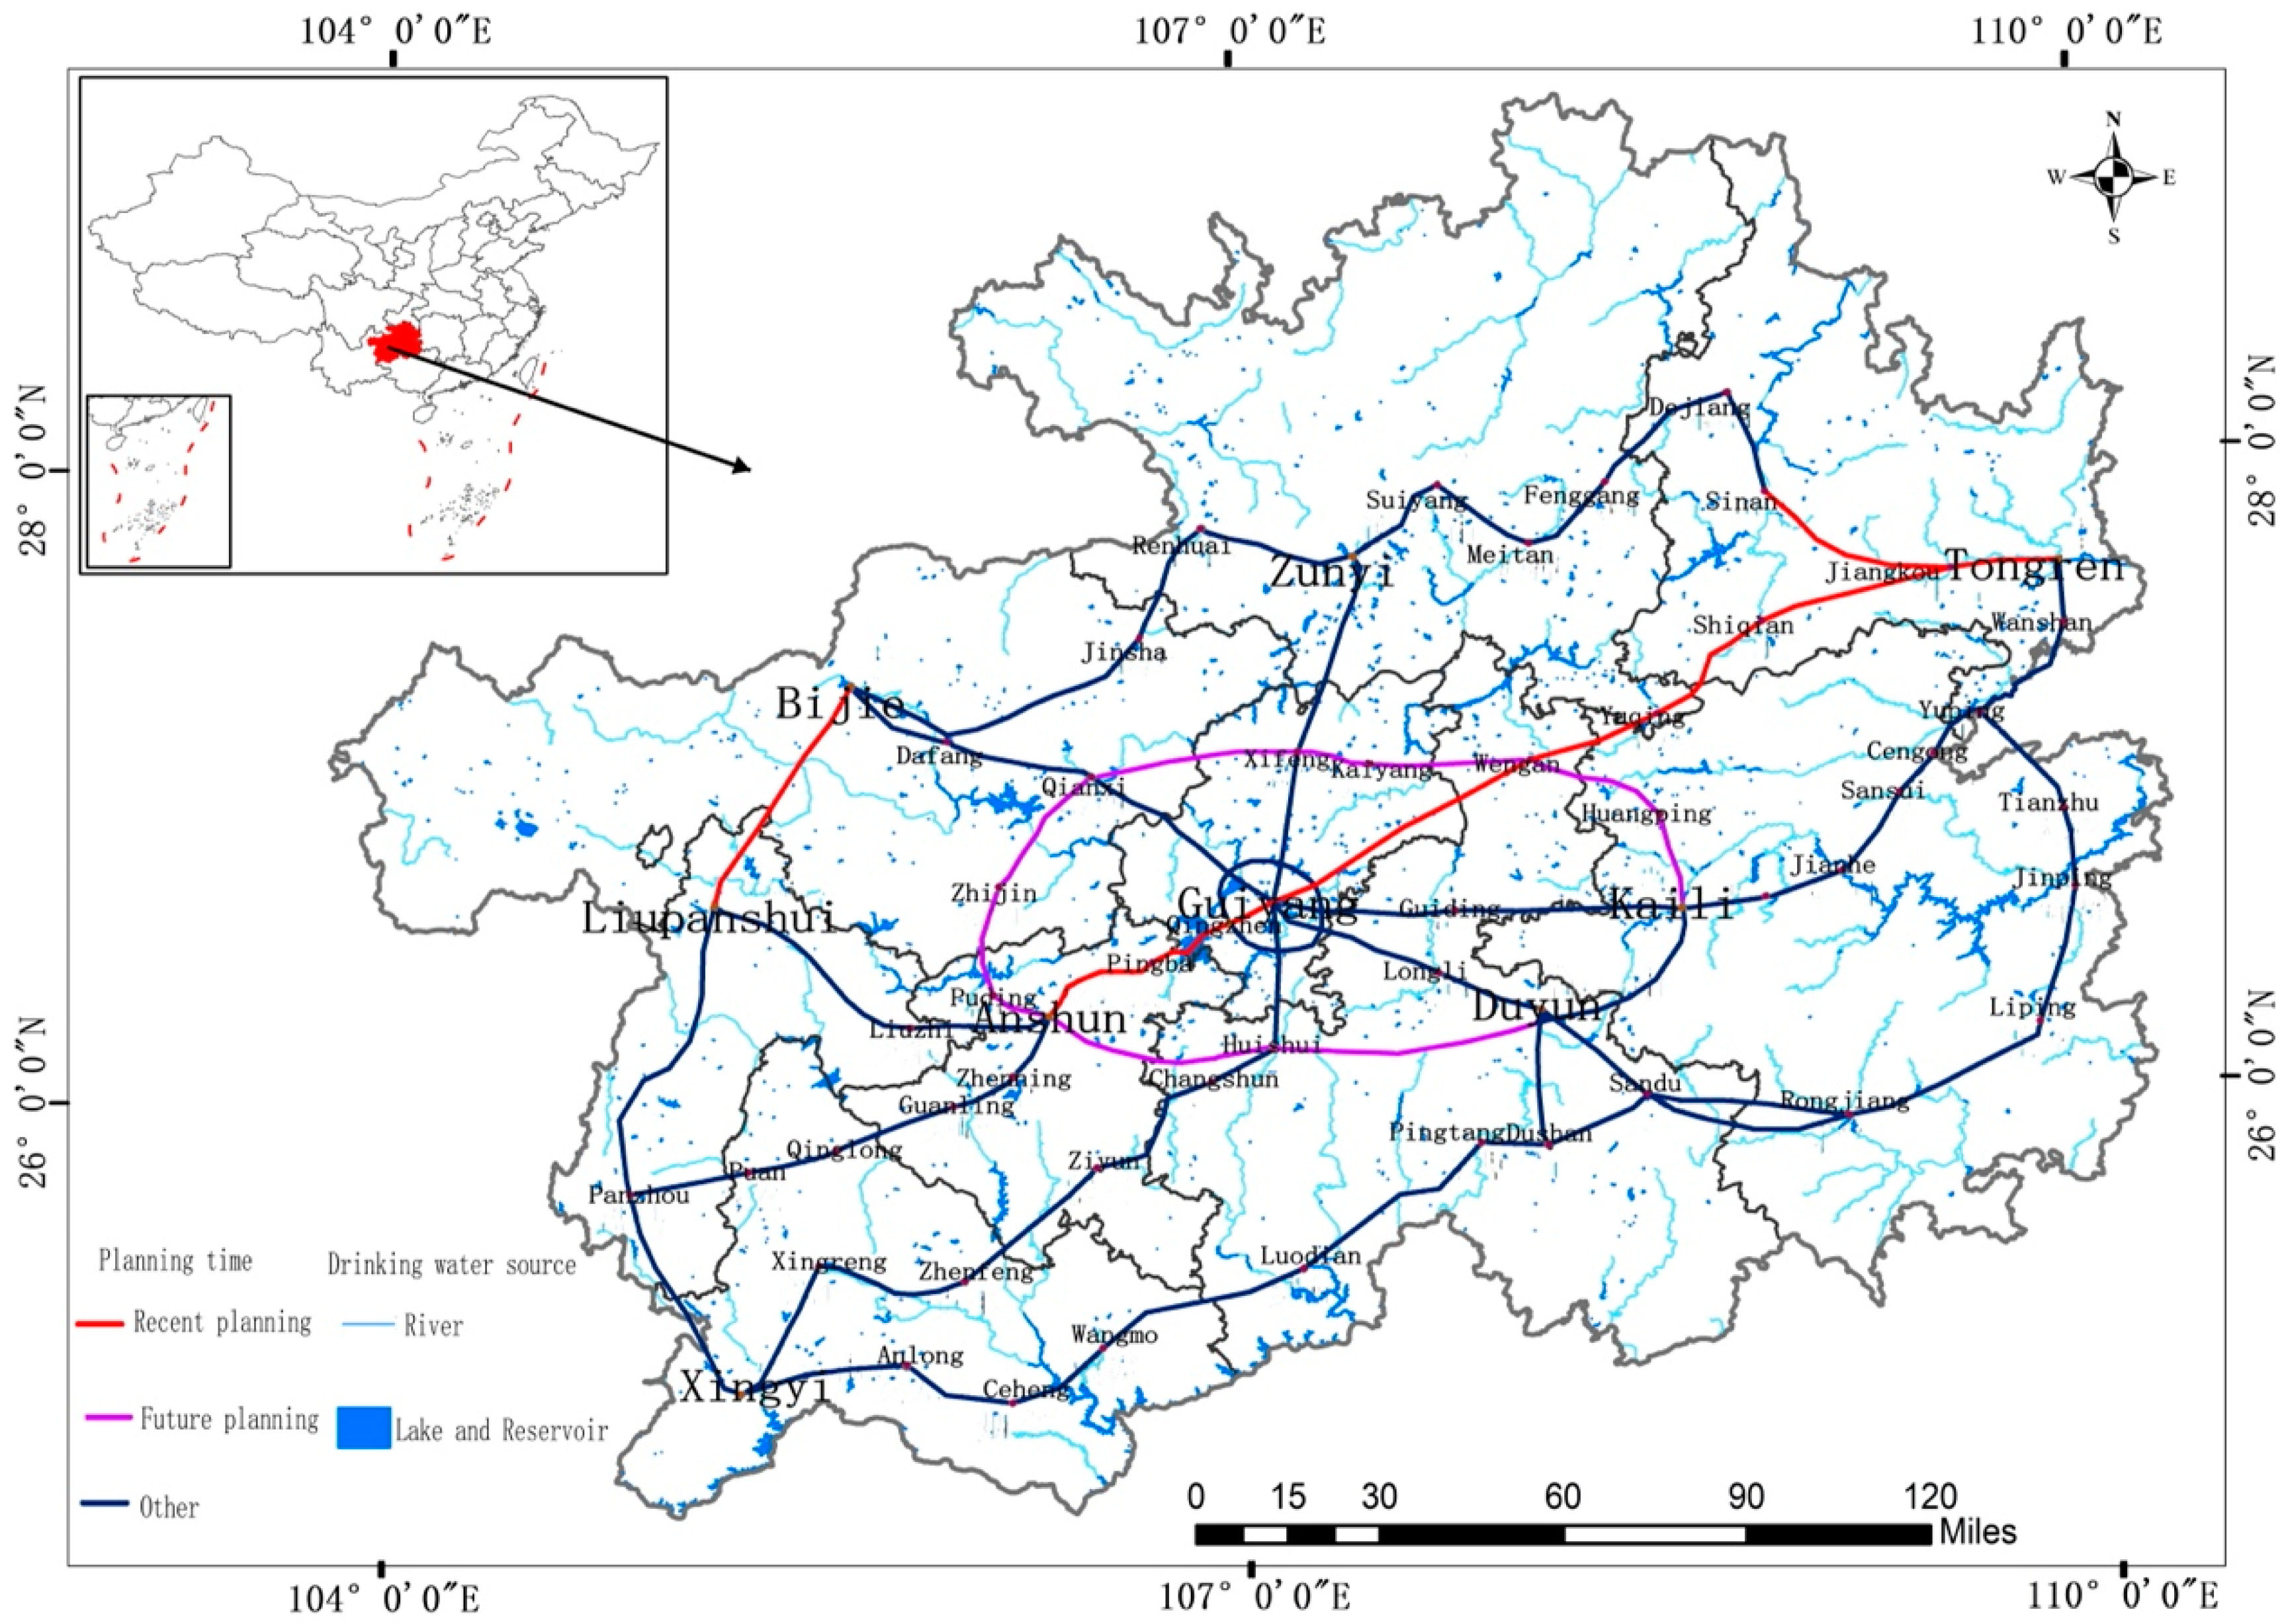
3.1.2. Sensitivity Analysis of Drinking Water Source

According to statistics, 18 drinking water sources may be involved in the planned lines of the intercity railway network, of which 61% are crossed and 44.4% are water sources with water quality grade II. See Table 7 for details. A total of nine water sources may be involved in the recent planning line, of which the L2 line involves the most water sources and crosses two water sources, of which the Shiqian Jiangkou section crosses the Yanmenkou water source and the Jiangkou Tongren section crosses the Lusiyan water source. A total of nine water sources may be involved in the long-term planning line, of which the L6 line involves the most water sources and crosses three water sources, of which the Puding Zhijin section crosses the Yelang Lake water source, the Weng’an Huangping section crosses the Heshanxi water source, and the Huangping Kaili section crosses the Nanjiaoxi water source. According to Figure 4, the possible drinking water sources involved in the planned line are counted. The sensitivity index of drinking water source is calculated according to Equation (2), and the sensitivity grade of drinking water source is determined according to Table 3. The evaluation results are shown in Table 6.

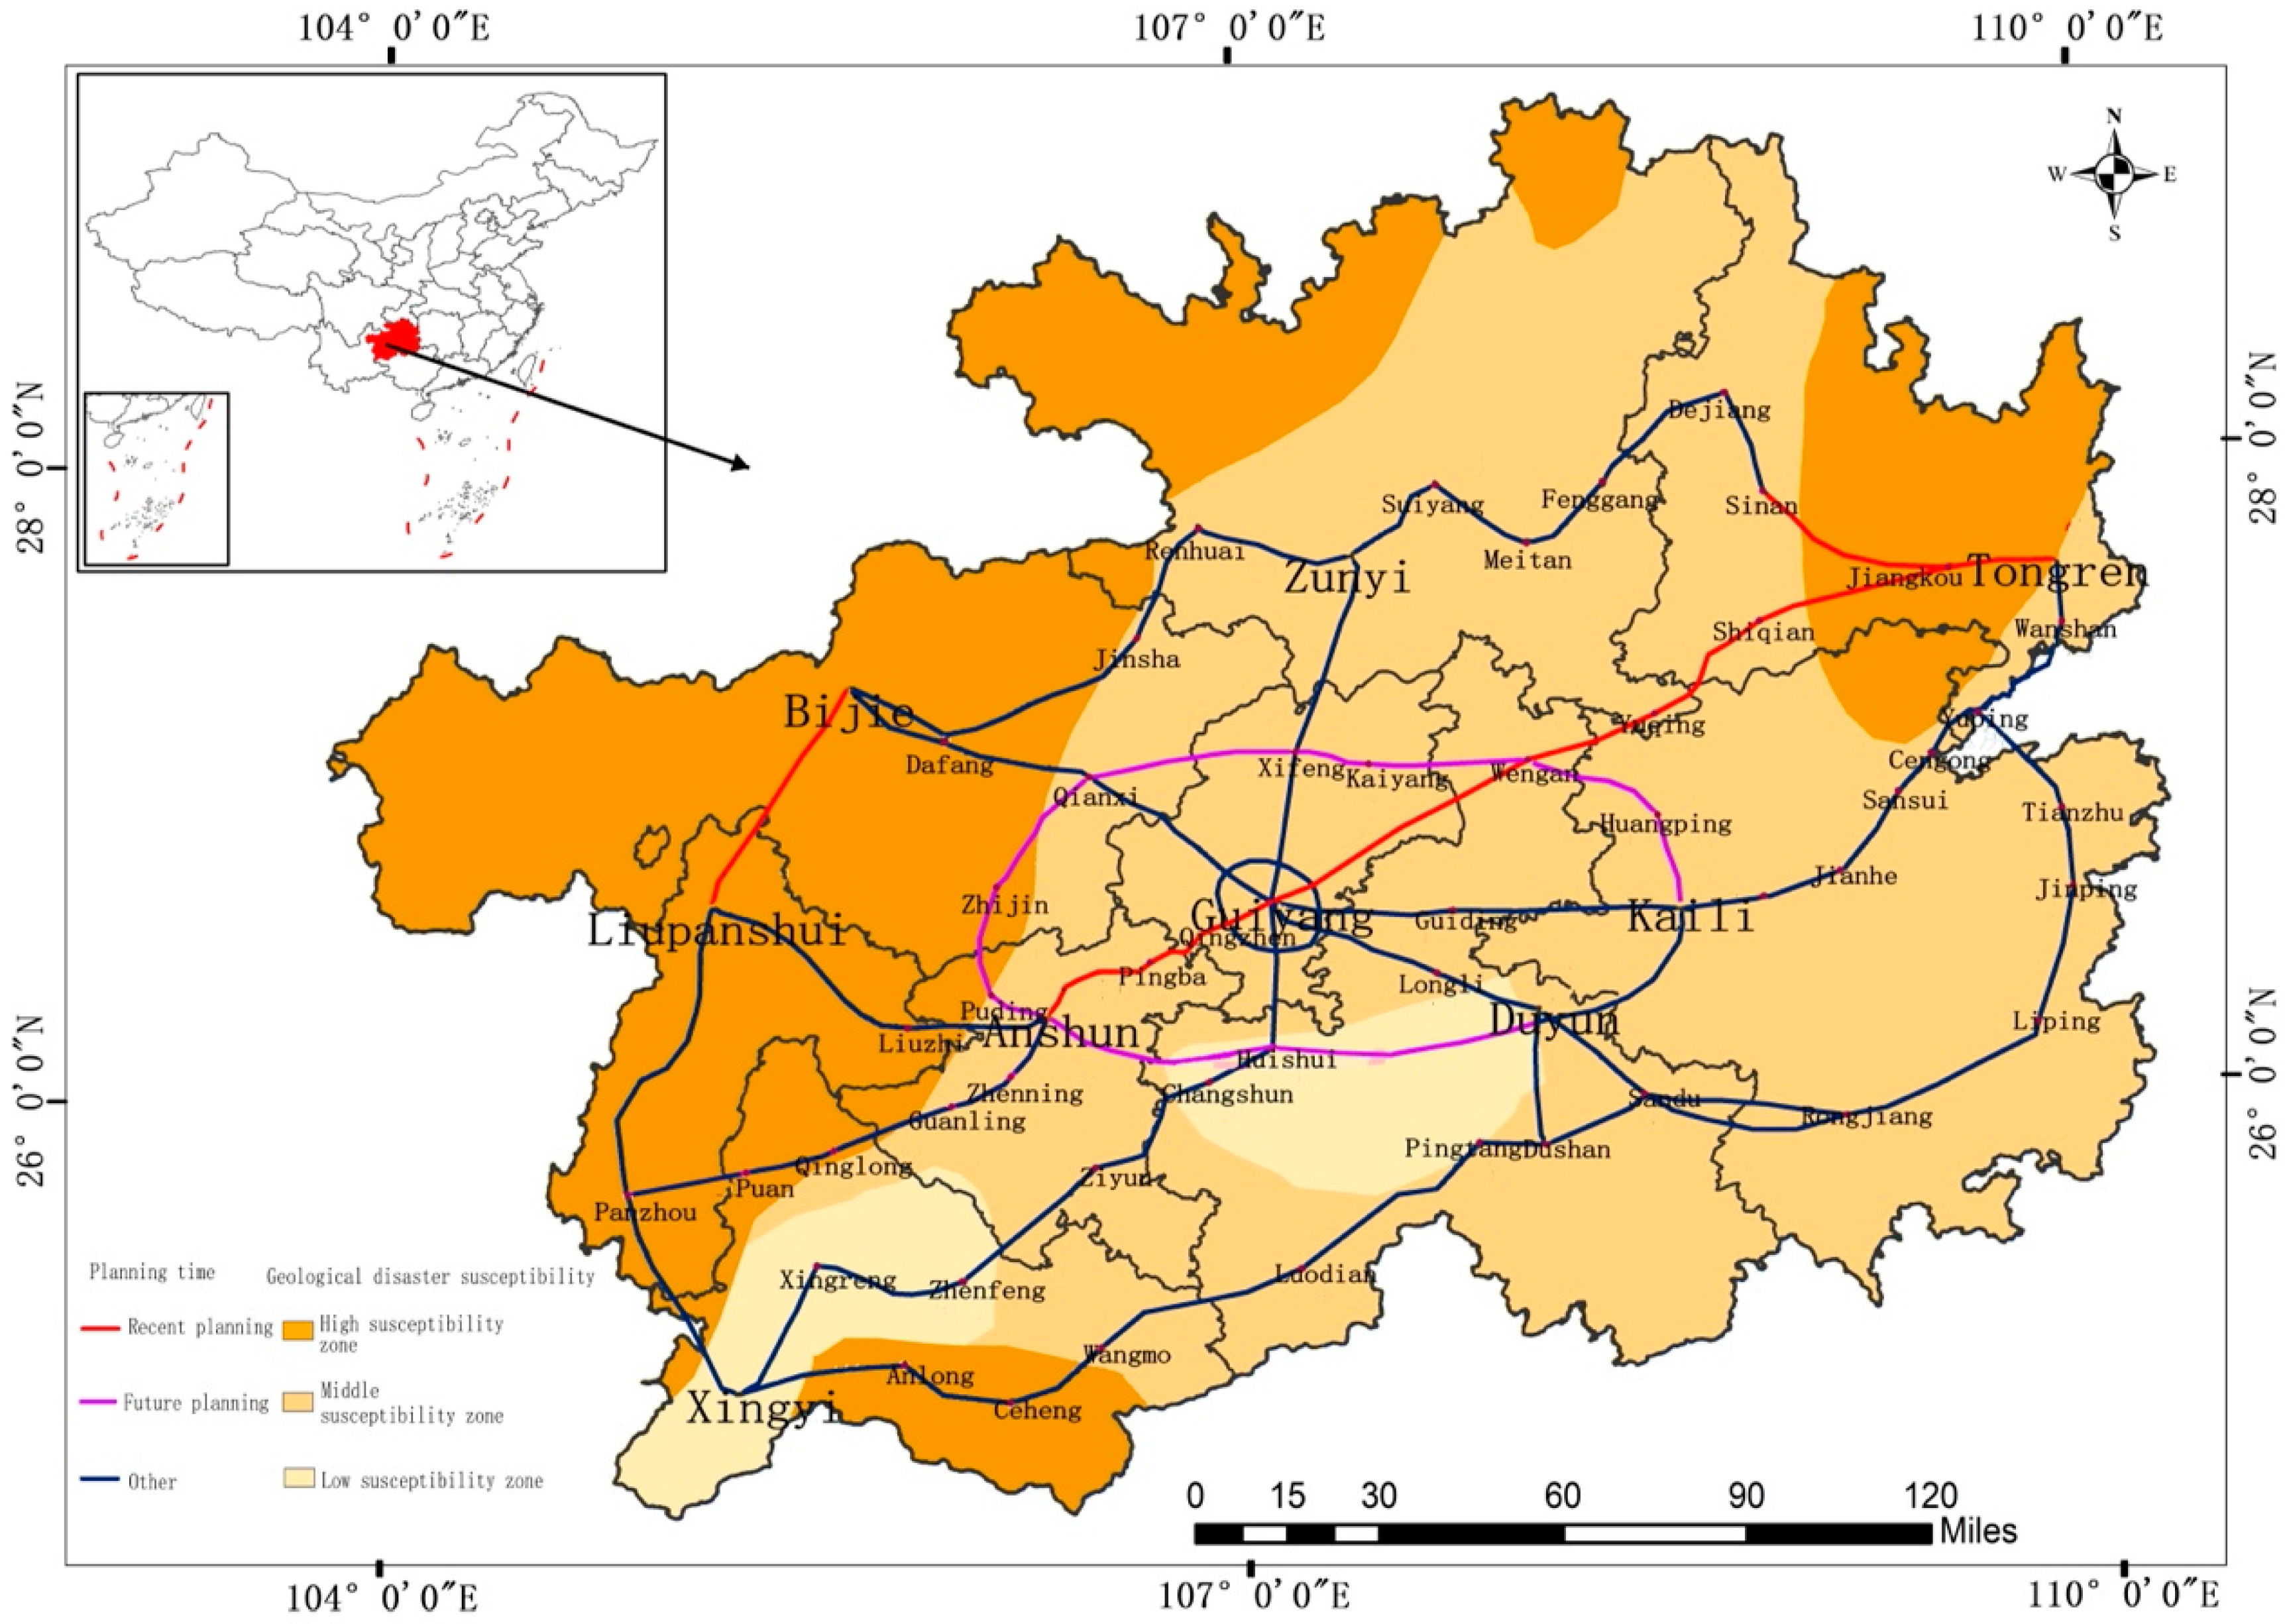
3.1.3. Sensitivity Analysis of Geological Hazards

Geological hazards refer to geological actions caused by natural or man-made factors that cause losses to human life and property and damage to the environment. The number and scale of geological hazards caused by human engineering activities are positively correlated with construction intensity. The types of geological hazards in the study area mainly include landslides, collapses, debris flows, ground collapses and ground fissures. According to statistics, the length of the planned line of the intercity railway network crossing the high geological hazard prone area is 326.6 km, accounting for 29.2% of the total planned mileage, of which the short-term planning accounts for 21.7% and the long-term planning accounts for 7.5%; the length of the planned line crossing the medium geological-disaster-prone area is 659 km, accounting for 58.9% of the total planned mileage, of which the short-term planning accounts for 26.9% and the long-term planning accounts for 32%. The length of the planned line crossing the low geological-hazard-prone area is 132.4 km, accounting for 11.8% of the total planned mileage, of which short-term planning accounts for 0.0% and long-term planning accounts for 11.8%. According to Figure 5, calculate the length of the planned line passing through the prone area, calculate the geological hazard sensitivity index of the planned line by using Equation (3), and determine the geological hazard sensitivity grade of the planned line according to Table 3. The evaluation results are shown in Table 6.

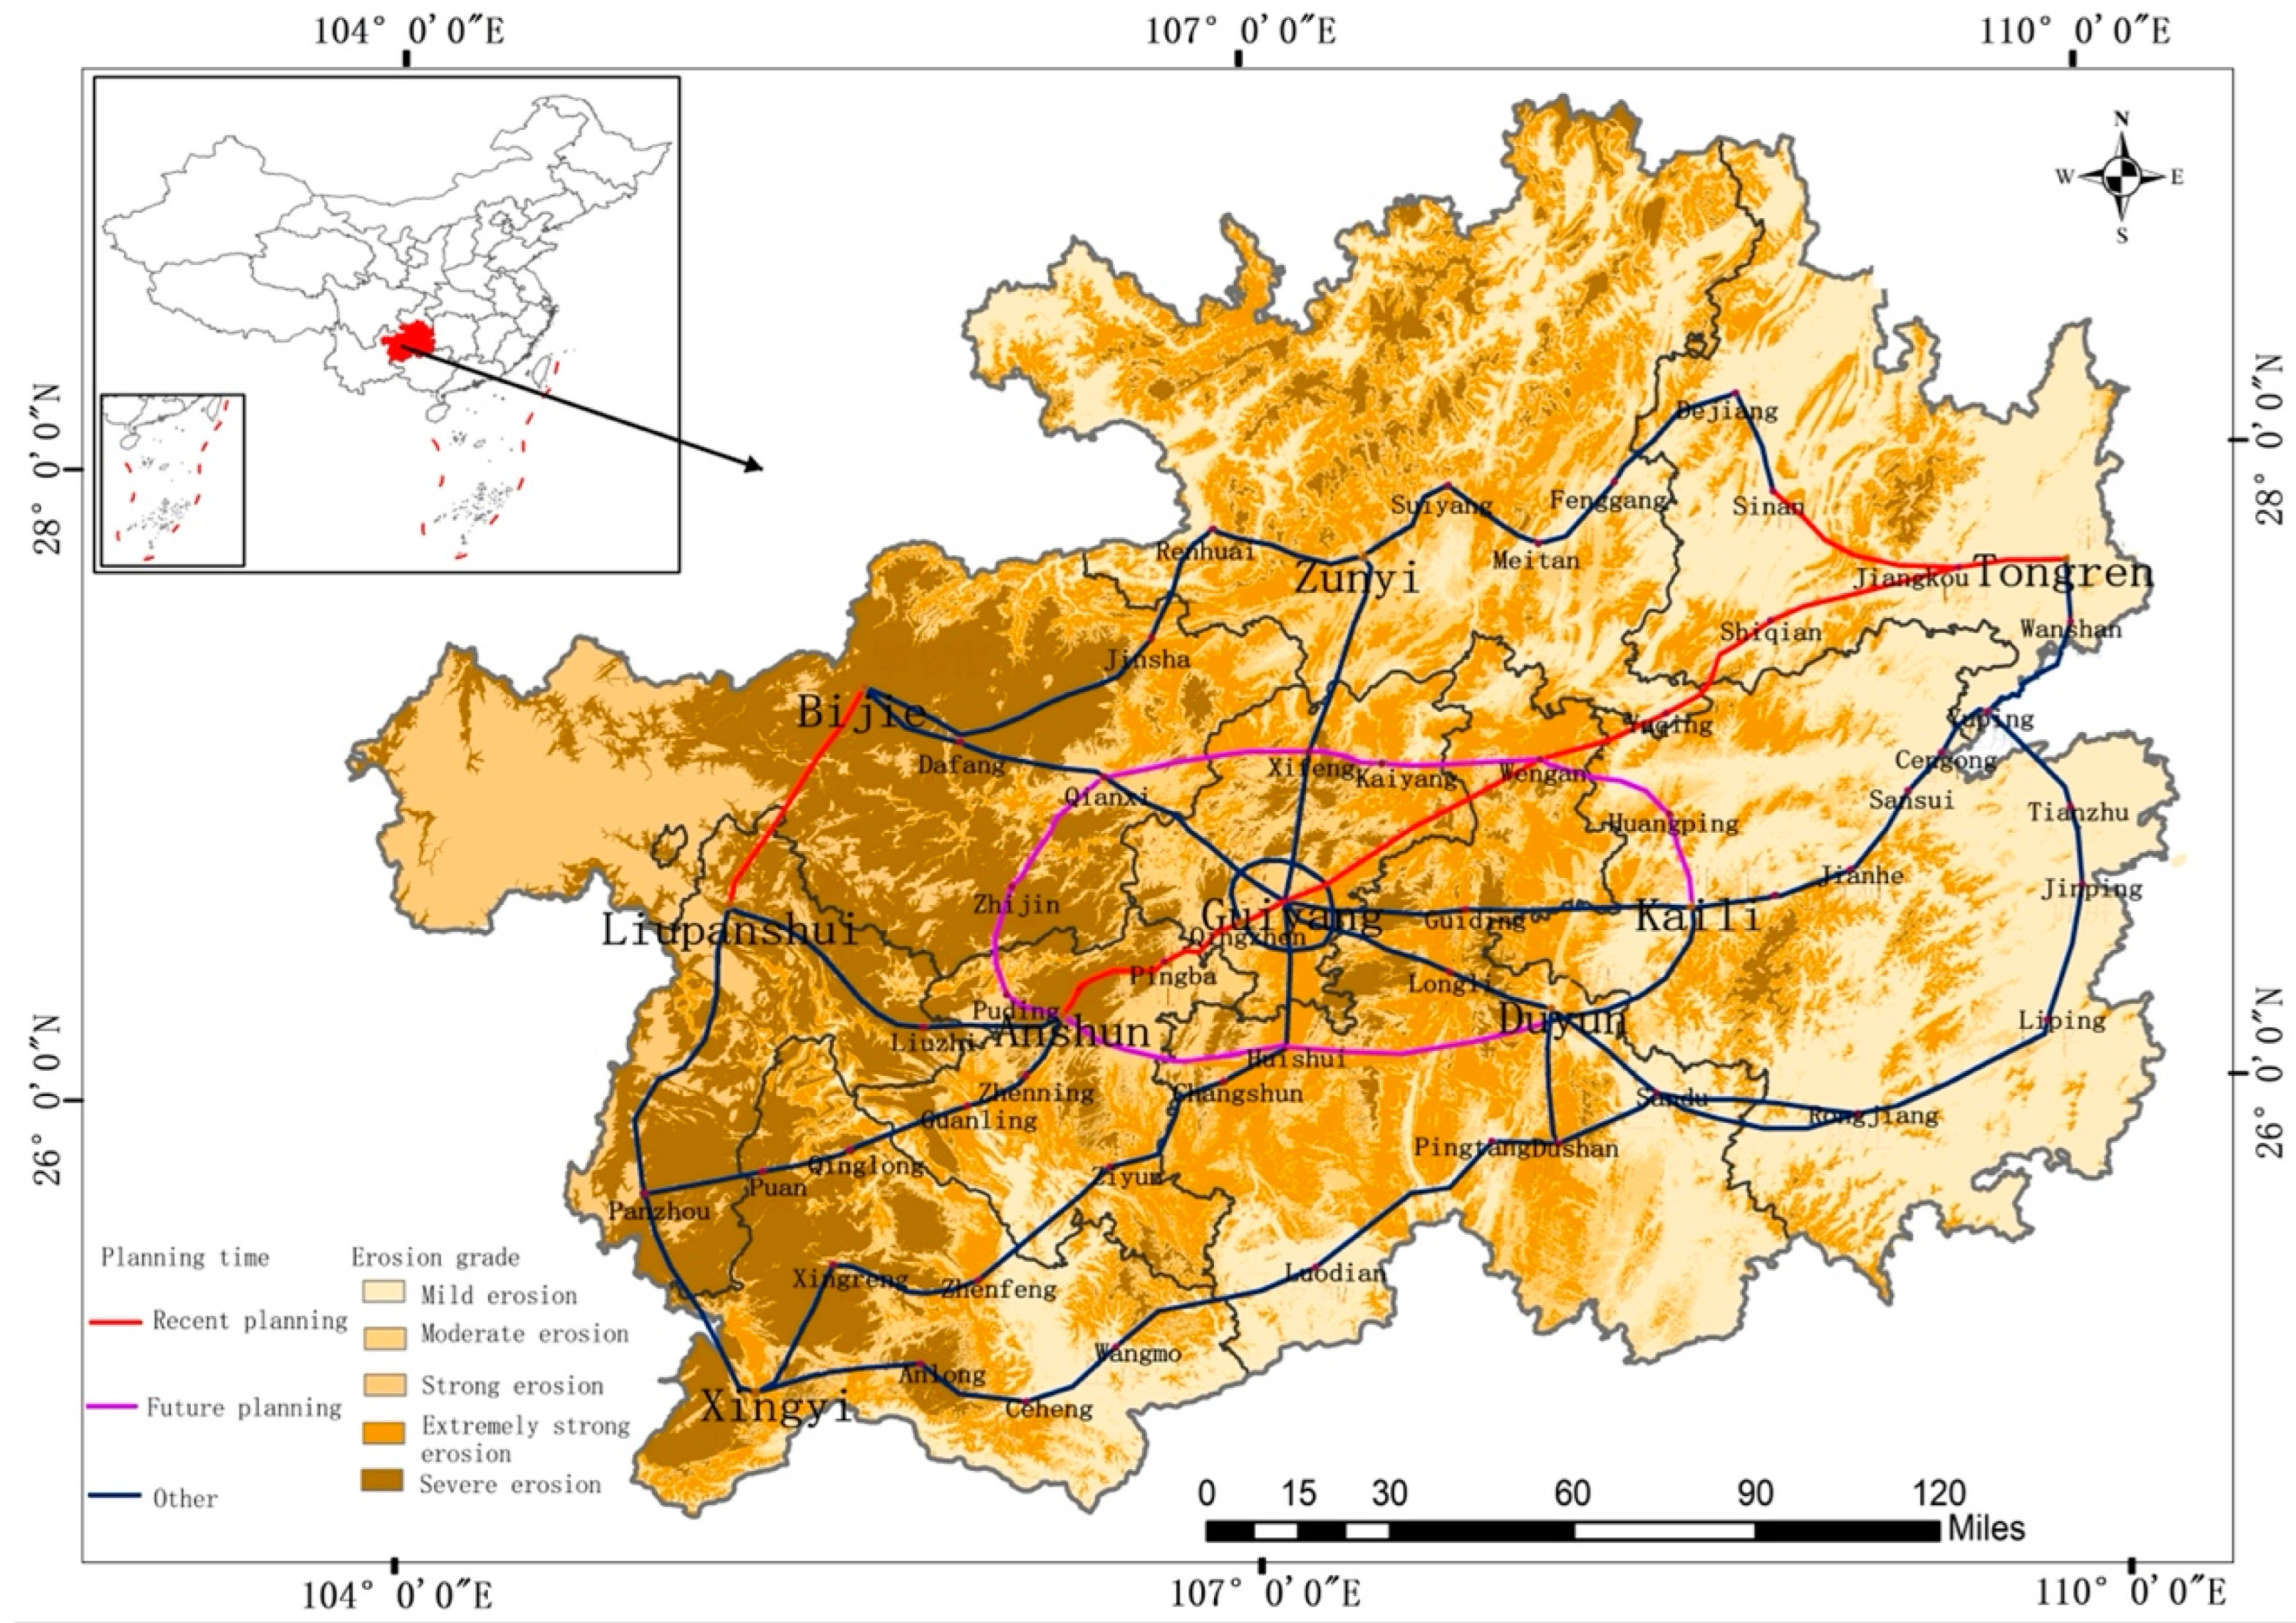
3.1.4. Sensitivity Analysis of Soil Erosion

The construction of intercity railway networks will occupy land and destroy vegetation, which will aggravate the water and soil loss along the line. According to statistics, the planned lines of the intercity railway network mainly pass through mild erosion areas and extremely strong erosion areas, accounting for 24.8% and 29.2% of the total mileage, respectively. The short-term planned line mainly passes through the mild erosion area, reaching 37.4% of the total mileage of the short-term planned line. The long-term planned line mainly passes through the extremely strong erosion area, reaching 34.9% of the total mileage of the long-term planned line. According to Figure 6, the length of the line segment through the soil and water loss area of the intercity planning line is calculated. The soil and water loss sensitivity index of the planning line is calculated according to Equation (4), and the soil and water loss sensitivity level of the planning line is determined according to Table 3. The evaluation results are shown in Table 6.

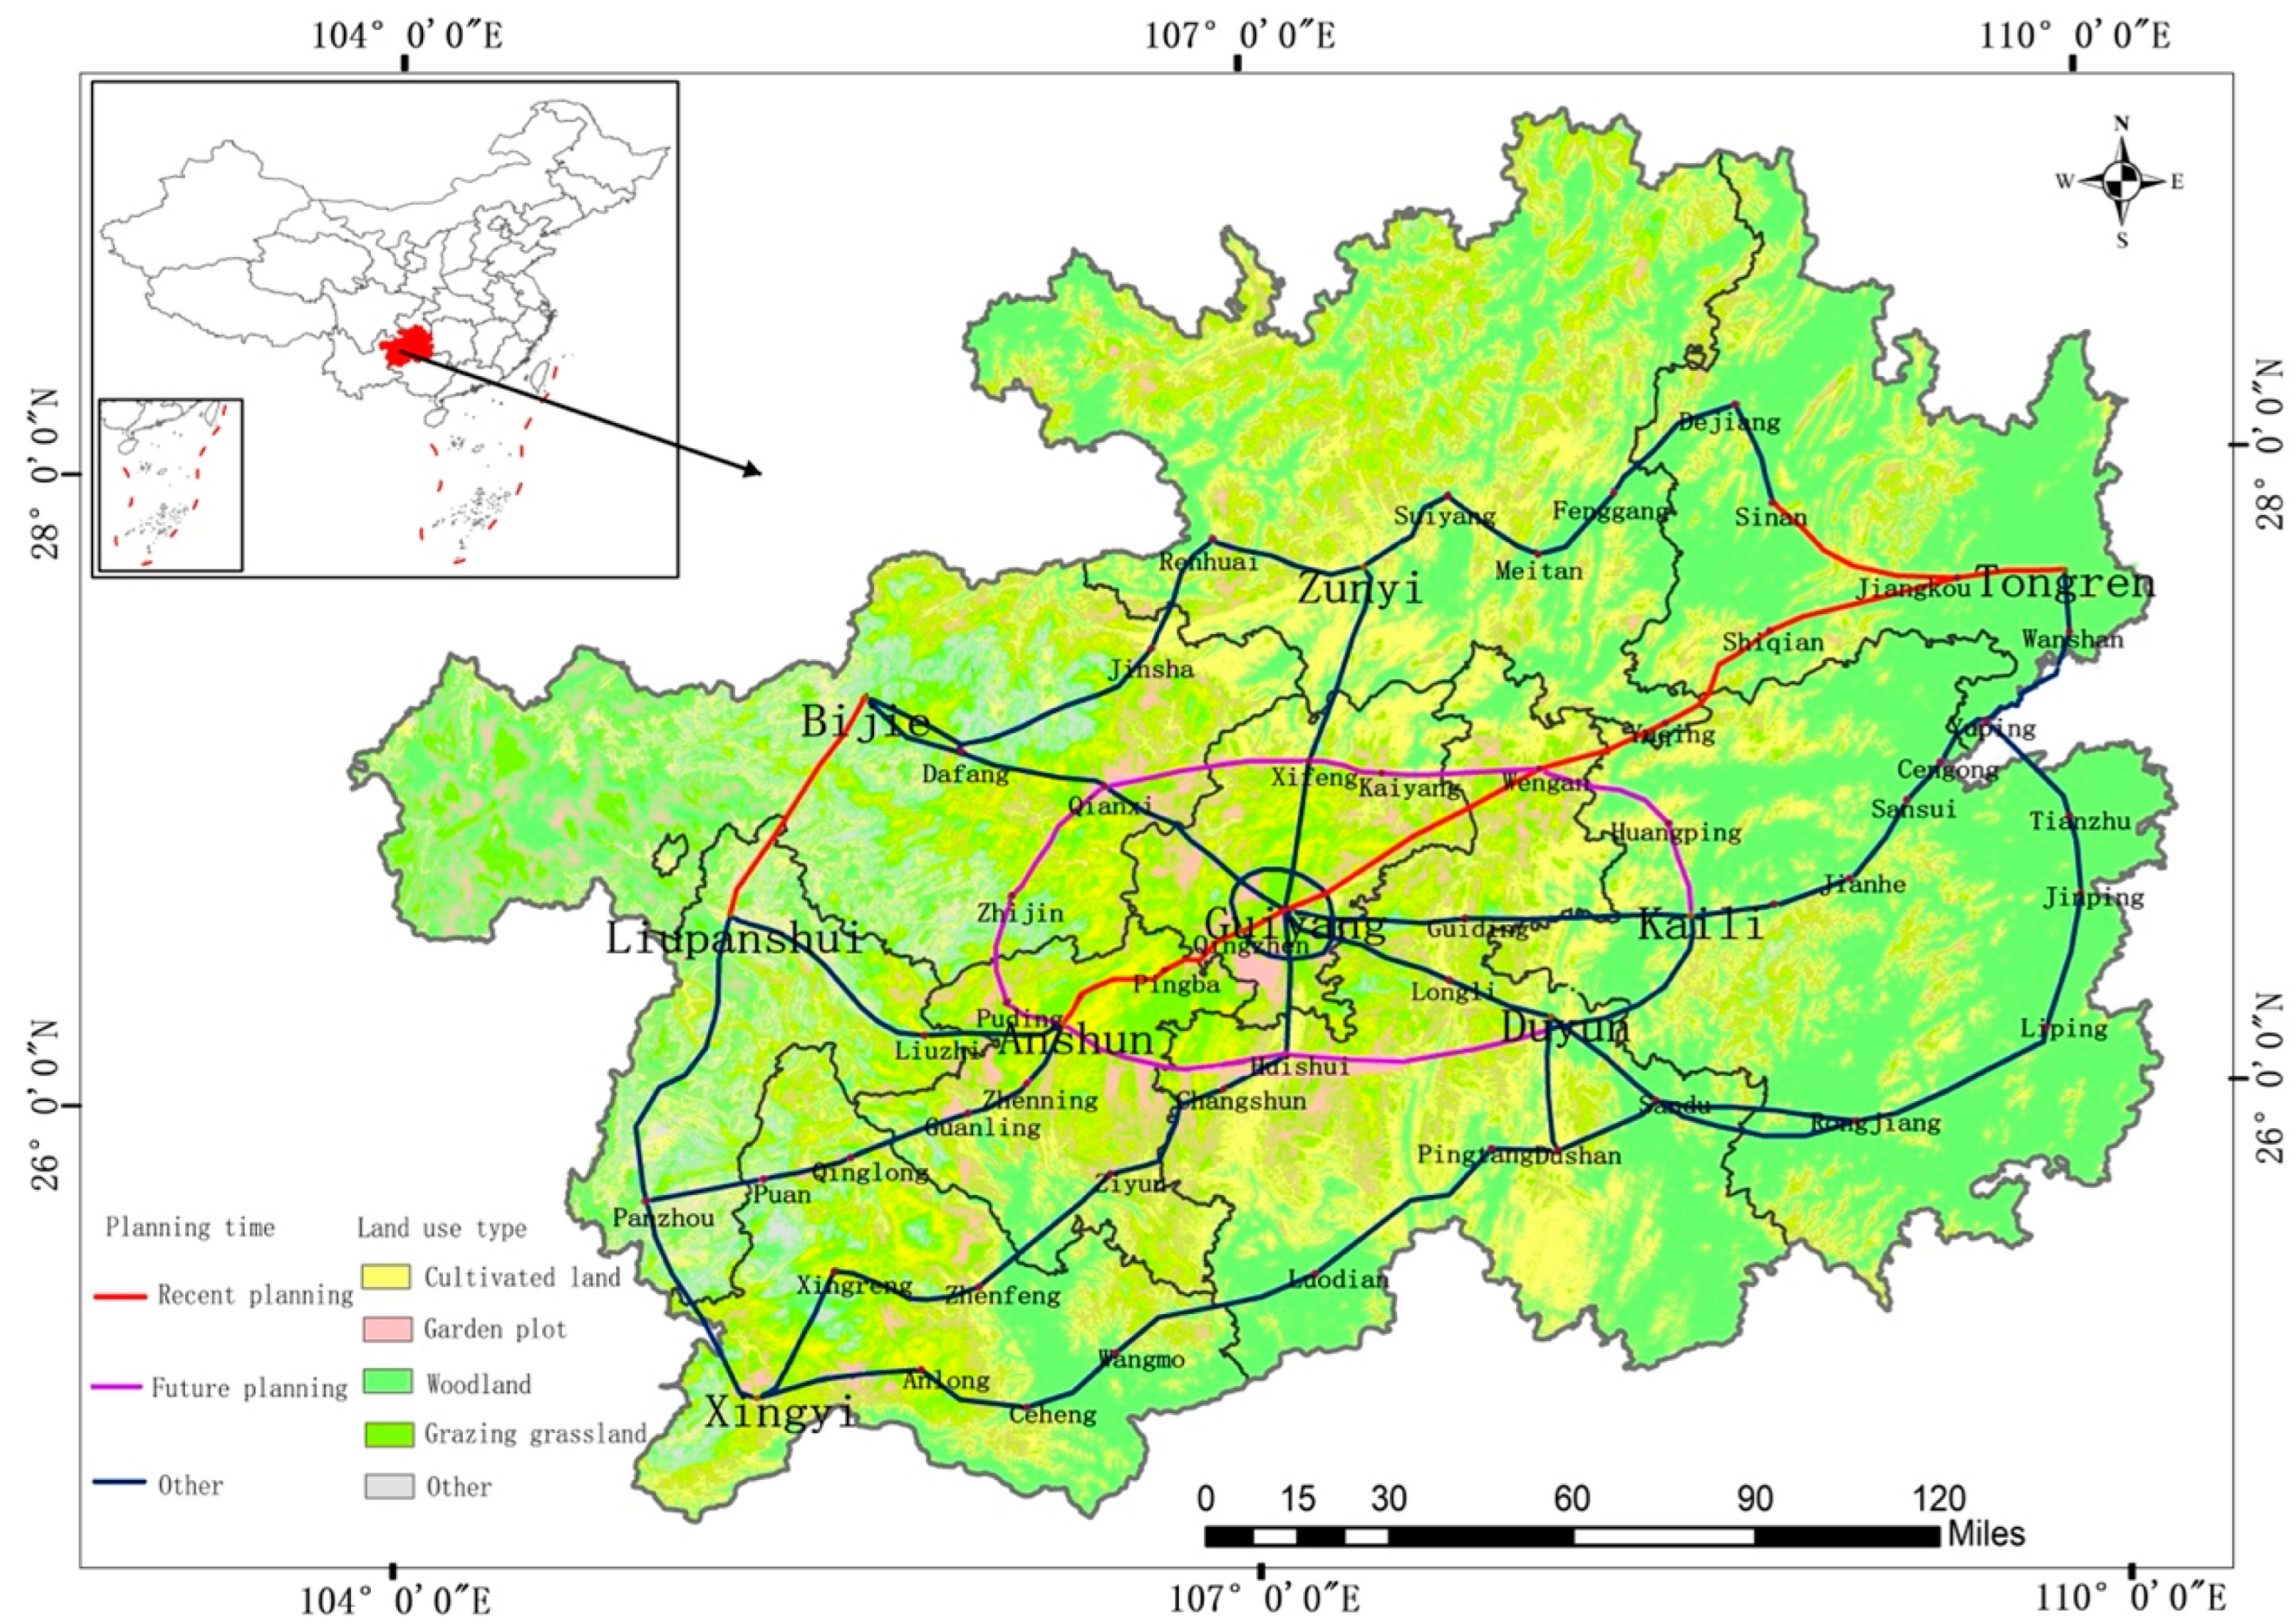
3.1.5. Sensitivity Analysis of Cultivated Land Resources

Guizhou Province has high mountains and steep slopes, rugged ground, great difficulty in land development and utilization, and insufficient cultivated land reserve resources. According to statistics, the length of the planned line of the intercity railway network crossing the cultivated land resource area is 222.6 km, accounting for 19.9% of the total planned mileage, of which short-term planning accounts for 8.6% and long-term planning accounts for 11.3%. In the recent planning, the length of the section of line L4 passing through the cultivated land resource area accounts for the largest proportion of the total length of the line, reaching 35.4%. In the long-term planning, the length of the section of line L6 passing through the cultivated land resource area accounts for the largest proportion of the total mileage of the line, reaching 23%, and it is mainly concentrated in the Zhijin Qianxi section and Weng’an Huangping section of line L6. According to Figure 7, the length of each planned line of the intercity railway network crossing the cultivated land resource area is counted, the cultivated land resource sensitivity index of each planned line is calculated by using Equation (5), and the cultivated land resource sensitivity level of each planned line is determined according to Table 3. The evaluation results are shown in Table 6.

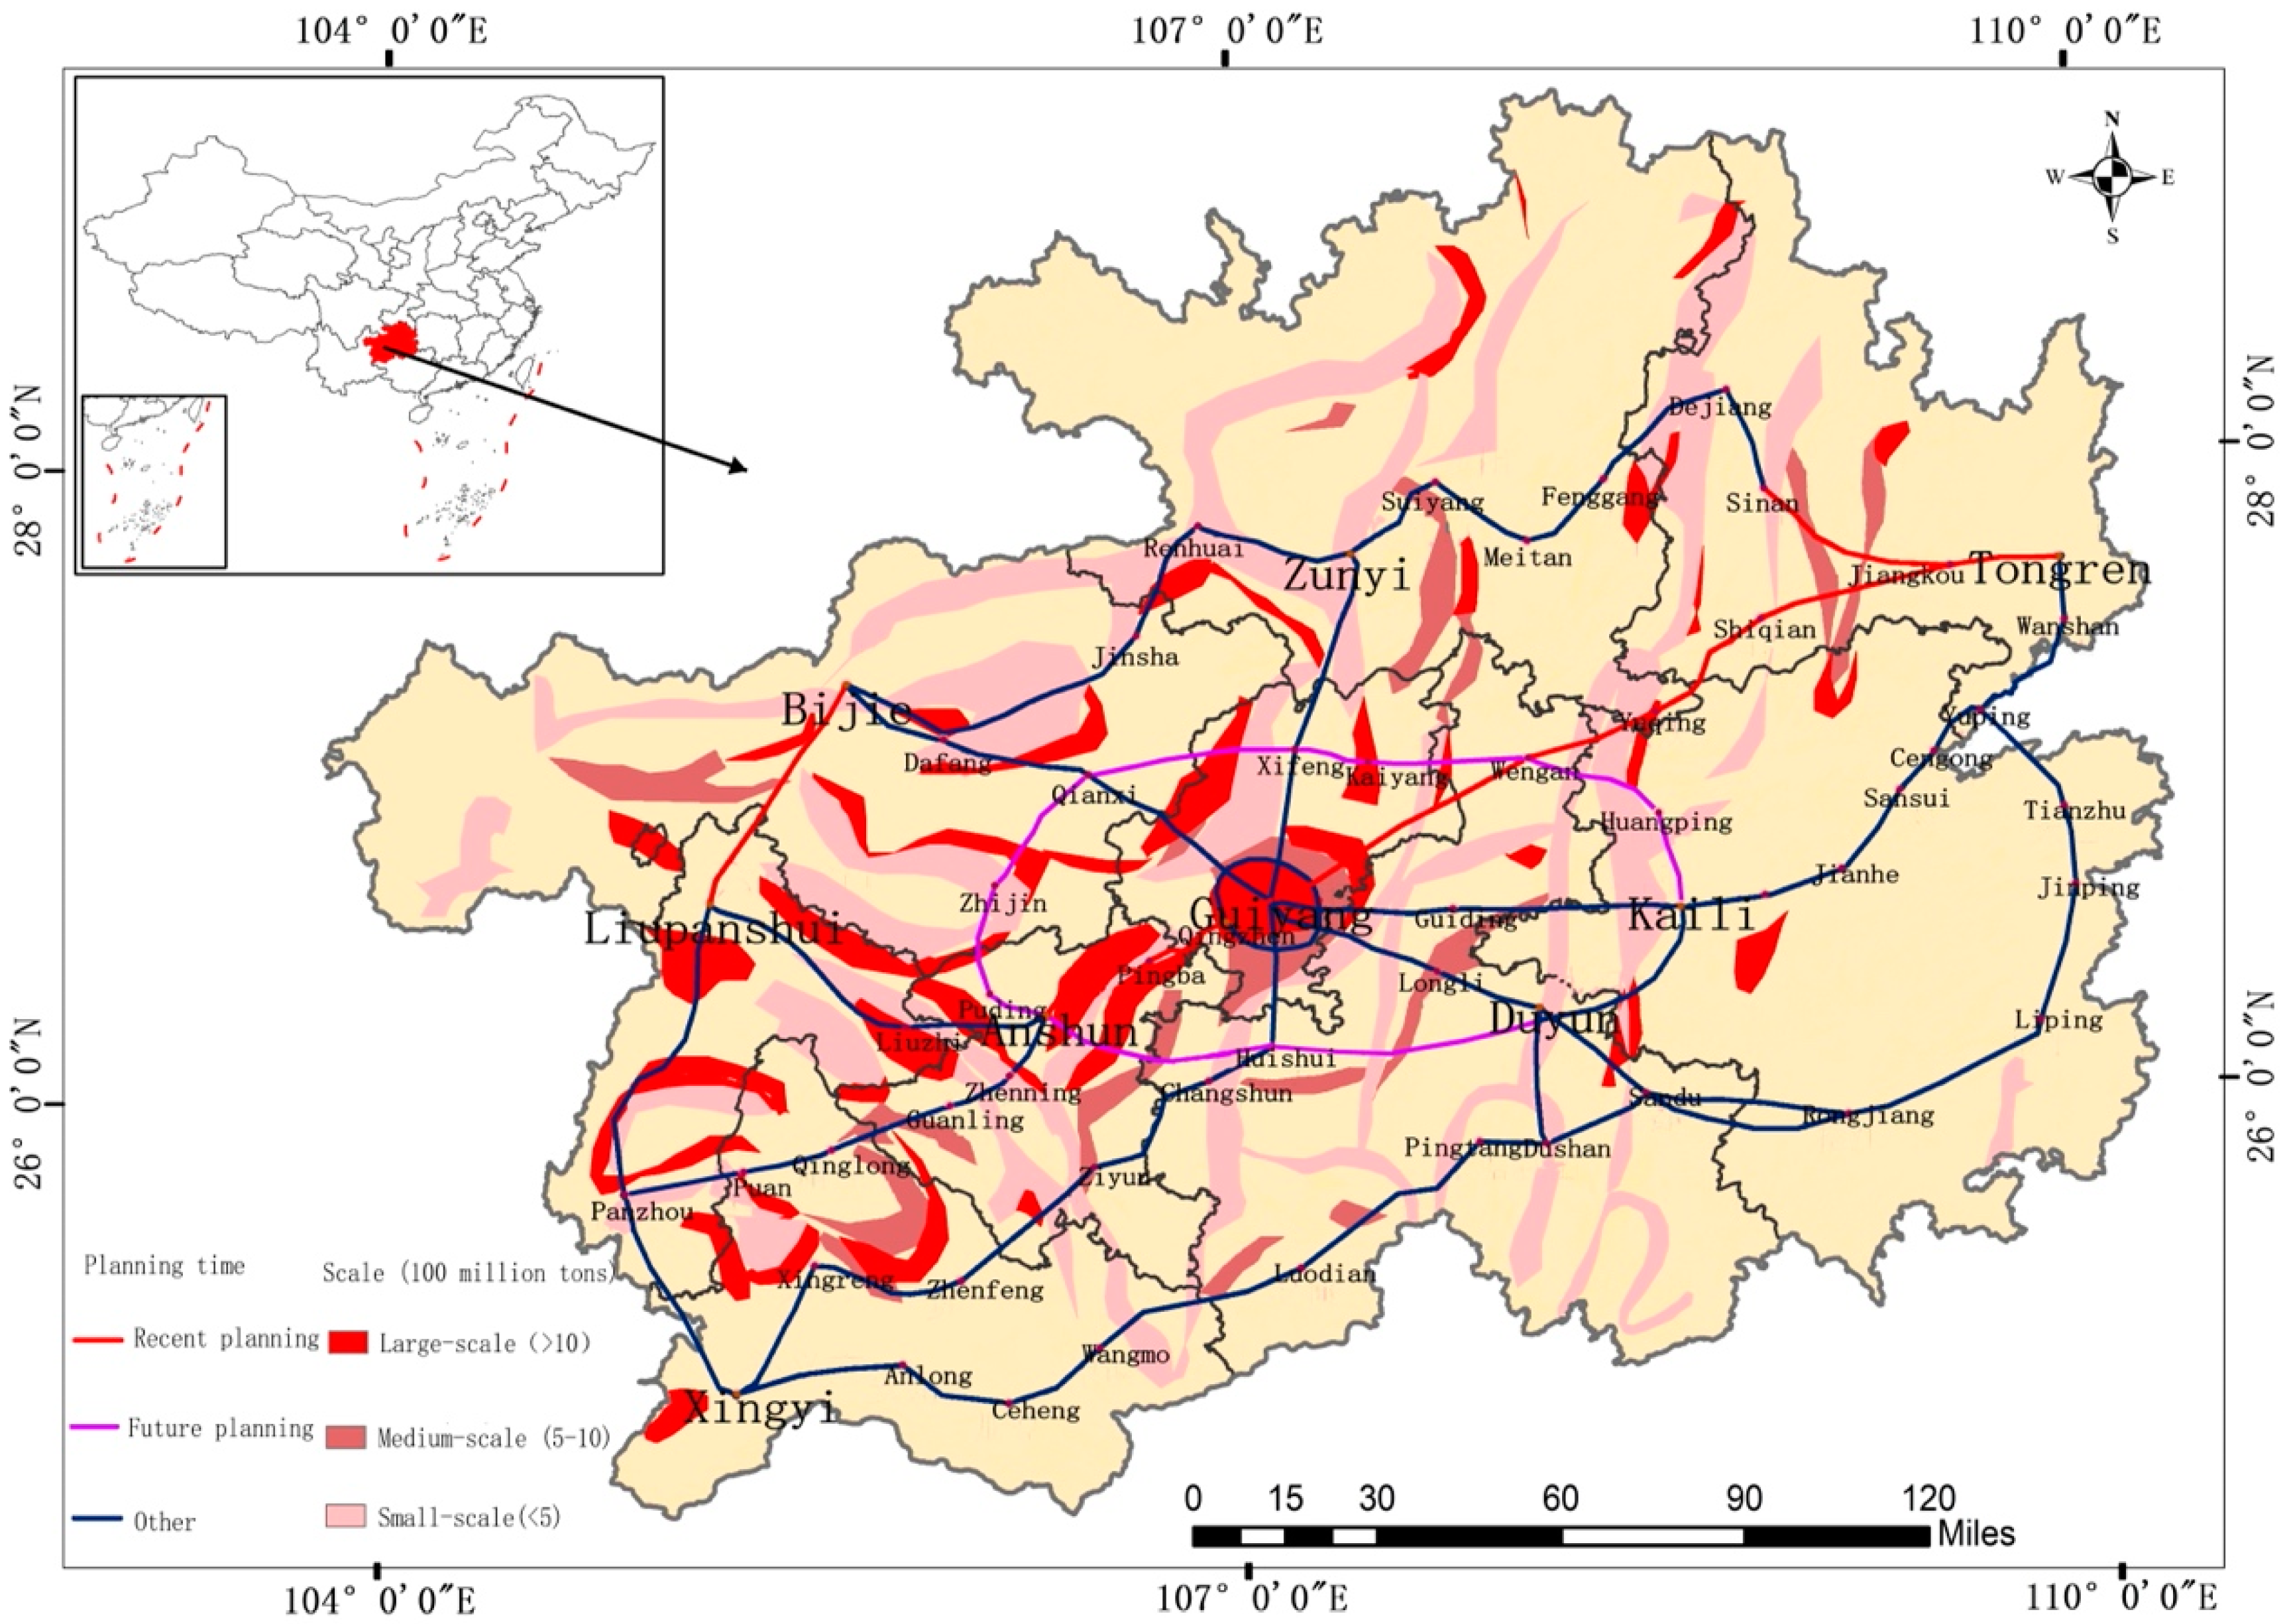
3.1.6. Sensitivity Analysis of Coal Resources

Guizhou Province is rich in mineral resources, of which coal resources have obvious advantages and occupy an important position in China. Considering the availability of data, the impact of the planned route on coal resources is emphatically analysed in mineral resources. According to statistics, the length of the planned line of the intercity railway network passing through the coal mining area is 343.6 km, accounting for 30.8% of the total planned mileage, of which it mainly passes through the small coal mining area, accounting for 16.5%. The length of the section where the line passes through the coal mining area in the near future is 165.7 km, accounting for 30.5% of the total mileage in the near future. It mainly passes through small coal mining areas and large coal mining areas, accounting for 13.5% and 10.1%, respectively. The L1 line accounts for the largest proportion in the recent planning, and the length of the section passing through a large coal mining area reaches 40.7% of the total mileage of the line. In the long-term planning, the length of the line passing through the coal mining area is 165.7 km, accounting for 31% of the total mileage in the long-term planning, most of which passes through small coal mining areas, accounting for 19.3%. Figure 8 counts the length of planned lines of the intercity railway network passing through coal mining areas, calculates the coal resource sensitivity index of planned lines by using Equation (6), and determines the coal resource sensitivity level of planned lines according to Table 3. The evaluation results are shown in Table 6.

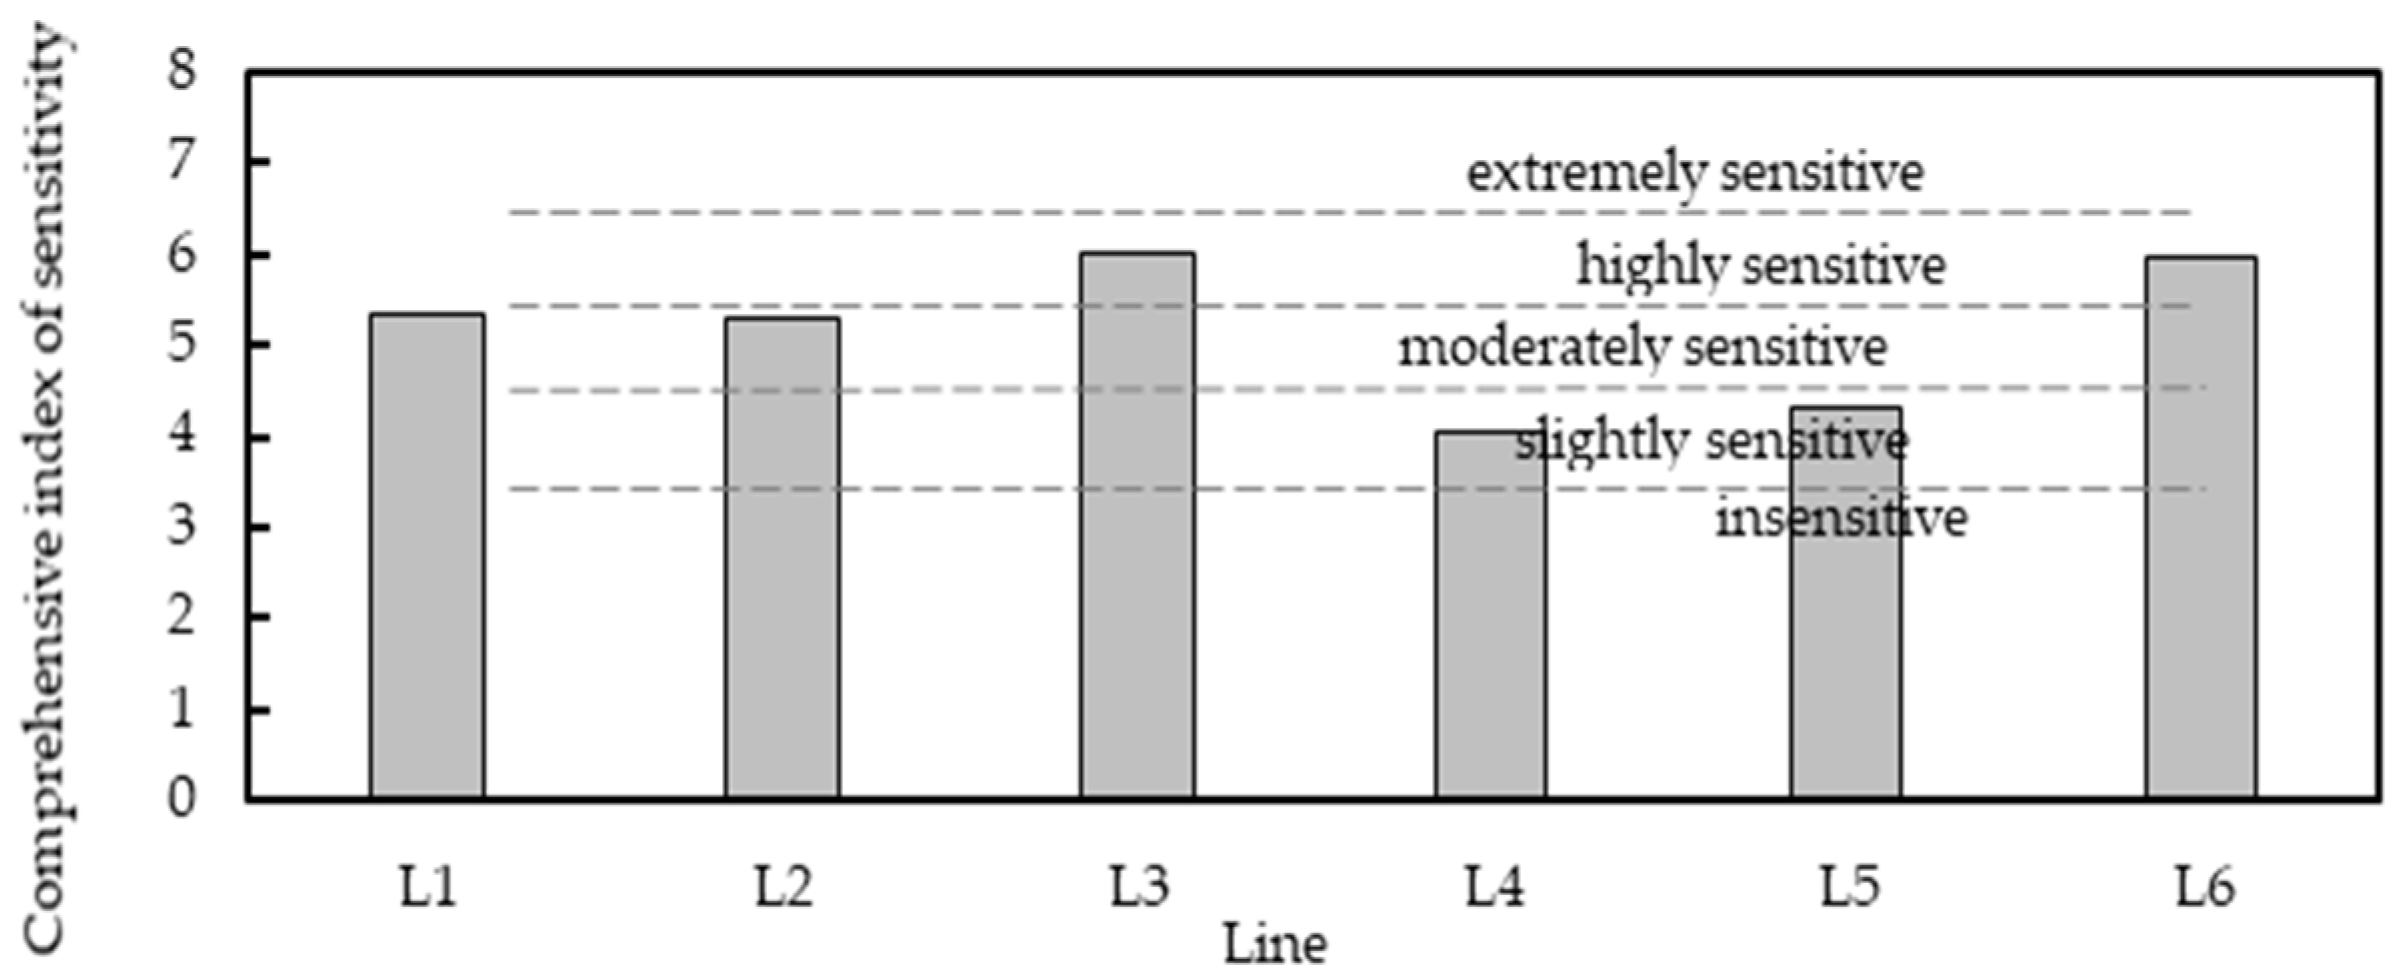
3.2. Comprehensive Analysis of Ecological Sensitivity

Based on the above research, the comprehensive ecological sensitivity index of each planned line is calculated according to Equation (7), and the ecological sensitivity level of each planned line is determined according to Table 3. The results are shown in Figure 9. In the short-term planning, the comprehensive index of ecological sensitivity of line L3 is the highest, reaching 5.99, which is at the highly sensitive level. Mainly because the whole line L3 is in the area with high susceptibility to geological disasters, the sensitivity level of geological disasters is extremely sensitive. In addition, soil erosion is the most serious in western and northwestern Guizhou Province. The section of line L3 passing through the severe erosion area reaches 81.5% of its total mileage, and the soil erosion sensitivity is extremely sensitive. In the long-term planning, the comprehensive index of ecological sensitivity of line L6 is the highest, reaching 5.97, second only to line L3, mainly because the number of water sources that may be involved in line L6 account for 66.7% of the total number of water sources in the long-term planning and 33.3% of the total number of water sources in all planned lines. At the same time, 50% of the water sources that may be involved in line L6 are crossed, 66.7% of the water sources have reached grade II, and their drinking water source sensitivity index is much higher than that of other planned lines. In addition, the number of protected areas that may be involved in line L6 accounts for 83% of the total number of protected areas in the long-term planning and 29.4% of the total number of protected areas in all planned lines. It is the line with the highest sensitivity index of protected areas in all planned lines.

4. Discussion

According to the calculation results of the ecological sensitivity of planned lines, the optimization and adjustment suggestions put forward in this study are as follows. (1) The sensitivity of coal resources is the short board factor of the L1 line. Therefore, it is recommended to optimize and adjust the line segment of the L1 line passing through large coal mining areas with reserves of more than 1 billion tons. (2) The sensitivity of the protected areas is the short board factor of line L2. Therefore, it is recommended to optimize and adjust the line segment of line L2 involving national grade protected areas. (3) The geological hazard sensitivity and the soil erosion sensitivity are the short board factors of line L3. Therefore, it is recommended to optimize and adjust the line segment of line L3 passing through the high incidence area of geological hazards and serious erosion area. (4) The sensitivity of the protected areas and the sensitivity of drinking water sources are the short board factors of line L4. Therefore, it is recommended to optimize and adjust the line segment of line L2 involving national grade protected areas and passing through grade II drinking water sources. (5) The ecological sensitivity grades of line L4 and line L5 are slightly sensitive, and the line location does not need to be adjusted.
Du [29] adopts qualitative analysis, and Qu [28] and Liang [30] adopt AHP to quantitatively evaluate the sensitivity of qualitative indicators. Compared with references [28,29,30], this paper establishes the quantitative measurement method of each evaluation factor based on the GIS overlay method and obtains the single factor sensitivity index. The weighted superposition model is selected to realize the comprehensive evaluation and quantitative analysis of the ecological sensitivity of each planned line. The evaluation method established in this paper can find the short board factors of the planned lines to put forwards targeted optimization and adjustment suggestions for the planning scheme, which is consistent with the initial hypothesis of this paper. However, the method established in this paper requires the evaluator to have a certain mathematical foundation. The calculation results of this paper show that the method established in this paper can accurately evaluate the ecological sensitivity of intercity railway network planning lines and can prevent the huge impact of railway network construction on the ecological environment of the study area. Therefore, this paper can provide a theoretical reference for accurately and scientifically discussing the ecological sensitivity of intercity railway network planning and the optimization and adjustment of intercity railway network planning and layout so as to promote the coordinated and sustainable development of intercity railway network planning and ecological protection. Due to the limitation of research time and data, there is no alternative for the case selected in this paper. Alternatives often exist in practical evaluations. The quantitative evaluation method of the ecological sensitivity of intercity railway networks constructed in this paper can also be used for multiple schemes comparison and selection. It can be discussed in depth in the next research.

5. Conclusions

Taking the intercity railway network planning of Guizhou Province as an example, its ecological sensitivity is predicted and evaluated. Six types of ecologically sensitive areas were selected as ecological sensitivity evaluation factors, including protected areas, drinking water sources, geological-disaster-prone areas, soil erosion areas, cultivated land resource distribution areas and coal resource distribution areas. Research shows the following:
(1)
The sensitivity grade of protected area of line L2 and line L6 is extremely sensitive; the sensitivity grade of drinking water source of line L6 is extremely sensitive; the geological hazard sensitivity grade and soil erosion sensitivity grade of line L3 are extremely sensitive; the sensitivity grade of coal resources of line L1 is extremely sensitive.
(2)
The comprehensive index of ecological sensitivity of line L3 is 5.99, which is the highest in recent planning. The comprehensive index of ecological sensitivity of line L6 is 5.97, which is the highest in the long-term planning.
(3)
The ecological sensitivity grades of line L1 and line L2 are moderately sensitive, and the line location needs to be adjusted. The ecological sensitivity grades of line L3 and line L6 are highly sensitive, and the line location needs to be adjusted. The ecological sensitivity grades of line L4 and line L5 are slightly sensitive, and the line location does not need to be adjusted.

Supplementary Materials

The following are available online at https://www.mdpi.com/article/10.3390/su14020804/s1, Table S1: Properties of the vector datasets in Figure 3, Table S2: Properties of the vector datasets in Figure 4, Table S3: Properties of the vector datasets in Figure 5, Table S4: Properties of the vector datasets in Figure 6, Table S5: Properties of the vector datasets in Figure 7, Table S6: Properties of the vector datasets in Figure 8.

Author Contributions

Methodology, B.W.; software, B.W.; validation, X.B. and J.Z.; formal analysis, B.W.; investigation, X.B.; resources, X.B.; data curation, B.W.; writing—original draft preparation, B.W.; writing—review and editing, B.W.; visualization, B.W.; supervision, X.B.; funding acquisition, X.B. All authors have read and agreed to the published version of the manuscript.

Funding

This research was funded by the National Natural Science Foundation of China, 51768034.

Institutional Review Board Statement

Not applicable.

Informed Consent Statement

Not applicable.

Data Availability Statement

Not applicable.

Conflicts of Interest

The authors declare no conflict of interest.

References

  1. Su, X.; Zhou, Y.; Li, Q. Designing Ecological Security Patterns Based on the Framework of Ecological Quality and Ecological Sensitivity: A Case Study of Jianghan Plain, China. Int. J. Environ. Res. Public Health 2021, 18, 8383. [Google Scholar] [CrossRef] [PubMed]
  2. Peng, H.J.; Hua, L.; Zhang, X.S.; Yuan, X.Y.; Li, J.H. Evaluation of ESV Change under Urban Expansion Based on Ecological Sensitivity: A Case Study of Three Gorges Reservoir Area in China. Sustainability 2021, 13, 8490. [Google Scholar] [CrossRef]
  3. Yilmaz, F.C.; Zengin, M.; Tekin Cure, C. Determination of ecologically sensitive areas in Denizli province using geographic information systems (GIS) and analytical hierarchy process (AHP). Environ. Monit. Assess. 2020, 192, 589. [Google Scholar] [CrossRef]
  4. Chen, X.W.; Li, X.M.; Eladawy, A.; Yu, T.; Sha, J.M. A multi-dimensional vulnerability assessment of Pingtan Island (China) and Nile Delta (Egypt) using ecological Sensitivity-Resilience-Pressure (SRP) model. Hum. Ecol. Risk Assess. 2021, 27, 1860–1882. [Google Scholar] [CrossRef]
  5. Duan, X.J.; Zou, H.; Wang, L.; Chen, W.X.; Min, M. Assessing ecological sensitivity and economic potentials and regulation zoning of the riverfront development along the Yangtze River, China. J. Clean. Prod. 2021, 291, 125963. [Google Scholar] [CrossRef]
  6. Shi, D.M.; Jiang, G.Y.; Peng, X.D.; Jin, H.F.; Jiang, N. Relationship between the periodicity of soil and water loss and erosion-sensitive periods based on temporal distributions of rainfall erosivity in the Three Gorges Reservoir Region, China. Catena 2021, 202, 105268. [Google Scholar] [CrossRef]
  7. Ouadja, A.; Benfetta, H.; Porto, P.; Flanagan, D.C.; Mihoubi, M.K.; Omeir, M.R.; Graia, M.; Ghosal, K.; Talchabhadel, R. Mapping potential soil erosion using RUSLE, Remote Sensing, and GIS: A case study in the watershed of Oued El Ardjem, Northwest Algeria. Arab. J. Geosci. 2021, 14, 1945. [Google Scholar] [CrossRef]
  8. Tian, P.; Zhu, Z.L.; Yue, Q.M.; He, Y.; Zhang, Z.Y.; Hao, F.H.; Guo, W.Z.; Chen, L.; Liu, M.X. Soil erosion assessment by RUSLE with improved P factor and its validation: Case study on mountainous and hilly areas of Hubei Province, China. Int. Soil Water Conse. 2021, 9, 433–444. [Google Scholar] [CrossRef]
  9. Kahal, A.Y.; Abdelrahman, K.; Alfaifi, H.J.; Yahya, M.M.A. Landslide hazard assessment of the Neom promising city, northwestern Saudi Arabia: An integrated approach. J. King Saud Univ. Sci. 2021, 33, 101279. [Google Scholar] [CrossRef]
  10. Zou, Q.; Jiang, H.; Cui, P.; Zhou, B.; Jiang, Y.; Qin, M.Y.; Liu, Y.G.; Li, C. A new approach to assess landslide susceptibility based on slope failure mechanisms. Catena 2021, 204, 105388. [Google Scholar] [CrossRef]
  11. Shah, S.T.; Ozacar, A.A.; Gulerce, Z. Fault-based probabilistic seismic hazard assessment of the eastern Makran subduction and the Chaman transform fault, Pakistan: Emphasis on the source characterization of megathrust. J. Asian Earth Sci. 2021, 205, 104604. [Google Scholar] [CrossRef]
  12. Ilesanmi, O.B.; Rogers, J.D.; Oboh-Ikuenobe, F.E. Evaluation of geohazards in the Cape Girardeau area using LiDAR and GIS, Southeast Missouri, USA. Environ. Earth Sci. 2021, 80, 581. [Google Scholar] [CrossRef]
  13. Liu, J.; Wu, Z.; Zhang, H.W. Analysis of Changes in Landslide Susceptibility according to Land Use over 38 Years in Lixian County, China. Sustainability 2021, 13, 10858. [Google Scholar] [CrossRef]
  14. Zong, S.S.; Hu, Y.C.; Zhang, Y.L.; Wang, W. Identification of land use conflicts in China’s coastal zones: From the perspective of ecological security. Ocean Coast. Manag. 2021, 213, 105841. [Google Scholar] [CrossRef]
  15. Terranova, D.; Balugani, E.; Righi, S.; Marazza, D. An applicability assessment and sensitivity analysis of land use impact models: Application of the LANCA model in site-specific conditions. Int. J. Life Cycle Assess. 2021, 26, 2215–2231. [Google Scholar] [CrossRef]
  16. Wang, C.S.; Long, R.Y.; Mao, G.X.; Cao, L.; Hsu, W.L. Spatiotemporal Sensitivity Characteristics of Water Resources in Huai River Ecological-Economic Belt, China. Sens. Mater. 2021, 33, 1473–1483. [Google Scholar] [CrossRef]
  17. Wang, Y.; Liu, X.; Zhang, C.; Liu, M.; Xing, Q. Assessing resource sensitivity to oil spill pollution in China’s coastal waters. Int. J. Environ. Sci. Technol. 2021, 1–8. [Google Scholar] [CrossRef]
  18. Nie, W.S.; Zaitchik, B.F.; Rodell, M.; Kumar, S.V.; Arsenault, K.R.; Badr, H.S. Irrigation Water Demand Sensitivity to Climate Variability Across the Contiguous United States. Water Resour. Res. 2021, 57, e2020WR027738. [Google Scholar] [CrossRef]
  19. Yang, H.; Zhai, G.; Zhang, Y. Ecological vulnerability assessment and spatial pattern optimization of resource-based cities: A case study of Huaibei City, China. Hum. Ecol. Risk Assess. 2020, 27, 606–625. [Google Scholar] [CrossRef]
  20. Zhang, Q.Q.; Zhang, T.Z. Land Consolidation Design Based on an Evaluation of Ecological Sensitivity. Sustainability 2018, 10, 3736. [Google Scholar] [CrossRef] [Green Version]
  21. Yang, X.D.; Bai, Y.P.; Che, L.; Qiao, F.W.; Xie, L.X. Incorporating ecological constraints into urban growth boundaries: A case study of ecologically fragile areas in the Upper Yellow River. Ecol. Indic. 2021, 124, 107436. [Google Scholar] [CrossRef]
  22. Li, Z.; He, F.; Wu, Q.J.; Tao, W. Analysis on sensitivity and landscape ecological spatial structure of site resources. J. Environ. Sci. 2003, 15, 215–221. [Google Scholar]
  23. Zeng, Y.; Zhou, Q.; Jiang, L.; Zhang, Y.; Zu, J.; Tan, W. Eco-environmental Sensitivity Analysis of Typical Power Grid Engineering on Tibetan Plateau Based on RS and GIS. China Environ. Sci. 2017, 37, 3096–3106. (In Chinese) [Google Scholar]
  24. Song, N.; Huang, J.; Li, B.; Wang, Q.; Ma, Y.; Huang, X. Comprehensive evaluation of the impact of artificial island airport reclamation construction on marine eco-environment. China Environ. Sci. 2020, 40, 3703–3712. (In Chinese) [Google Scholar]
  25. Demir, S.; Demirel, O.; Okatan, A. An ecological restoration assessment integrating multi-criteria decision analysis with landscape sensitivity analysis for a hydroelectric power plant project: The Tokat-Niksar case. Environ. Monit. Assess. 2021, 193, 818. [Google Scholar] [CrossRef]
  26. Kuang, X.; Wang, L.J.; Bai, M.Z.; Li, G. A Survey on the Eco-Environment Impact System of Railway Construction. In Proceedings of the International Conference on Informational Technology and Environmental System Science, Henan Polytechnic University, Jiaozuo, China, 15–17 May 2008; Publishing House Electronics Industry, Henan Polytechnic University: Jiaozuo, China, 2008; pp. 322–328. [Google Scholar]
  27. Mancebo Quintana, S.; Martin Ramos, B.; Casermeiro Martinez, M.A.; Otero Pastor, I. A model for assessing habitat fragmentation caused by new infrastructures in extensive territories—Evaluation of the impact of the Spanish strategic infrastructure and transport plan. J. Environ. Manag. 2010, 91, 1087–1096. [Google Scholar] [CrossRef] [PubMed]
  28. Qu, G.Y. Study on the Framework of Environmental Impact Assessment Method for Railway Network Planning. In Proceedings of the Annual Academic Meeting of the Chinese Society of Environmental Sciences, Beijing, China, 22–23 October 2014; pp. 3252–3259. (In Chinese). [Google Scholar]
  29. Du, P. Research on planning analysis in environmental impact assessment of intercity railway network planning. J. Railw. Eng. 2015, 32, 93–96, +108. (In Chinese) [Google Scholar]
  30. Liang, Z. Research on ecological risk assessment index system of railway planning and design. China Saf. Sci. J. 2018, 28 (Suppl. S1), 161–165. (In Chinese) [Google Scholar]
  31. Kong, B.; Cao, Z.; Sun, T.; Qi, C.; Zhang, Y. Safety hazards in coal mines of Guizhou China during 2011–2020. Saf. Sci. 2022, 145, 105493. [Google Scholar] [CrossRef]
  32. Qu, G.Y. Environmental Impact Assessment of Railway Network Planning: Methodology and Its Application. Ph.D. Dissertation, Harbin Institute of Technology, Harbin, China, October 2011. (In Chinese). [Google Scholar]
  33. Wang, L. Study on Ecological Environment Impact Assessment of Highway Network Planning Based on Strategic Environmental Assessment. Ph.D. Dissertation, Chang’an University, Xi’an, China, December 2009. (In Chinese). [Google Scholar]
  34. Jia, Q.; Zhessakov, A. Study on ecological evaluation of urban land based on GIS and RS technology. Arab. J. Geosci. 2021, 14, 261. [Google Scholar] [CrossRef]
  35. Guan, Z.M.; Li, J. In Ecological Sensitivity Analysis Based on GIS-Take Jiaozuo City for an Example. In Proceedings of the International Conference on Management (ICM), Jiujiang, China, 21–23 July 2013; pp. 1416–1422. [Google Scholar]
  36. Chi, Y.; Zhang, Z.W.; Gao, J.H.; Xie, Z.L.; Zhao, M.W.; Wang, E.K. Evaluating landscape ecological sensitivity of an estuarine island based on landscape pattern across temporal and spatial scales. Ecol. Indic. 2019, 101, 221–237. [Google Scholar] [CrossRef]
  37. Xu, S.B.; Xu, D.S.; Liu, L.L. Construction of regional informatization ecological environment based on the entropy weight modified AHP hierarchy model. Sustain. Comput. Inform. Syst. 2019, 22, 26–31. [Google Scholar] [CrossRef]
  38. Han, B.L.; Liu, H.X.; Wang, R.S. Urban ecological security assessment for cities in the Beijing-Tianjin-Hebei metropolitan region based on fuzzy and entropy methods. Ecol. Modell. 2015, 318, 217–225. [Google Scholar] [CrossRef]
  39. Sun, L.Y.; Miao, C.L.; Yang, L. Ecological-economic efficiency evaluation of green technology innovation in strategic emerging industries based on entropy weighted TOPSIS method. Ecol. Indic. 2017, 73, 554–558. [Google Scholar] [CrossRef]
  40. Hu, X.J.; Ma, C.M.; Huang, P.; Guo, X. Ecological vulnerability assessment based on AHP-PSR method and analysis of its single parameter sensitivity and spatial autocorrelation for ecological protection? A case of Weifang City, China. Ecol. Indic. 2021, 125, 107464. [Google Scholar] [CrossRef]
  41. Tao, Y.J.; Lee, H.S.; Tu, C.S. Analytic Hierarchy Process-Based Airport Ground Handling Equipment Purchase Decision Model. Sustainability 2021, 13, 2540. [Google Scholar] [CrossRef]
Figure 1. Planning layout of the intercity railway network in Guizhou Province.
Sustainability 14 00804 g001
Figure 2. Data processing based on GIS: (a) Data processing of target-sensitive points based on GIS; (b) Data processing of target-sensitive areas based on GIS.
Sustainability 14 00804 g002
Figure 3. Sensitivity analysis diagram of the protected area.
Sustainability 14 00804 g003
Figure 4. Sensitivity analysis diagram of drinking water source.
Sustainability 14 00804 g004
Figure 5. Sensitivity analysis diagram of geological hazard.
Sustainability 14 00804 g005
Figure 6. Sensitivity analysis diagram of soil erosion.
Sustainability 14 00804 g006
Figure 7. Sensitivity analysis diagram of cultivated land resources.
Sustainability 14 00804 g007
Figure 8. Sensitivity analysis diagram of coal resources.
Sustainability 14 00804 g008
Figure 9. Comprehensive index of ecological sensitivity of each planned line.
Sustainability 14 00804 g009
Table 1. Evaluation indicators mentioned in the relevant literature.
TypeQuantitative IndicatorQualitative Indicator
ContentThe selection of evaluation indicators focuses on the impact on the ecological environment during railway construction, which is the reactivity evaluation indicator of ecological impact.It cannot be quantified directly, but it needs to be quantified in other ways.
CharacteristicPassivity ComplexitySubjectivity Fuzziness
DeficienciesIt cannot guide railway line design, and therefore, it cannot prevent ecological damage in the planning stage. There are few data in the planning stage and this makes it difficult to collect data.The ecological sensitivity of the railway network cannot be accurately measured.
Literature[26,27][28,29,30]
Table 2. Proposal for phased implementation of planned new projects of intercity networks in Guizhou Province.
Planning TimePlanning LineMileage (km)Layout
Recent planning (2021–2030)L1 (Guiyang-Anshun)81Third ray
L2 (Guiyang-Wengan-Yuqing-Shiqian-Jiangkou-Tongren)283Eighth ray
L3 (Bijie-Liupanshui)100Third ring
L4 (Sinan-Jiangkou)80Third ring
Future planning (after 2030)L5 (Duyun-Huishui-Anshun)190Second ring
L6 (Anshun-Puding-Zhijin-Qianxi-Xifeng-Kaiyang-Wengan-Huangping-Kaili)384Second ring
Total1118-
Table 3. Ecological sensitivity evaluation index and classification standard.
IndexSensitivity LevelWeight
InsensitiveSlightly SensitiveModerately SensitiveHighly SensitiveExtremely Sensitive
The protected areas sensitivity index<3[3,9)[9,15)[15,21)≥210.163
The drinking water source sensitivity index<0.9[0.9,1.8)[1.8,2.7)[2.7,3.6)≥3.60.161
The geological hazard sensitivity index<20%[20%,30%)[30%,40%)[40%,50%)≥50%0.173
The soil erosion sensitivity index<5%[5%,15%)[15%,25%)[25%,35%)≥35%0.164
The cultivated land resource sensitivity index<0.3[0.3,0.6)[0.6,0.9)[0.9,1.2)≥1.20.174
The coal resource sensitivity index<0.3[0.3,0.9)[0.9,1.5)[1.5,2.1)≥2.10.165
Table 4. Classification standard of the comprehensive index of ecological sensitivity.
Sensitivity LevelLevel AssignmentGrading Standard
Insensitive1<3.5
Slightly sensitive3[3.5,4.5)
Moderately sensitive5[4.5,5.5)
Highly sensitive7[5.5,6.5)
Extremely sensitive9≥6.5
Table 5. Distribution of protected areas within swing range.
Type of Protected AreaNumber of Protected AreasNumber of Protected Areas (Level)Planning Time
scenic spots32 (national level), 1 (provincial level)2021–2030
21 (national level), 1 (provincial level)After 2030
nature reserves11 (provincial level)2021–2030
11 (national level)After 2030
forest parks42 (national level), 2 (provincial level)2021–2030
22 (national level)After 2030
geoparks11 (national level)2021–2030
11 (national level)After 2030
wetland parks22 (national level)2021–2030
After 2030
Table 6. Single factor sensitivity grade of planned lines of intercity railway network.
LineProtected Area SensitivityDrinking Water Source SensitivityGeological Hazard SensitivitySoil Erosion SensitivityCultivated Land SensitivityCoal Resource Sensitivity
IndexGradeIndexGradeIndexGradeIndexGradeIndexGradeIndexGrade
L18slightly sensitive1.5slightly sensitive30%moderately sensitive24%moderately sensitive0.91highly sensitive2.30extremely sensitive
L221extremely sensitive3.2highly sensitive36%moderately sensitive15%moderately sensitive0.33slightly sensitive0.74slightly sensitive
L318highly sensitive2.7highly sensitive50%extremely sensitive35%extremely sensitive0.37slightly sensitive0.22insensitive
L40insensitive1slightly sensitive46%highly sensitive14%slightly sensitive1.06highly sensitive0.53slightly sensitive
L55slightly sensitive2.6moderately sensitive23%slightly sensitive21%moderately sensitive0.60moderately sensitive1.20moderately sensitive
L623extremely sensitive6extremely sensitive34%moderately sensitive23%moderately sensitive0.69moderately sensitive0.45slightly sensitive
Table 7. Drinking water sources in the planning area of the intercity railway network.
Type QuantityName of Water Source (Water Quality Grade; Location Relationship)
River11Herringbone weir (II; 0.4 km), Yanmenkou (III; crossing), Lusiyan (III; crossing), Changkou Longtan (II; crossing), Hezhang Yangdong River (III; crossing), Hexi water plant (III; crossing), Monkey ditch (III; crossing), Xiaoxibao (III; crossing), gold-fish pond (II; 0.4 km), Heshanxi (III; crossing), Nanjiaoxi (II; crossing)
Lake and Reservoir7Hongfeng Lake (II; crossing), Yunjin water plant (II; 0.9 km), Xiangchunshu reservoir (III; 0.8 km), Gezhai reservoir (III; 0.4 km), Yelang Lake (II; crossing), Fukuo reservoir (II; 0.3 km), Wengjing reservoir (III; 0.7 km)
Publisher’s Note: MDPI stays neutral with regard to jurisdictional claims in published maps and institutional affiliations.

