
Remote Sensing Monitoring and Driving Force Analysis of Salinized Soil in Grassland Mining Area

Abstract
:1. Introduction
2. Materials and Methods
2.1. Overview of the Study Area
2.2. Data Source and Remote Sensing Image Preprocessing
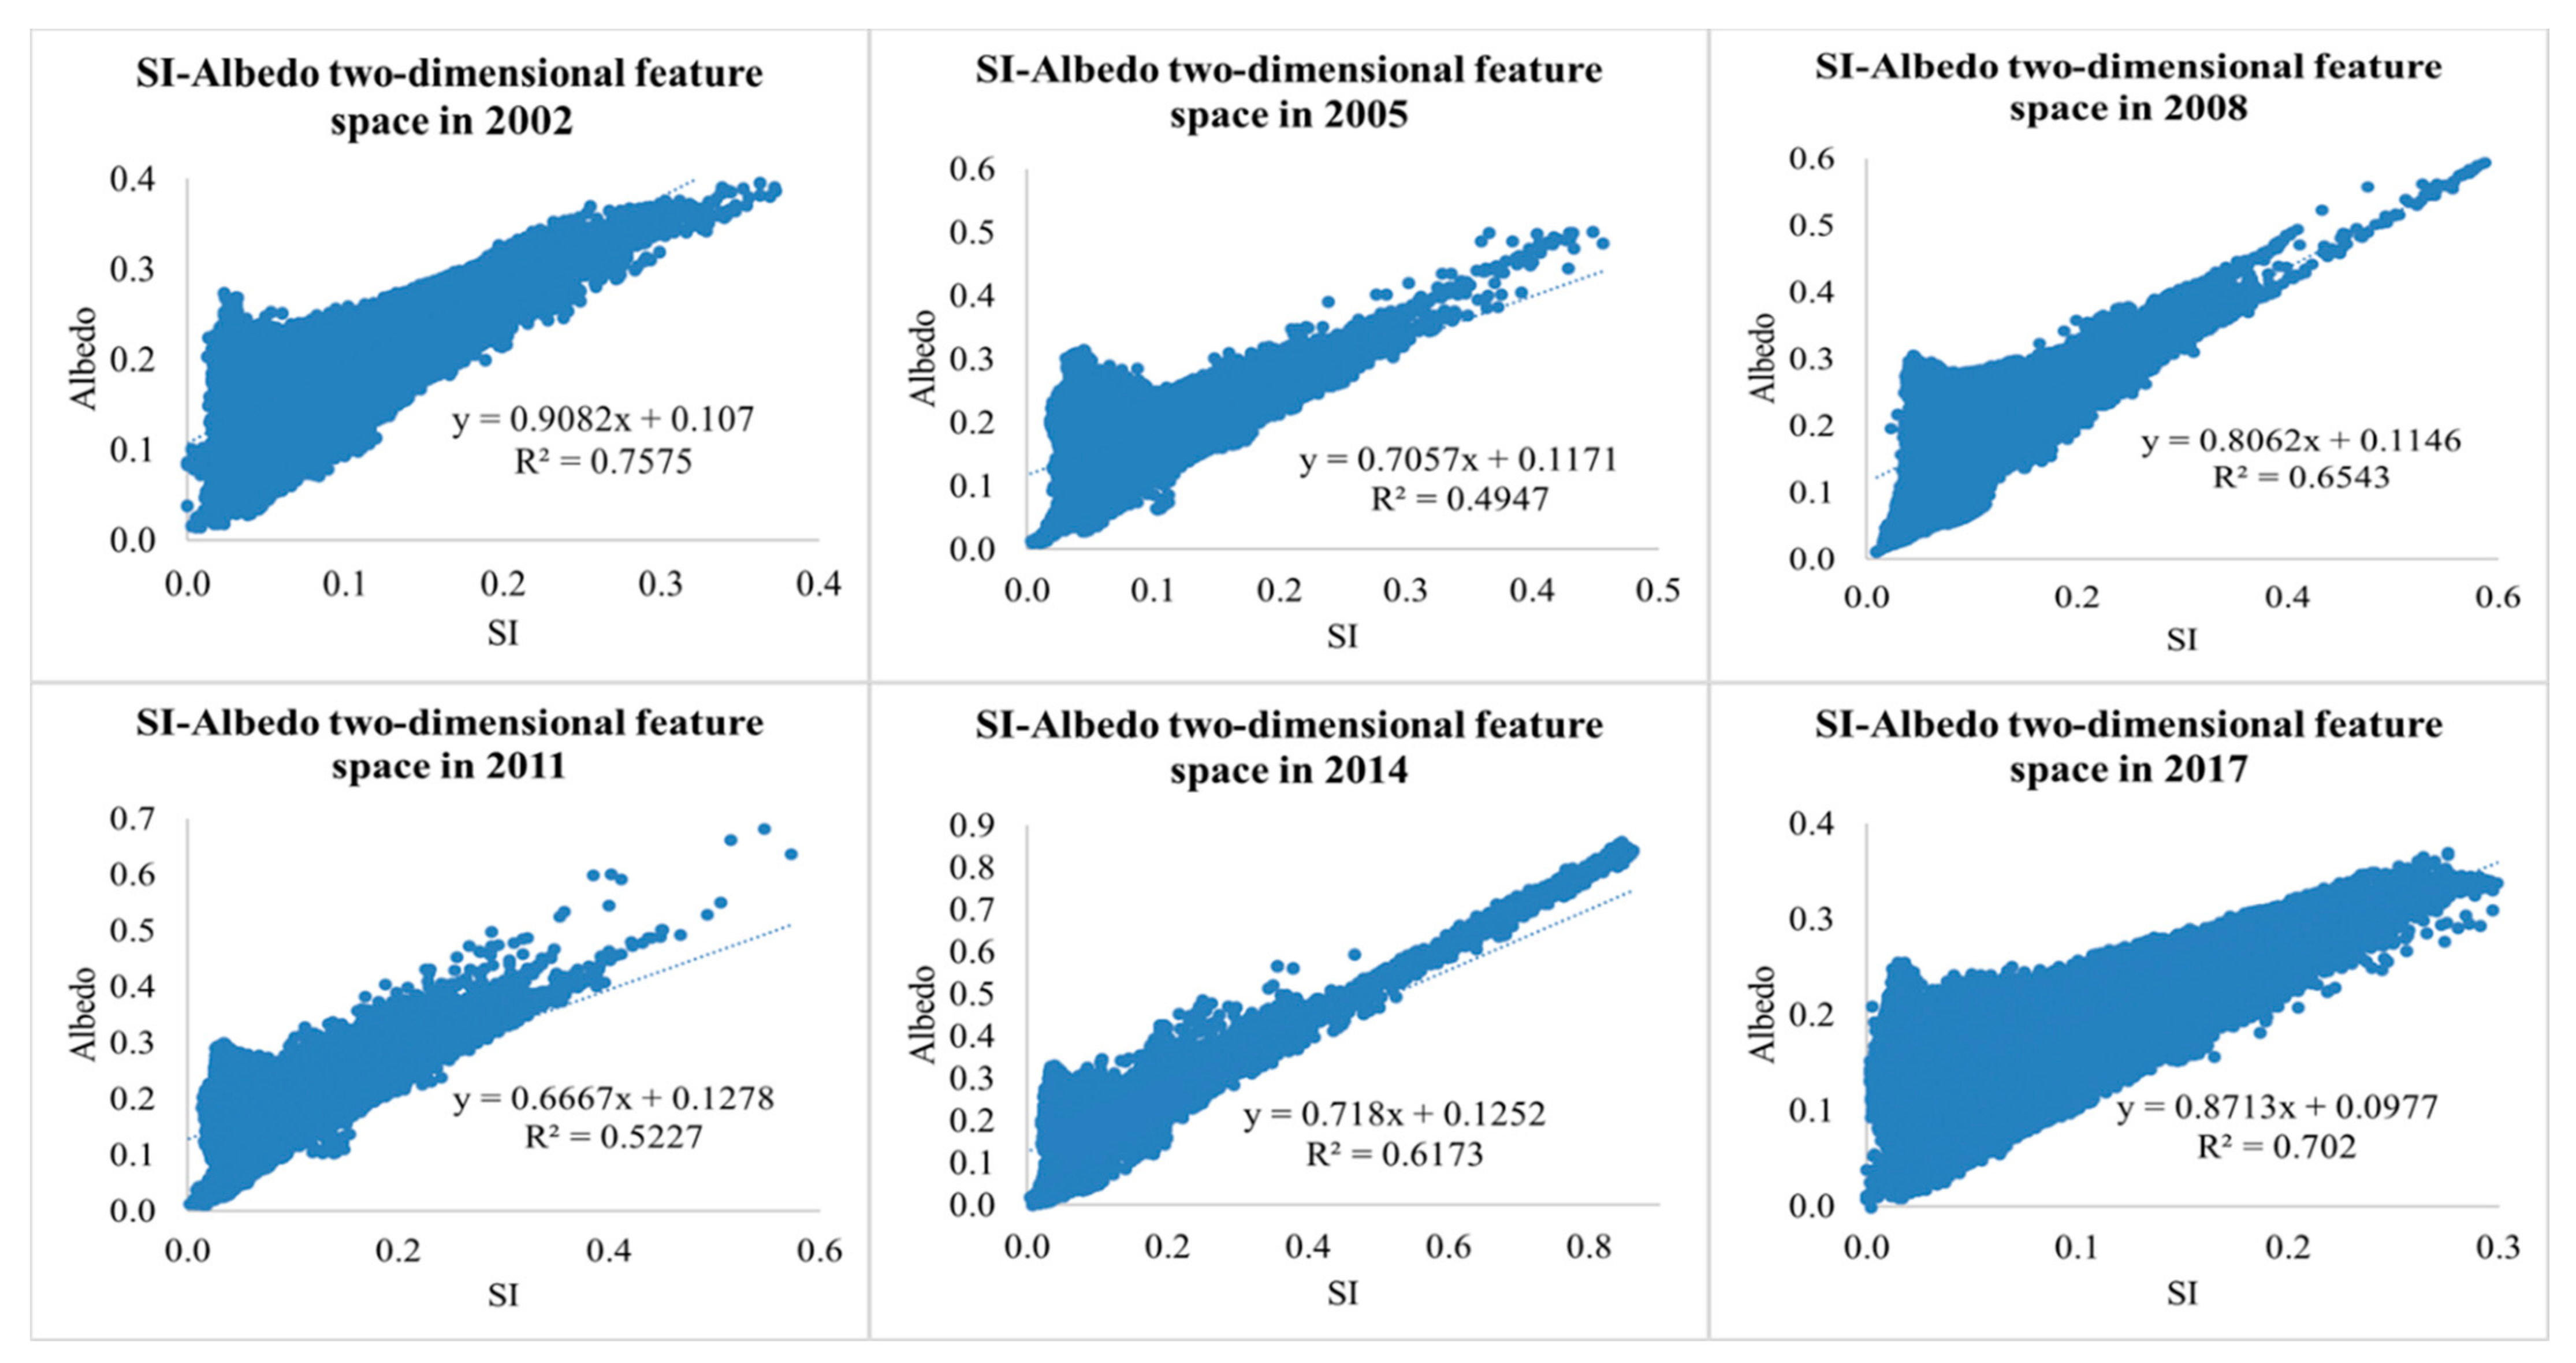
2.3. Construction of SI-Albedo Feature Space
2.4. Model Applicability Verification and Salinization Classification
2.5. Comparative Analysis of Salinization Changes
2.6. Logistic Regression Model
2.6.1. Model and Method
2.6.2. Selection and Treatment of Variables
- (1)
- Dependent variable
- (2)
- Independent variable
2.6.3. Sampling Process
2.6.4. Collinearity Diagnosis of Independent Variables
2.6.5. Model Checking
3. Results and Discussion
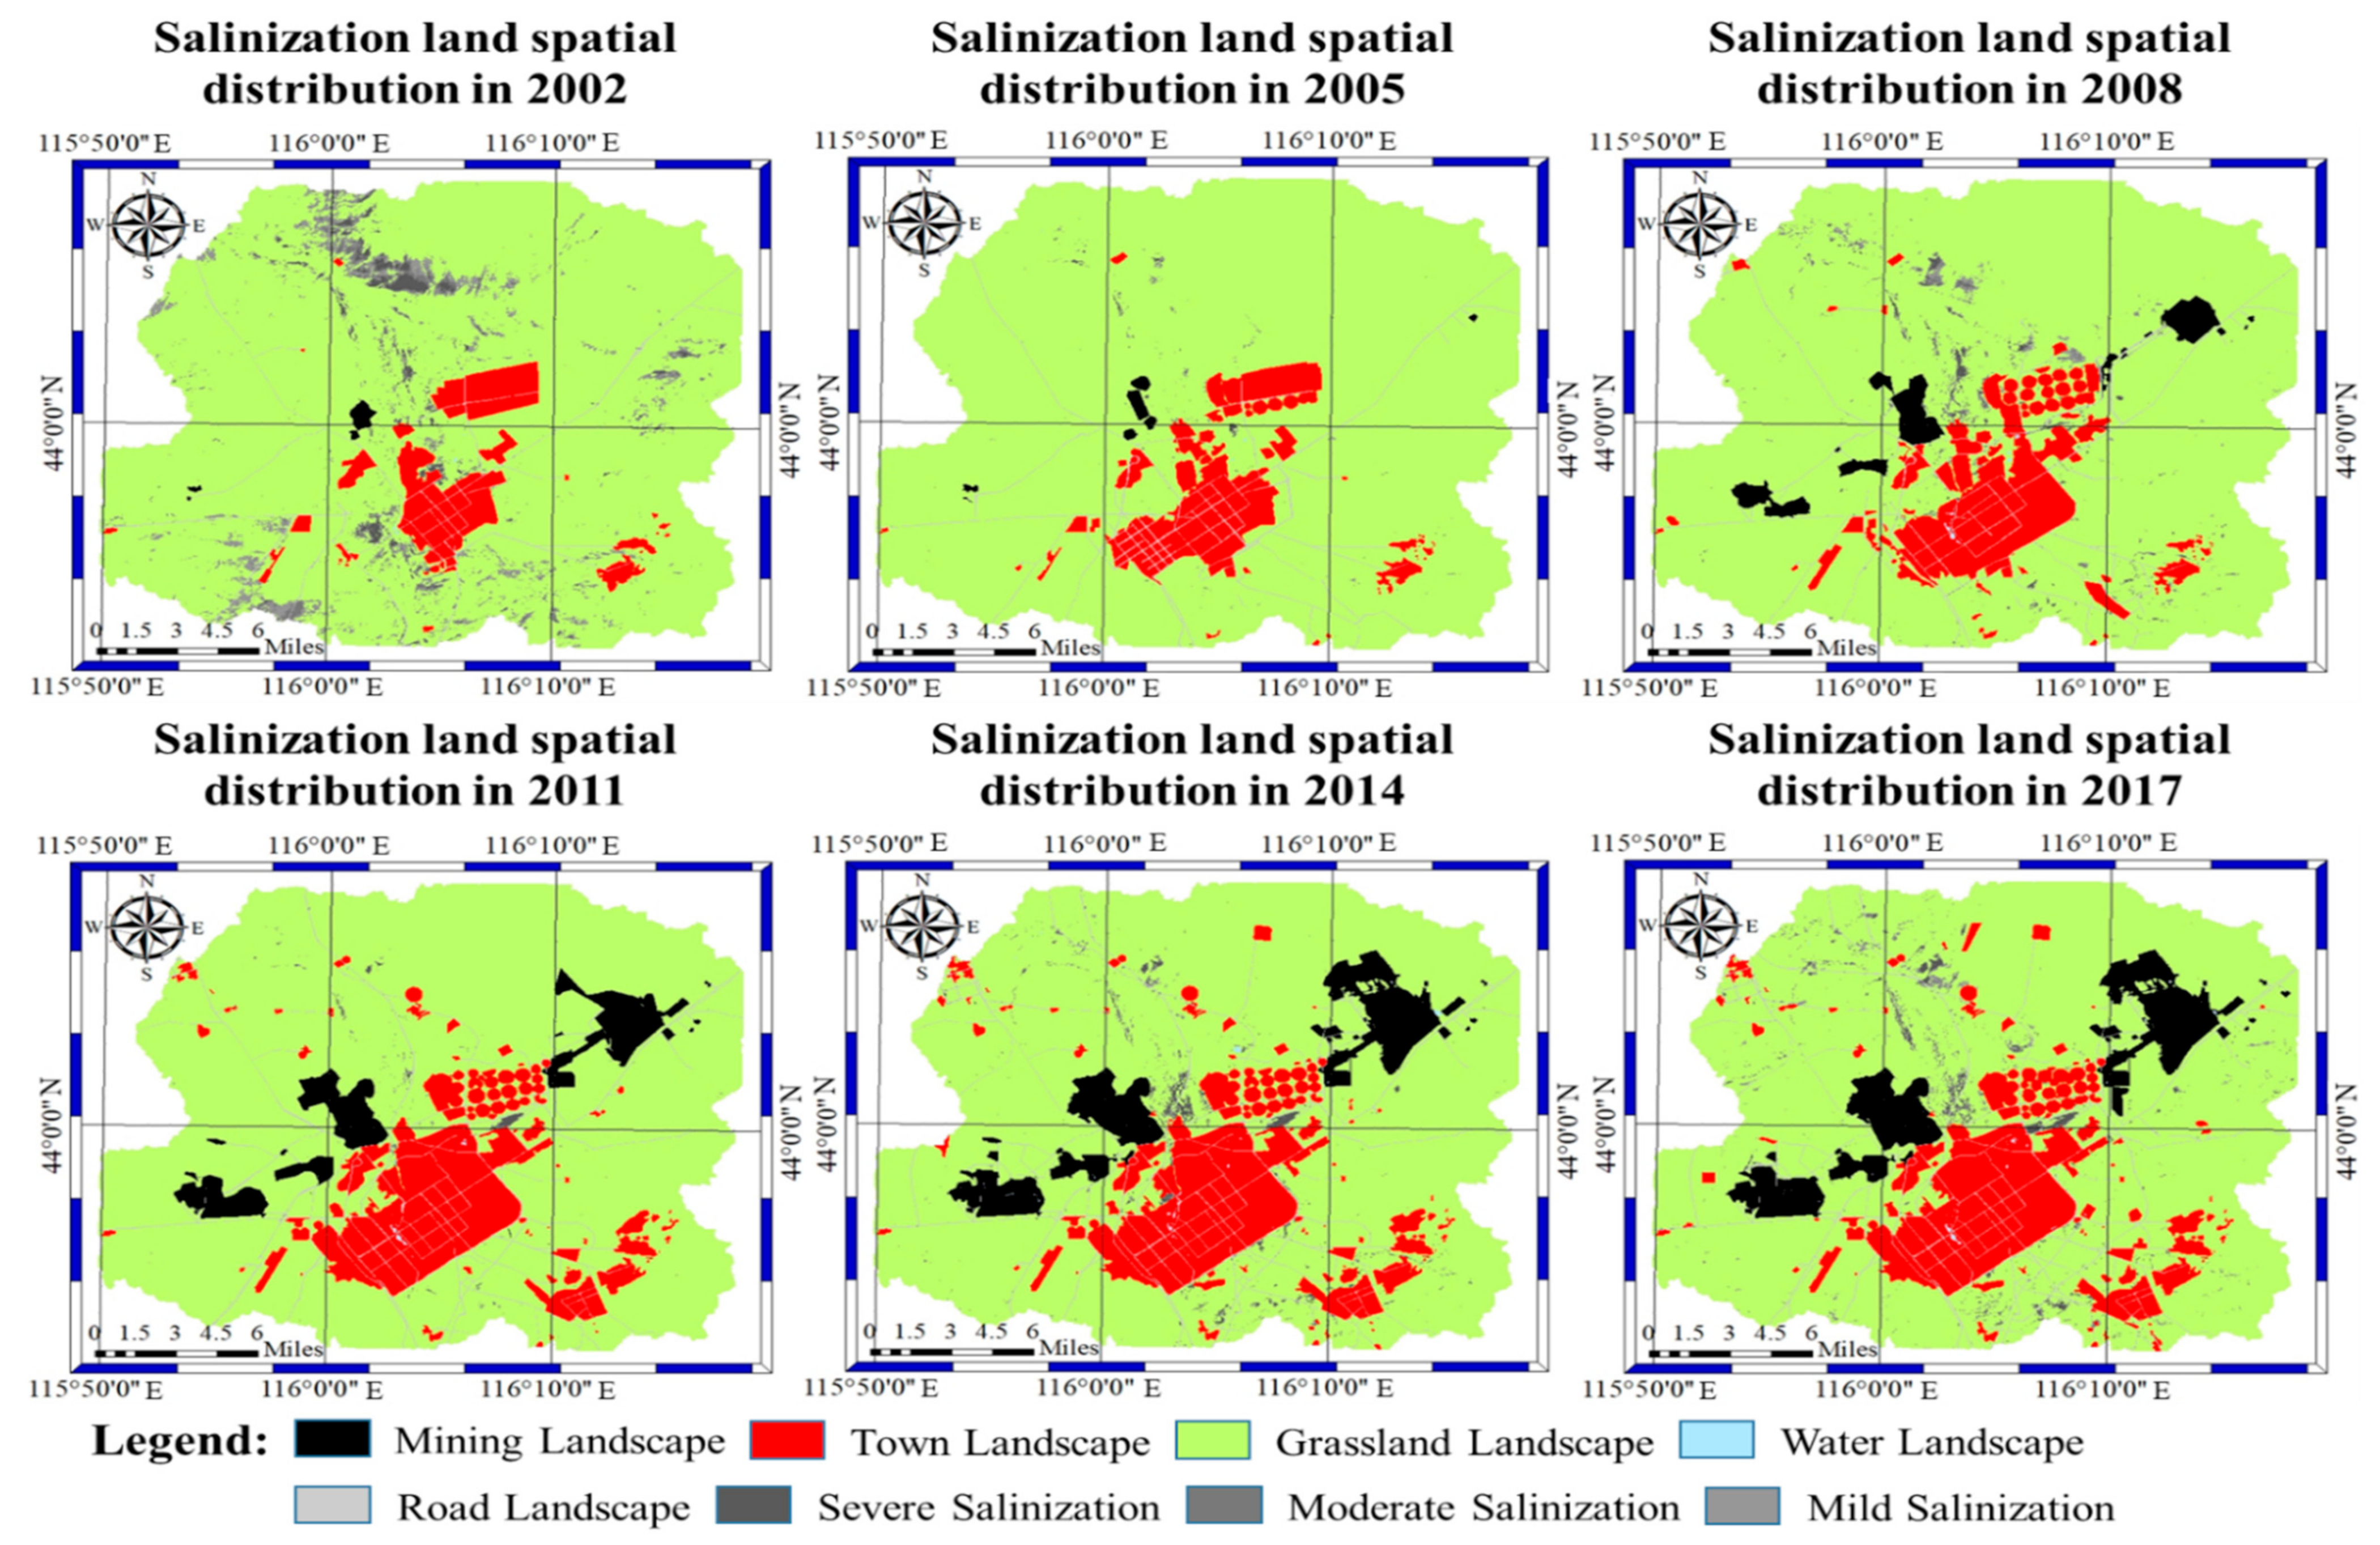
3.1. Spatial and Temporal Variation of Soil Salinization
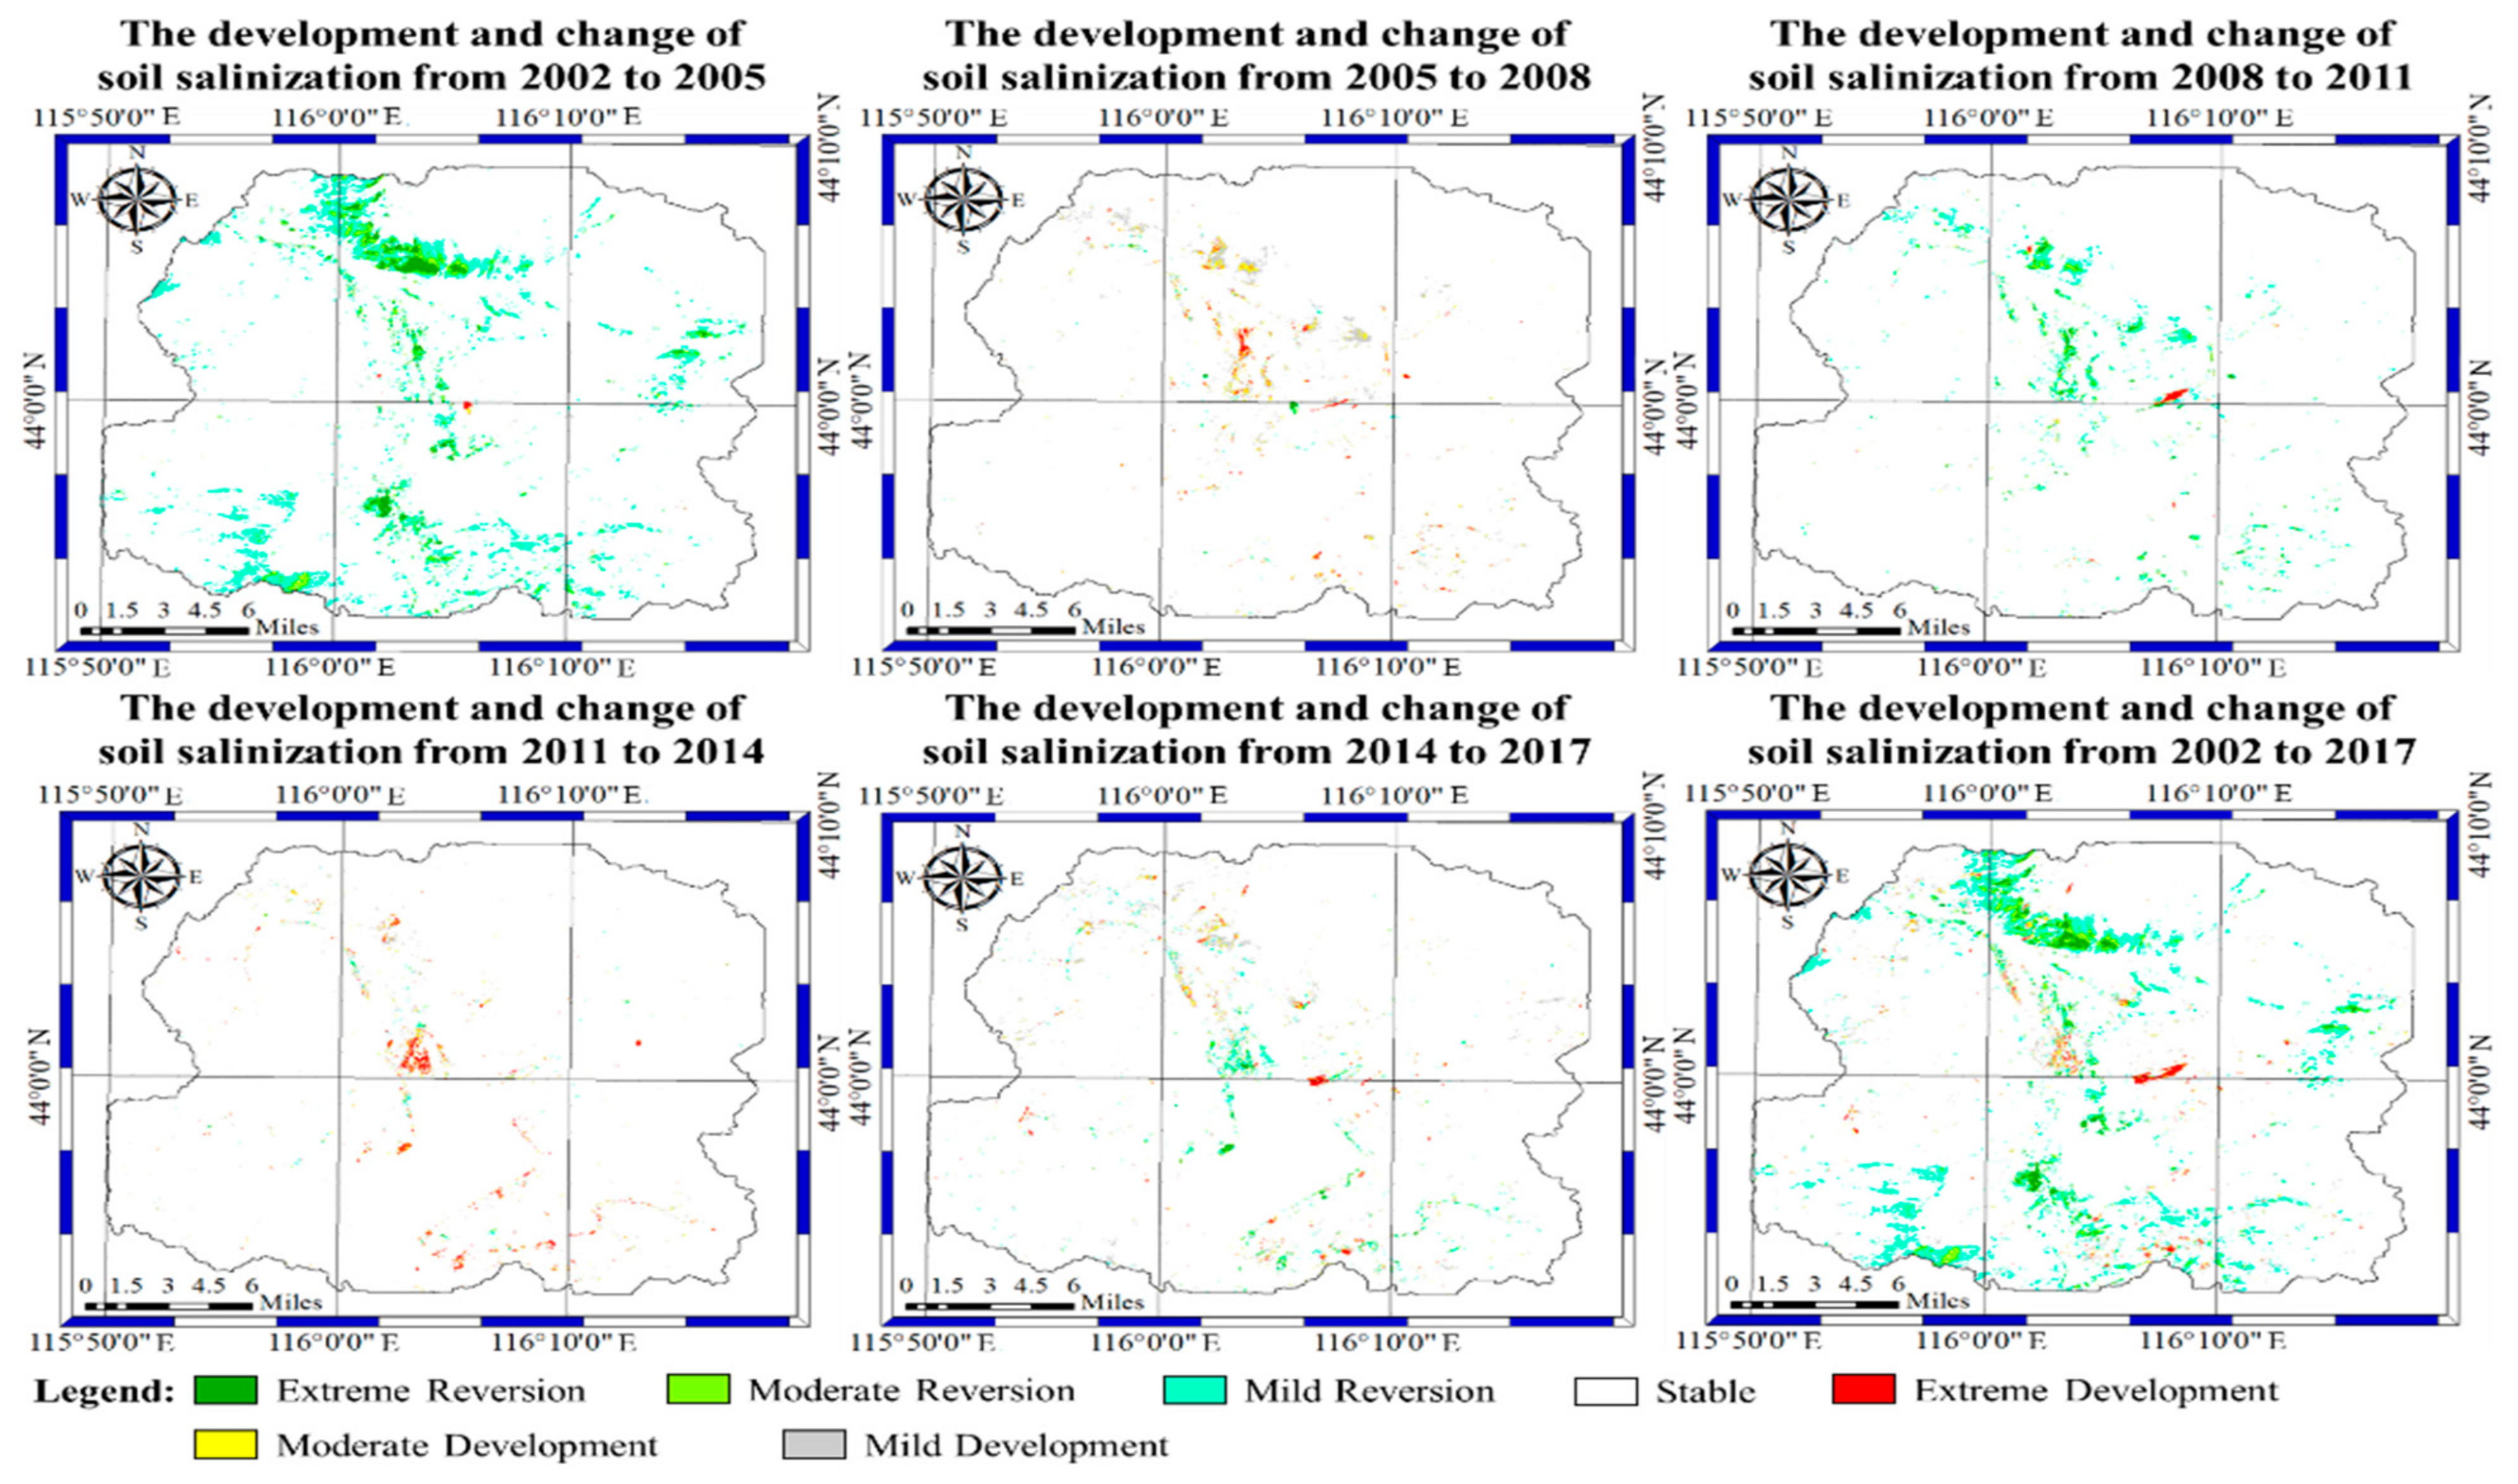
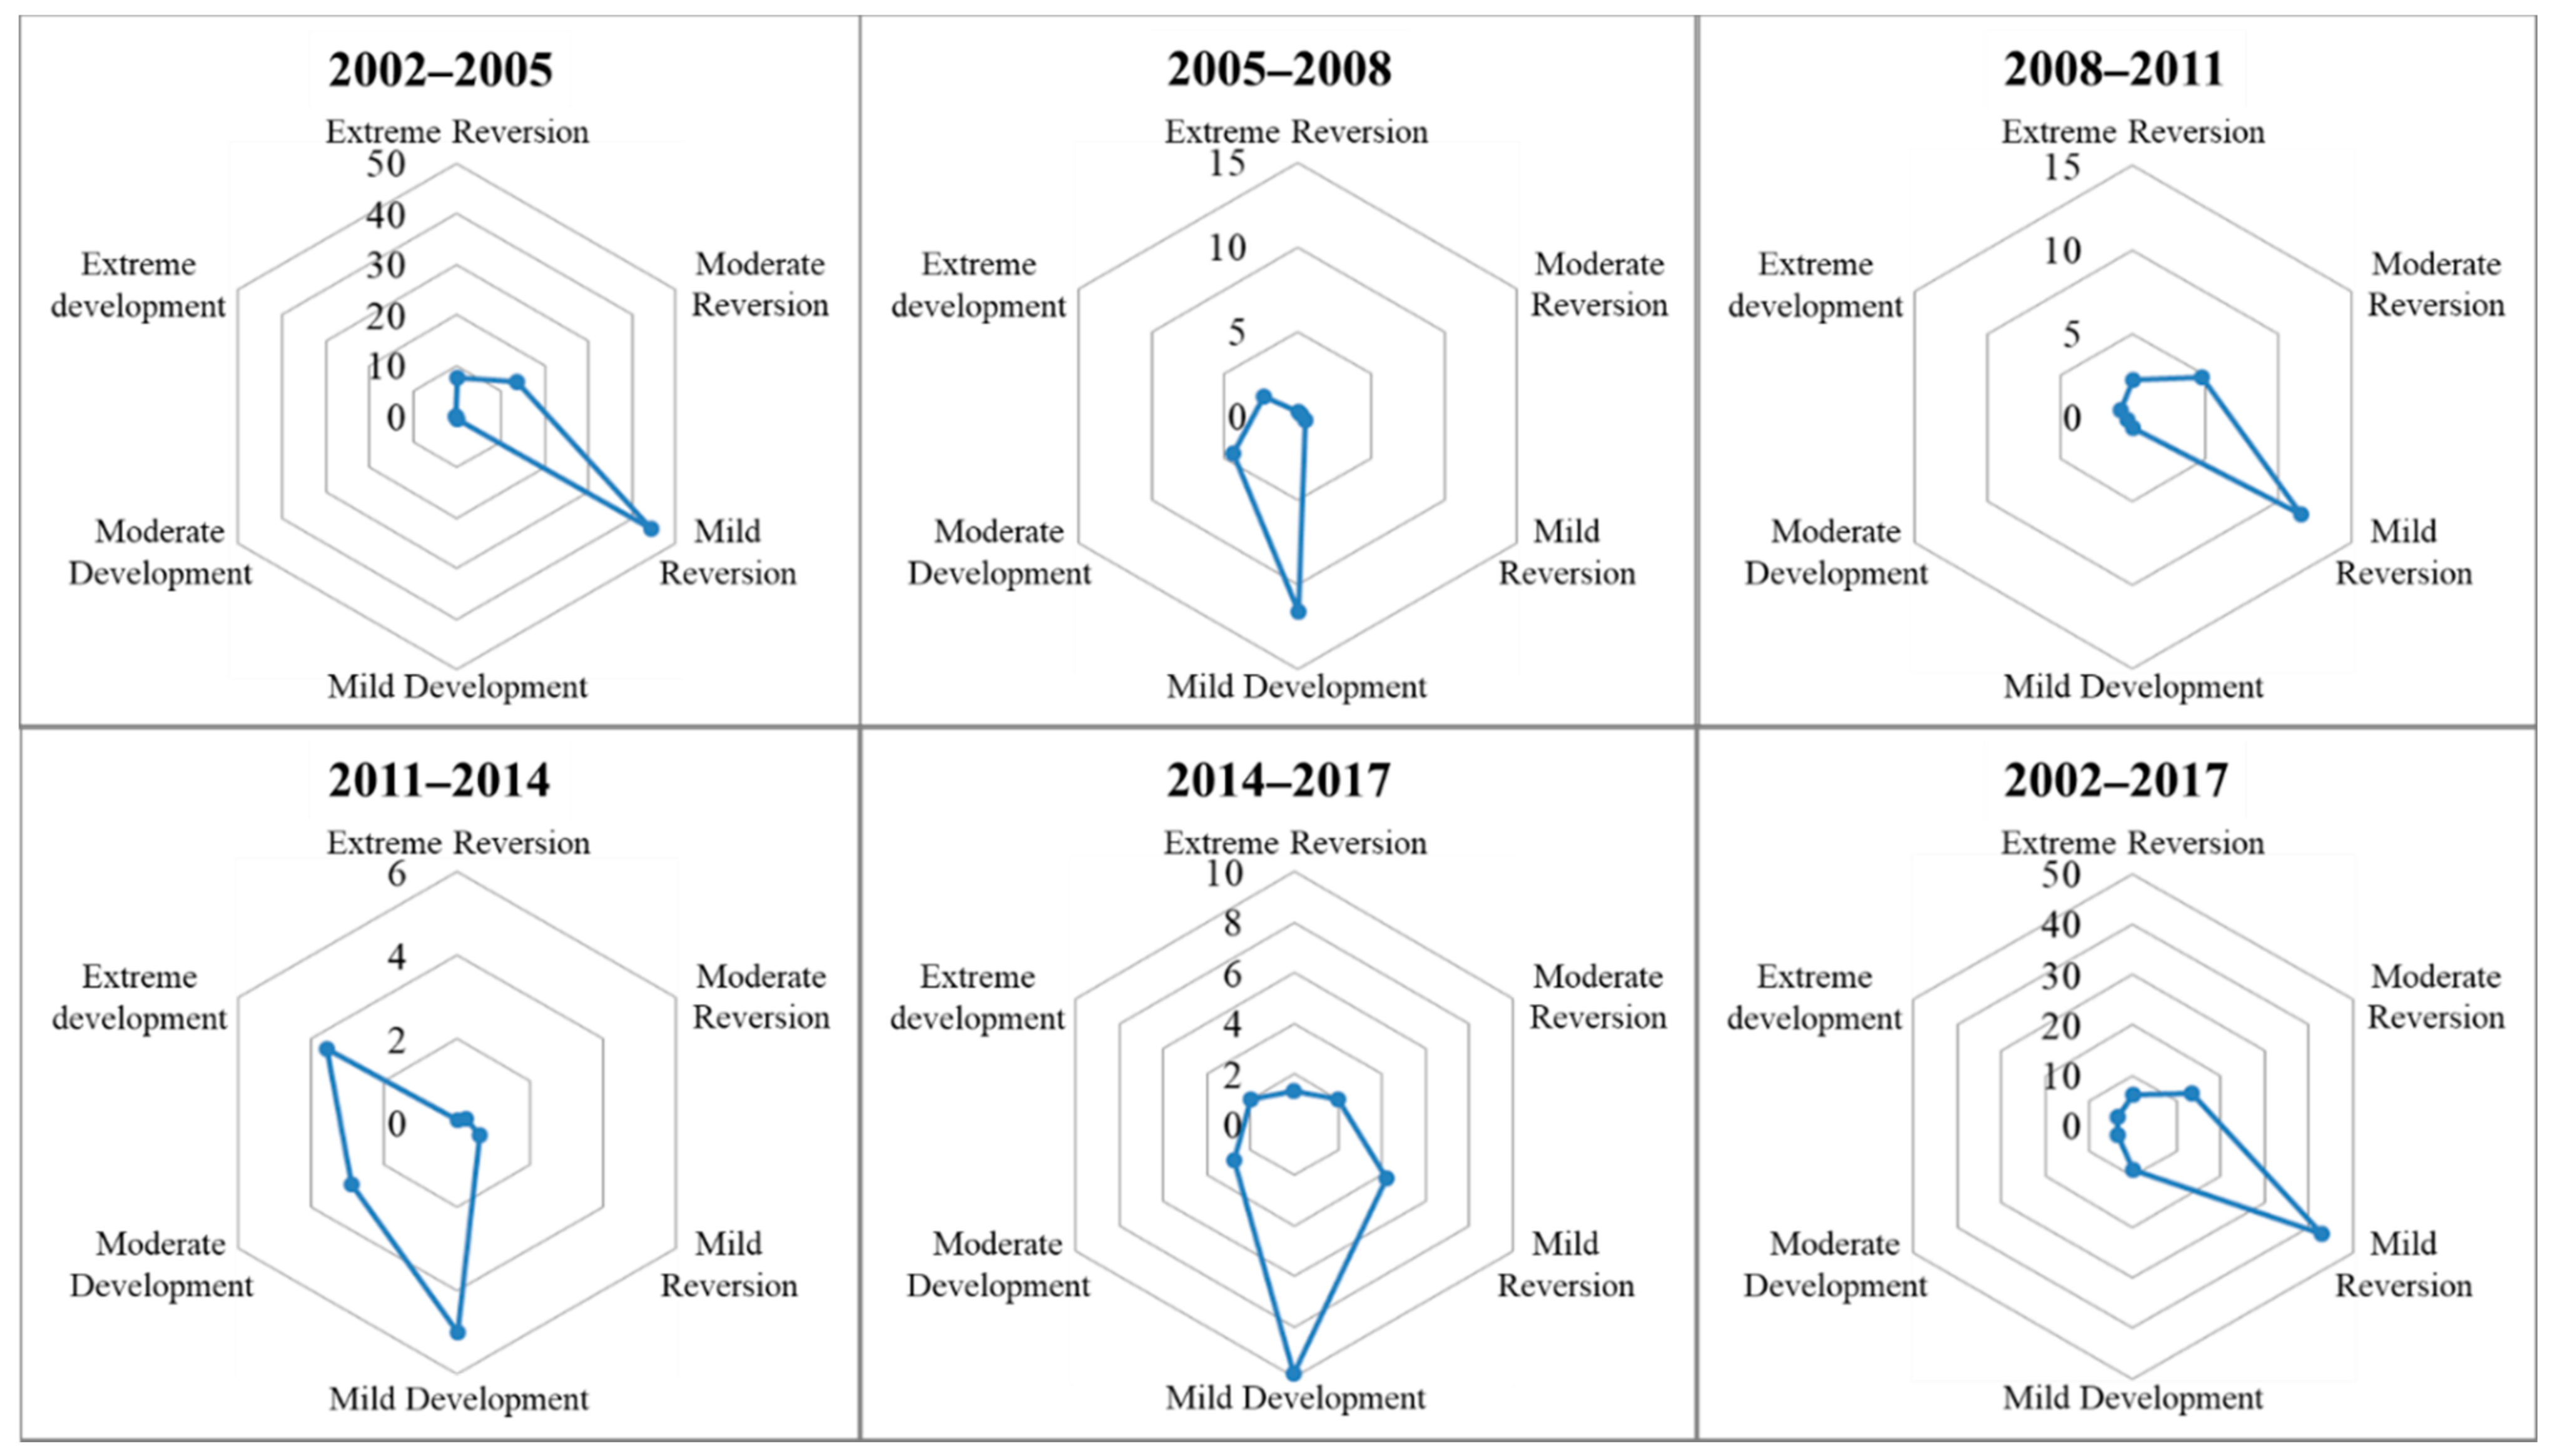
3.2. Analysis of Spatial Change and Development of Soil Salinization
3.3. Driving Force Analysis of Soil Salinization Based on Logistic Regression Model
4. Conclusions
- (1)
- Based on six periods of remote sensing images from 2002 to 2017, the landscape pattern change characteristics of the Shengli mining area in Xilinhot City over the past 15 years were analyzed using remote sensing and GIS technology. The results demonstrated that the landscape pattern of the study area changed significantly. The grassland landscape accounted for the largest proportion (more than 74%) of each landscape type, but the grassland landscape showed a decreasing trend year by year, while the mining landscape increased year by year. The proportion of town landscape is increasing year by year. From the perspective of the single land use dynamic degree, the mining landscape and salinized land have relatively large single land use dynamic degrees.
- (2)
- The area of salinized land in the study area decreased from 66.36 km2 in 2002 to 21.12 km2 in 2017, with an overall decrease of 68.17%. Among these areas, salinized land changed to a mining landscape of 0.58 km2, and 95.17% of the mining landscape occupied grassland landscape; salinized land changed to a town landscape of 9.37 km2, mainly due to town expansion; salinized land turned into a road landscape of 1.81 km2, and was restored to a grassland landscape of 33.45 km2. Over the past 15 years, the salinized land in the study area showed a reverse trend.
- (3)
- Topography, climate, town expansion, coal mining, road construction, and many other factors have a great impact on the soil salinization process in the study area. According to logistic regression analysis, the driving factors of salinized land from 2002 to 2008 are as follows: the distance to the nearest town landscape > the distance to the nearest mining landscape > the distance to the nearest road landscape. From 2008 to 2017, the driving factors of salinized land are as follows: the distance from the nearest mining landscape > the distance to the nearest water landscape > the distance to the nearest town landscape > the altitude > the aspect. Coal development and town expansion occupied a large area of the salinized land. Oil exploitation and abandoned railway test sites promoted the development of salinization.
- (4)
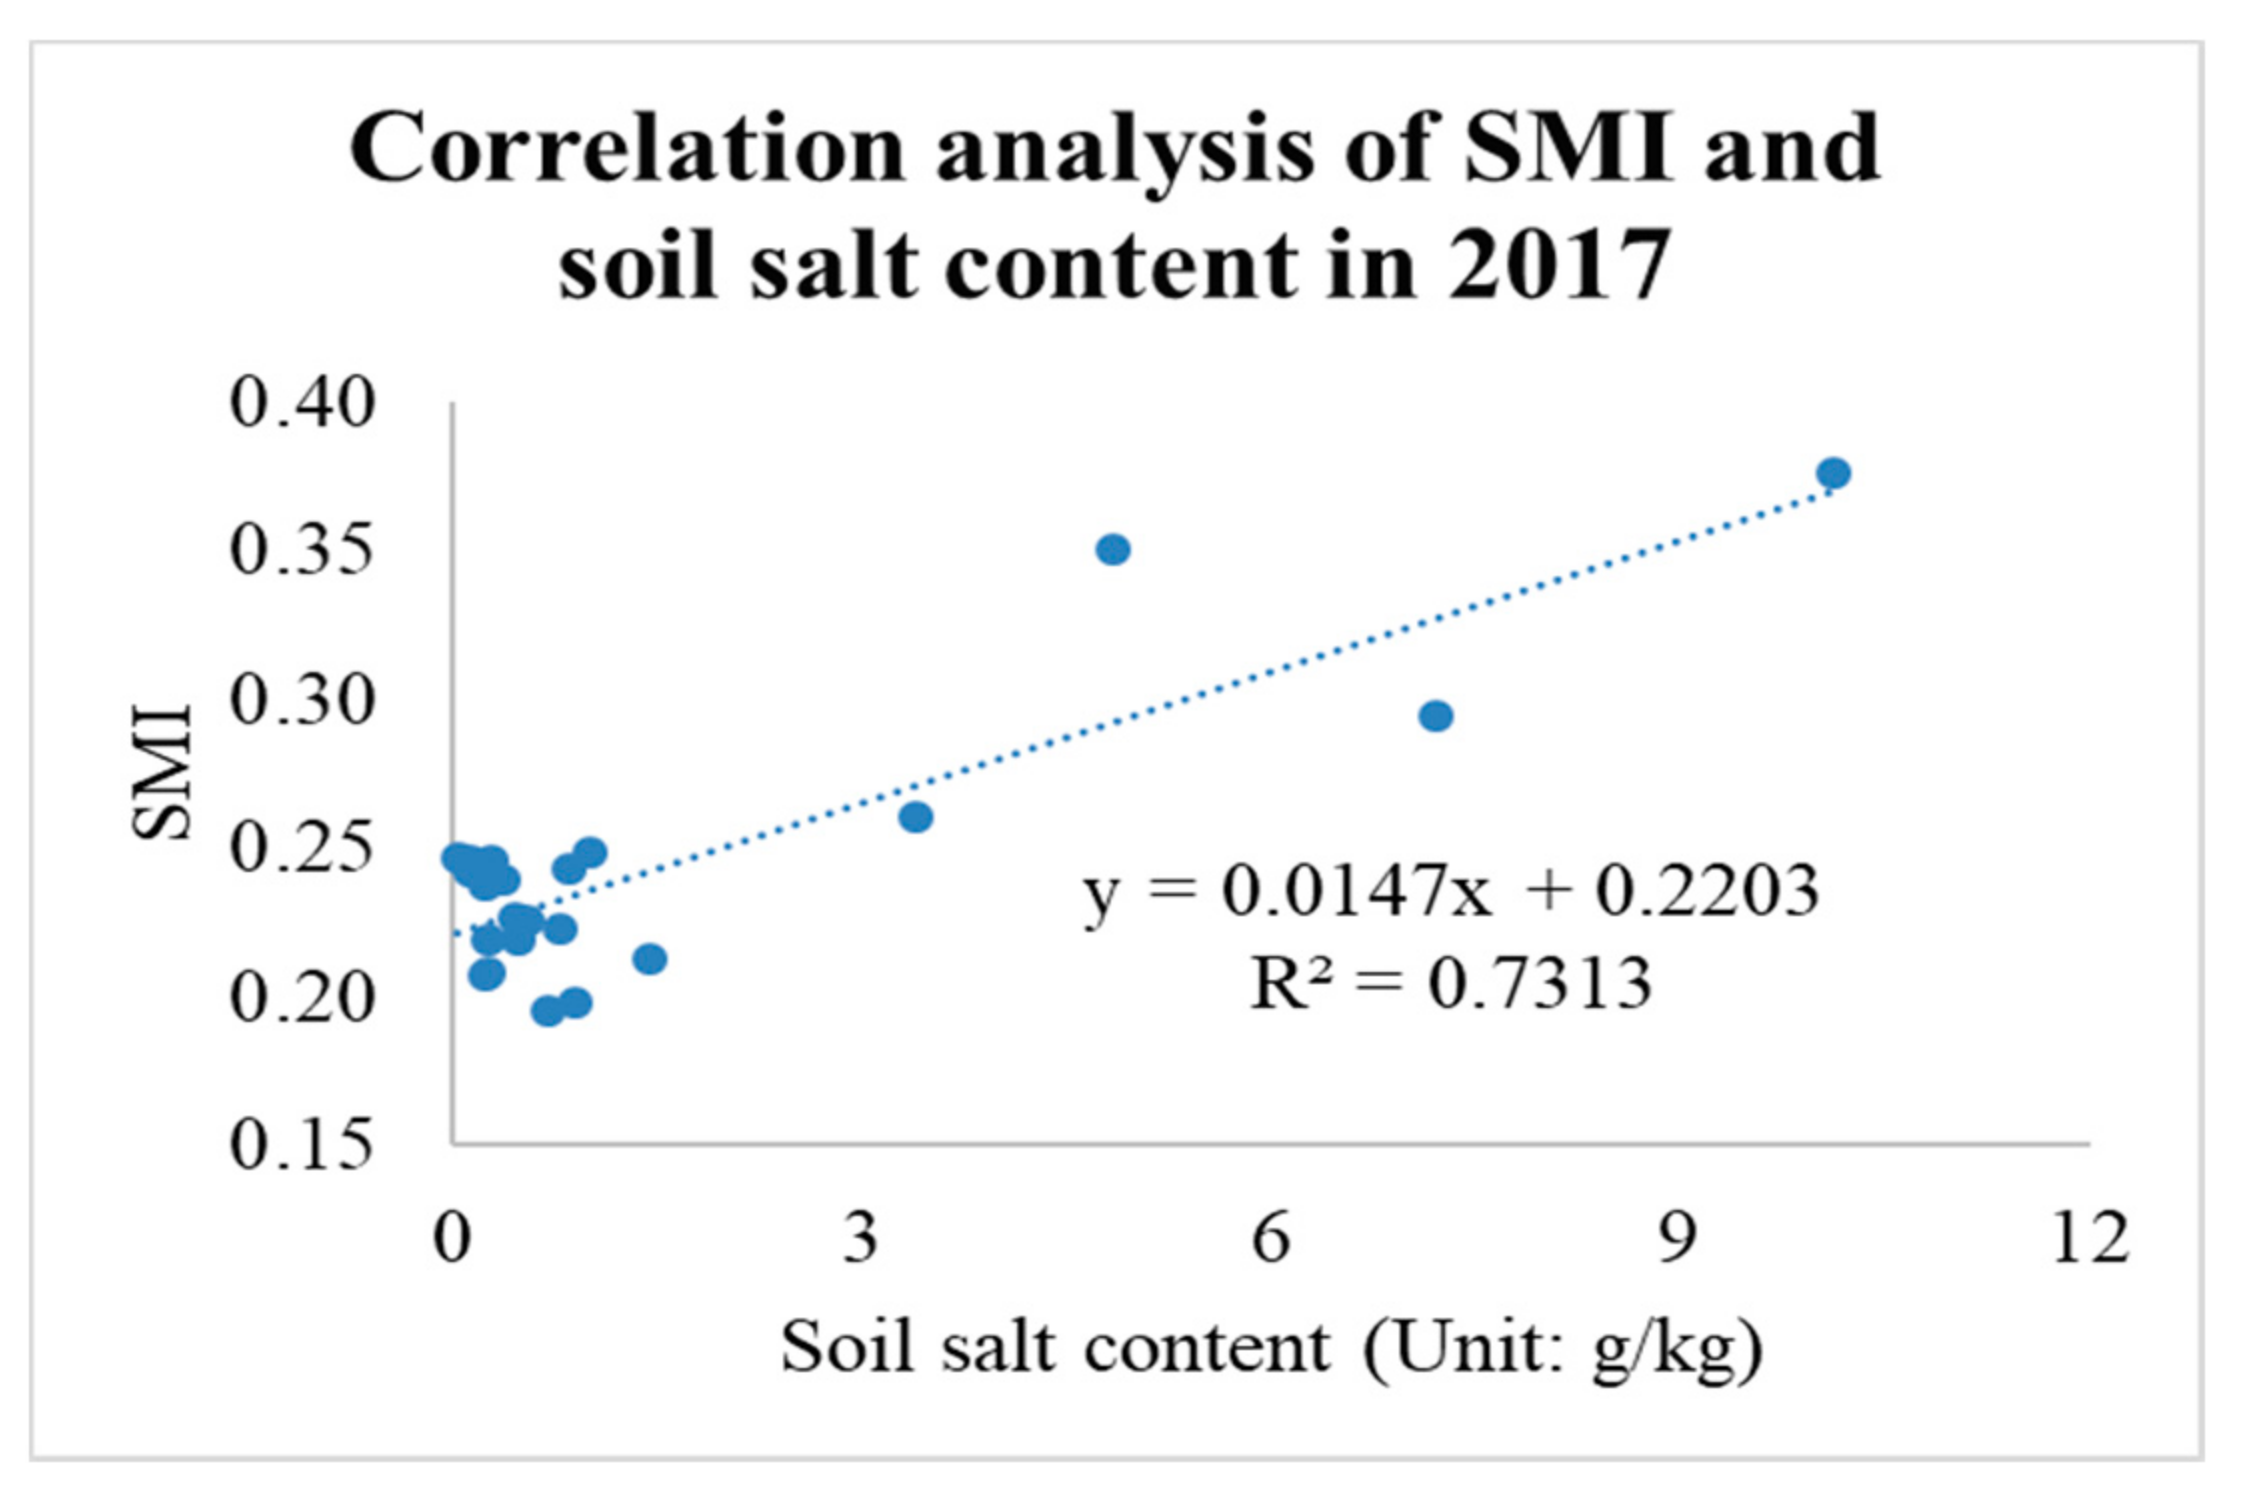
- The SMI constructed using SI-Albedo feature space is simple and easy to calculate, which is conducive to remote sensing monitoring of salinized soil. R2 of the SMI and soil salt content of the study area in 2017 was 0.7313, demonstrating good results from the quantitative analysis and monitoring of soil salinization in the Xilinhot Shengli Coalfield. However, through research and field investigation, it was found that the SMI based on multispectral remote sensing images is only suitable for the extraction of soil salinization information from bare land and areas with low vegetation coverage and is not suitable for areas with dense halophytes. Therefore, it is necessary to conduct an in-depth study on this issue in the future.
Author Contributions
Funding
Institutional Review Board Statement
Informed Consent Statement
Data Availability Statement
Acknowledgments
Conflicts of Interest
References
- Sun, Q.; Tashpolat, T.; Ding, J.; Zhang, F.; Mamat, S.; Han, G. Study on Land Use/Cover Changes and Soil Salinization in Dry Areas: A Case Study of Shaya County in Xinjiang. Prog. Geogr. 2012, 9, 1212–1223. [Google Scholar]
- Li, Y.L.; Qiao, J.F.; Dong, T.Y.; Wang, H.J. Hyperspectral inversion of soil water and salt content in soils with different textures. Chin. J. Appl. Ecol. 2016, 12, 3807–3815. [Google Scholar]
- Jianli Ding, F.W. Environmental modeling of large-scale soil salinity information in an arid region: A case study of the low and middle altitude alluvial plain north and south of the Tianshan Mountains, Xinjiang. Acta Geogr. Sin. 2017, 1, 64–78. [Google Scholar]
- Chengwen Chang, D.A.L. Near-infrared reflectance spectroscopic analysis of soil C and N. Soil Sci. 2002, 2, 110–116. [Google Scholar] [CrossRef]
- Jianli Ding, Y.Y.; Wang, F. Quantitative remote sensing of soil salinization in arid regions based on three-dimensional spectrum Eigen spaces. Acta Pedol. Sin. 2013, 50, 853–861. [Google Scholar]
- Jianli Ding, Y.Y.; Wang, F. Detecting soil salinization in arid regions using spectral feature space derived from remote sensing data. Acta Ecol. Sin. 2014, 34, 4620–4631. [Google Scholar]
- Ding, J.; Qu, J.; Sun, Y.M.; Zhang, Y.F. The retrieval model of soil salinization information in arid region based on MSAVI-WI feature space:A case study of the delta oasis in Weigan-Kuqa watershed. Geogr. Res. 2013, 32, 223–232. [Google Scholar]
- Fei Wang, J.D.; Manchun, W. Remote sensing monitoring models of soil salinization based in NDVI-SI feature space. Trans. Chin. Soc. Agric. Eng. 2010, 26, 168–173. [Google Scholar]
- Zhang, T.Y.; Wang, L.; Zeng, P.L.; Wang, T.; Geng, Y.H.; Wang, H. Soil Salinization in the Irrigated Area of the Manas River Basin Based on MSAVI-SI Feature Space. Arid. Zone Res. 2016, 33, 499–505. [Google Scholar]
- Wu, Z.; Yan, Q.; Zhang, S.; Lei, S.; Lu, Q.; Hua, X. Remote Sensing Monitoring of Soil Salinization Based on SI-Brightness Feature Space and Drivers Analysis: A Case Study of Surface Mining Areas in Semi-Arid Steppe. IEEE Access 2021, 9, 110137–110148. [Google Scholar] [CrossRef]
- Zhang, Y.; Xiang, N.; Feng, Z. SI-Albedo space-based remote sensing synthesis index models for monitoring of soil salinization. Acta Pedol. Sin. 2009, 46, 698–703. [Google Scholar]
- Guo, B.; Han, B.; Yang, F.; Fan, Y.; Jiang, L.; Chen, S.; Yang, W.; Gong, R.; Liang, T. Salinization information extraction model based on VI–SI feature space combinations in the Yellow River Delta based on Landsat 8 OLI image. Geomat. Nat. Hazards Risk 2019, 10, 1863–1878. [Google Scholar] [CrossRef] [Green Version]
- Zeng, Y.; Feng, Z.; Xiang, N. Albedo-NDVI Space and Remote Sensing Synthesis Index Models for Desertification Monitoring. Sci. Geogr. Sin. 2006, 26, 75–81. [Google Scholar]
- Wu, Z.; Lei, S.; Bian, Z.; Huang, J.; Zhang, Y. Study of the desertification index based on the albedo-MSAVI feature space for semi-arid steppe region. Environ. Earth Sci. 2019, 78, 232. [Google Scholar] [CrossRef]
- Sui, X.X.; Qin, Q.M.; Dong, H.; Wang, J.L.; Meng, Q.Y.; Liu, M.C. Monitoring of Farmland Drought Based on LST-LAI Spectral Feature Space. Spectrosc. Spectr. Anal. 2013, 33, 201–205. [Google Scholar]
- Inge Sandholt, K.R.; Jens, A. A simple interpretation of the surface temperature/vegetation index space for assessment of surface moisture status. Remote Sens. Environ. 2002, 79, 213–224. [Google Scholar] [CrossRef]
- Xi, Y.J.W.; Feng, Y.; Jie, Z. Assessment of regional soil moisture status based on characteristics of surface temperature/vegetation index space. Acta Ecol. Sin. 2009, 29, 1205–1216. [Google Scholar]
- Li, X.; Li, L.; Liu, X. Collaborative inversion heavy metal stress in rice by using two-dimensional spectral feature space based on HJ-1 A HSI and radarsat-2 SAR remote sensing data. Int. J. Appl. Earth Obs. Geoinf. 2019, 78, 39–52. [Google Scholar] [CrossRef]
- Cheng, X.-J.; Xu, X.-G.; Chen, T.-E.; Yang, G.-J.; Li, Z.-H. The new method monitoring crop water content based on NIR-Red spectrum feature space. Guang Pu Xue Yu Guang Pu Fen Xi Guang Pu 2014, 34, 1542–1547. [Google Scholar]
- Li, Y.S.; Zhao, G.X.; Wang, Z.R.; Cui, K.; Xi, X.; Dou, J.C. Remote sensing inversion of cultivated land fertility at county scale based on SWCI-NDVI feature space. Chin. J. Appl. Ecol. 2021, 32, 252–260. [Google Scholar]
- Ronglin, T.S.W.; Yazhen, J.; Li, Z.L.; Liu, M.; Tang, B.H.; Wu, H. A review of retrieval of land surface evapotranspiration based on remotely sensed surface temperature versus vegetation index triangular/trapezoidal characteristic space. Natl. Remote Sens. Bull. 2021, 25, 65–82. [Google Scholar]
- Yan, Q.; Huang, W.; Jin, S.; Jia, Y. Pan-tropical soil moisture mapping based on a three-layer model from CYGNSS GNSS-R data. Remote Sens. Environ. 2020, 247, 111944. [Google Scholar] [CrossRef]
- Yan, Q.; Gong, S.; Jin, S.; Huang, W.; Zhang, C. Near Real-Time Soil Moisture in China Retrieved From CyGNSS Reflectivity. IEEE Geosci. Remote Sens. Lett. 2020, 19, 1–5. [Google Scholar] [CrossRef]
- Guangmei Yang, Q.M.; Wenhua, L. Estimation and Enlightenment of Economic Losses due to Grassland Degradation in Xilinguole Steppe. Chin. J. Grassl. 2007, 29, 44–49. [Google Scholar]
- Li, Y. Restoration dynamics of degraded grasslands in the typical steppe zone of Inner Mongolia. Biodivers. Sci. 1995, 03, 125–130. [Google Scholar]
- Min, Q.; Liu, S.D.; Yang, X. Evaluation of the Ecosystem Services of the Inner Mongolia Steppe. Acta Agrestia Sin. 2004, 12, 165–169. [Google Scholar]
- Chen, S. Land Use/Land Cover Change and Carbon Cycle in Xilin River Basin of Inner Mongolia Based on Remote Sensing and GIS; Institute of Remote Sensing Applied Technology, Chinese Academy of Sciences: Beijing, China, 2002. [Google Scholar]
- Zou, Y. Study on the Change of Grassland in Xilinguole Supported by 3S; Inner Mongolia Normal University: Hohehot, China, 2011. [Google Scholar]
- Wu, X. Analysis of Sand Source and its Geological Origin of Desertification in Xilinguole Grassland, Inner Mongolia; China University of Geosciences: Wuhan, China, 2018. [Google Scholar]
- Wu, Z.; Lu, Q.; Lei, S.; Yan, Q. Study on Landscape Ecological Classification and Landscape Types Evolution: A Case Study of a Mining City in Semi-Arid Steppe. Sustainability 2021, 13, 9541. [Google Scholar] [CrossRef]
- Wu, Z.; Lei, S.; Yan, Q.; Bian, Z.; Lu, Q. Landscape ecological network construction controlling surface coal mining effect on landscape ecology: A case study of a mining city in semi-arid steppe. Ecol. Indic. 2021, 133, 108403. [Google Scholar] [CrossRef]
- Wu, Z.; Lei, S.; He, B.-J.; Bian, Z.; Wang, Y.; Lu, Q.; Peng, S.; Duo, L.; Duo, L. Assessment of Landscape Ecological Health: A CaseStudy of a Mining City in a Semi-Arid Steppe. Int. J. Environ. Res. Public Health 2019, 16, 752. [Google Scholar] [CrossRef] [Green Version]
- Wu, Z.; Lei, S.; Lu, Q.; Bian, Z. Impacts of Large-Scale Open-Pit Coal Base on the Landscape Ecological Health of Semi-Arid Grasslands. Remote Sens. 2019, 11, 1820. [Google Scholar] [CrossRef] [Green Version]
- Wu, Z.; Lei, S.; Lu, Q.; Bian, Z.; Ge, S. Spatial distribution of the impact of surface mining on the landscape ecological health of semi-arid grasslands. Ecol. Indic. 2019, 111, 105996. [Google Scholar] [CrossRef]
- Liang, S. Narrowband to broadband conversions of land surface albedo I: Algorithms. Remote Sens. Environ. 2001, 76, 213–238. [Google Scholar] [CrossRef]
- Nasir Mahmood Khan, Y.S. Monitoring hydro-salinity status and its impact in irrigated semi-arid areas using IRS-1B LISS-II data. Asian J. Geoinform. 2001, 1, 63–73. [Google Scholar]
- Verstraete, M.; Pinty, B. Designing optimal spectral indexes for remote sensing applications. IEEE Trans. Geosci. Remote Sens. 1996, 34, 1254–1265. [Google Scholar] [CrossRef]
- Xue, W. SPSS Statistical Analysis Method and Its Application; Publishing House of Electronics Industry: Beijing, China, 2013. [Google Scholar]
- Xie, H. Driving force analysis of land use changes in the typical farming-pastoral ecotone. Trans. Chin. Soc. Agric. Eng. 2008, 10, 56–62. [Google Scholar]
- Jiaxing Xu, G.L.; Guoliang, C. Driving force analysis of land use change based on Logistic regression model in the mining area. Trans. Chin. Soc. Agric. Eng. 2012, 28, 247–255. [Google Scholar]
- Xiaoguang Ni, Y.C.; Xiong, J. Reflections on the Practice of Grassland Ecological Protection and Construction in Xilin Gol League. Inn. Mong. Pratacult. 2005, 17, 6–8. [Google Scholar] [CrossRef]
- Ding Hua, X.H. Spatiotemporal change and drivers analysis of desertification in the arid region of northwest China based on geographic detector. Environ. Chall. 2021, 4, 100082. [Google Scholar] [CrossRef]


| Year | Number | Type | Resolution |
|---|---|---|---|
| 8 July 2002 | LT51240292002189BJC00 | Landsat 5 | 30 m |
| 17 August 2005 | LT51240292005229BJC02 | Landsat 5 | 30 m |
| 8 July 2008 | LT51240292008190BJC00 | Landsat 5 | 30 m |
| 2 August 2011 | LT51240292011214IKR00 | Landsat 5 | 30 m |
| 25 July 2014 | LC81240292014206LGN00 | Landsat 8 | 30 m |
| 17 July 2017 | LC81240292017198LGN00 | Landsat 8 | 30 m |
| Variable | Data Layer | Grid Style | Unit/Description |
|---|---|---|---|
| Dependent Variable | Soil salinization (2002–2008) | Dichotomous | 0–1 |
| Soil salinization (2008–2017) | Dichotomous | 0–1 | |
| Independent variable | Distance to nearest town landscape | Continuous type | m |
| Distance to nearest mining landscape | Continuous type | m | |
| Distance to the nearest road landscape | Continuous type | m | |
| Distance to the nearest water landscape | Continuous type | m | |
| Aspect | Multi-classification | 1–9 | |
| Slope | Multi-classification | 1–5 | |
| Altitude | Continuous type | m |
| Land Type | 2002 | 2005 | 2008 | 2011 | 2014 | 2017 | ||||||
|---|---|---|---|---|---|---|---|---|---|---|---|---|
| Area | Per | Area | Per | Area | Per | Area | Per | Area | Per | Area | Per | |
| Mining | 2.57 | 0.25 | 3.85 | 0.38 | 25.6 | 2.5 | 49.86 | 4.88 | 67.38 | 6.6 | 71.67 | 7.02 |
| Town | 58.17 | 5.7 | 74.12 | 7.26 | 97.48 | 9.54 | 128.72 | 12.6 | 133.12 | 13.03 | 133.21 | 13.04 |
| Grassland | 884.46 | 86.23 | 925.34 | 90.59 | 863.4 | 84.53 | 817.33 | 80.02 | 783.26 | 76.69 | 763.84 | 74.78 |
| Water | 0.12 | 0.01 | 0.06 | <0.01 | 0.48 | 0.05 | 0.36 | 0.03 | 0.74 | 0.07 | 0.61 | 0.059 |
| Road | 9.32 | 0.91 | 15.42 | 1.5 | 15.42 | 1.5 | 22.07 | 2.16 | 23.99 | 2.35 | 26.68 | 2.61 |
| Severe Salinization | 8.83 | 0.86 | 0.56 | 0.05 | 3.14 | 0.31 | 1.13 | 0.11 | 5.22 | 0.51 | 4.86 | 0.48 |
| Moderate Salinization | 13.55 | 1.33 | 0.56 | 0.05 | 4.51 | 0.44 | 0.63 | 0.06 | 2.83 | 0.28 | 4.53 | 0.44 |
| Mild Salinization | 43.99 | 4.31 | 1.47 | 0.14 | 11.35 | 1.11 | 1.29 | 0.13 | 4.85 | 0.47 | 11.73 | 1.15 |
| Total Salinization | 66.36 | 6.5 | 2.59 | 0.24 | 18.99 | 1.86 | 3.05 | 0.3 | 12.9 | 1.26 | 21.12 | 2.07 |
| Land Type | Mining | Town | Grassland | Water | Road | Severe Salinization | Moderate Salinization | Mild Salinization |
|---|---|---|---|---|---|---|---|---|
| Mining | 2.54 | 0.05 | 68.22 | 0.29 | 0.00 | 0.06 | 0.06 | 0.46 |
| Town | 0.01 | 52.29 | 74.41 | 1.00 | 0.06 | 2.29 | 2.18 | 5.27 |
| Grassland | 0.01 | 4.71 | 710.15 | 1.21 | 0.01 | 3.86 | 9.37 | 34.09 |
| Water | 0.00 | 0.76 | 17.30 | 6.80 | 0.00 | 0.12 | 0.31 | 1.39 |
| Road | 0.00 | 0.00 | 0.51 | 0.00 | 0.05 | 0.00 | 0.01 | 0.03 |
| Severe Salinization | 0.00 | 0.06 | 3.34 | 0.00 | 0.00 | 0.61 | 0.30 | 0.55 |
| Moderate Salinization | 0.00 | 0.08 | 2.93 | 0.00 | 0.00 | 0.59 | 0.37 | 0.56 |
| Mild Salinization | 0.00 | 0.22 | 7.60 | 0.00 | 0.00 | 1.30 | 0.95 | 1.65 |
| Land Type | 2002–2005 | 2005–2008 | 2008–2011 | 2011–2014 | 2014–2017 | 2002–2008 | 2008–2017 | 2002–2017 |
|---|---|---|---|---|---|---|---|---|
| Mining | 16.6 | 188.31 | 31.59 | 11.71 | 21.22 | 149.35 | 20 | 179.25 |
| Town | 9.14 | 10.51 | 10.68 | 1.14 | 0.02 | 11.26 | 4.07 | 8.6 |
| Grassland | 1.54 | −2.23 | −1.78 | −1.39 | −0.83 | −0.4 | −1.28 | 0.91 |
| Water | −16.67 | 233.33 | −8.33 | 35.19 | −5.86 | 50 | 3.01 | 27.22 |
| Road | 21.85 | 0 | 14.38 | 2.9 | 3.74 | 10.93 | 8.1 | 12.42 |
| Severe Salinization | −31.22 | 153.57 | −21.34 | 120.65 | −2.3 | −10.75 | 6.12 | −3 |
| Moderate Salinization | −31.96 | 235.12 | −28.68 | 116.4 | 20.02 | −11.12 | 0.05 | −4.44 |
| Mild Salinization | −32.22 | 224.04 | −29.55 | 91.99 | 47.29 | −12.37 | 0.038 | −4.89 |
| Total Salinization | −32.03 | 211.07 | −27.98 | 107.65 | 21.24 | −11.9 | 1.25 | −4.54 |
| Extreme Reversion (−3) | Moderate Reversion (−2) | Mild Reversion (−1) | Stable (0) | Mild Development (1) | Moderate Development (2) | Extreme Development (3) |
|---|---|---|---|---|---|---|
| 3 → 0 | 3 → 1 | 1 → 0 | 0 → 0 | 0 → 1 | 0 → 2 | 0 → 3 |
| 2 → 0 | 2 → 1 | 1 → 1 | 1 → 2 | 1 → 3 | ||
| 3 → 2 | 2 → 2 | 2 → 3 | ||||
| 3 → 3 |
| Period | Independent Variable | Parameter Estimation (B) | The Standard Error (S.E.) | Wald χ2 Statistics | Degree of Freedom (df) | Significance Level (p) | Occurrence Rate (OR) |
|---|---|---|---|---|---|---|---|
| The first stage (2002–2008) HL = 11.996, df = 8, p = 0.151 | Distance to nearest town landscape | −0.000102 | 0.000015 | 42.241 | 1 | <0.001 | 0.999898 |
| Distance to nearest mining landscape | −0.000101 | 0.000016 | 41.215 | 1 | <0.001 | 0.999899 | |
| Distance to nearest road landscape | −0.000123 | 0.000035 | 12.691 | 1 | <0.001 | 0.999877 | |
| Distance to nearest water landscape | 0.000023 | 0.000025 | 0.845 | 1 | 0.358 | 1.000023 | |
| Aspect | 0.031 | 0.023 | 1.755 | 1 | 0.185 | 1.031 | |
| Slope | 0.129 | 0.079 | 2.701 | 1 | 0.1 | 1.138 | |
| Altitude | −0.015 | 0.02 | 0.5652 | 1 | 0.654 | 0.986 | |
| Constant | −0.44465 | 0.61911 | 0.52582 | 1 | 0.47263 | 0.64105 | |
| The second stage (2008–2017) HL = 10.1 df = 8, p = 0.258 | Distance to nearest town landscape | 0.000276 | 0.000052 | 27.745 | 1 | <0.001 | 1.000276 |
| Distance to nearest mining landscape | −0.000198 | 0.000027 | 52.666 | 1 | <0.001 | 0.999802 | |
| Distance to nearest road landscape | −0.000112 | 0.000059 | 3.548 | 1 | 0.06 | 0.999888 | |
| Distance to nearest water landscape | 0.000214 | 0.00004 | 28.098 | 1 | <0.001 | 1.000214 | |
| Aspect | 0.054 | 0.027 | 3.908 | 1 | 0.048 | 1.056 | |
| Slope | 0.033 | 0.092 | 0.127 | 1 | 0.722 | 1.033 | |
| Altitude | 0.003 | 0.001 | 6.827 | 1 | 0.009 | 1.003 | |
| Constant | −0.5984 | 1.40812 | 0.18059 | 1 | 0.67086 | 0.54969 |
Publisher’s Note: MDPI stays neutral with regard to jurisdictional claims in published maps and institutional affiliations. |
© 2022 by the authors. Licensee MDPI, Basel, Switzerland. This article is an open access article distributed under the terms and conditions of the Creative Commons Attribution (CC BY) license (https://creativecommons.org/licenses/by/4.0/).
Share and Cite
Wu, Z.; Che, M.; Zhang, S.; Duo, L.; Lei, S.; Lu, Q.; Yan, Q. Remote Sensing Monitoring and Driving Force Analysis of Salinized Soil in Grassland Mining Area. Sustainability 2022, 14, 741. https://doi.org/10.3390/su14020741
Wu Z, Che M, Zhang S, Duo L, Lei S, Lu Q, Yan Q. Remote Sensing Monitoring and Driving Force Analysis of Salinized Soil in Grassland Mining Area. Sustainability. 2022; 14(2):741. https://doi.org/10.3390/su14020741
Chicago/Turabian StyleWu, Zhenhua, Mingliang Che, Shutao Zhang, Linghua Duo, Shaogang Lei, Qingqing Lu, and Qingwu Yan. 2022. "Remote Sensing Monitoring and Driving Force Analysis of Salinized Soil in Grassland Mining Area" Sustainability 14, no. 2: 741. https://doi.org/10.3390/su14020741
APA StyleWu, Z., Che, M., Zhang, S., Duo, L., Lei, S., Lu, Q., & Yan, Q. (2022). Remote Sensing Monitoring and Driving Force Analysis of Salinized Soil in Grassland Mining Area. Sustainability, 14(2), 741. https://doi.org/10.3390/su14020741