Article

Exploration of Hydrogeochemical Characterization and Assessment of Organic Pollution Characteristics of Shallow Groundwater near a Chemical Plant That Discharged Sewage Illegally

1
College of Geoscience and Surveying Engineering, China University of Mining & Technology (Beijing), Beijing 100083, China
2
National Engineering Research Center of Coal Mine Water Hazard Controlling, Beijing 100083, China
3
School of Water Conservancy and Environment, University of Jinan, Jinan 250022, China
4
China State Construction Engineering Corporation, Jinan 250101, China
*
Author to whom correspondence should be addressed.
Sustainability 2022, 14(2), 660; https://doi.org/10.3390/su14020660
Submission received: 23 November 2021 / Revised: 28 December 2021 / Accepted: 31 December 2021 / Published: 7 January 2022

Abstract

:
Groundwater plays a significant role in domestic use and agricultural irrigation in rural areas of northern China. The untreated wastewater from the chemical plant was directly discharged into a seepage well, resulting in the pollution of groundwater. Assessing characteristics of groundwater organic pollution and identifying evolutionary mechanisms of hydrogeochemistry are beneficial for groundwater protection and sustainable management. Statistical methods (correlation analysis (CA) and principal component analysis (PCA)) combined with hydrogeochemical methods including Piper, Gibbs, Gaillardet, and ions binary diagrams and the chloride alkalinity index were employed to explore hydrogeochemical characteristics and evolutionary mechanisms. The results showed that cations were predominantly located at the Ca2+ end and anions were mostly close to the SO42− and Cl end. The ion concentrations of groundwater were mainly affected by water–rock interactions. The weathering or dissolution of silicate (i.e., aluminosilicate minerals), evaporite (i.e., halite and gypsum), carbonate minerals (i.e., calcite and dolomite), cation exchange, and anthropogenic activities contribute to the chemical compositions of groundwater. Based on CA and PCA, the dissolution of halide minerals and the use of pesticides and fertilizers were the main factors controlling water chemistry. Additionally, the dissolution of sulfur-bearing minerals and gypsum was the key factor controlling the concentrations of Ca2+ and Mg2+. Application of mathematical statistical methods characterized that the exceedance rate of seven organic compounds with high detection rates were as follows: carbon tetrachloride (39.83%) > 1,1,2-trichloroethane (28.81%) > chloroform (10.17%) > trichloroethene (6.78%) > 1,1,2,2-tetrachloroethane (5.93%) > perchloroethylene (5.08%) > trichlorofluoromethane (0.85%). Simultaneously, pollution under the influence of volatilization and diffusion was significantly less than that in the direction of groundwater runoff.

1. Introduction

Groundwater (GW), which provides drinking water to billions of people around the world and supplies approximately 40% of the water for global irrigated agriculture, is the world’s largest freshwater resource [1,2,3]. The population of the world is increasing significantly, but the availability of water for all populations is decreasing. Clean and safe GW is a vital guarantee for social and human sustainable development [4,5,6]. Unfortunately, over-exploitation of GW coupled with frequent and intensive anthropogenic activities, such as urban sewage discharge, landfill infiltration, industrial wastewater, and agricultural pollution, have resulted in a decline in GW chemical quality and GW pollution [7,8,9,10]. GW quality, including the physical, chemical, and biological conditions of water entrapped beneath the ground, has been a hot global research subject in recent decades [11,12]. GW quality also has a significant impact on industrial and agricultural development, urbanization, environmental sustainability, and food safety [13]. The discharge of industrial pollutants and the use of agricultural chemical fertilizers have resulted in elevated GW concentrations of nitrate (NO3), nitrite (NO2), and sulfate (SO42−) [14]. Both natural processes (dissolution or precipitation of minerals, GW velocity, quality of recharge water, and interaction with other types of water aquifers) and anthropogenic activities can largely determine the GW quality in a region [7,15]. The decline in GW quality not only has further exacerbated water deficits but also has a negative impact on human health. GW quality degradation has gradually attracted global attention [16,17,18,19]. Therefore, sustainable water resources management is essential for ensuring an adequate supply of water in the future [20].
A complete understanding, investigation, and analysis of GW chemical characteristics and quality are required to ensure sustainable management and safe usage of GW resources for domestic, agricultural, and industrial purposes [21,22,23]. In this study, statistical methods (i.e., correlation analysis (CA) and principal component analysis (PCA)) were used in combination with hydrogeochemical analysis methods (i.e., Piper diagram, Gibbs diagram, Gaillardet diagram, ions binary diagram, and a chloride alkalinity index) to extract important information hidden in the raw data population and to determine the complex interconnections among water chemistry samples or indicators.
During the early stage, the major GW pollution sources came from conventional components and toxic heavy metals. Inversely, over the last 30 years, the widespread use of organic reagents and organic products resulted in organic pollution of GW [9,24,25]. Until the 1990s, there were 184 types of organic pollutants found in GW, including halogenated hydrocarbons, aromatic hydrocarbons, and pesticides; most of them had the characteristics of severe toxicity, slow degradation, and difficulty in treatment [26,27]. Most of them have the “three effects” of carcinogenicity, teratogenicity, and mutagenicity, which have a serious impact on human health. The solubility of organic pollutants in water is not high, and their concentrations in GW are generally small. Therefore, they are full of difficulties in the detection and analysis of water samples due to the complexity and invisibility of organic pollution.
The chemical plant mentioned in this article is situated in the northern part of China. It is also close to residential living areas and drinking water reservoirs. The cleaning or foaming agent products produced by the plant are nontoxic and newly upgraded alternative products, but the production of raw materials are hazardous chemicals. In the production process, anhydrous hydrofluoric acid and carbon tetrachloride are used as the main raw materials with antimony pentachloride acting as a catalyst to produce trichlorofluoromethane. The main reaction is shown in Equation (1):
CCl 4 + HF 80 o , 709 . 1 kPa SbCl 5 CCl 3 F + HCl
Although the production process does not produce wastewater, the wastewater from the washing equipment and workshop is not treated by the water purification facility. The regular production process further comprises water washing, alkali washing, and distillation processes, etc. The untreated production wastewater containing carbon tetrachloride, sodium chloride, sodium fluoride, and other pollutants was directly discharged into the seepage well. Other domestic wastewater and sewage were discharged directly into the drainage ditch without treatment, resulting in the pollution of GW. As a consequence, it is an extremely urgent task to investigate and analyze the degree of organic pollution in the soil and GW. In conclusion, the main objectives of this study were (1) to identify the GW hydrogeochemical characteristics and hydrogeochemical evolutionary mechanisms in the study area [28] and (2) to investigate and assess the degree of organic pollution in the soil and GW. The findings of this article provide technical support for the scientific implementation of groundwater pollution remediation and provide scientific basis for the development, management, and protection of shallow groundwater resources in the study area. Efforts have been made to protect the safety of drinking water and human health in residential areas.

2. Study Area

The research area is located in the southwest of Shandong Province, China, with an area of approximately 7 km2 (Figure 1). It belongs to the warm-temperate monsoon continental climate zone with an average temperature of 12.9 °C for many years (1960~2011) and approximately 220 frost-free days throughout the year. The meteorological data show that the annual average precipitation is 790.69 mm (1960–2013). Affected by the monsoon climate, the annual precipitation has obvious seasonality, and there is the phenomenon of alternating wet and dry years. Precipitation from June to August during the rainy season generally accounts for 65.5% of the annual precipitation, and January has the least. Geomorphology belongs to the plains area in the transition zone from the edge of the mountain to the plains. The ground altitude is from 100 to 140 m, and the altitudes of the eastern, western, and northern mountains are generally between 200 and 400 m. The only way to discharge surface water and GW is in the low-lying area in the south.
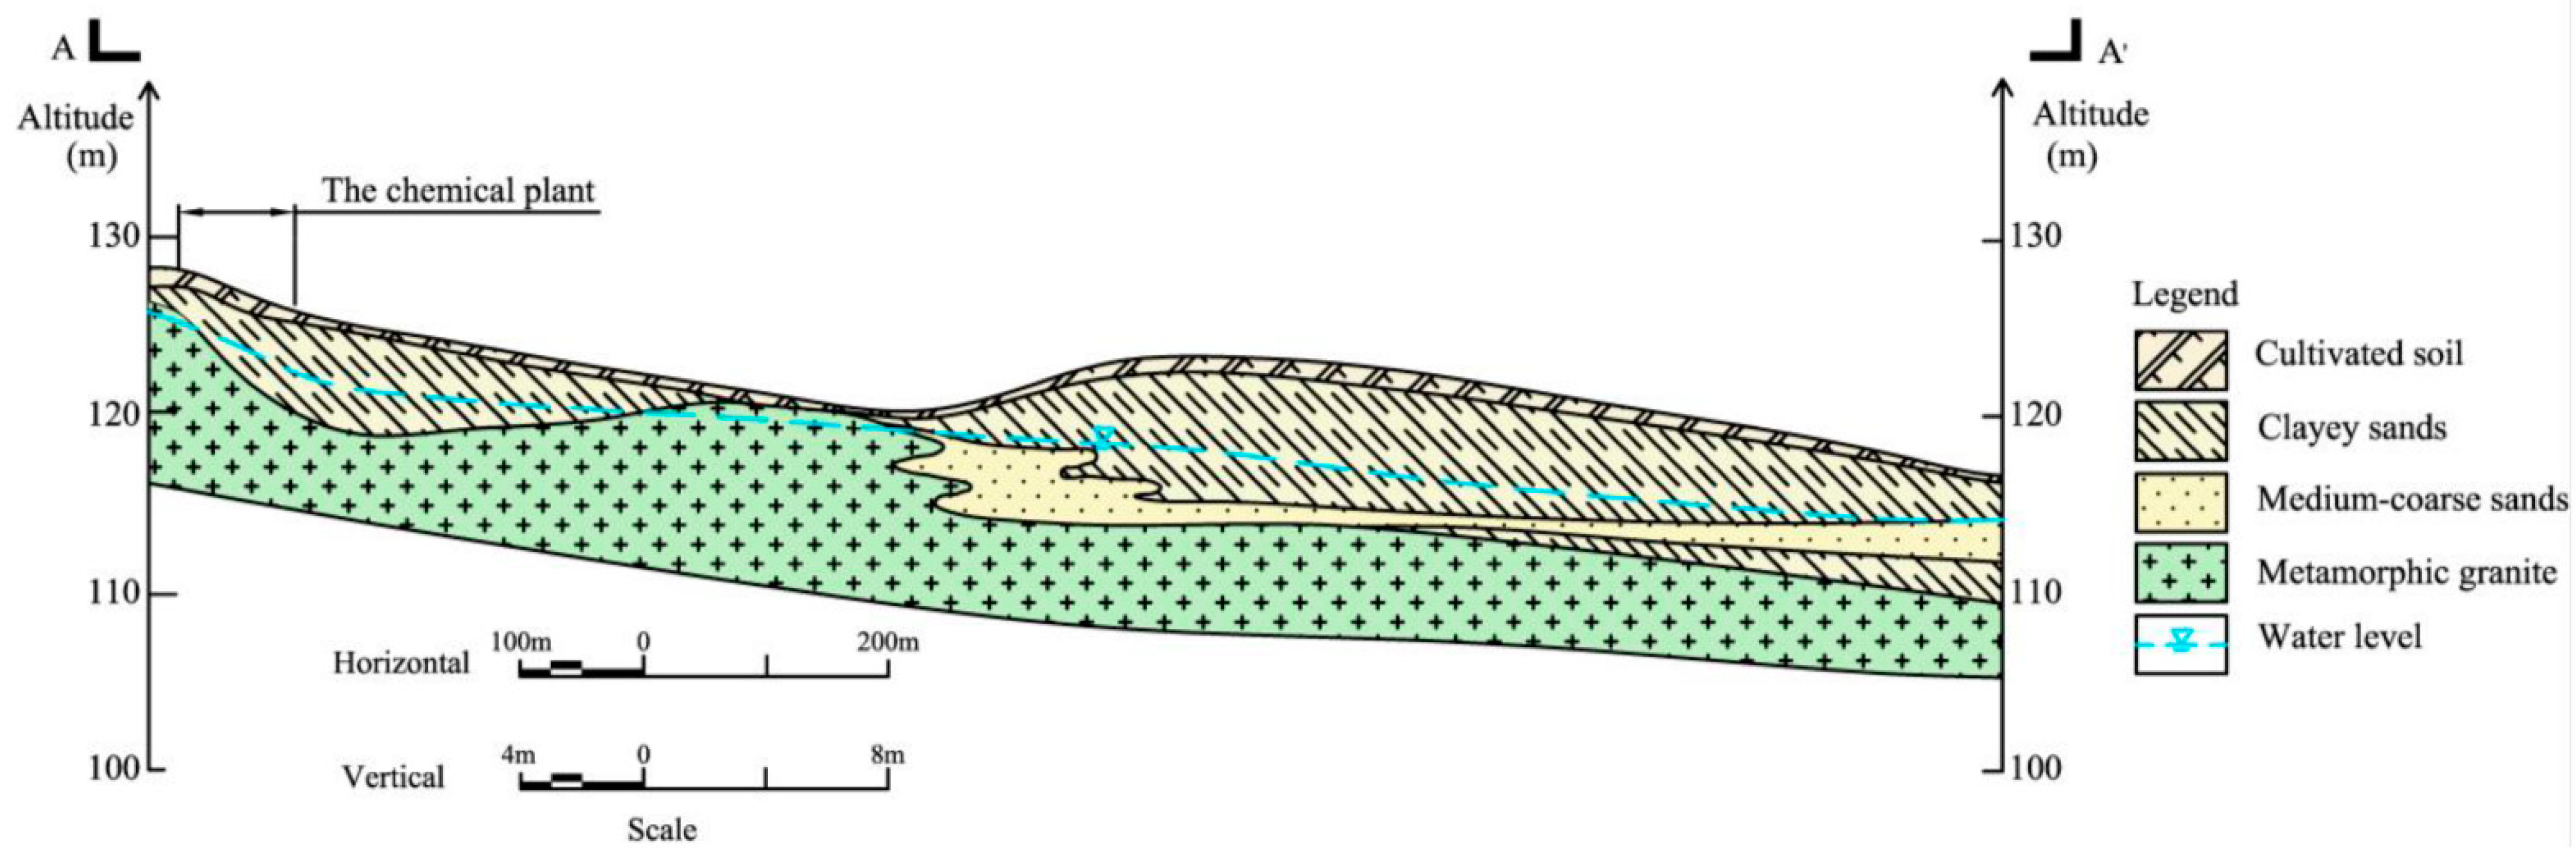
As shown in Figure 2, the Quaternary Upper Pleistocene strata are widely distributed in the study area. The main lithology is cultivated soil, clayey sands, and medium-coarse sands, with a thickness ranging from two to five meters. Two types of aquifers, including a phreatic aquifer and a confined aquifer, can be identified within the Quaternary deposits. The phreatic aquifer, consisting of alluvial sands and coarse sands, is the main aquifer for water supply. Only a small portion of water is provided by the confined aquifer composed of sands, fine sands, and thin clayey layers for various uses. The lower layer of medium-coarse sands or the thin clayey layer is metamorphic granite. Most of the granites are exposed to a moderate weathering depth of which the thickness of the fully weathered layer is 1.8~8.5 m, and the thickness of the strongly weathered layer is generally between 1.5 and 5.2 m. The thickness of the moderately weathered layer is 1.0~4.8 m, and most are not exposed.

3. Methods and Materials

3.1. Sampling and Measurements

Soil samples were collected from new boreholes Z6, Z34, and Z35 in April 2019 (Figure 1). Ten samples were collected from Z6, with a sampling depth ranging from 0.5 to 10.2 m. Seven and eight samples came from the Z34 and Z35 boreholes, and the sampling depths were 0.5~9.6 and 0.9~14.5 m, respectively. Samplers had to wear white rubber gloves and samples were kept in brown glass bottles. Soil test indicators included metal indicators (i.e., iron, manganese, potassium, calcium, sodium, and magnesium) and organic compounds including 129 volatile organic compounds (VOCs) and semi-volatile organic compounds (SVOCs).
The present study collected 118 GW samples from 77 monitoring wells. The sampling at different depths was conducted in 40 wells. Most of the samples were taken from shallow GW (sampling depths less than 30 m). The GW catchment was classified into upstream, midstream, and downstream to explore the hydrogeochemical characterization and to assess the organic pollution characteristics of shallow groundwater. The specific classification and sampling depth of the GW samples are listed in Table 1. The coordinates of each sampling point were identified and recorded using real-time kinematics (RTKs). Samples were collected from monitoring wells along the direction of the GW flow. The samples were collected in duplicate. Simultaneously, parallel samples were collected from individual wells. The sampling instrument was a Bailer tube. Since the samples to be measured were mainly VOCs and SVOCs, they were stored in a brown wide-mouth glass bottle. They were properly labeled and included the sample ID, name, and location of the source highlighted on each bottle. Wells were cleaned before sampling, and before taking a GW sample, the sample bottle was rinsed 2~3 times with the sample source water. The electric conductivity (EC), dissolved oxygen (DO), water temperature (T), and the pH of the GW were measured using a portable analyzer in situ. When sampling, the water sample were filled with the container without any space. After sampling, the bottles were sealed under refrigerated conditions and transported to the SGS (Shanghai) laboratory for water quality testing as soon as possible. Sample processing and preservation were performed as per the “Criteria for Groundwater Quality” of China (GB/T14848-2017). The relative deviation of parallel samples was less than 8%, indicating that the accuracy met the requirements of quality control. The experimental data were true and reliable.

3.2. Correlation Analysis

Correlation analysis is a useful tool for reflecting the interdependence between different hydrogeochemical parameters [29,30]. In this article, Pearson correlation analysis was employed to identify the correlation between each pair of GW physicochemical indices. A statistical difference was considered at a 0.01 or 0.05 significance level.

3.3. Principal Component Analysis

Principal component analysis is a powerful technique used to reduce the dimensionality of the geochemical data set, which consists of a large number of interrelated variables [31,32]. The Kaiser–Meyer–Olkin (KMO) and Bartlett’s sphericity methods were used to verify the validity of PCA in reducing the dimensionality of the data set. In this study, PCA was applied to discriminate the sources of the major ions.

3.4. Data Analysis

Various software was implemented to process the water chemistry data of the collected samples. The plot of sampling location was made by ArcGis 10.4.1. Gibbs diagram, various ion ratios plot, and heavy metals concentrations charts were produced from the scatter plots of OriginPro 2017. GW organic pollution analysis charts were made from the bar charts and line charts of OriginPro 2017. The Piper diagram was made using AqQa software. The descriptive statistical analysis of eleven main parameters and six heavy metals was performed using IBM SPSS Statistics 25.

3.5. Quality Standards and Control Methods

The charge balance errors (CBEs) are calculated using Equation (2) (all the ions are in meq/L). The absolute values of the CBEs of most GW samples in the study area were less than 5% [33], suggesting the accuracy of the measurements.
CBE = cation anion cation + anion × 100
The GW standard limits referred to the class III water criteria in “Criteria for Groundwater Quality” (GB/T14848-2017 and DZ/T0290-2015), water quality index limits in “Hygienic Criteria for Drinking Water” (GB5749-2006), or the drinking water limits in the “2012 Edition of the Drinking Water Criteria and Health Advisory” (United States).
The calculation formula of the pollutant detection rate is as Equation (3). For indicators that exceed the limits of drinking water quality standards in relevant norms, it is necessary to calculate the exceedance multiples. Exceedance multiples are calculated by Equation (4). I is the exceedance multiple of a pollutant, C is the measured concentration of pollutant (μg/L), and CH is the standard limit.
Detection   rate   of   contaminants = Number   of   samples   detected Total   number   of   samples   sent   for   inspection × 100 %
I = C C H C H

4. Results and Discussion

4.1. General Characteristics of GW Hydrochemistry

Statistical analysis of hydrogeochemical data can provide a preliminary understanding of the typical characteristics of GW chemistry in the study area. As shown in Table 2, the range of the chemical compositions of the GW samples was quite large. The range of pH among the samples was between 5.77 and 9.08, with an average of 6.95, which indicates that the GW of the study area was generally weakly acid to neutral. The EC of the samples ranged between 616 and 3000 μs·cm−1, with a median of 1219.60 μs·cm−1. TDS varied between 374 and 1910 mg/L, with a median of 874.98 mg/L. TDS can act as an indicator of changing characteristics of the GW ion compositions to a certain extent, since the changes in TDS correspond to the changes in GW ion contents. Simultaneously, Z6 and Z9 were distributed in where the chemical plant was located, with the high measurement of TDS exceeding 1700 mg/L, indicating that chemical plant sewage had a significant impact on the TDS of GW. Locations 158 and 151 neared the downstream area, with the highest measurements of TDS exceeding 1800 mg/L. Since human activities had a significant impact on the TDS of GW. The TDS of some samples in the study area exceeded the level III water quality categories in the “Quality Standard for Groundwater” of China (GB/T14848-2017) with a maximum value of 1910 mg/L and an exceedance rate of 27.97%. The concentrations of Ca2+ and Na+ ranged between 61.6~375 mg/L and 25.9 mg/L~219 mg/L, respectively. Ca2+ and Na+ were considered the predominant cations, while SO42− and HCO3 were the major anions. The concentrations of SO42− and HCO3 ranged between 110~502 and 40~380 mg/L, respectively. The major cation compositions of GW in the aquifers according to the average value were of the order Ca2+ > Na+ > Mg2+ > K+, with Ca2+ concentrations being significantly higher than those of the other three cations. In contrast, the anions abundance followed the order SO42− > HCO3 > Cl > NO3.
The coefficient of variation (CV) is the standard deviation divided by the mean of the overall sample and can reflect the degree of stability of an indicator [34]. The data were stable when CV was 40%, except for pH; the indicators that met this criterion was TDS, SO42−, HCO3, and Mg2+. This was indicated by the fact that their contents were widespread and evenly distributed in the study area. Additionally, the CV of Ca2+ and Na+ ranged from 40% to 80%, indicating that the levels of these indicators might vary in different regions. The CV of Cl, NO3, and K+ were 86.64%, 88.88%, and 197.23%, respectively. These large values showed that their spatial distribution was different and might be attributable to point and diffused pollution from industrial activities.

4.2. Hydrochemical Types of GW

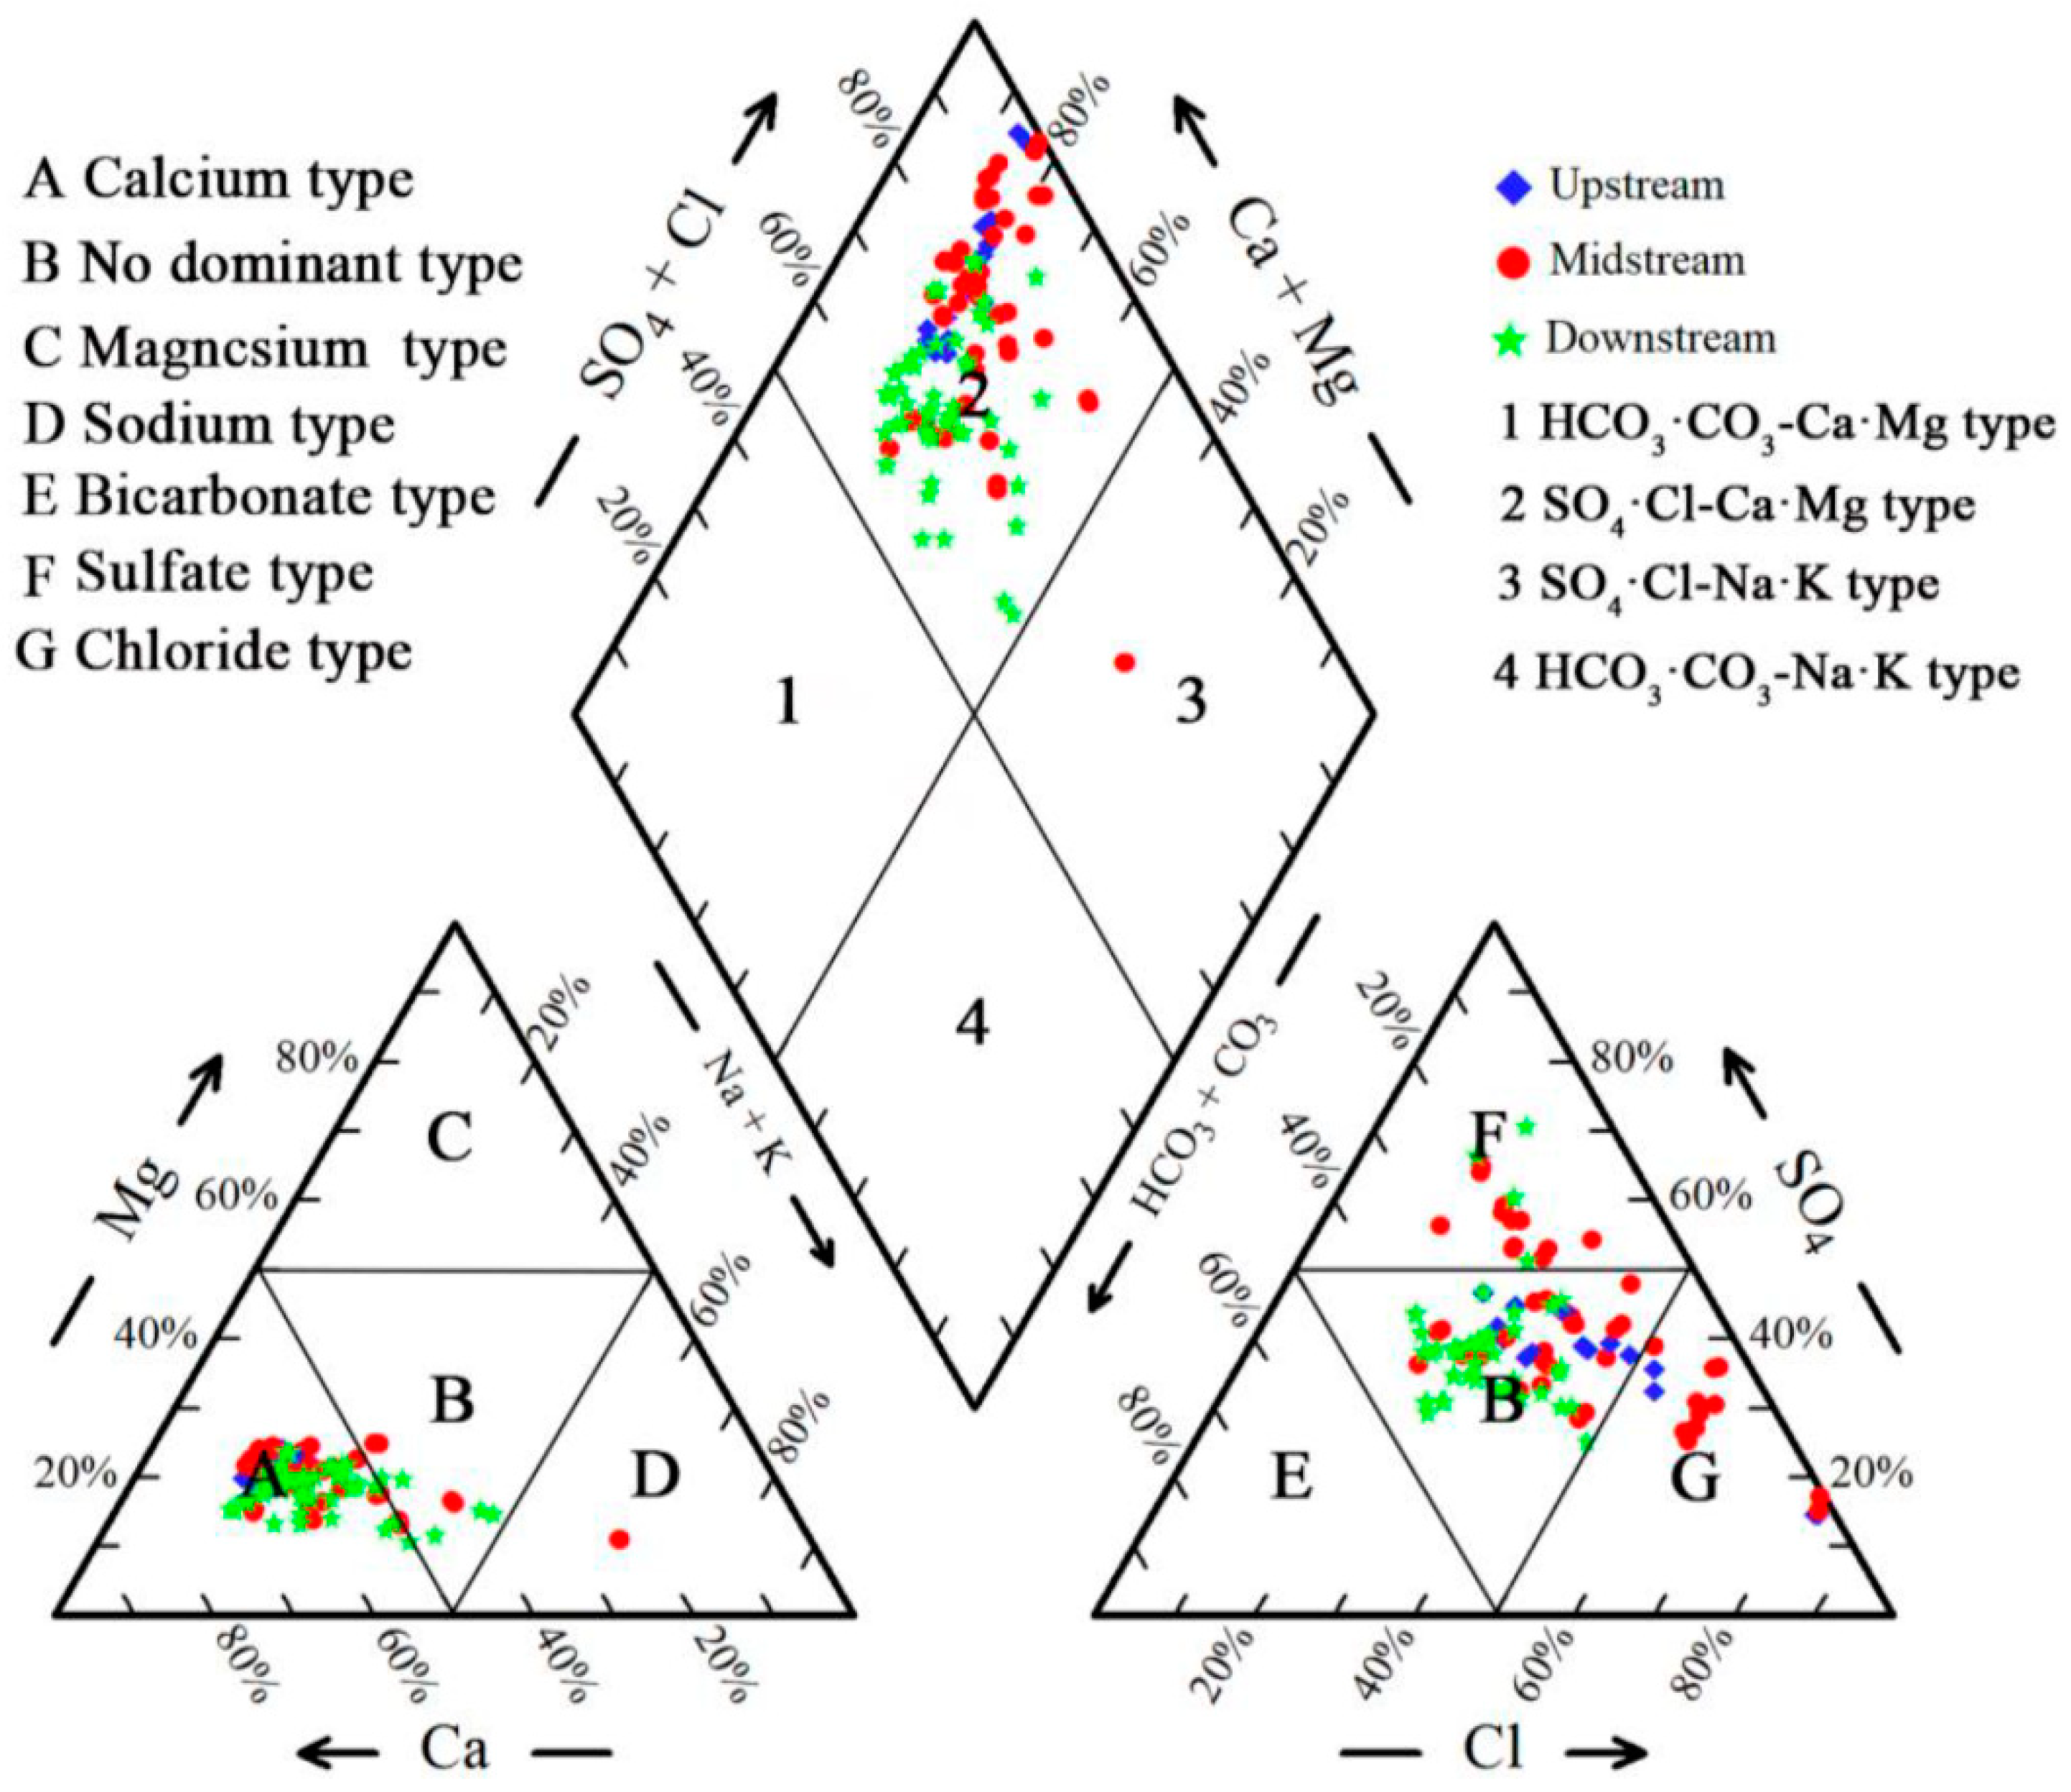
A Piper diagram can be used to characterize the compositional changes to main anions and cations. Analogously, it reflects the chemical characteristics of GW to a certain degree [35,36,37]. This is represented by the percentage of milliequivalent concentrations of major anions (i.e., Cl, SO42−, and HCO3) and cations (i.e., Ca2+, Mg2+, and Na+ + K+). The hydrochemical face depends on the location of the GW samples in the diagram. As shown in Figure 3, the cations in GW samples were predominantly located at the Ca2+ end, and the distribution was more concentrated. The anions were mainly close to the SO42− and Cl end, which indicated that the GW in the study area originated from the dissolution of gypsum and sulfate-containing sediments [38]. Similarly, the infiltration of wastewater from chemical plants and domestic sewage also resulted in the high concentration of Cl in this region [39]. To clarify regional differences in the chemical characteristics of GW in the study area, the GW catchment was classified into upstream, midstream, and downstream for analysis (Table 1). In general, the dominant cation in the GW samples of the whole study area was Ca2+, while the lowest was K+, because the weathering rate of potassium-bearing rocks was low. In contrast, the anions were highly variable. Approximately 41.18% of the total GW samples corresponded to the Cl·SO4–Ca-type upstream. The hydrochemical types in the midstream were complicated; 15.69% of the samples had a hydrochemical type of SO4·Cl–Ca. Similarly, 15.69% of the samples had the hydrochemical type of Cl·SO4–Ca. The anions downstream were stable, and nearly 66% of the samples contained Cl, SO42−, and HCO3 with a percentage of the milliequivalent concentration more than 25%. Meanwhile, the dominant cation was Ca2+.

4.3. Correlation Analysis

Pearson correlation analysis was used to discriminate the similar sources of major ions with good correlation and to understand the major hydrogeochemical processes that control the GW chemical characteristics [40]. The Pearson correlation matrices are presented in Table 3. There was a positive relationship between Na+ and SO42− with a correlation coefficient of 0.4, implying that the contribution of the dissolution of Glauber’s salt, which can be explained by Equation (11) [41]. Na+ was correlated with Cl (correlation coefficient of 0.392), indicating that the possibility of dissolution of halite. Moreover, the dissolution of albite can increase the concentration of Na+ and HCO3 (correlation coefficient of 0.383) as expressed by Equation (12) [42]. As shown in Table 3, TDS and EC were significantly correlated with Na+ (correlation coefficients were 0.467 and 0.610, respectively), demonstrating the important role of the dissolution of Glauber’s salt, halite, and albite in forming the water’s chemistry. There was a strong positive relationship between Ca2+ and Mg2+, with a correlation coefficient of 0.845, because Ca2+ and Mg2+ were the major contributors of total hardness. SO42− was significantly correlated with Mg2+ (correlation coefficient is 0.518), demonstrating the contribution of sulfur-bearing mineral dissolution to GW chemistry. Additionally, Ca2+ was also significantly correlated with SO42− (correlation coefficient of 0.366), demonstrating that the gypsum may be responsible for the source of SO42−. Moreover, Ca2+ and Mg2+ were also significantly correlated with Cl (correlation coefficients of 0.875 and 0.804, respectively), suggesting the possibility of the dissolution of halide minerals. However, Na+ was lowly correlated to Cl compared to Ca2+ and Mg2+, suggesting the contribution of cation exchange may be responsible for water chemistry. Potassium bicarbonate, as a soil acid improver, has the functions of an insect resistance and an antibacterial. It is also a kind of pesticide, which is permitted in organic agriculture. Potassium nitrate is used more frequently in economic crops such as fruit trees and vegetables, and its fertilizer efficiency is fast, and the quality of agricultural products is relatively good. Similarly, calcium nitrate is a typical fast-acting foliar fertilizer. It can act smoothly on acidic soil and has the characteristics of rapid calcium and a nitrogen supplement. It can increase fertilizer efficiency by combining with potassium fertilizer. As shown in Table 3, K+ is significantly correlated with HCO3 and NO3 (correlation coefficients of 0.452 and 0.469, respectively), and the correlation between Ca2+ and NO3 was significant (correlation coefficient is 0.483), implying that the use of pesticides and fertilizers as responsible for forming the GW chemistry.

4.4. Principal Component Analysis

Principal component analysis extracted three principal components (PCs) with eigenvalues greater than 1, and the results of PCs, variable loadings, and explained variance are presented in Table 4. The cumulative explained variance of three PCs accounted for 79.11%, suggesting that PCA efficiently reduced the dimensionality of the initial multidimensional data set. PC1 explains 49.25% of the total variance and has strong loadings on EC, Ca2+, TDS, Cl, and Mg2+, indicating the dissolution of halide minerals as the governing source of these contents. However, PC2 and PC3 account for 20.52% and 9.35% of the total variance, respectively. PC2 had a strong loading on HCO3, while PC3 was positively correlated with SO42−, implying anthropogenic activities (such as the use of pesticides and fertilizers), and the dissolution of gypsum may be the dominant sources of these ions.

4.5. Natural Processes Controlling the Formation of GW Chemistry

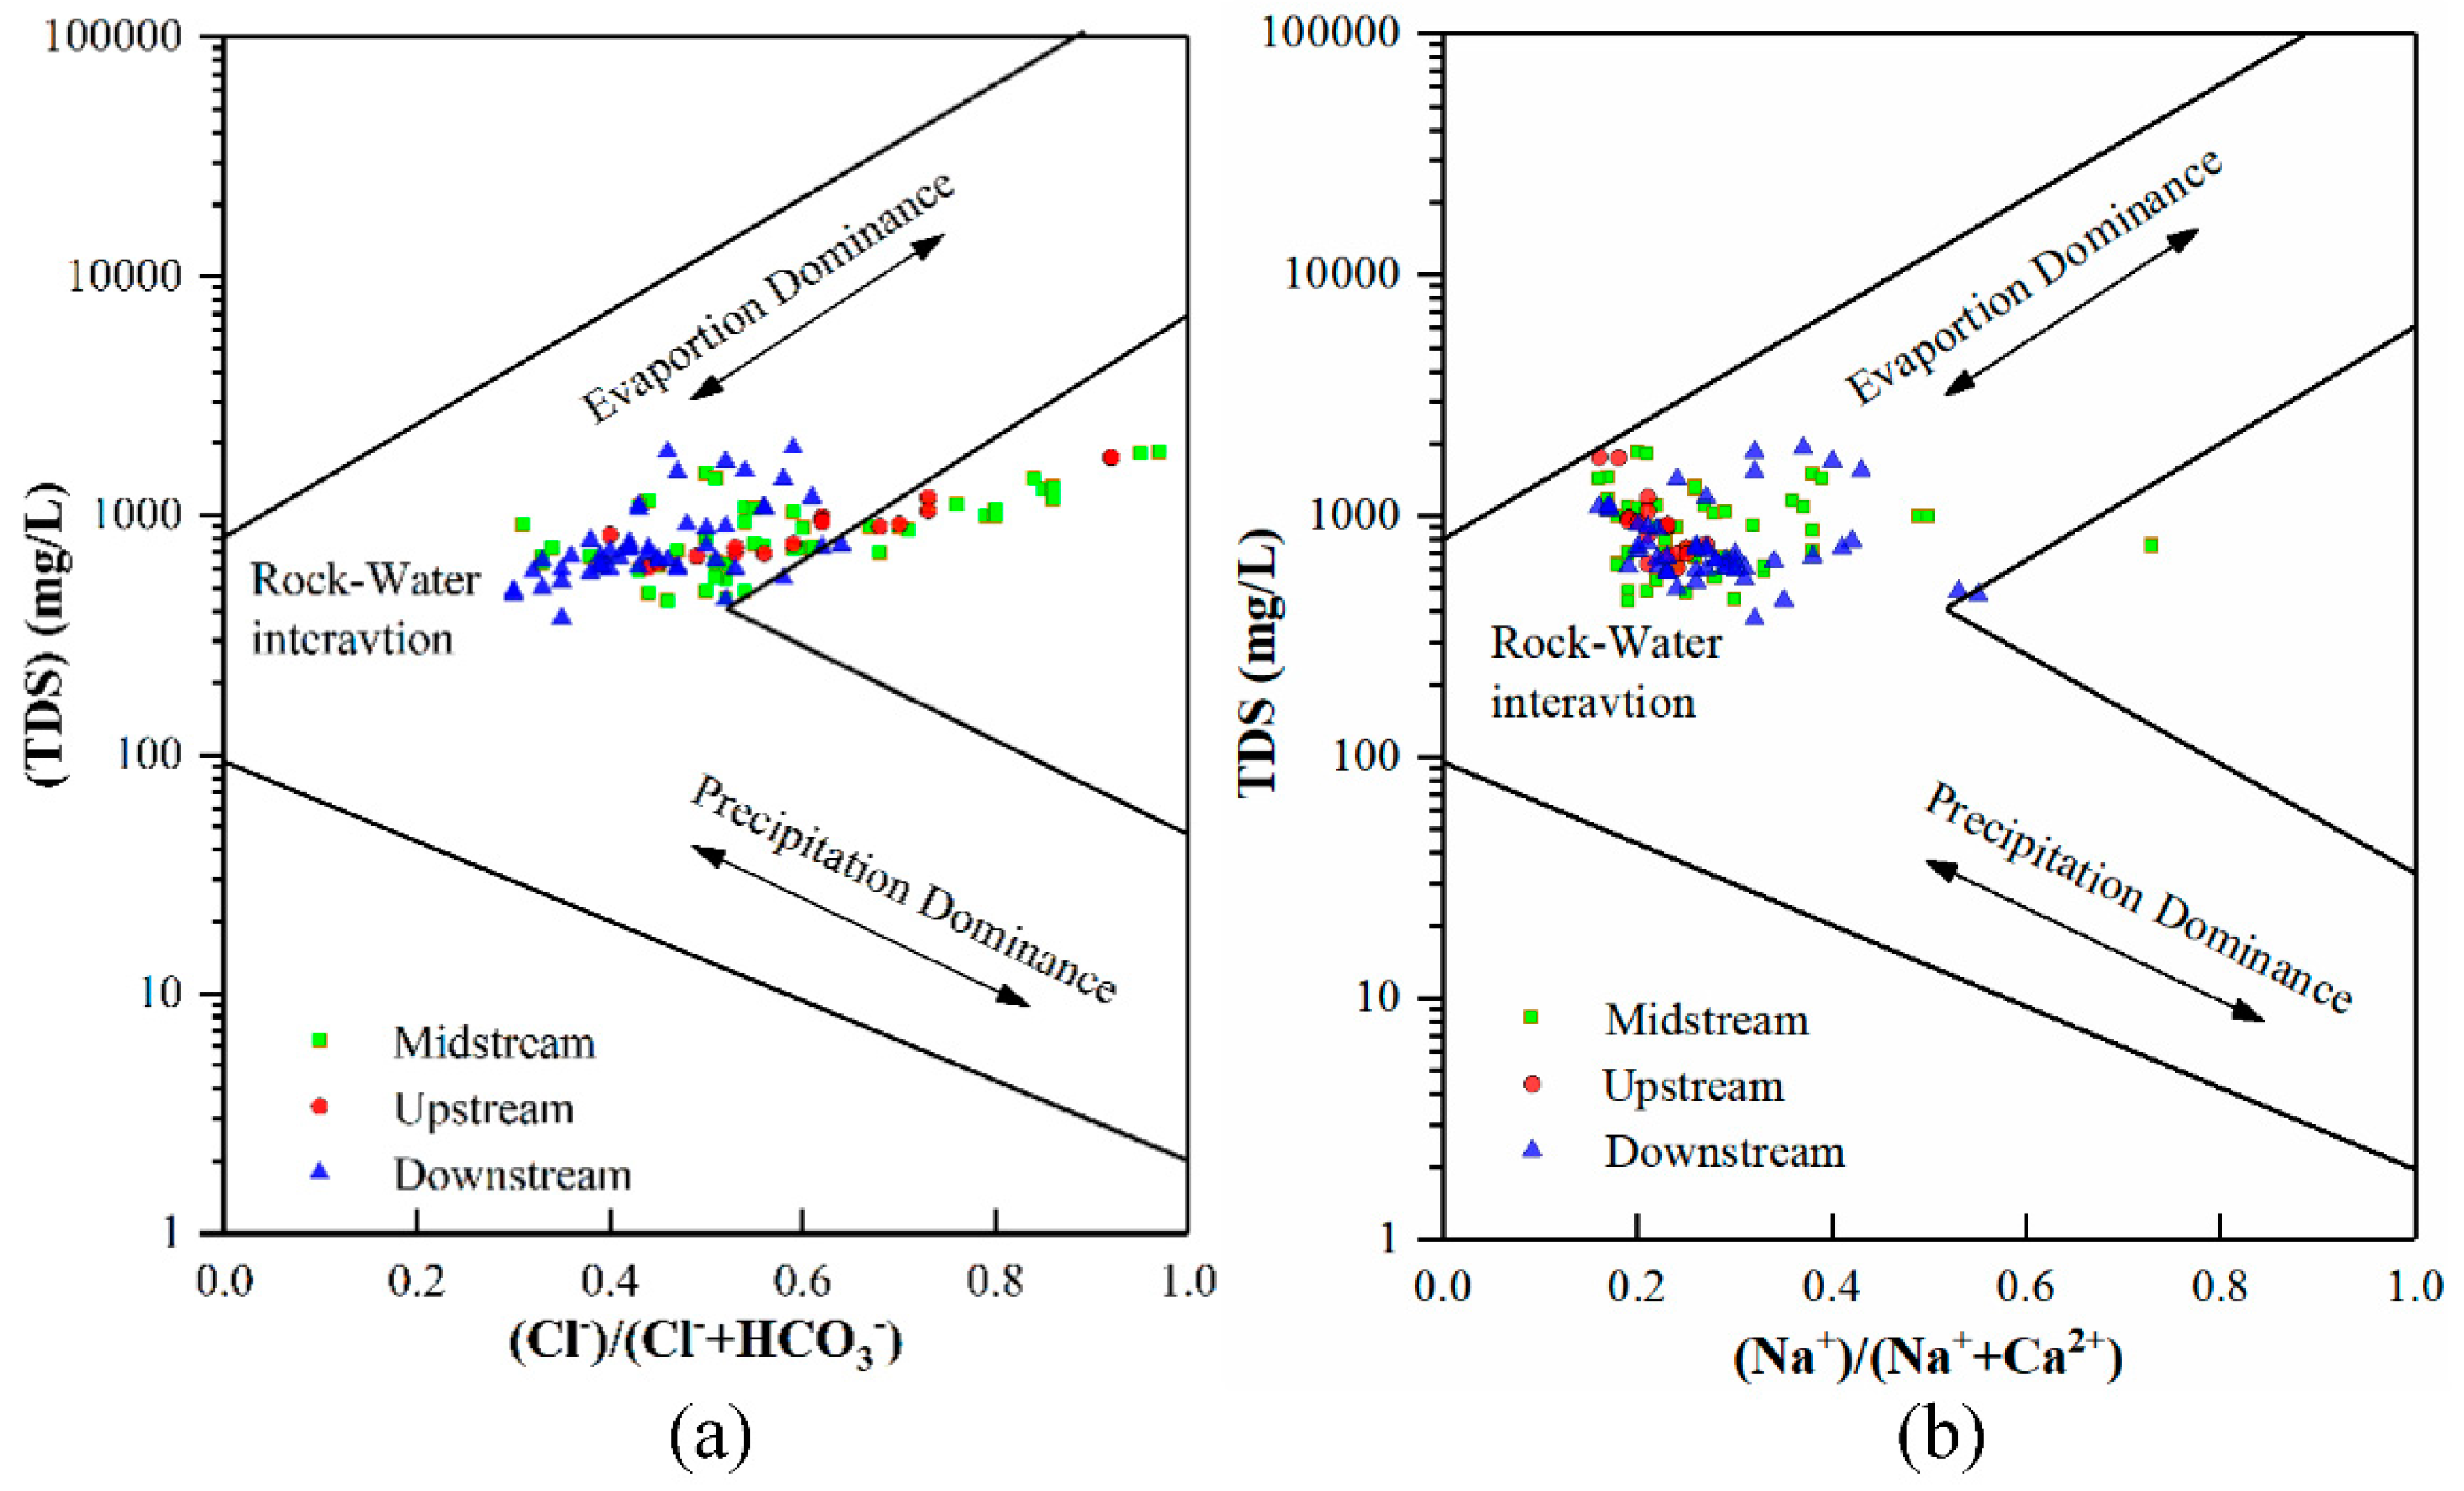
The Gibbs semi-logarithmic coordinate plot is an important method for analyzing the evolution of GW chemical components in the study area. The Gibbs diagrams help to qualitatively describe and differentiate among the three dominant processes including precipitation, evaporation, and subsurface rock weathering processes, which control the water chemistry [43]. In Figure 4a, the TDS concentration was treated as a vertical coordinate, and the horizontal coordinate was the ratio of γ(Na+)/γ(Na+ + Ca2+) or γ(Cl)/γ(Cl + HCO3). The γ represents the milliequivalent concentration (meq/L). In the current study, γ(Na+)/γ(Na+ + Ca2+) (Figure 4b) ranged from 0.16 to 0.73, while the γ(Cl)/γ(Cl + HCO3) ranged from 0.30 to 0.97. In the Gibbs diagram, most GW samples fell within the area of rock dominance, and a few of them were distributed in the middle area between rock dominance and evaporation dominance, illuminating that the concentrations of the ions were mainly affected by water–rock interactions and influenced by evaporation and crystallization to some extent. On the other hand, the relationship between TDS and γ(Na+)/γ(Na+ + Ca2+) showed that as the value of γ(Na+)/γ(Na+ + Ca2+) increased, TDS did not change much, further indicating that cation exchange also had a relevant impact on GW hydrochemistry. Some samples in the study area were scattered outside the Gibbs model and might be affected by anthropogenic activities.

4.6. Mechanisms Responsible for the Formation of GW Hydrochemistry

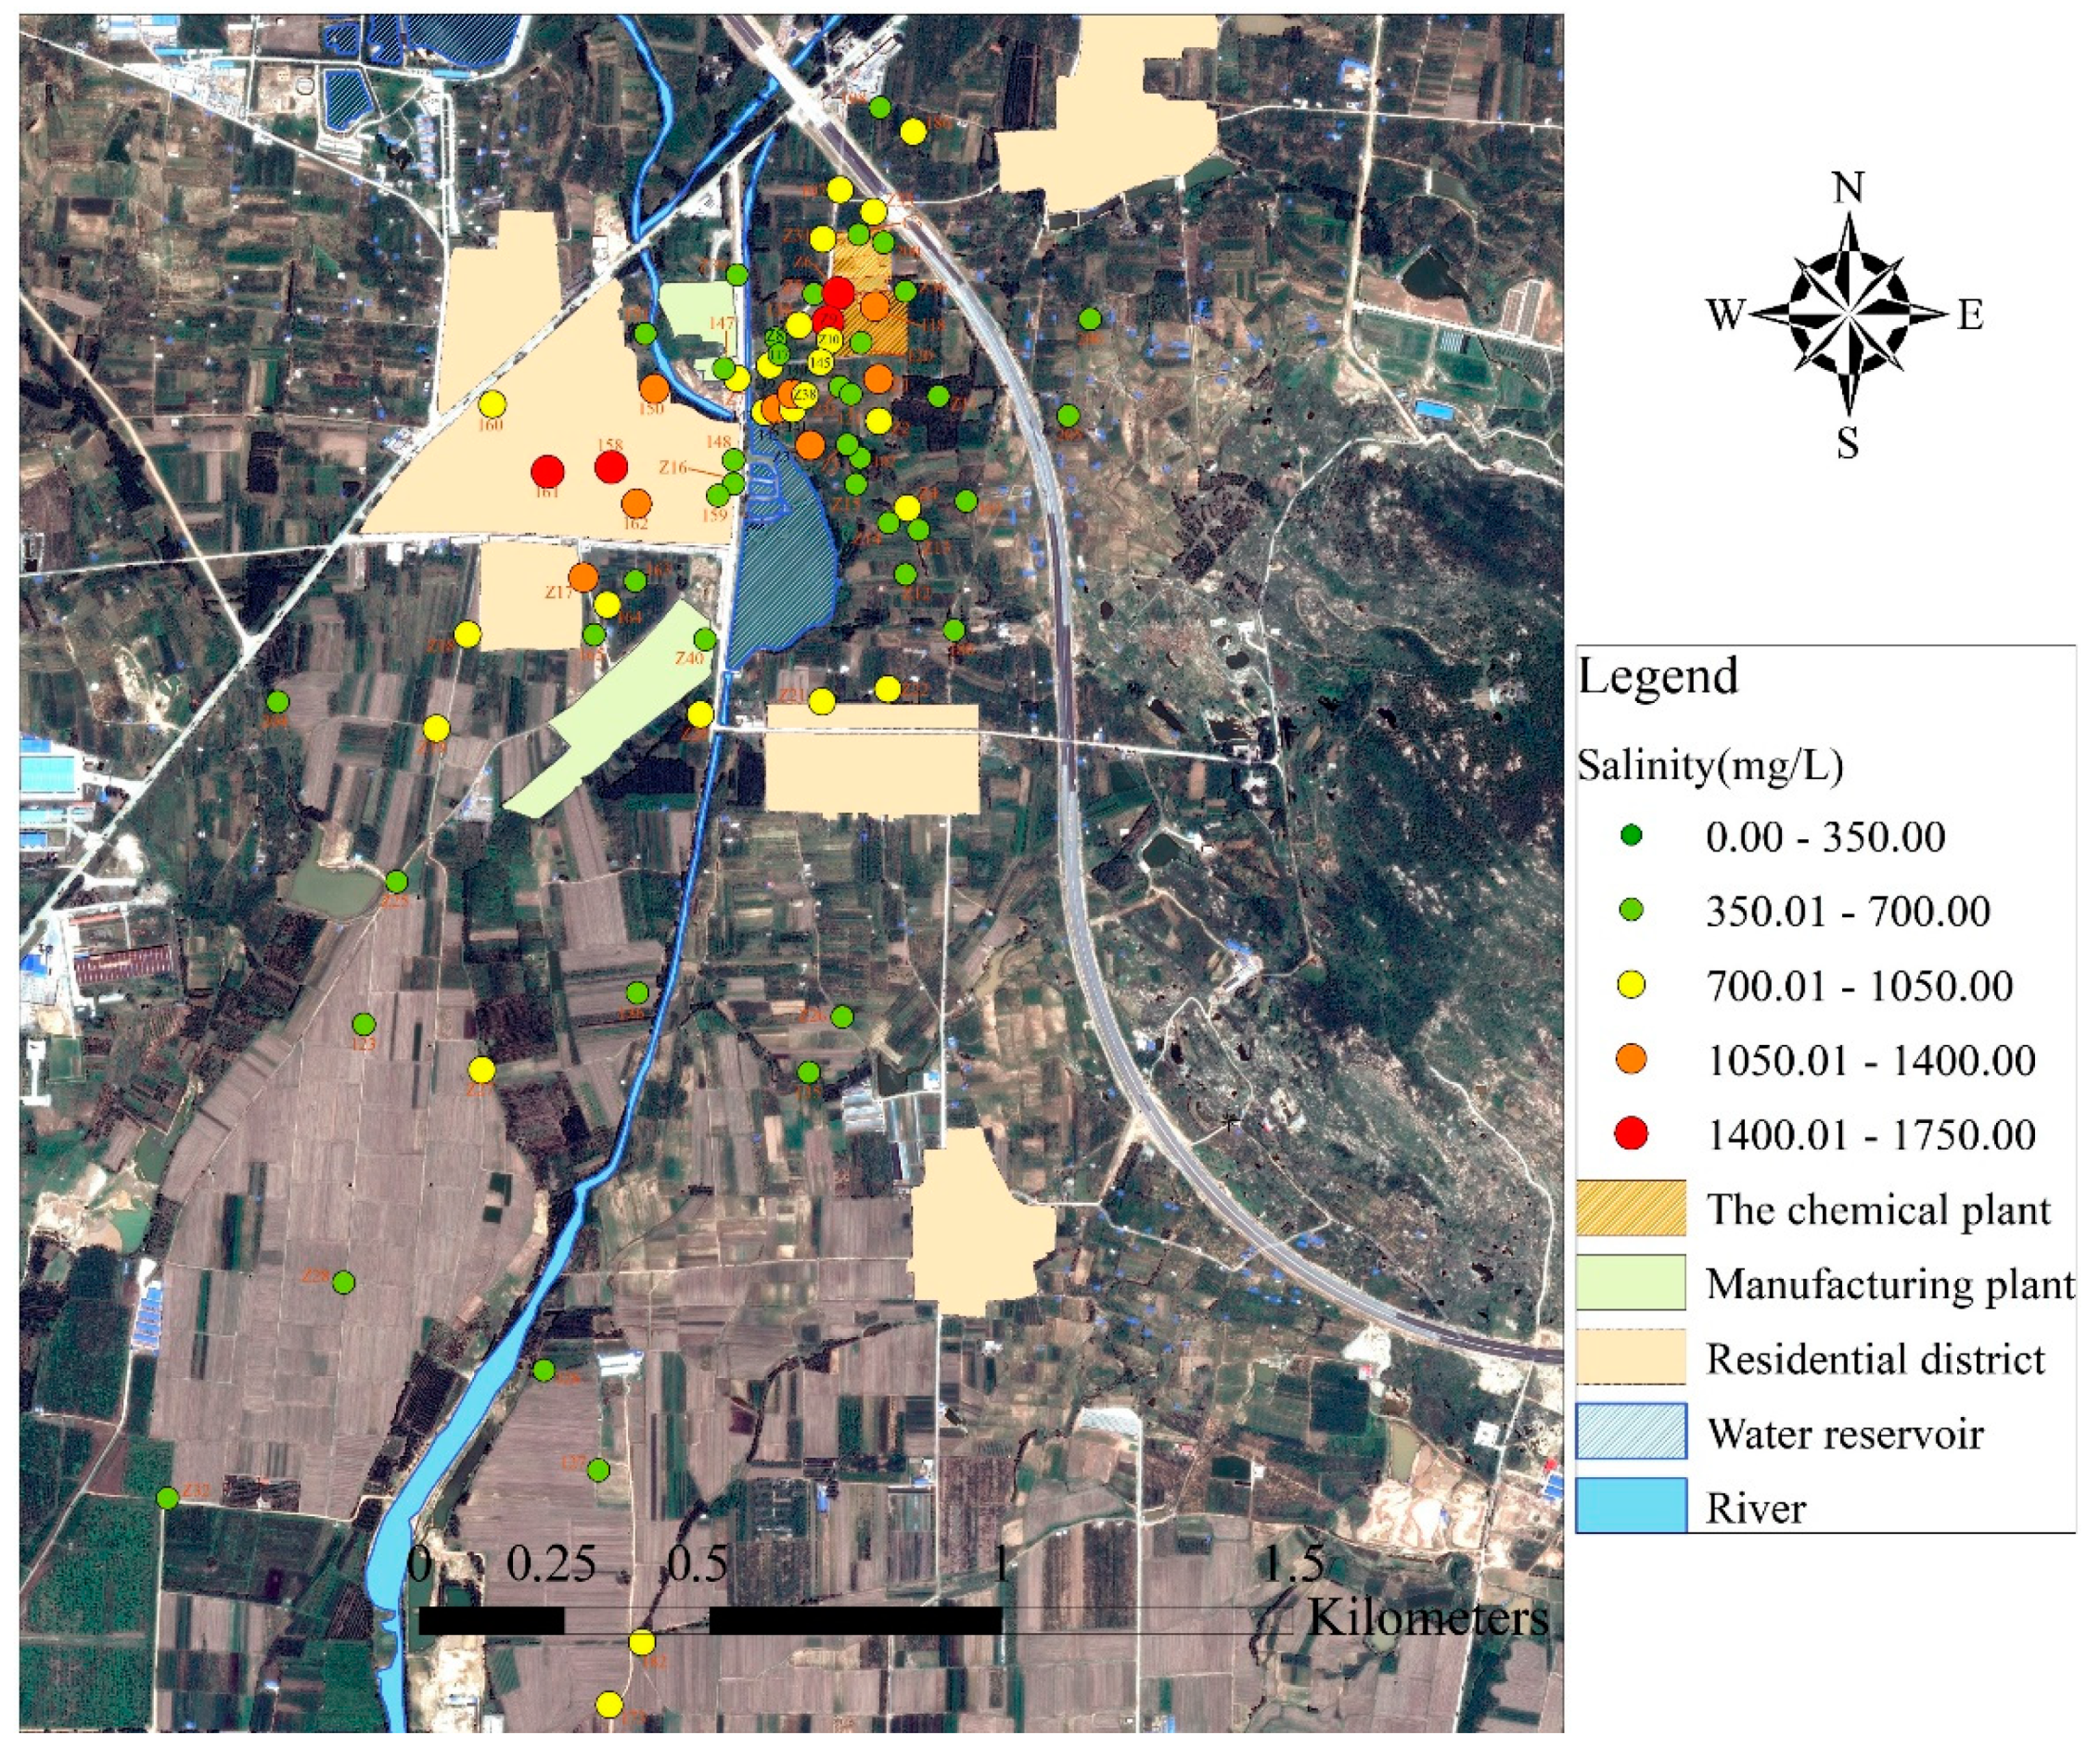
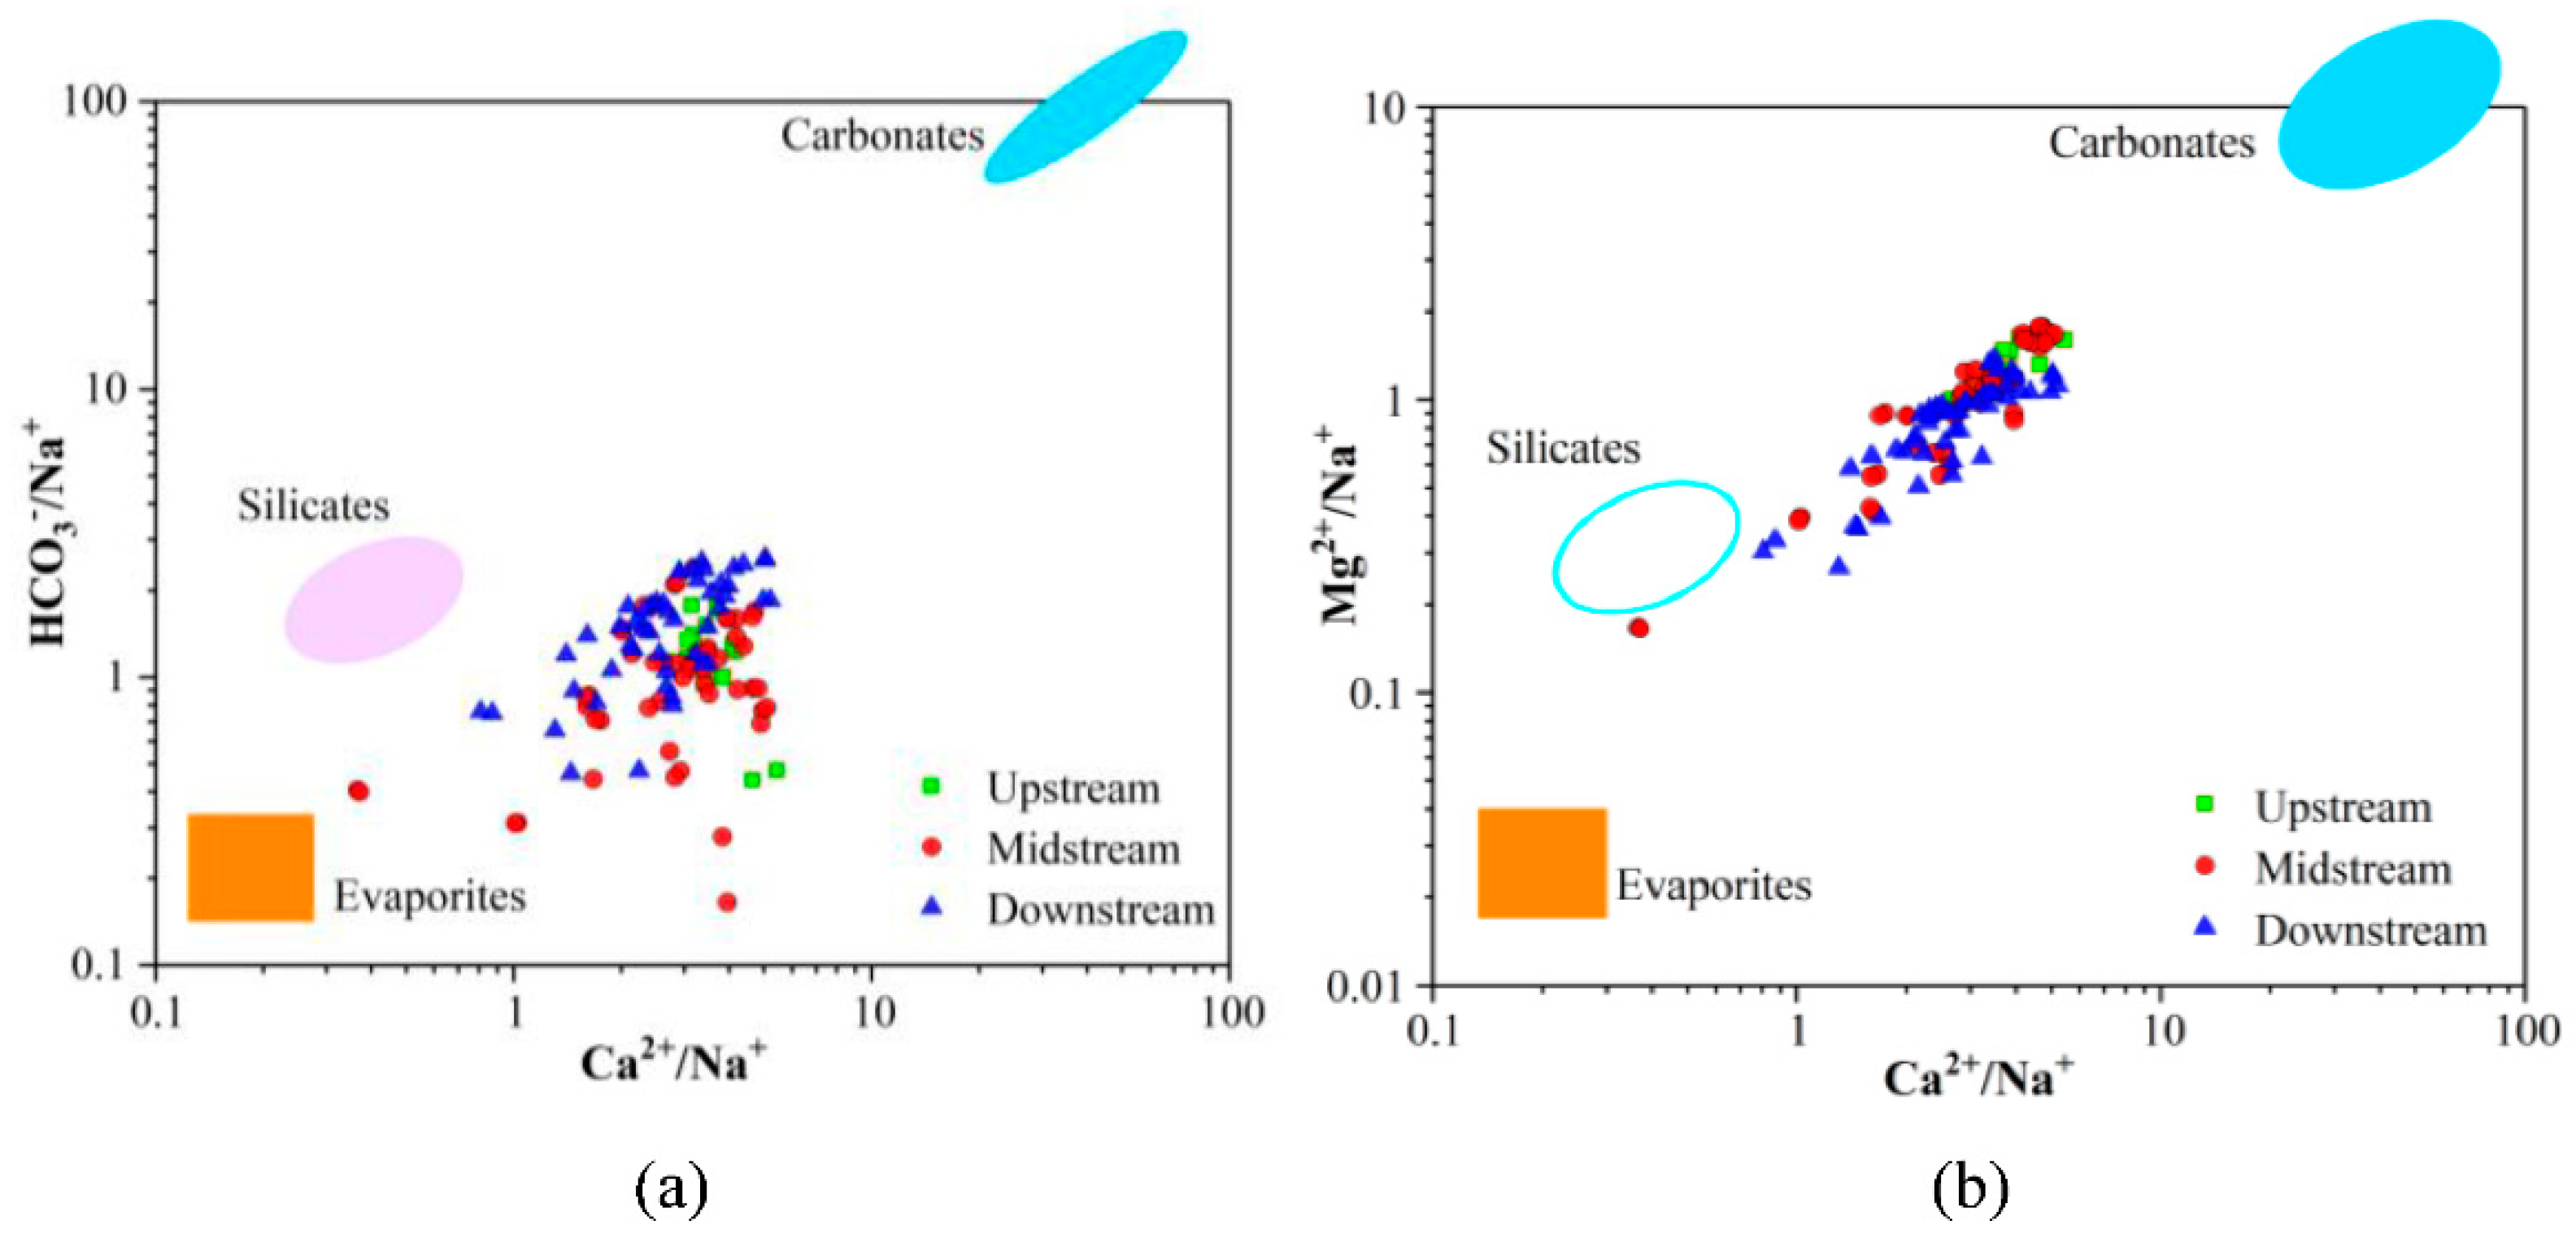
We constructed Gaillardet diagrams to further analyze the types of rock involved within the rock weathering processes driving GW hydrochemistry [44]. Figure 5 illustrates the spatial variability in GW salinity. It can be seen that the samples with high salinity were distributed where the chemical plant and residential district are located, indicating that intensive anthropogenic activities, such as discharge of industrial wastewater and domestic sewage, may result in high salinity in GW. The relationships between ions, such as Ca2+/Na+, Mg2+/Na+, and HCO3/Na+, can be used to determine the effects of carbonate, silicate, and evaporite rocks on controlling the hydrochemical compositions of GW. In the current study, the ratios of γ(Ca2+):γ(Na+), γ(Mg2+):γ(Na+), and γ(HCO3):γ(Na+) ranged between 0.37~5.43, 0.17~1.79, and 0.17~2.59, respectively. As shown in Figure 6, almost all the GW samples fell within the silicate and carbonate rock weathering field, indicating that the weathering of silicate and carbonate rock was the main source of GW chemical composition in the study area.
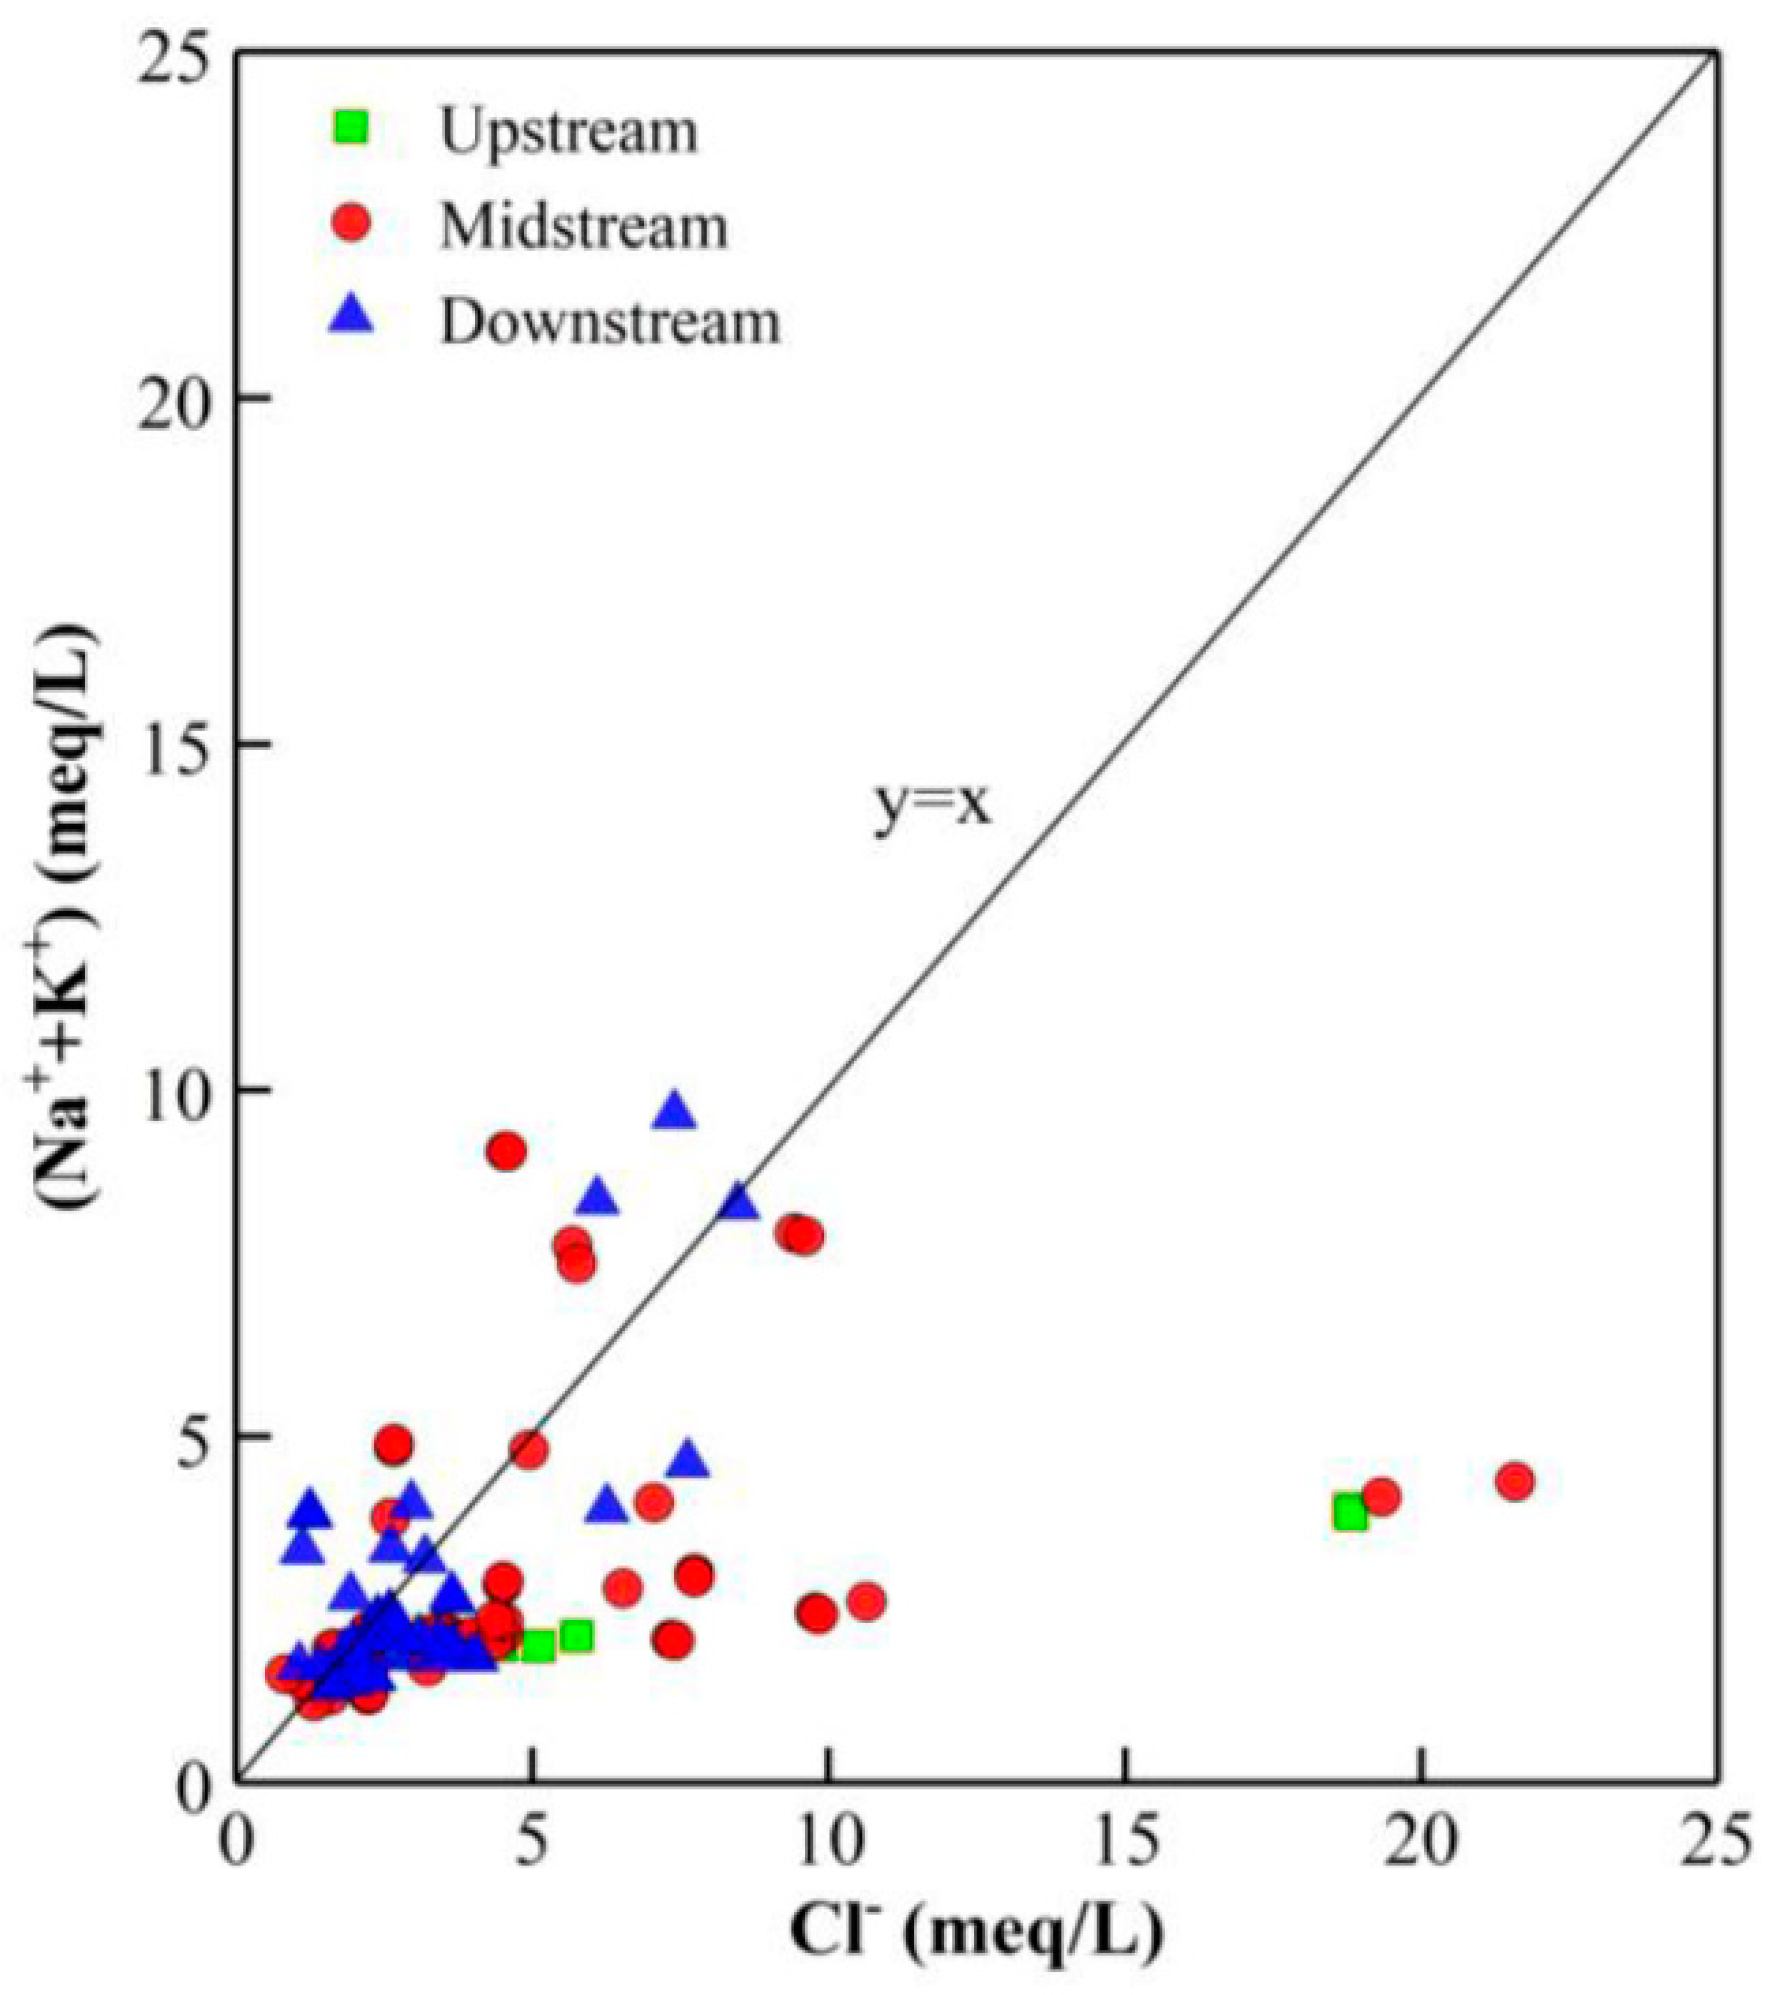
Most of the samples in upstream and downstream distributed on both sides of the y = x line in the ratio diagram of γ(K+ + Na+) and γ(Cl) (Figure 7), manifesting that the dissolution of halite accompanied with aluminosilicate minerals. The milliequivalent concentrations of Na+ and Cl were in the midstream with extremely large and irregular degrees of variation, suggesting that Na+ had other major sources apart from rock weathering.
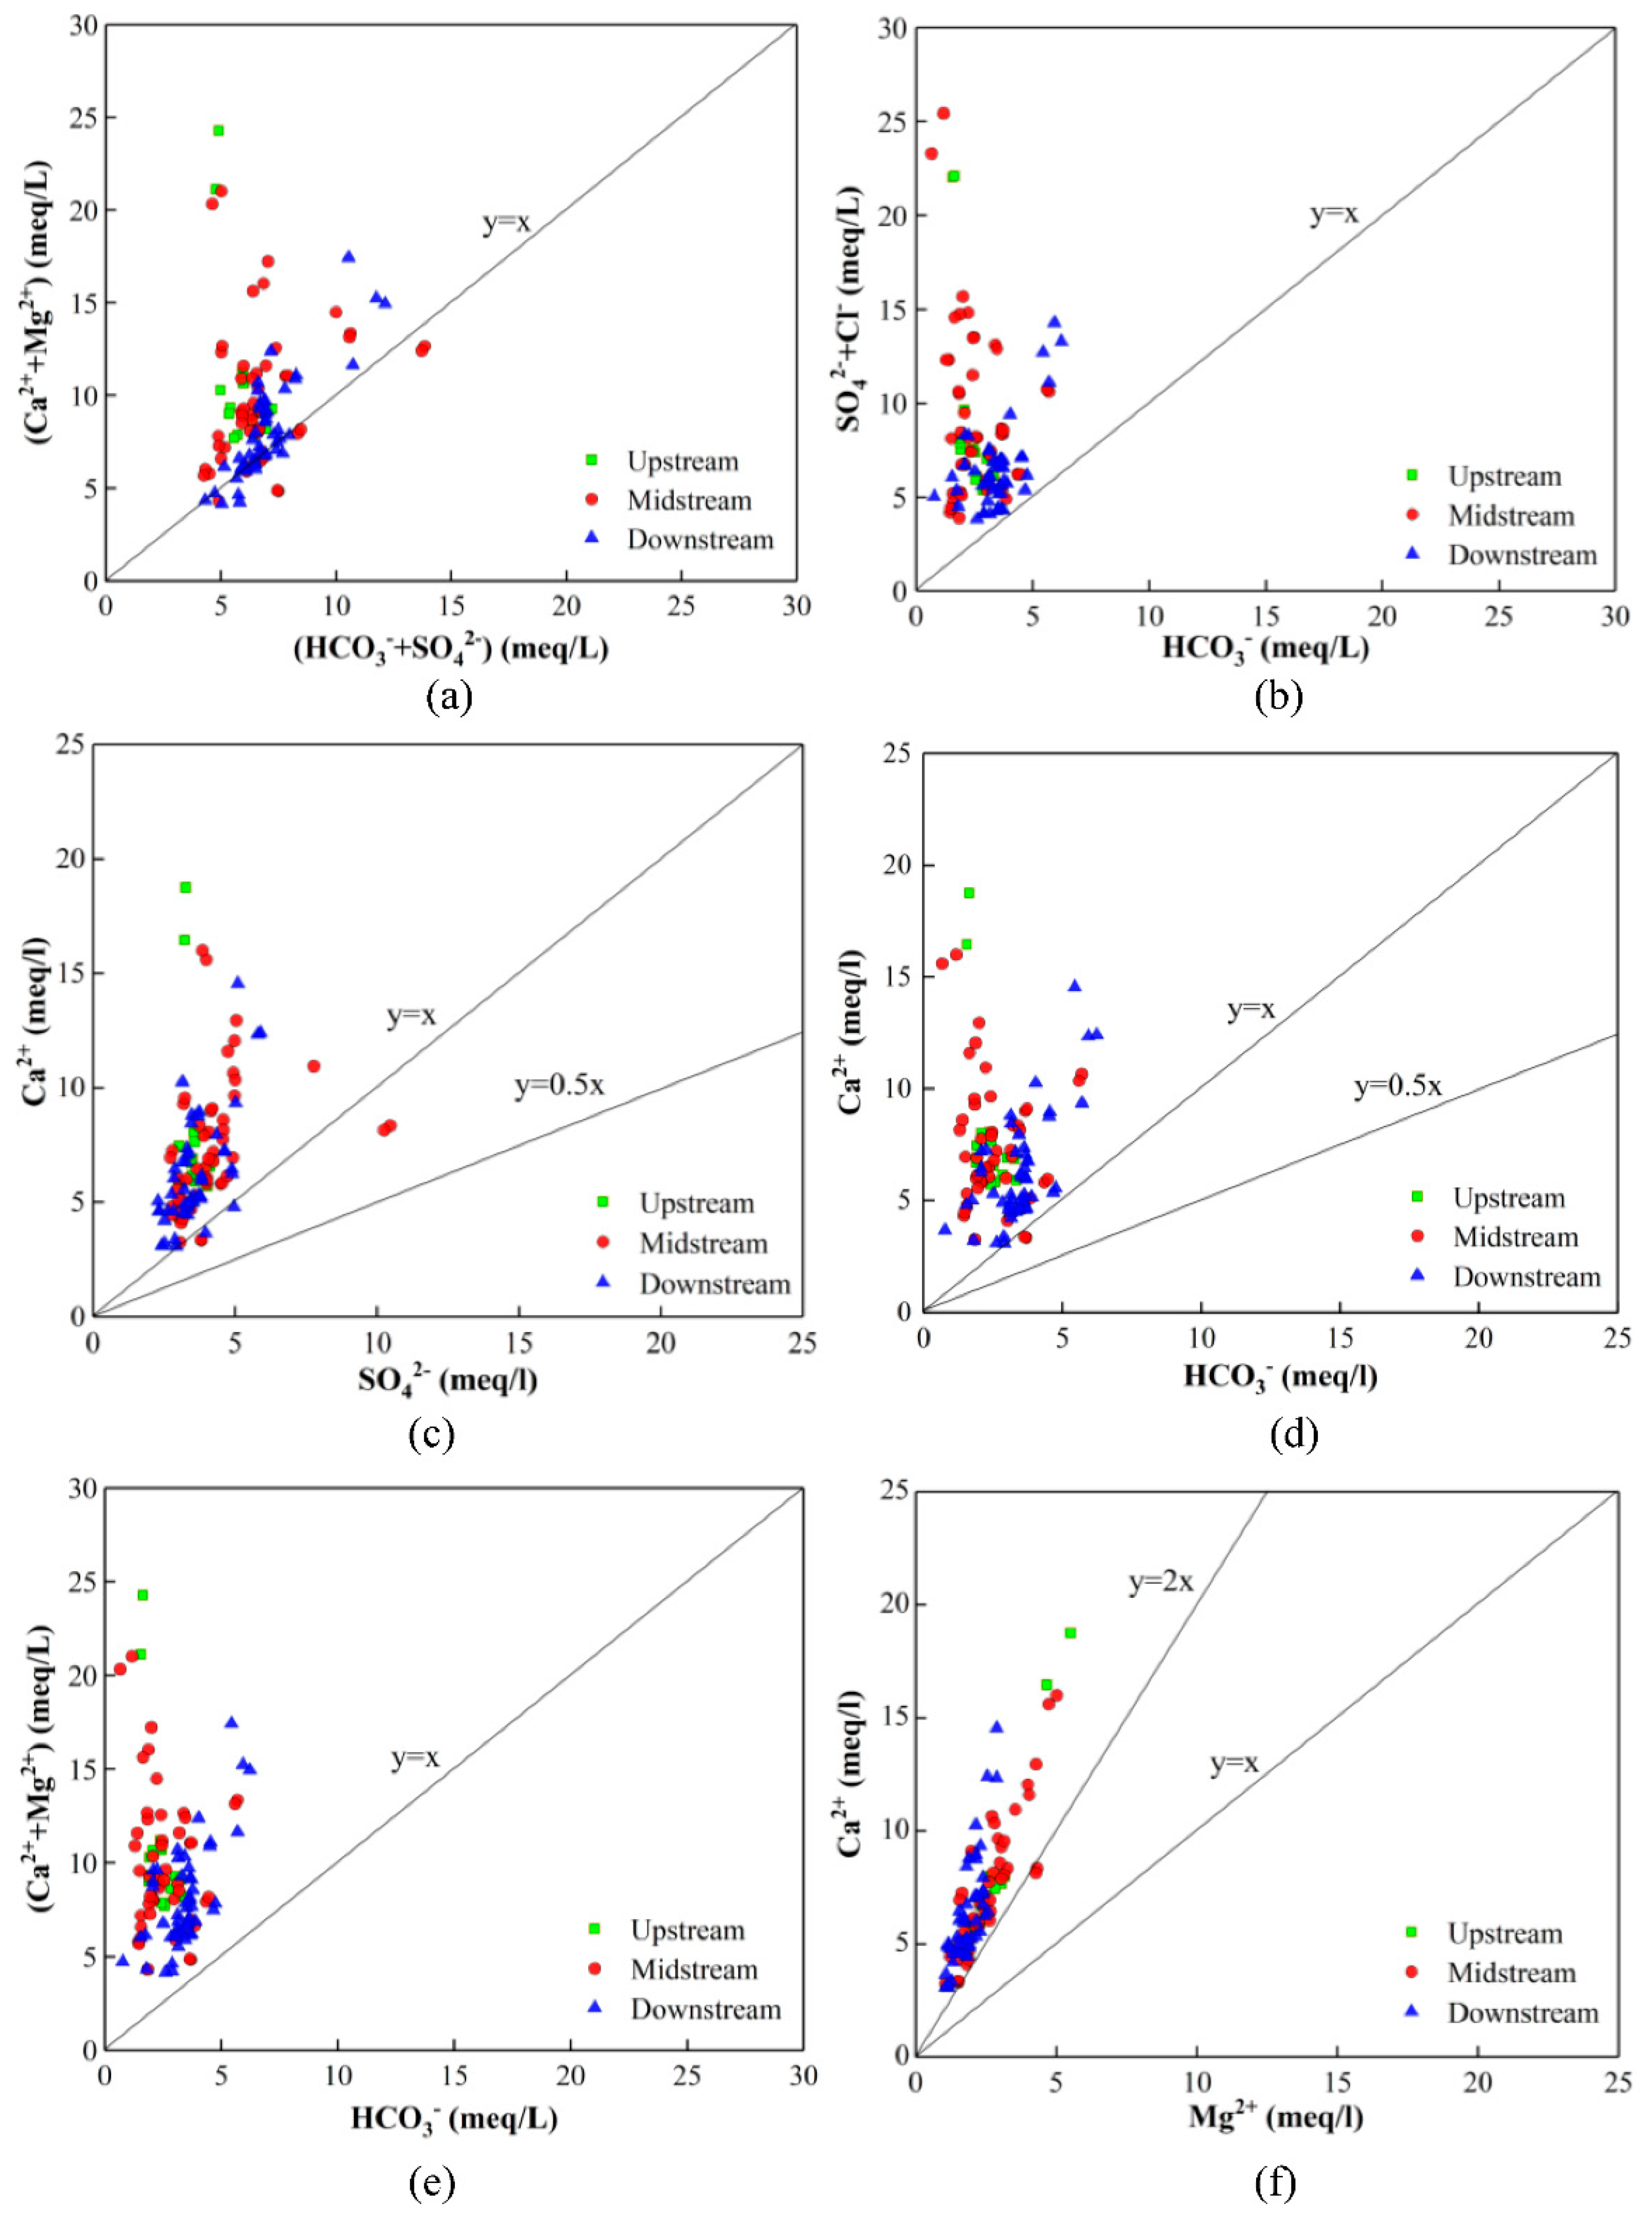
Sources of Ca2+ and Mg2+ in GW can be determined by the ratio of γ(Ca2+ + Mg2+)/γ(HCO3 + SO42−) [45]. Most of the water samples were located near the y = x line and closed to the left side (Figure 8a), which indicated that the dissolution of gypsum (CaSO4·2H2O), calcite (CaCO3), and dolomite (CaMg(CO3)2) was an important factor affecting the hydrochemical compositions of GW. The main reactions were as per Equations (5)–(8). Simultaneously, the positions of water samples were located above the line of γ(Ca2+ + Mg2+)/γ(HCO3 + SO42−) = 1, indicating the presence of the cation exchange process (Equation (9)). In contrast, the water samples were located below the y = x line, representing the presence of the reverse cation exchange process (Equation (10)).
CaSO 4 · 2 H 2 O = Ca 2 + + SO 4 2 + 2 H 2 O
CaCO 3 + H 2 O + CO 2 = Ca 2 + + 2 HCO 3
CaMg ( CO 3 ) 2 + 2 H 2 O + 2 CO 2 = Ca 2 + + Mg 2 + + 4 HCO 3
2 Ca ( AlSiO 4 ) 2 + 6 H 2 O + 4 CO 2 = 2 Ca 2 + + 2 Al 2 Si 2 O 5 ( OH ) 4 + 4 HCO 3
CaX 2 + 2 Na + Ca 2 + + 2 NaX
2 NaX + Ca 2 + 2 Na + + CaX 2
Na 2 SO 4 · 10 H 2 O = 2 Na + + SO 4 2 + 10 H 2 O
2 NaAlSi 3 O 8 + 2 CO 2 + 11 H 2 O = Al 2 Si 2 O 5 ( OH ) 4 + 4 H 4 SiO 4 + 2 Na + + 2 HCO 3
It can be seen from Figure 8b that the sample points were all located above the line of γ(SO42− + Cl)/γ(HCO3) = 1, demonstrating that weathering and dissolution of evaporite (i.e., halite and gypsum) were the main sources of SO42−. A simultaneous increase in SO42− and Ca2+ in GW was caused by the dissolution of gypsum according to Equation (5) [46]. There was a good positive correlation between SO42− and Ca2+, but most sampling points were located above the line of γ(Ca2+):γ(SO42−) = 1 (Figure 8c), the concentration of Ca2+ was greater than SO42−, implying that a small portion Ca2+ might come from the dissolution of silicate (Equation (8)), calcite, or dolomite [47]. Industrial and agricultural activities can also lead to elevated levels of Ca2+ and SO42− in GW. A ratio of γ(Ca2+):γ(HCO3) = 1 (Figure 8d) indicates the dissolution of calcite, while a ratio of 1:2 indicates dolomite dissolution. Some samples did fall in the zone related to y = x and between the y = x and y = 0.5x relationship line, indicating that carbonate minerals contributed to the evolution of GW hydrochemistry. However, most samples were located above the y = x line, confirming that the weathering of calcite and dolomite were not the dominant process. Similarly, all sample points fell above the line of γ(Ca2+ + Mg2+):γ(HCO3) = 1 (Figure 8e), further demonstrating that the reactions involving dissolution of carbonate minerals were not dominant [23]. The ratio of γ(Ca2+):γ(Mg2+) (Figure 8f) has also been widely used to study the dissolution of major minerals. When the sample points fall above the line of γ(Ca2+):γ(Mg2+) = 2, it indicates that the dissolution of silicate drives the GW hydrochemistry, while those that lie between the y = 2x and y = x lines are influenced by calcite. Two sample points in the midstream were situated between the y = x and the y = 2x line, manifesting that the dissolution of calcite has occurred. On the contrary, most of the samples were located above the line of γ(Ca2+):γ(Mg2+) = 2, showing that the dissolution of silicate was the primary process affecting GW hydrochemistry.
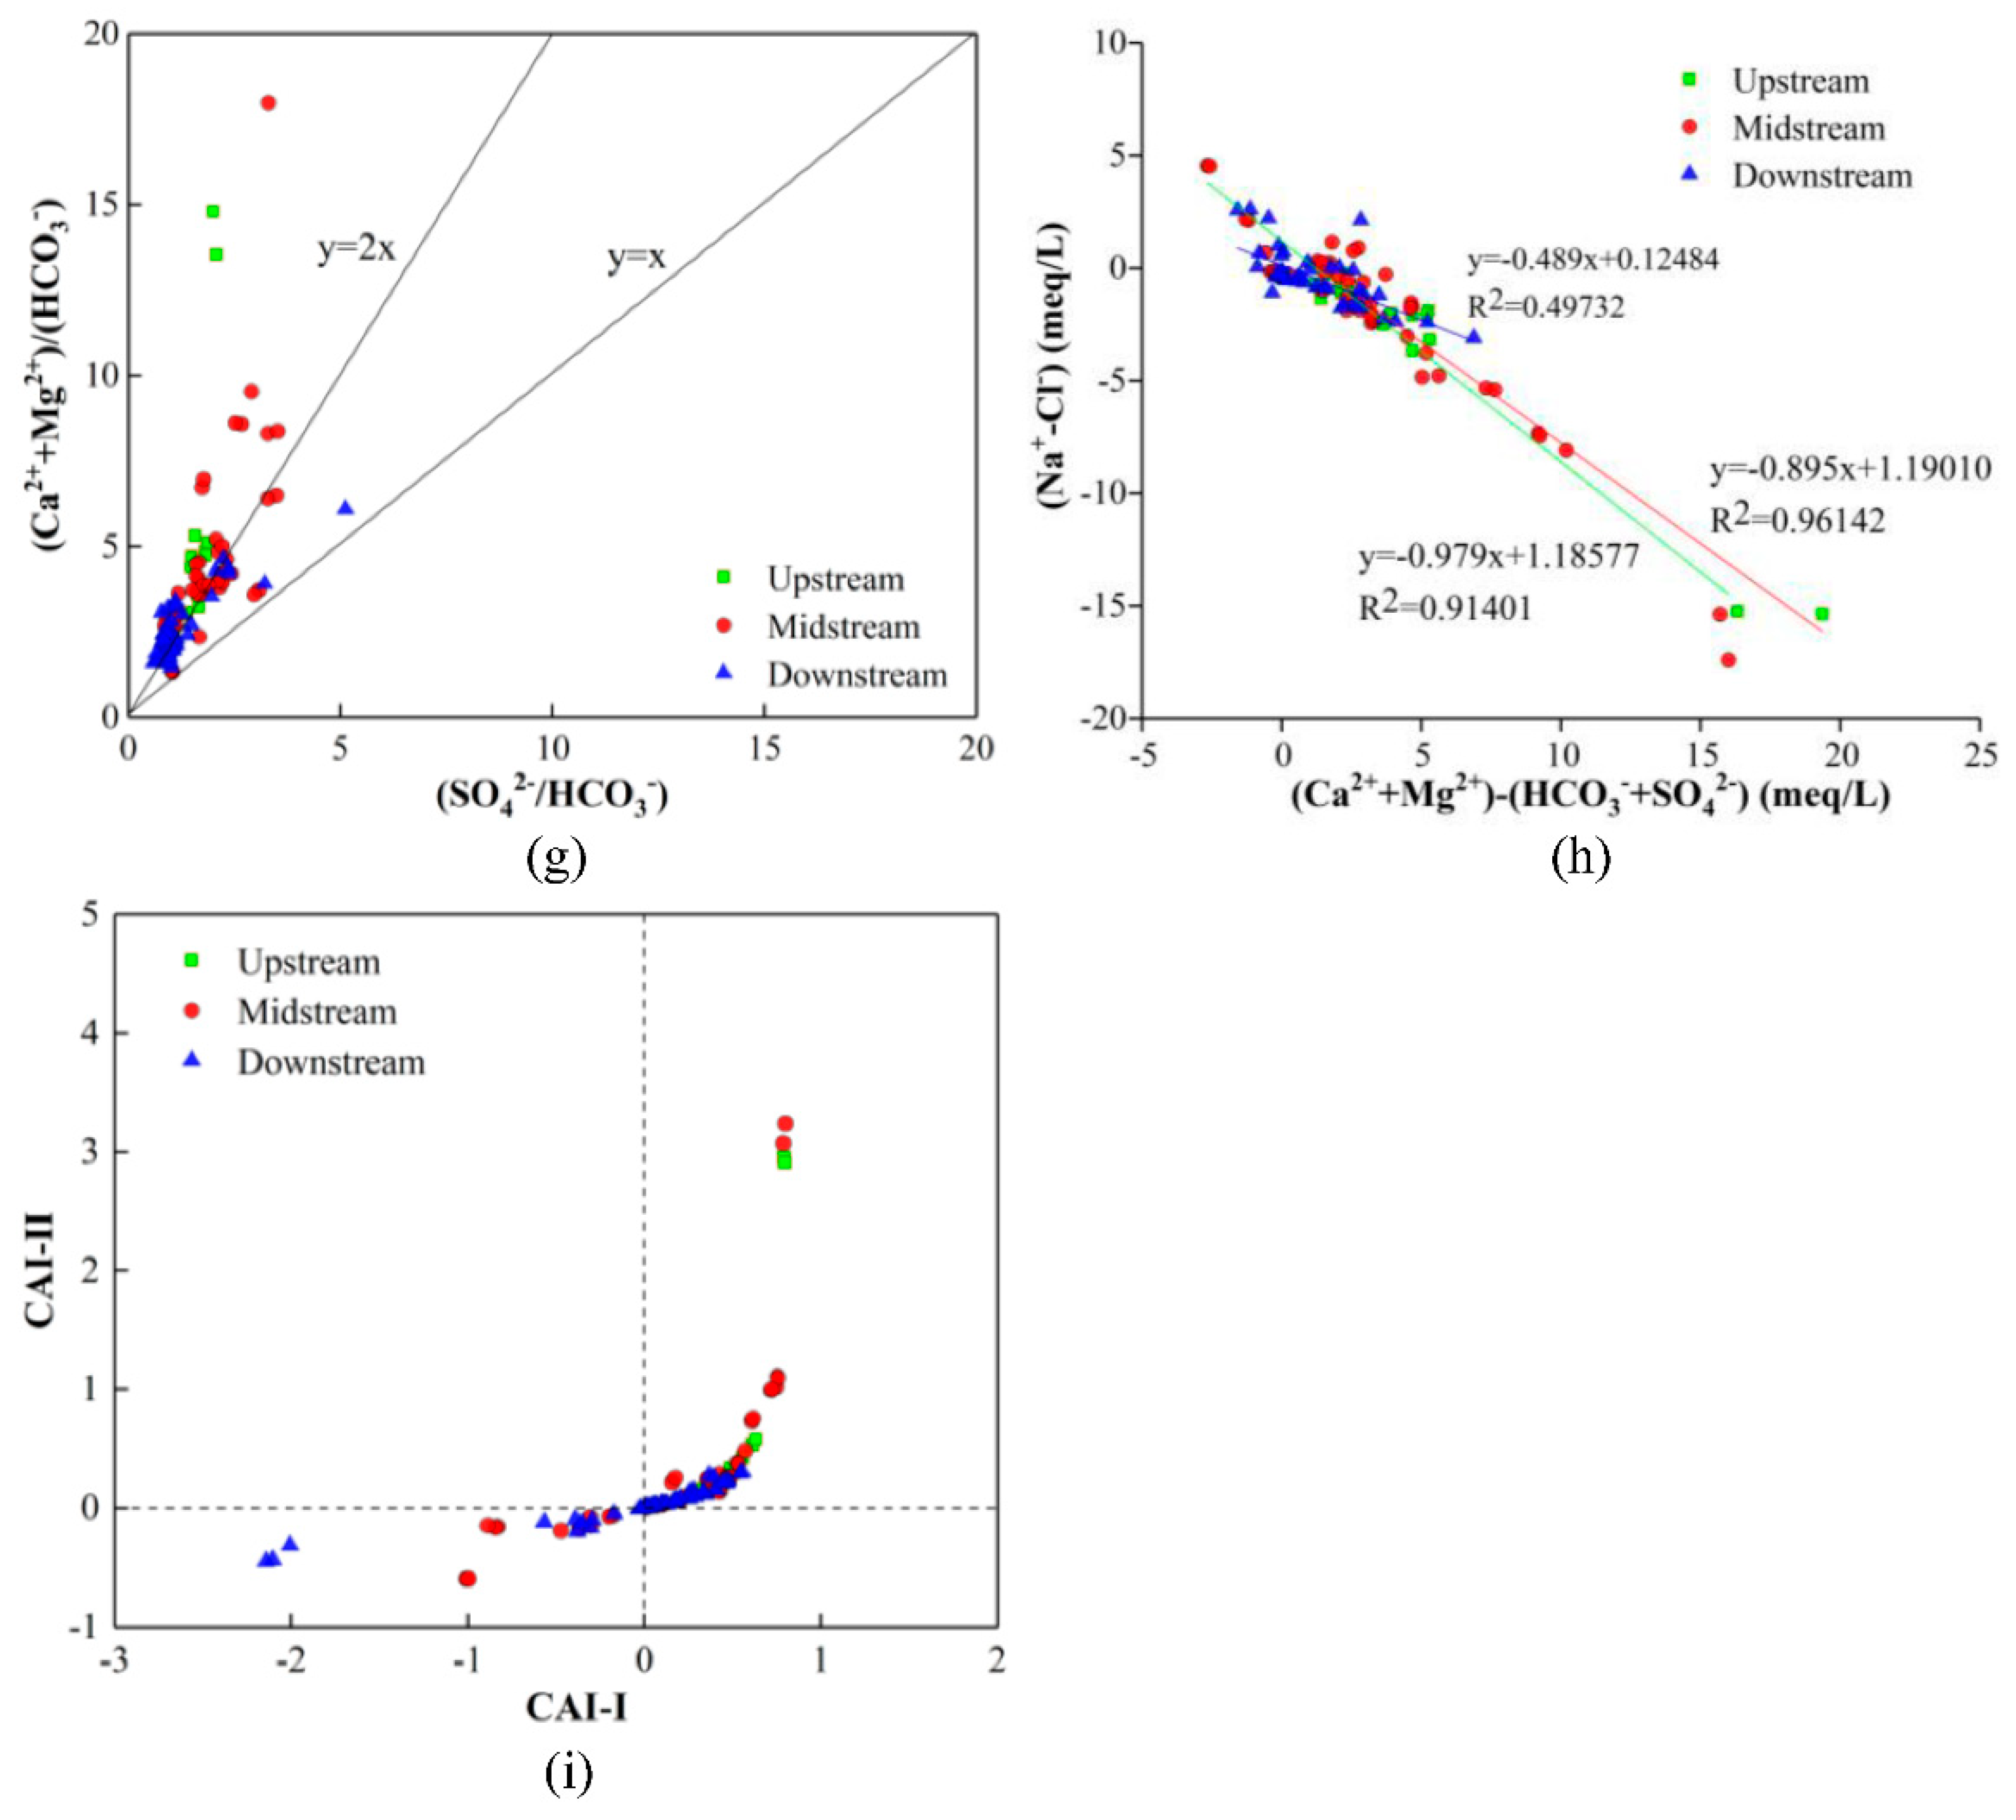
γ((Ca2+ + Mg2+)/(HCO3))/γ(SO42−/HCO3) can be calculated to further analyze the dissolution of carbonate rocks in GW by carbonic and sulfuric acid. When the ratio was 2, both sulfuric and carbonic acid were involved in the dissolution process of carbonate minerals, while only carbonic acid was involved in the dissolution process of carbonate minerals under the condition of the ratio being one. It can be seen from Figure 8g that 71.19% of the samples were located above the y = 2x line, which indicates that sulfuric acid and carbonic acid were involved in the dissolution of carbonate minerals in the study area. Furthermore, the contribution of carbonic acid was significantly more than that of sulfuric acid. The remaining water samples mainly existed between the y = 2x line and the y = x line.
Under certain conditions, some cations in the GW were adsorbed by rock and soil particles. Similarly, rock and soil particles converted some of their cations into components in GW [48]. The plot of γ(Na+ − Cl) against γ(Ca2+ + Mg2+) − (SO42− + HCO3) was useful for evaluating the possible role of ion exchange in the GW chemical compositions. If the ion exchange was the main controlling process of the GW composition, the relationship between these two composite parameters was linear with a slope of −1. The plot (Figure 8h) showed that a plot with a slope of −0.489, −0.895, and −0.979 for downstream, upstream, and midstream aquifers, respectively, implied that a high level of ion exchange reaction mostly occurred in the upstream and midstream aquifers.
The chloride alkalinity index, proposed by Schoeller, can be used to reflect cation exchange between GW and an aquifer [49]. CAI-I and CAI-II were calculated by Equations (13) and (14). When CAI-I > 0 and CAI-II > 0, the Na+ and K+ in the GW will exchange with the Ca2+ and Mg2+ in the aquifer, and the contents of Ca2+ and Mg2+ will increase. Conversely, when CAI-I and CAI-II are negative, Na+ and K+ in the aquifer exchange with Ca2+ and Mg2+ in the GW [50]. The absolute values of A and B are positively correlated with the cation exchange intensity. The results (Figure 8i) showed that Na+ and K+ might have been exchanged by Ca2+ and Mg2+ from the aquifer, and accompanied with a higher degree of cation exchange, as the Schoeller indices of most samples were positive.
CAI - I = Cl ( Na + + K + ) Cl
CAI - II = Cl ( Na + + K + ) SO 4 2 + HCO 3 + CO 3 2 + NO 3

4.7. Detection of Components in Soil

Since the land types around the small chemical plant belong to agricultural land, “Soil Environmental Quality Soil Pollution Risk Control Standard for Agricultural Land” GB15618-2018 and GB36600-2018 were used as references. The detected characteristic pollutants were mainly carbon tetrachloride, chloroform, trichloroethylene, and trichlorofluoromethane. Carbon tetrachloride was detected in all three sampling points, and the detection rate was as high as 48%. In contrast, the detection values of four characteristic organic pollutants were less than the control value in the risk control standard of soil pollution in construction land, so there was no analysis of organic pollution about soil. Among the 25 samples in the three sampling wells, 16 samples of organic matter were detected, with a detection rate of 64%. The detection value was approximately between 1 and 17 g/kg, with an average of 5 g/kg. The maximum value occurred in the surface miscellaneous fill at the sewage well. Nine samples were not detected: one of them was located at the surface backfill (0.5 m depth) of the Z34 sampling well and the others were at the bottom of three sampling wells. According to the standard deviation of the organic matter contents in 25 samples, there was a certain degree of instability in space and depth.
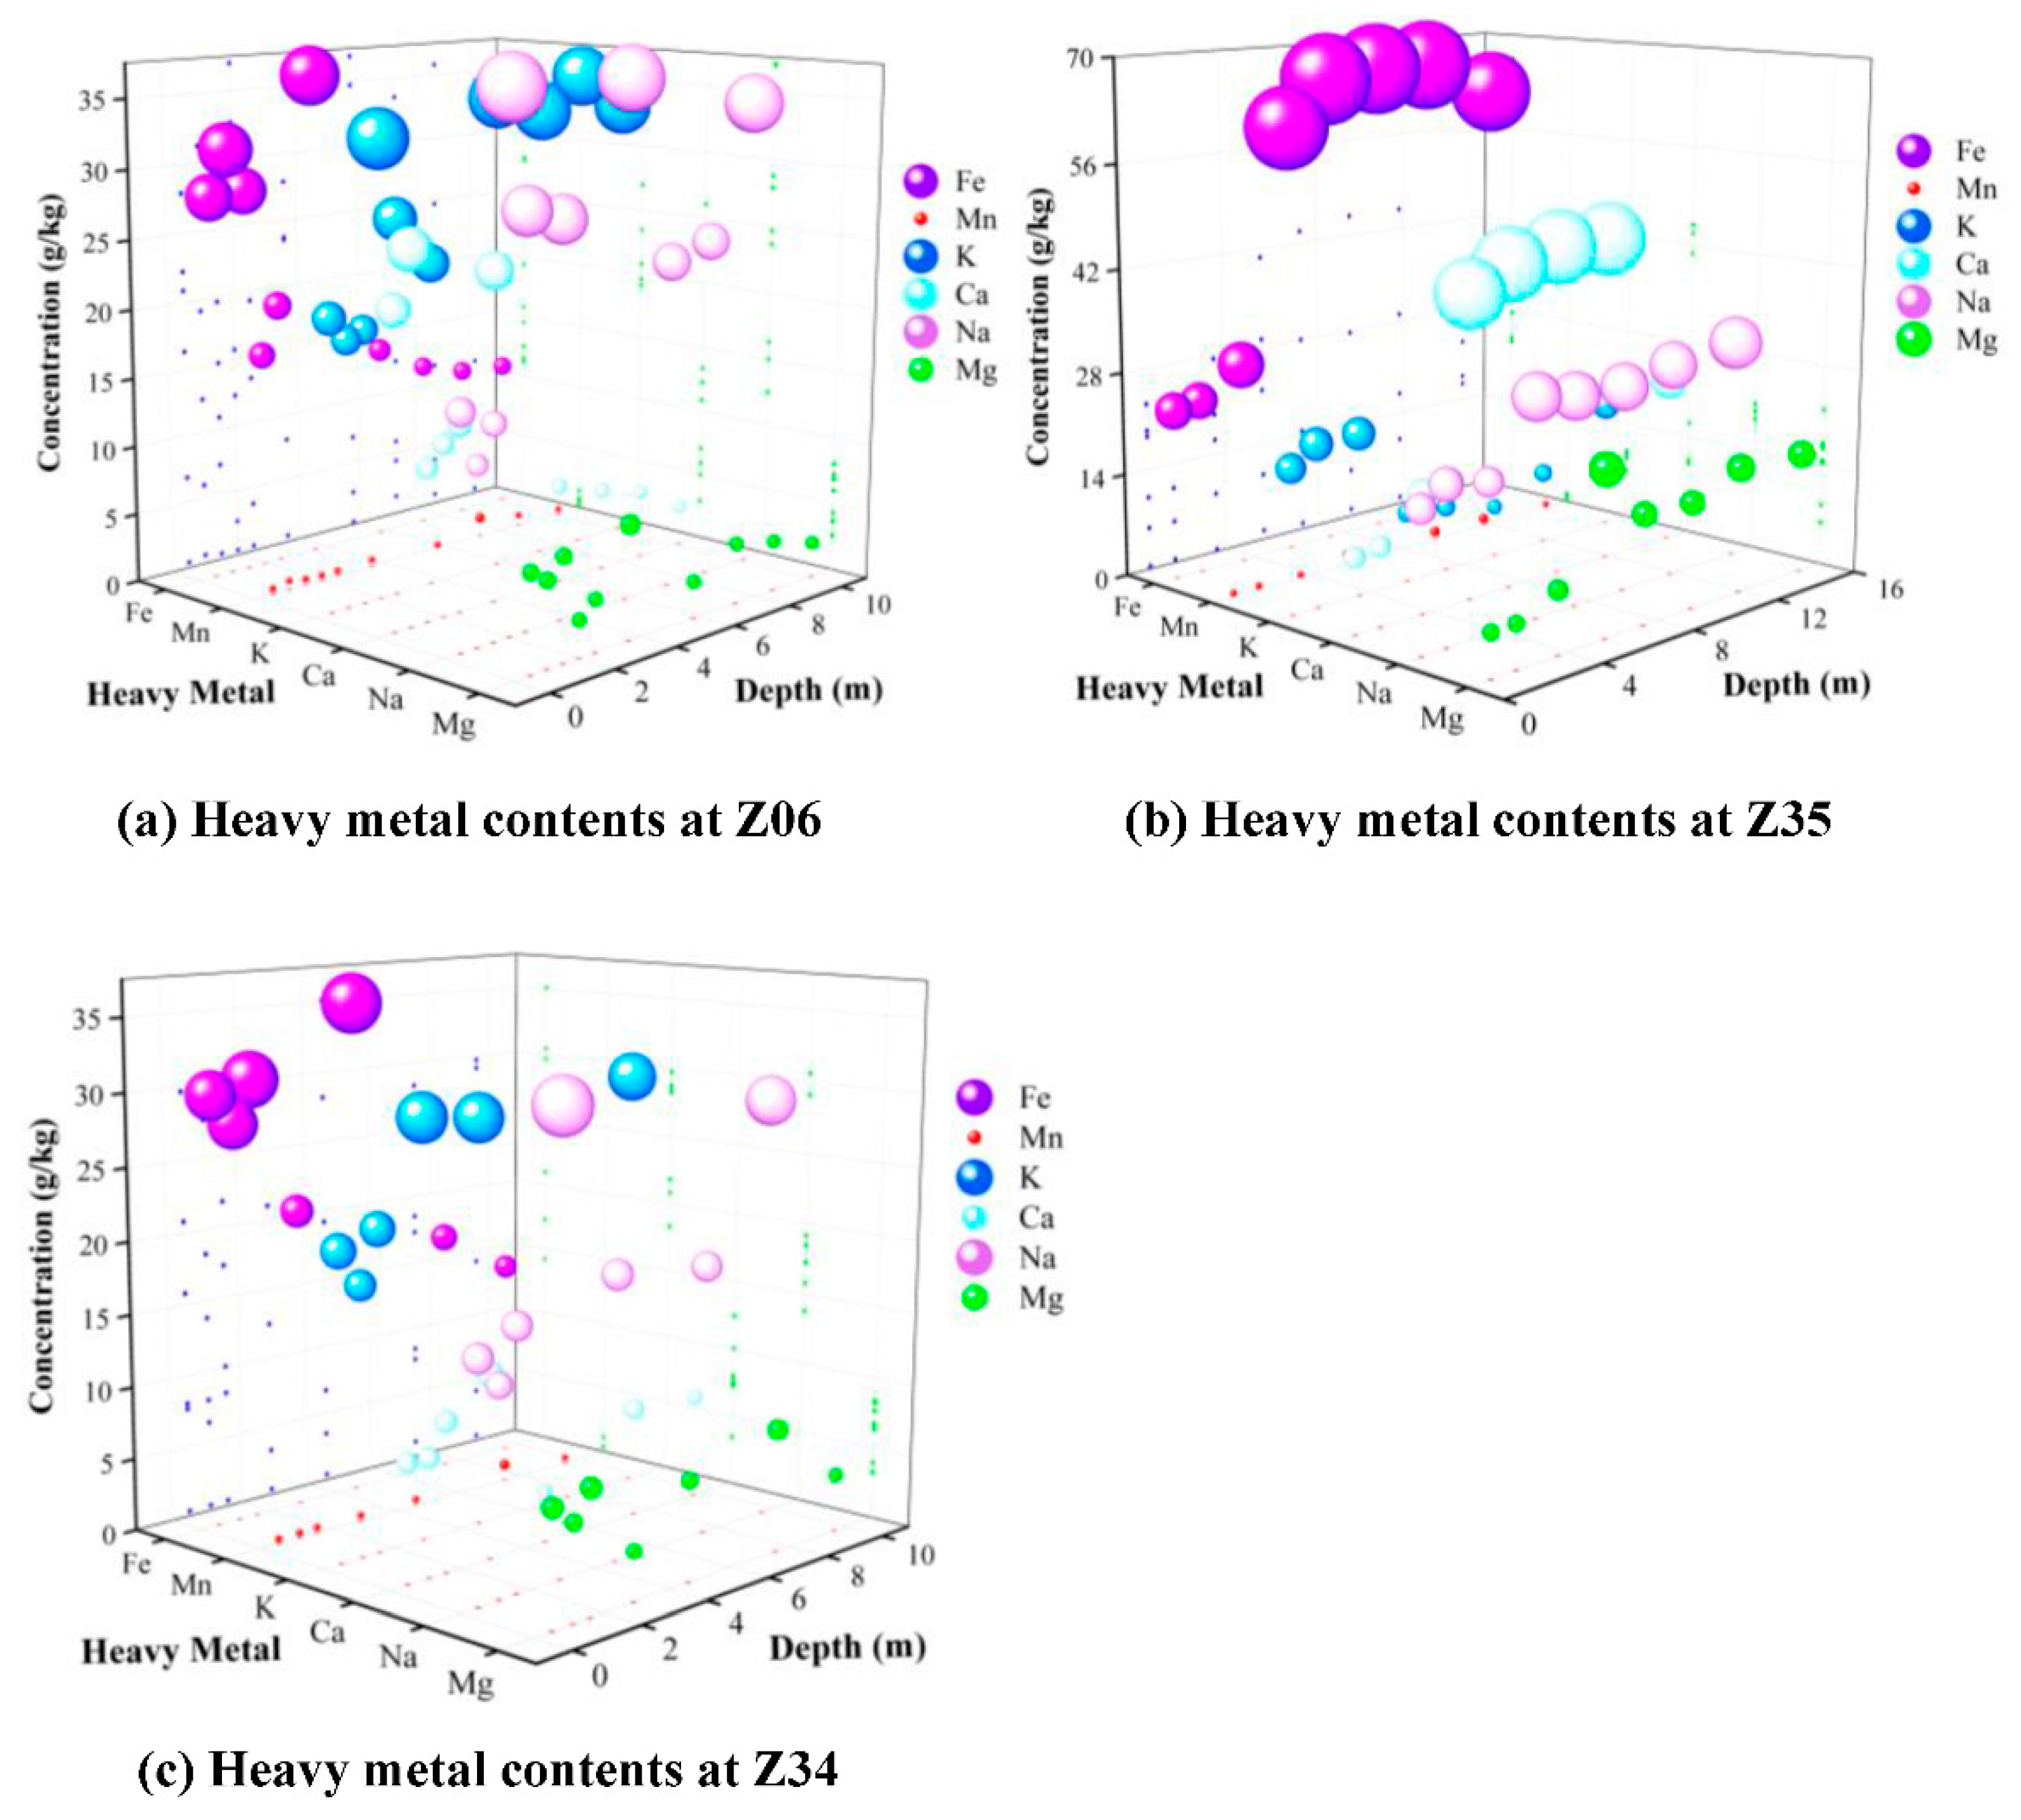
Six heavy metals were detected in three sampling points (Table 5). The average concentration of heavy metals was Fe > Na > K > Ca > Mg > Mn, with Fe concentrations being significantly higher than those of the other five indicators. Inversely, manganese was the smallest, with an average value of 586.57 mg/kg, and it was relatively stable compared with the other five heavy metals, as it had the minimum SD. In the three sampling points (Figure 9), the contents of the middle and lower depths were higher than that of middle and upper depths. The potassium content varied between approximately 6970 and 35,800 mg/kg, and the minimum value appeared at a 9.5 m depth of the Z35 sampling well, which was located downstream of the chemical plant. The maximum value occurred at a 8.7 m depth of the sewage well (Z06), and the maximum and minimum values were in the completely decomposed granite. The content of calcium was similar to potassium, and its distribution was also very uneven, since the SD of calcium and potassium were quite large. Calcium contents of Z06 and Z34, which were located in chemical plants, were generally lower than that of Z35. The content of magnesium was between approximately 2550 and 21,800 mg/kg, and its contents in aquifer media changed obviously. In the range of buried depths greater than 3.6 m, the magnesium content of well Z35 was generally higher than that of Z06 and Z34. The contents of sodium in soil ranged from 12,500 to 37,000 mg/kg, and the minimum value appeared in the fully weathered granite at the bottom of the Z06 (buried depth of 10.20 m). The maximum value appeared in the yellow medium sand at a buried depth of 2 m. The larger standard deviation reflected the larger variation of samples in space (plane surface and depth).

4.8. Detection of Organic Components in GW

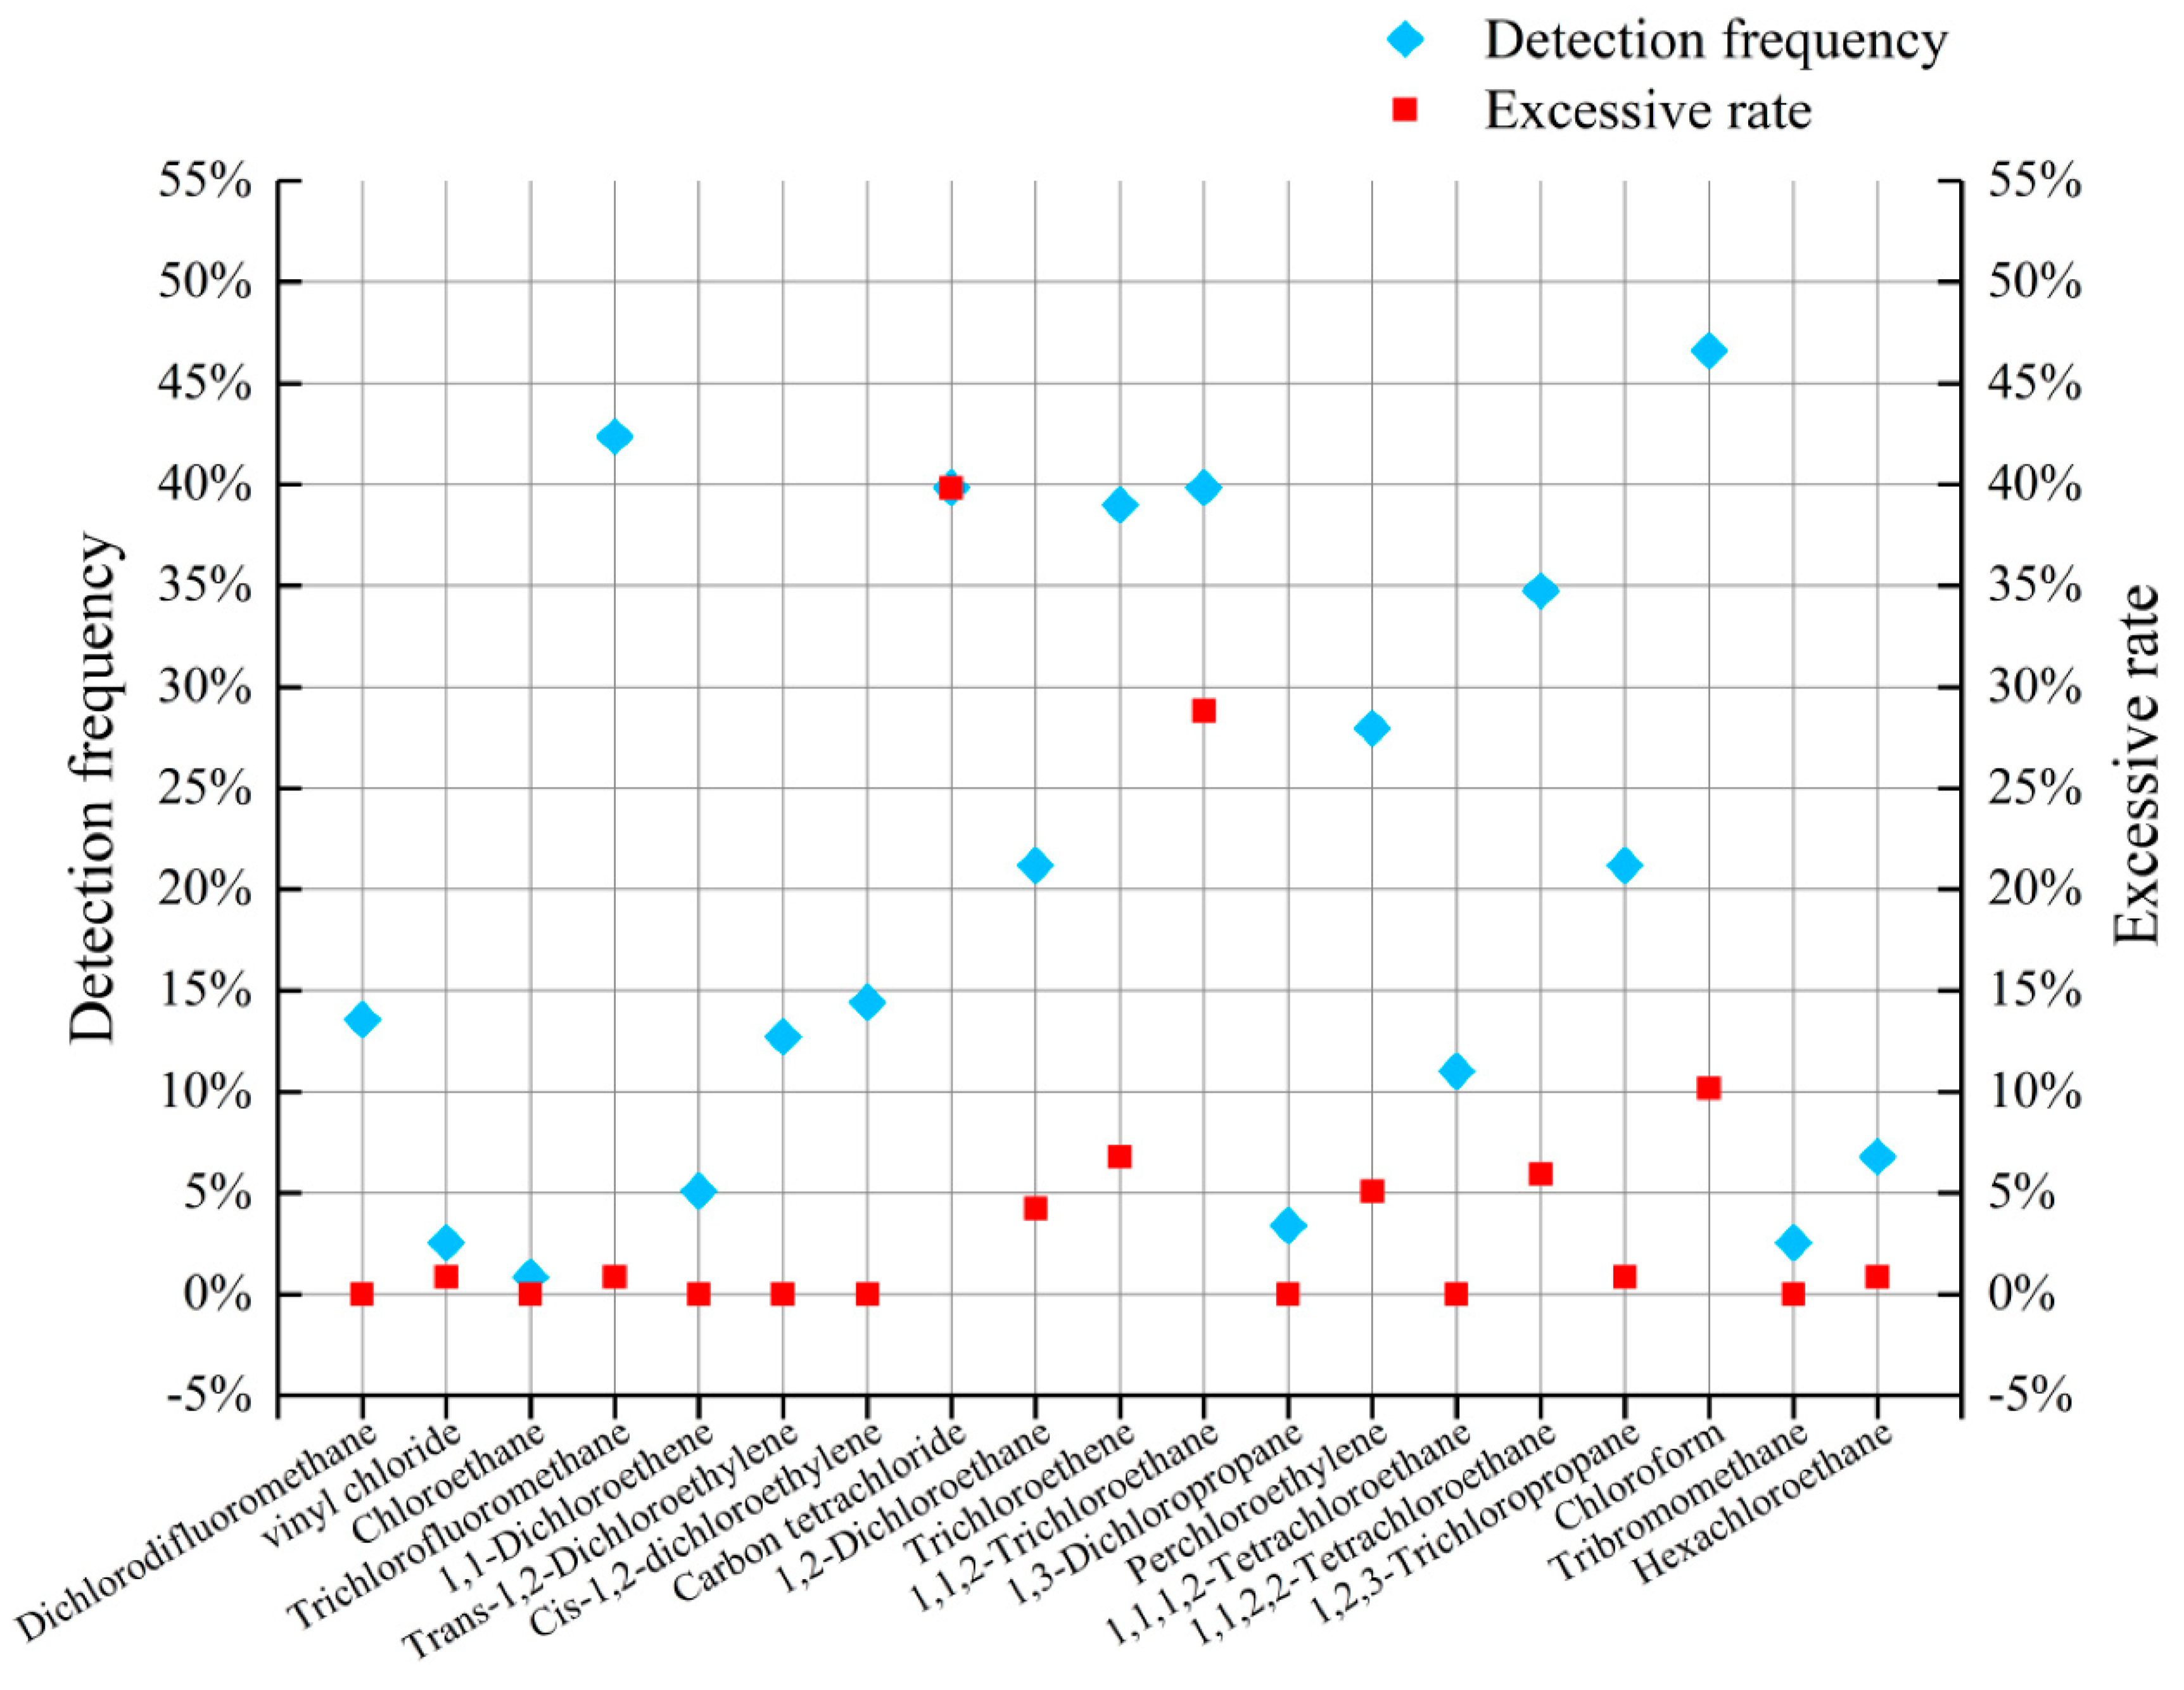
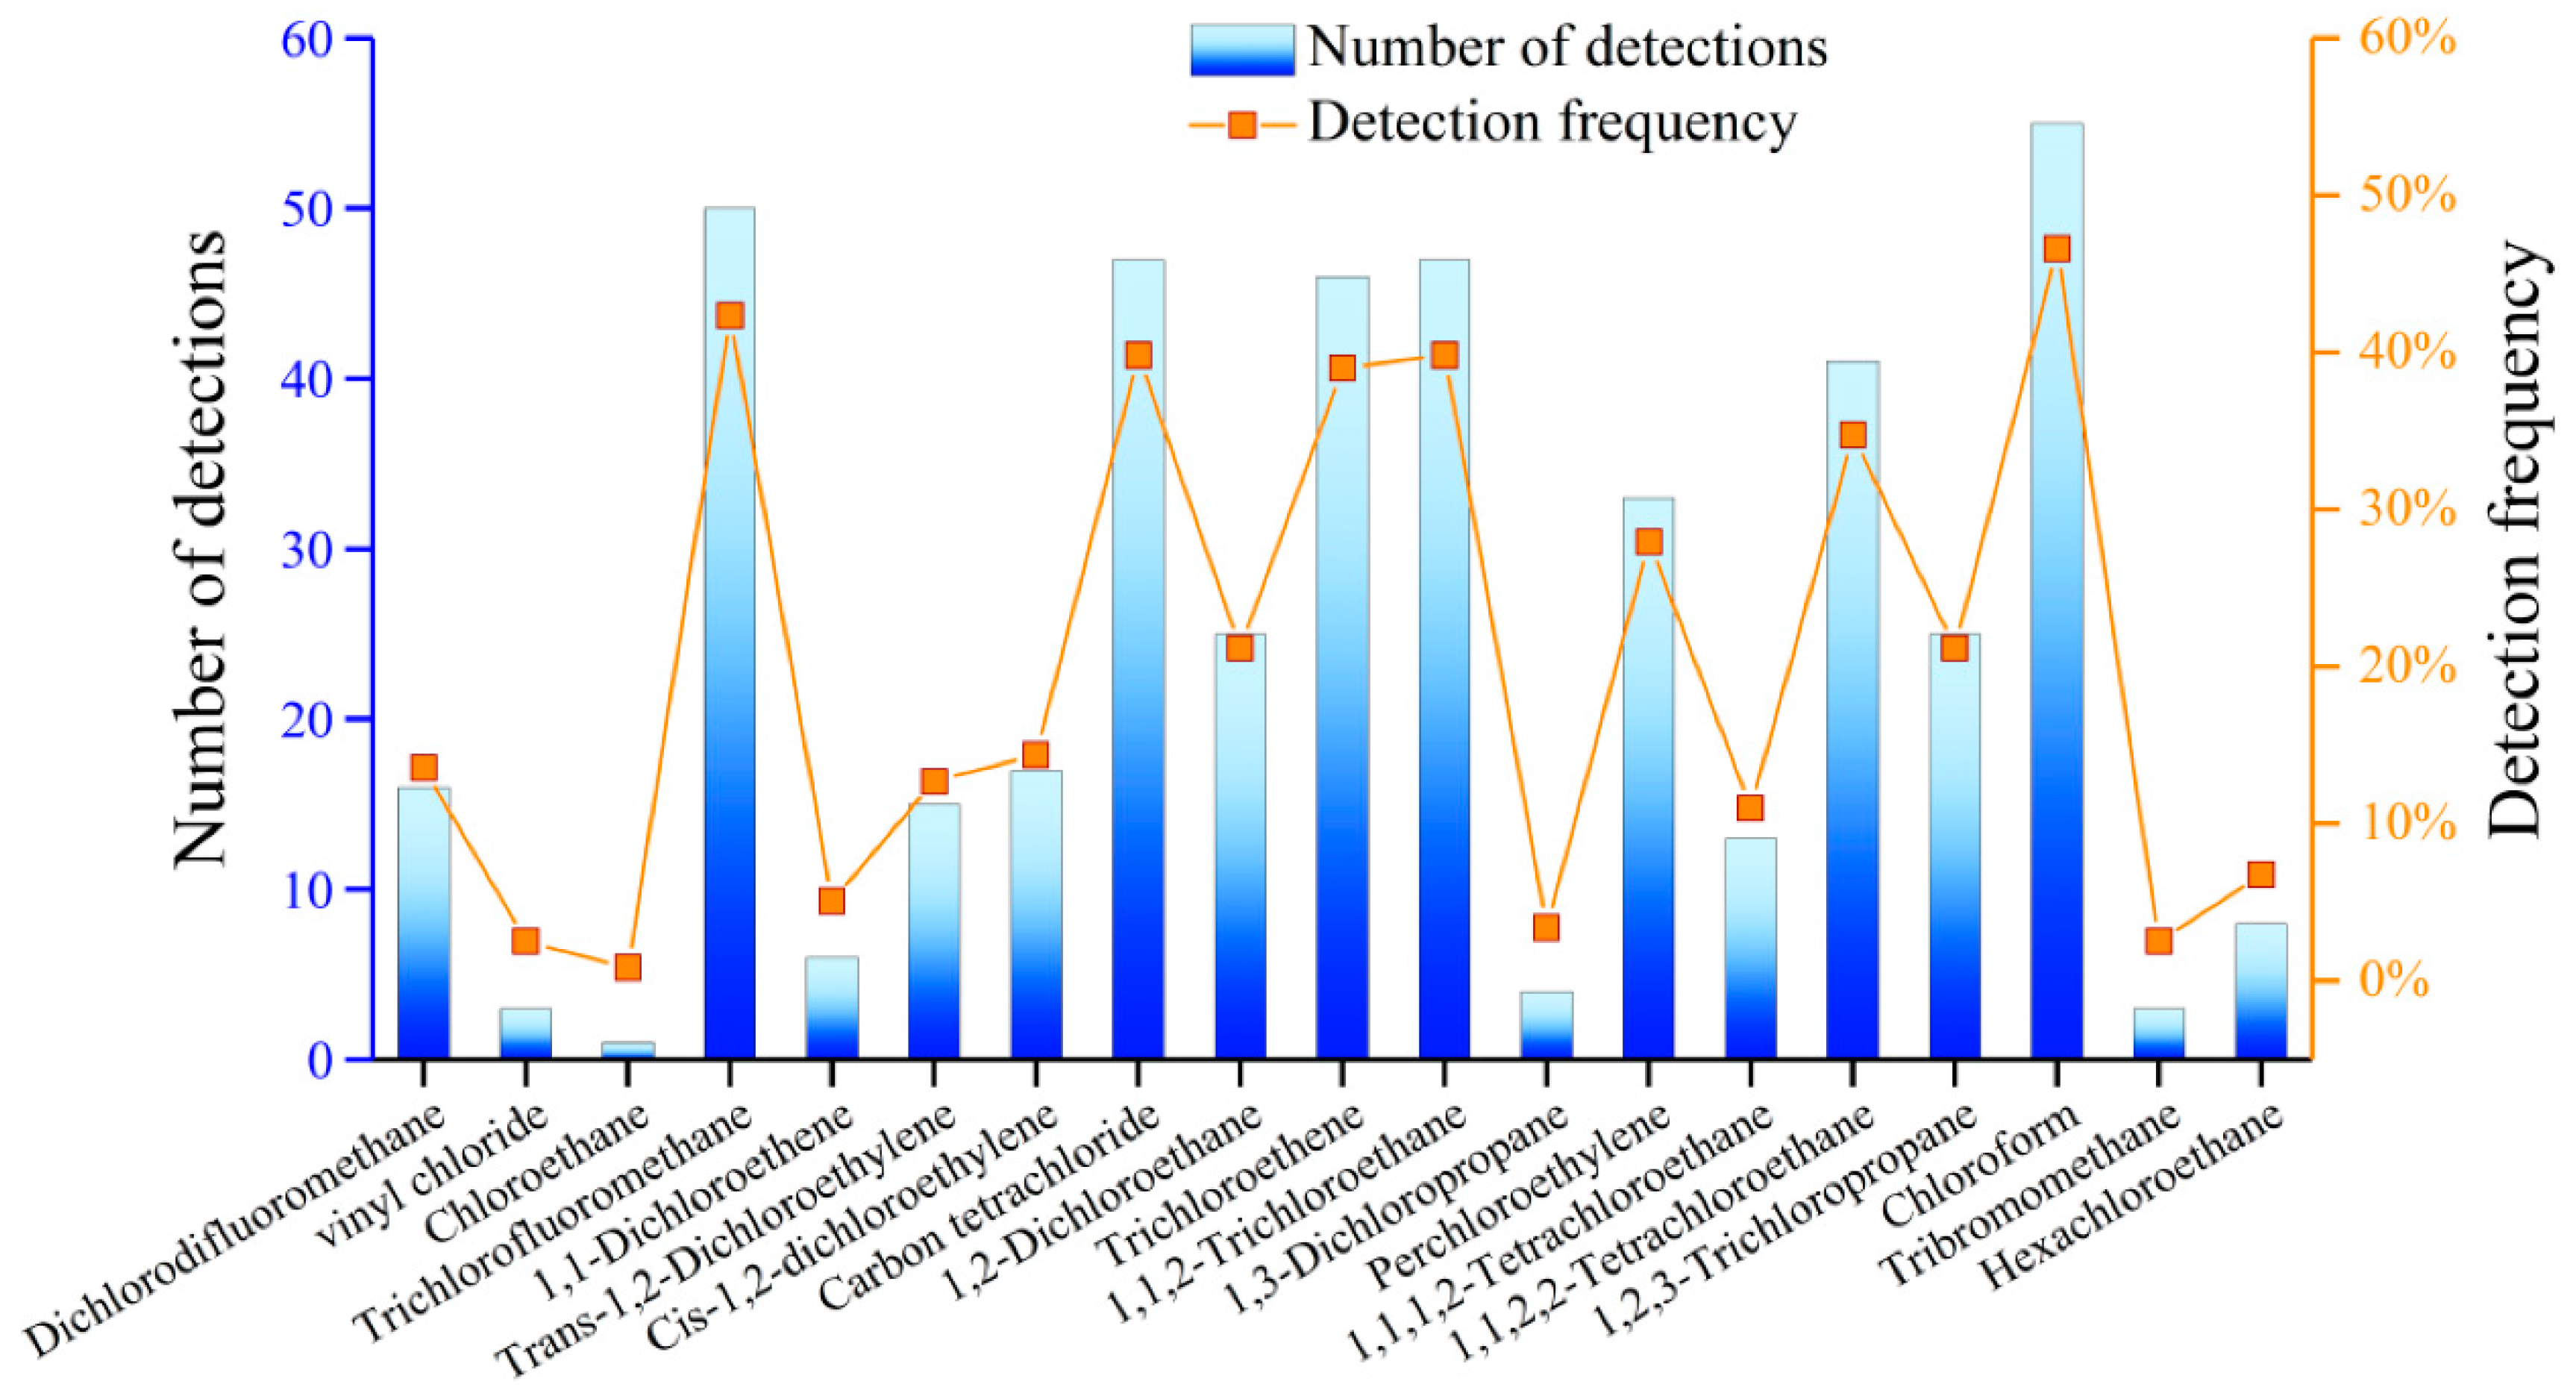
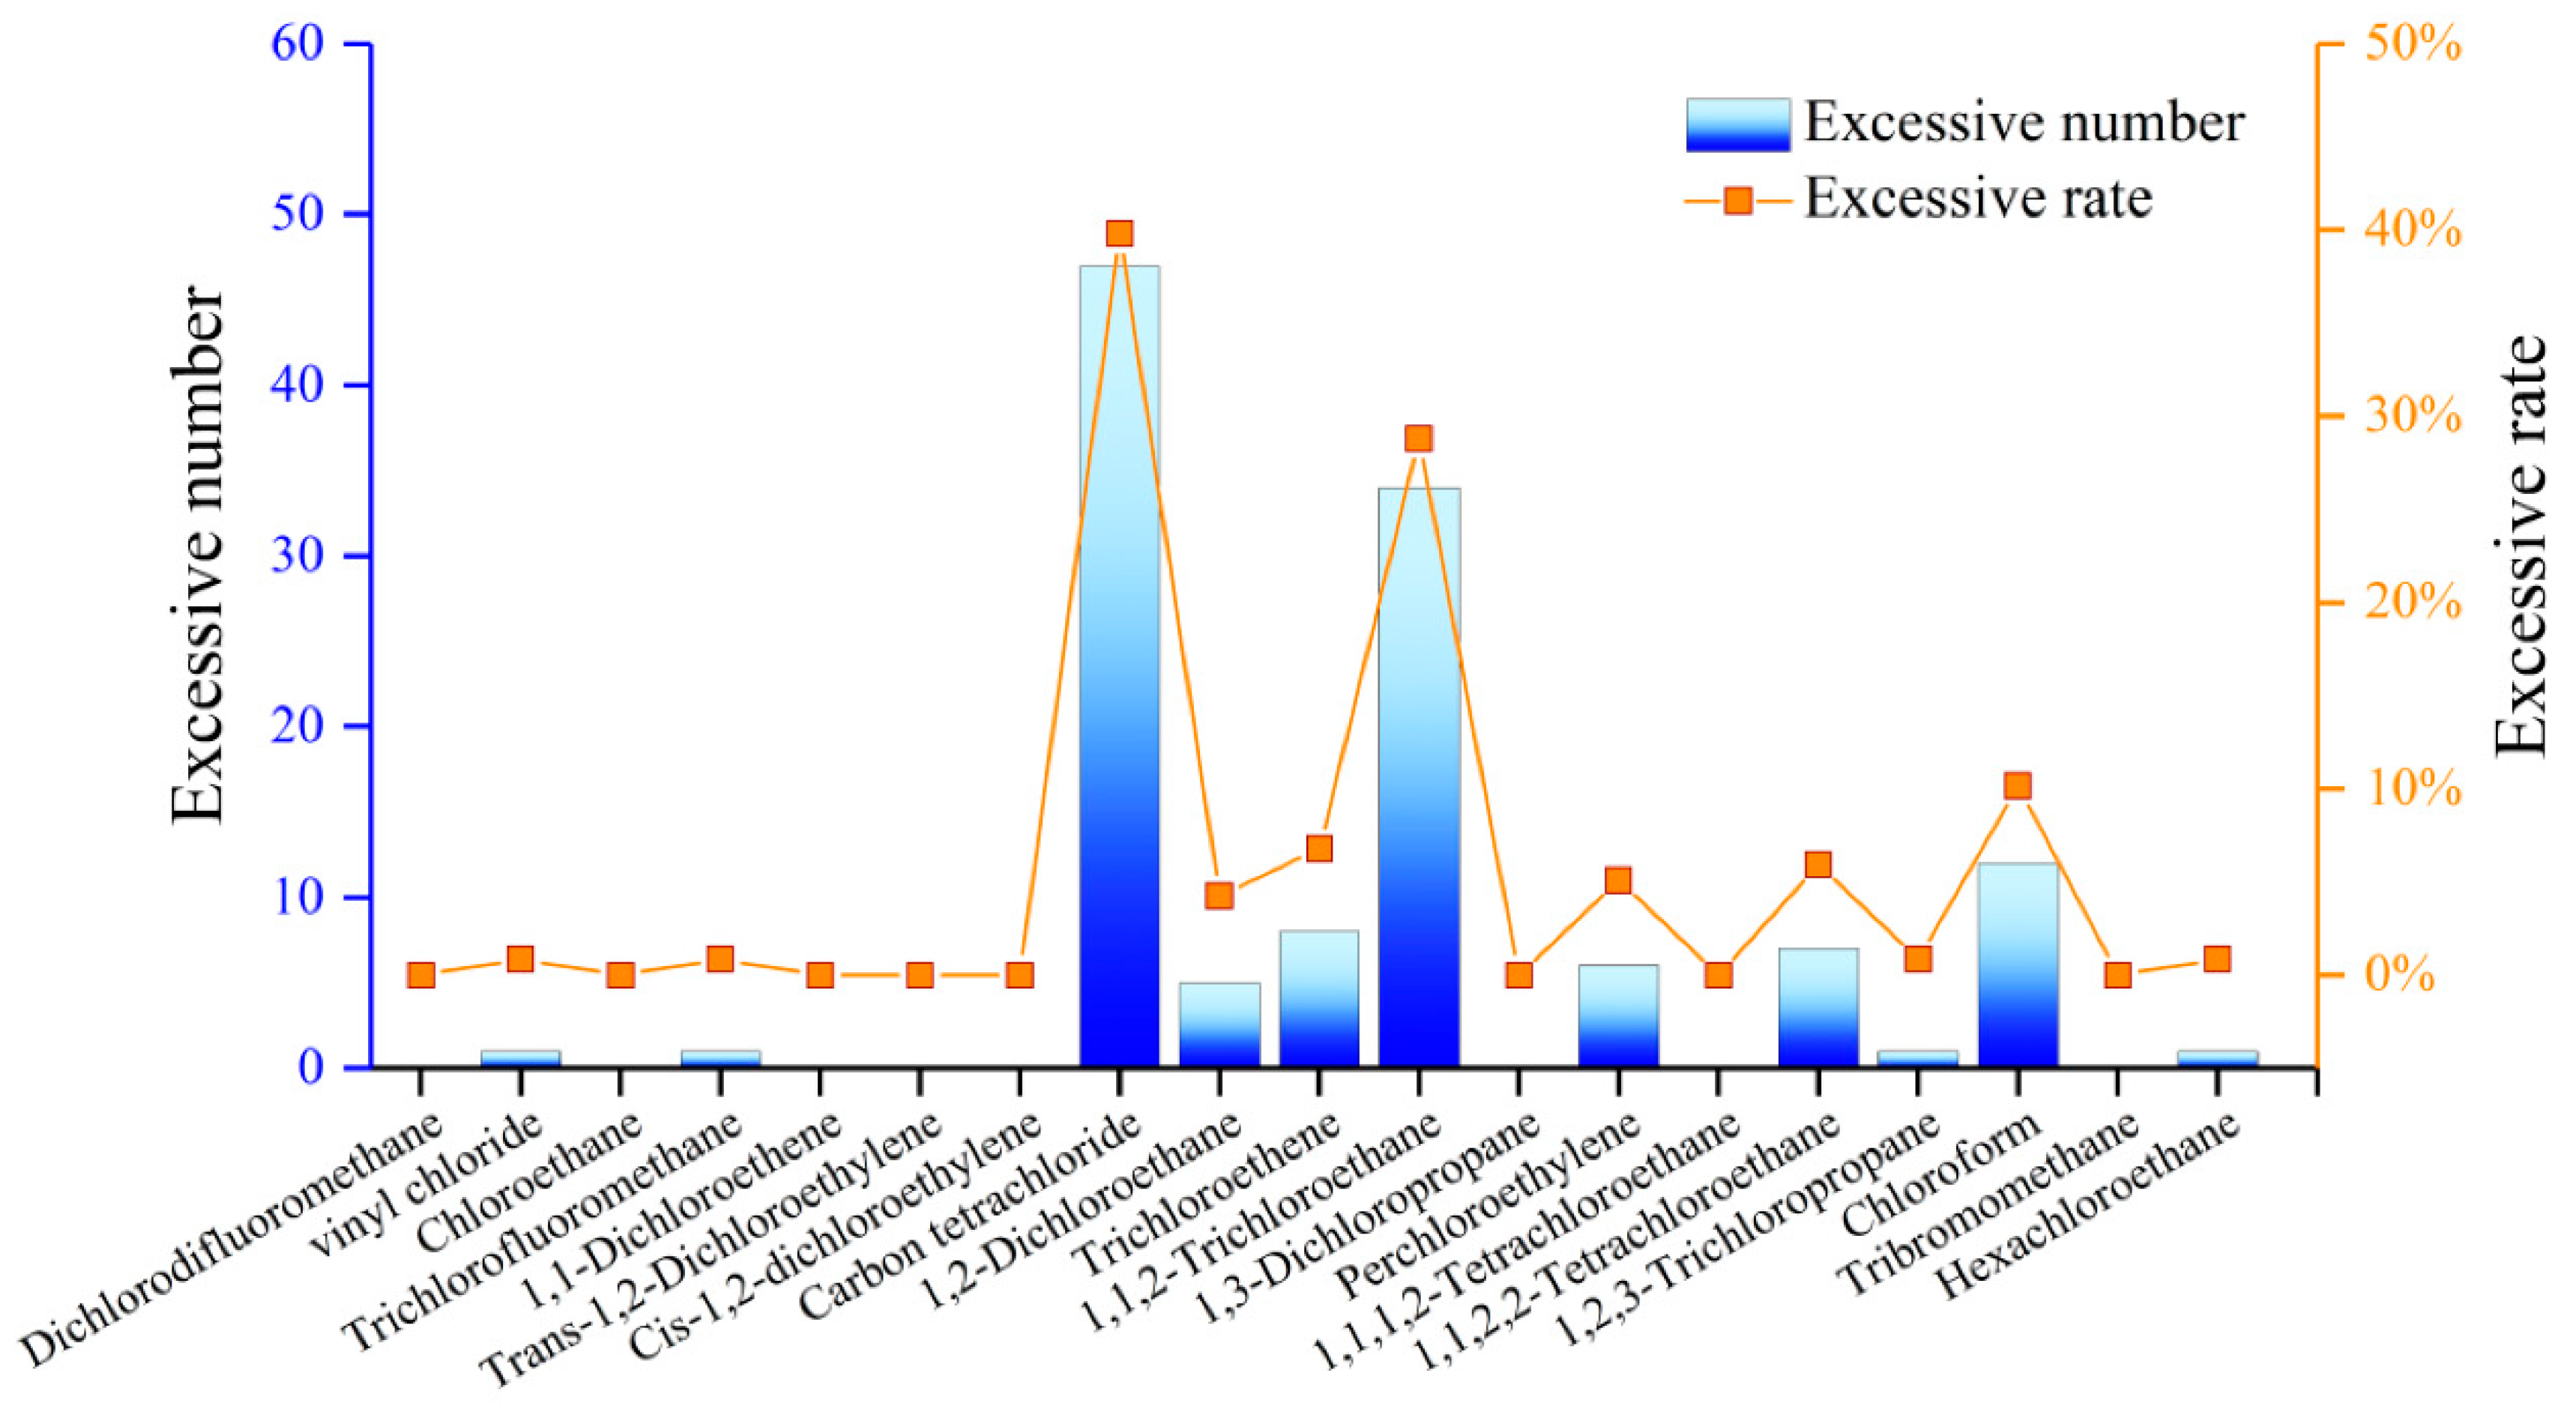
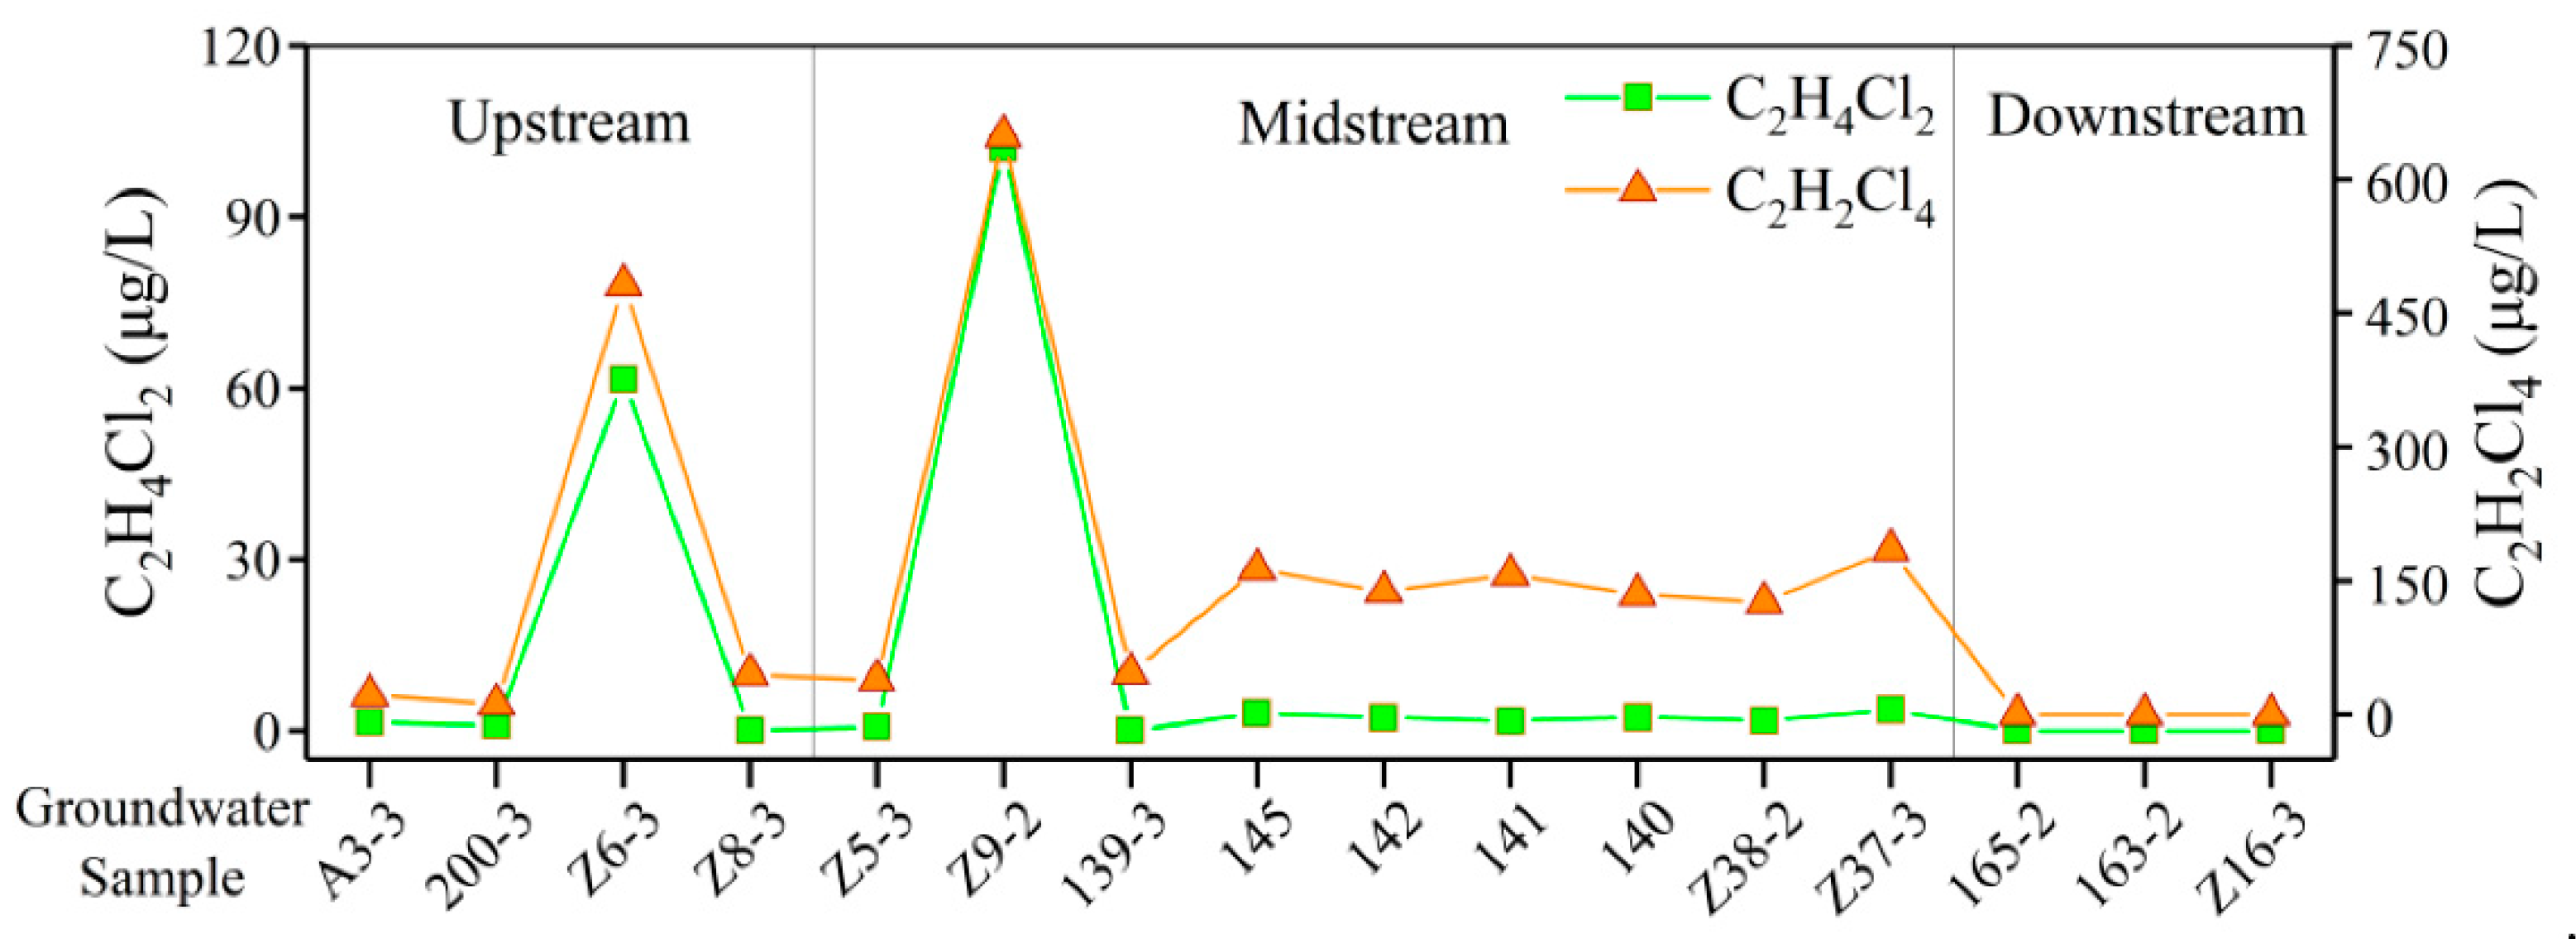
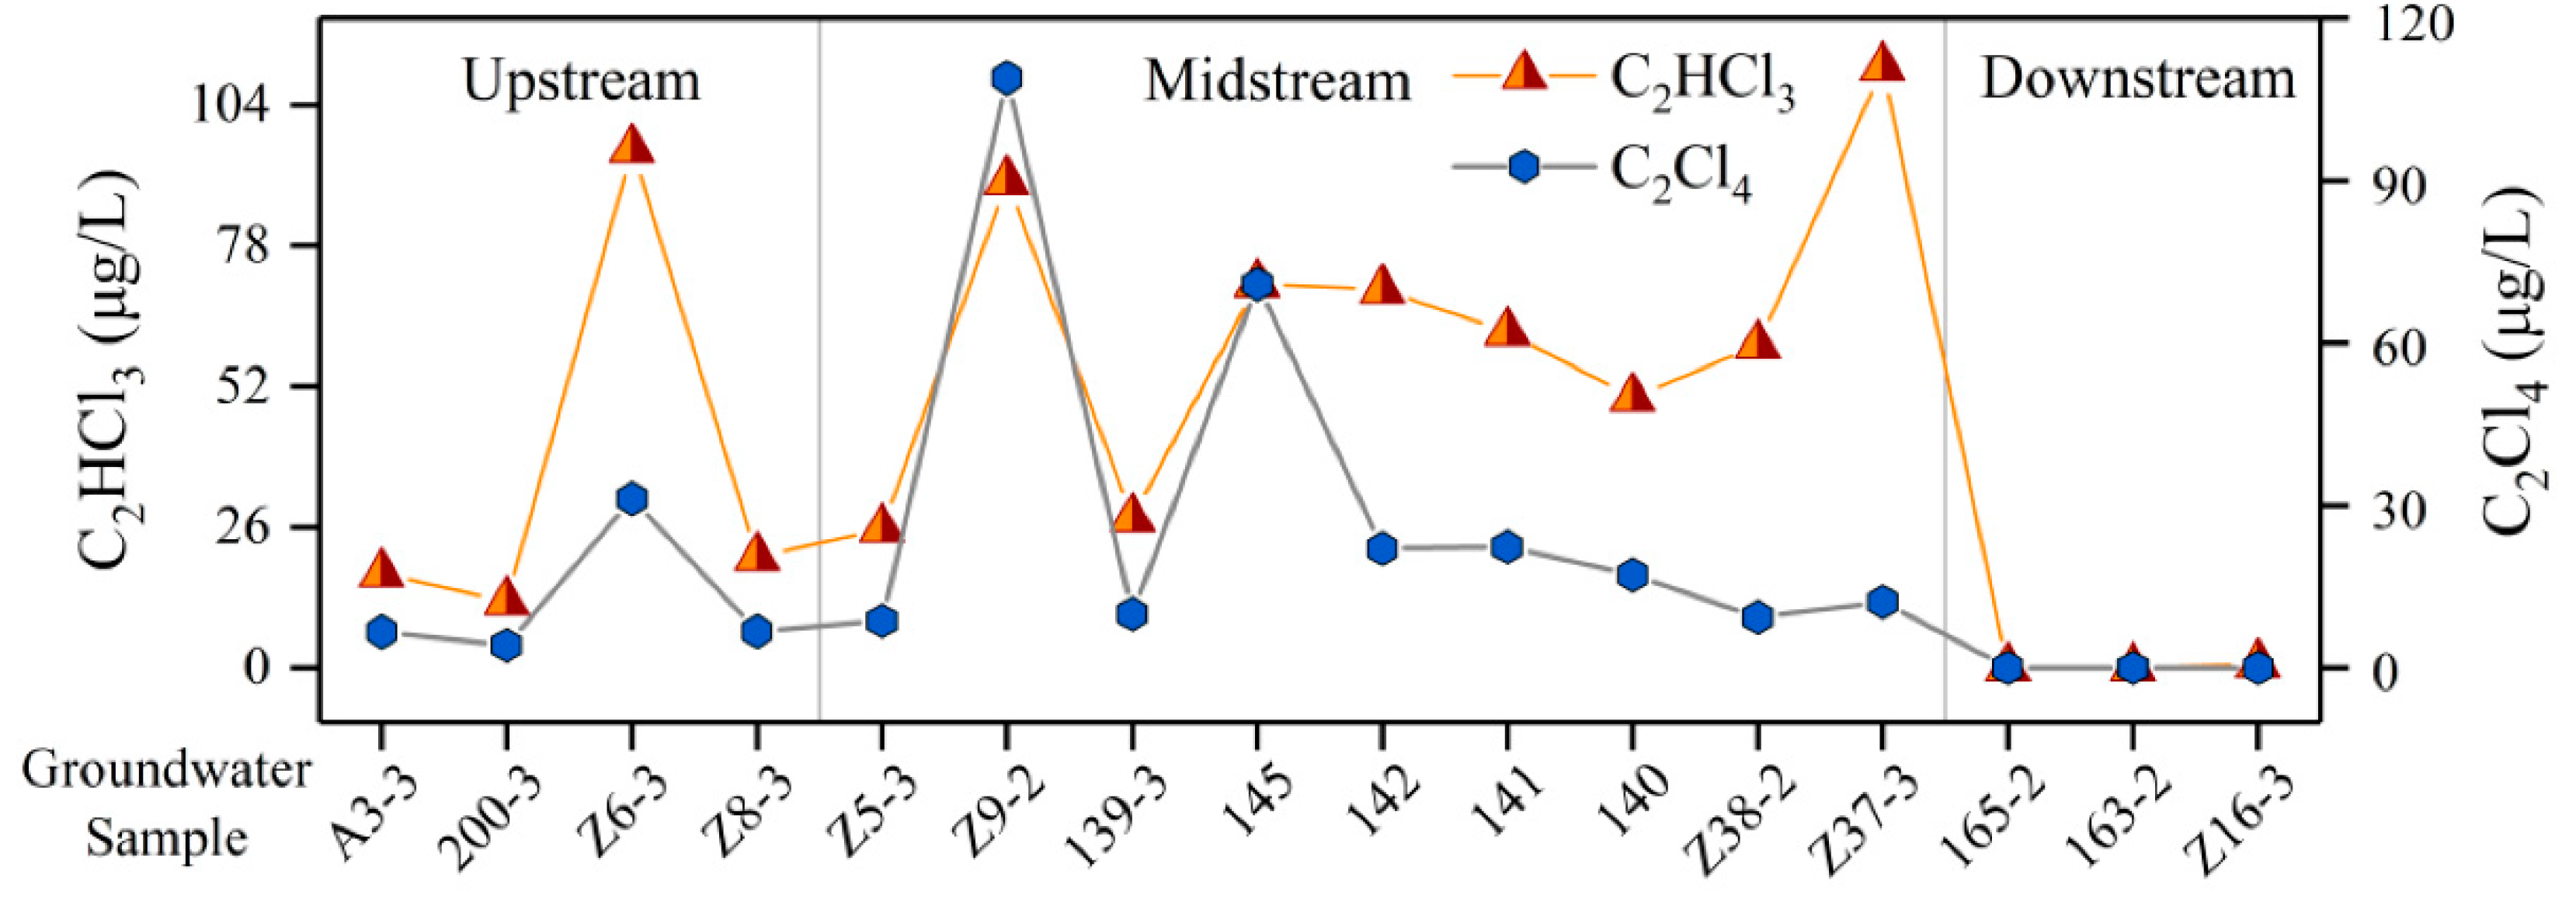
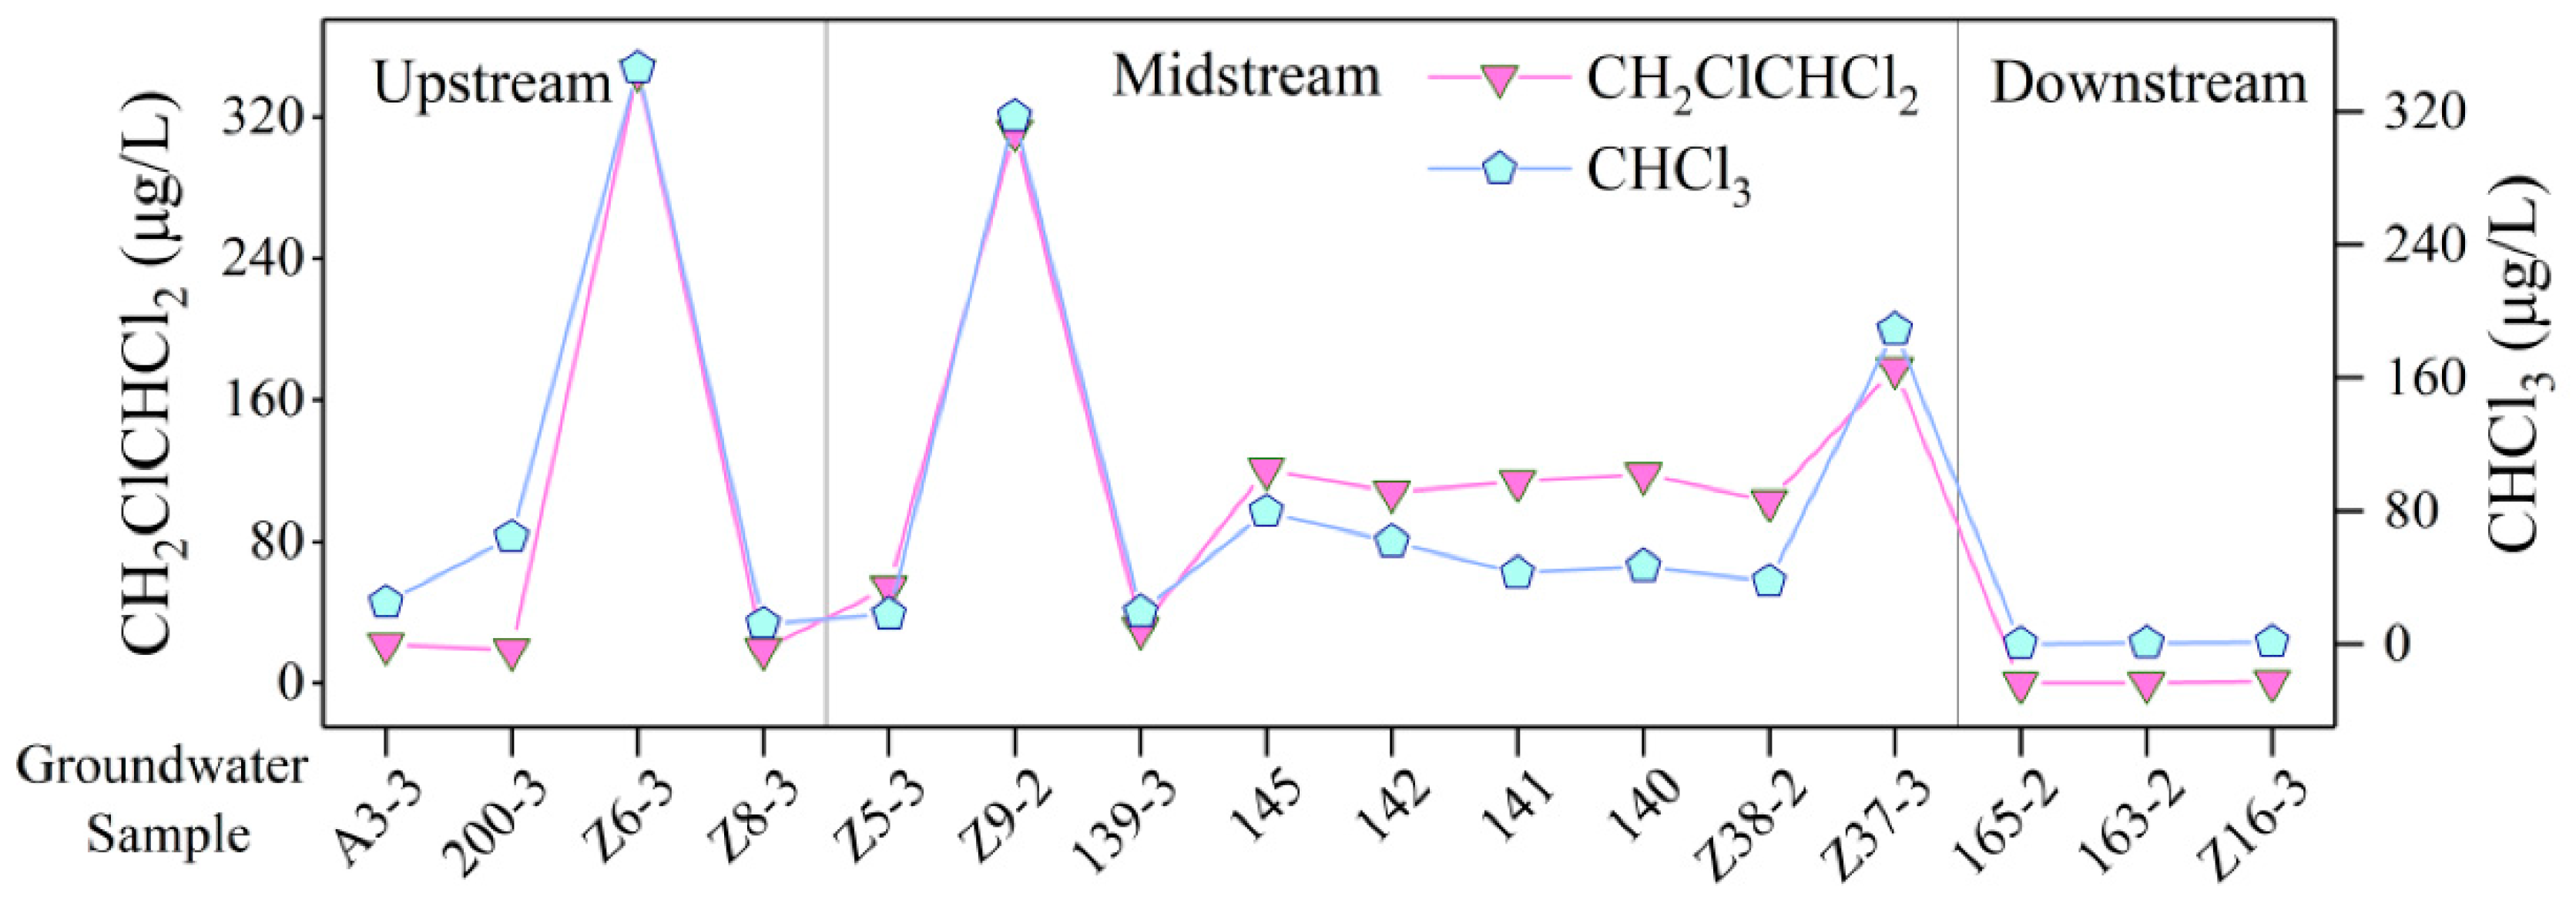
Since organic pollutants produced by chemical plants in the study area had leaked into GW, it was of little significance to judge GW quality according to the concentrations of inorganic components. Laboratory indicators included 19 conventional indicators and 187 organic pollution indicators including VOCs and SVOCs. A total of 19 pollutants (halogenated aliphatic hydrocarbons, THMs, and chlorinated hydrocarbons) were detected. Dichlorodifluoromethane, vinyl chloride, chloroethane, trichlorofluoromethane, 1,1-dichloroethene, trans-1,2-dichloroethene, cis-1,2-dichloroethene, carbon tetrachloride, 1,2-dichloroethane, trichloroethene, 1,1,2-trichloroethane, 1,3-dichloropropane, tetrachloroethene, 1,1,1,2-tetrachloroethane, 1,1,2,2-tetrachloroethane, and 1,2,3-trichloropropane were the main halogenated aliphatic hydrocarbons in the study area (Figure 10). As shown in Figure 11, the seven most frequently detected organic compounds included chloroform (46.61%), trichlorofluoromethane (42.37%), carbon-tetrachloride (39.83%), 1,1,2-trichloroethane (39.83%), trichloroethene (38.98%), 1,1,2,2-tetrachloroethane (34.75%), and perchloroethylene (27.97%). The detection rate of the remaining 12 organic compounds ranged from 0.85% to 21.19%. Carbon tetrachloride had the highest exceedance rate, followed by 1,1,2-trichloroethane (39.83% and 28.81%, respectively). The exceedance rate of seven organic compounds with high detection rate was as follows (Table 6; Figure 12): Carbon tetrachloride (39.83%) > 1,1,2-trichloroethane (28.81%) > chloroform (10.17%) > trichloroethene (6.78%) > 1,1,2,2-tetrachloroethane (5.93%) > perchloroethylene (5.08%) > trichlorofluoromethane (0.85%). Carbon tetrachloride was the most polluted of the 19 organic compounds. Table 6 shows that the concentrations of carbon tetrachloride ranged from 2.2 to 69,500 μg/L with an average detection value of 2059.82 μg/L. The detection concentration of sample 118 was as high as 68,500 μg/L, and the maximum exceedance multiple was 34,749. Secondly, the pollution degree of 1,1,2-trichloroethane was only lower than that of carbon tetrachloride, and the maximum exceedance multiple was 699. It also appeared in sample 118, and the maximum detected concentration was as high as 5900 μg/L (Table 7). Compared with carbon tetrachloride and 1,1,2-trichloroethane, the other five organic compounds with higher detection rates did not seriously exceed the standard. Among them, chloroform had a higher exceedance rate (10.17%), the maximum exceedance multiple was 12.52, with the maximum concentration being 811 μg/L. We carefully observed the concentrations of organic compounds between upstream and downstream and found several rules: the concentrations of organic compounds were higher at the head of the pollution source, while the concentrations of pollutants in Z09 monitoring well exceeded Z06. It was indicated that the pollutants migrated downstream along the flow direction of GW, and accumulated near the Z09 monitoring well, and further migrated to the middle and lower reaches. The concentrations of organic compounds in the upstream region of the pollution source were 0. It was indicated that the pollutants transported along the flow direction of GW and followed the direction from upstream to downstream, further indicating that the upstream area was not affected by the diffusion of organic pollutants temporarily. Due to the volatilization and diffusion of VOCs and SVOCs, the area perpendicular to the GW flow direction was also affected by pollution. Additionally, the GW pollution under the influence of volatilization and diffusion was significantly less than that along the direction of GW runoff. In the far downstream area, the concentrations of organic compounds were low. The reason for this was that the existence of surface reservoirs had played a significant role in blocking and diluting the migration path of pollutants. Some rules can be found by plotting the variation of pollutants along the direction of GW flow in the study area. The concentration variation trend and amplitude of carbon tetrachloride and trichlorofluoromethane (Figure 13), 1,2-dichloroethane and 1,1,2,2-tetrachloroethane (Figure 14), trichloroethene and perchloroethylene (Figure 15), and 1,1,2-trichloroethane and chloroform (Figure 16) were generally consistent, indicating that the migration and diffusion mechanisms of the above two organics in GW were similar.

5. Conclusions

The present study collected 118 GW samples from 77 monitoring wells and 25 soil samples from three new boreholes. To clarify the regional differences in the chemical characteristics and evolutionary mechanism of GW in the study area, the GW catchment was classified into upstream, midstream, and downstream for analysis. The following main conclusions can be drawn.
The GW in the surrounding area of the chemical plant was classified as generally weak acid to neutral water with a TDS ranging from 374 to 1910 mg/L. The orders of cations and anions in the GW samples in terms of contents were Ca2+ > Na+ > Mg2+ > K+ and SO42− > HCO3 > Cl > NO3, respectively. The results of the Piper diagram showed that approximately 41.18% of the GW samples corresponded to the Cl·SO4–Ca type upstream. The SO4·Cl–Ca type (15.69%) and the Cl·SO4–Ca type (15.69%) were the main hydrochemical types midstream. The anions downstream were stable; similarly, the dominant cation was Ca2+.
PCA indicated that the dissolution of halide minerals was the main source of ion composition in GW. Anthropogenic activities (such as the use of pesticides and fertilizers) and the dissolution of gypsum were partly responsible for forming the GW’s chemistry. CA revealed that the dissolution of sulfur-bearing minerals and gypsum was the key factor controlling the concentrations of Ca2+ and Mg2+. Additionally, the dissolution of halide minerals and the use of pesticides and fertilizers were important factors controlling the water chemistry in the study area.
The Gibbs diagram showed that the ion concentrations of GW were mainly affected by water–rock interactions and were influenced by evaporation and crystallization to some extent. The results of the Gaillardet diagram and ions ratio analysis indicated that the weathering and dissolution of silicate (i.e., aluminosilicate minerals), evaporite (i.e., halite and gypsum), carbonate minerals (i.e., calcite and dolomite), cation exchange, and anthropogenic activities were responsible for the GW’s hydrochemistry. Furthermore, sulfuric acid and carbonic acid were involved in the dissolution of carbonate minerals (approximately 71.19%) in the study area. The contribution of carbonic acid was significantly more than that of sulfuric acid. Moreover, the chloride alkalinity index (CAI-I, CAI-II) indicated that Na+ and K+ might have been exchanged by Ca2+ and Mg2+ from the aquifer and accompanied with higher degrees of cation exchange.
By analyzing the test results of heavy metals in soil, it is clear that manganese was relatively stable compared with other heavy metals. The average concentration of heavy metals was Fe > Na > K > Ca > Mg > Mn with Fe concentrations being significantly higher than those of the other five indicators. The content of calcium was similar to potassium, and their distribution was very uneven. In addition, the contents of magnesium in aquifer media changed obviously. The larger standard deviation of sodium reflected the larger variation of samples in space (i.e., plane surface and depth).
The seven most frequently detected organic compounds included chloroform (46.61%), tri-chlorofluoromethane (42.37%), carbon tetrachloride (39.83%), 1,1,2-trichloroethane (39.83%), trichloroethene (38.98%), 1,1,2,2-tetrachloroethane (34.75%), and perchloroethylene (27.97%). The exceedance rate of seven organic compounds with high detection rates were as follows: carbon tetrachloride (39.83%) > 1,1,2-trichloroethane (28.81%) > chloroform (10.17%) > trichloroethene (6.78%) > 1,1,2,2-tetrachloroethane (5.93%) > perchloroethylene (5.08%) > trichlorofluoromethane (0.85%). The upstream area of the pollution source was not affected by groundwater pollution. Moreover, the GW pollution under the influence of volatilization and diffusion was significantly less than that along the direction of GW runoff. Additionally, the existence of surface reservoirs played a significant role in blocking and diluting the migration path of pollutants.

Author Contributions

Conceptualization, H.Z., Q.W. and B.L.; Funding acquisition, B.L.; Investigation, H.Z.; Methodology, H.Z. and G.Z.; Software, H.Z.; Supervision, Q.W., B.L. and G.Z.; Writing—original draft, H.Z.; Writing—review and editing, H.Z. All authors have read and agreed to the published version of the manuscript.

Funding

The Project of Shandong Province Higher Educational Science and Technology Program (J17KA191), the Project of Shandong Provincial Natural Science Foundation (ZR2019MD029), and the Fundamental Research Funds for the Central Universities (2010YD02).

Institutional Review Board Statement

Not applicable.

Informed Consent Statement

Not applicable.

Data Availability Statement

Not applicable.

Acknowledgments

We thank the anonymous reviewers and editor for their useful comments and insightful suggestions that helped improve the manuscript. Useful suggestions and help provided by Linxian Huang and Di Liu of Jinan University are also acknowledged.

Conflicts of Interest

The authors declare that they have no known competing financial interests or personal relationships that could have appeared to influence the work reported in this paper.

References

  1. Aeschbach-Hertig, W.; Gleeson, T. Regional strategies for the accelerating global problem of groundwater depletion. Nat. Geosci. 2012, 5, 853–861. [Google Scholar] [CrossRef]
  2. An, D.; Xi, B.D.; Wang, Y.; Xu, D.; Tang, J.; Dong, L.C.; Ren, J.Z.; Pang, C.F. A sustainability assessment methodology for prioritizing the technologies of groundwater contamination remediation. J. Clean. Prod. 2016, 112, 4647–4656. [Google Scholar] [CrossRef]
  3. Jasechko, S.; Perrone, D.; Befus, K.M.; Cardenas, M.B.; Ferguson, G.; Gleeson, T.; Luijendijk, E.; McDonnell, J.J.; Taylor, R.G.; Wada, Y.; et al. Global aquifers dominated by fossil groundwaters but wells vulnerable to modern contamination. Nat. Geosci. 2017, 10, 425–429. [Google Scholar] [CrossRef] [Green Version]
  4. Gao, Y.Y.; Qian, H.; Ren, W.H.; Wang, H.K.; Liu, F.X.; Yang, F.X. Hydrogeochemical characterization and quality assessment of groundwater based on integrated-weight water quality index in a concentrated urban area. J. Clean. Prod. 2020, 260, 121006. [Google Scholar] [CrossRef]
  5. Cai, B.M.; Liu, B.B.; Zhang, B. Evolution of Chinese urban household’s water footprint. J. Clean. Prod. 2019, 208, 1–10. [Google Scholar] [CrossRef]
  6. Paca, J.M.; Santos, F.M.; Pires, J.C.M.; Leitao, A.A.; Boaventura, R.A.R. Quality assessment of water intended for human consumption from Kwanza, Dande and Bengo rivers (Angola). Environ. Pollut. 2019, 254, 113037. [Google Scholar] [CrossRef]
  7. Devic, G.; Djordjevic, D.; Sakan, S. Natural and anthropogenic factors affecting the groundwater quality in Serbia. Sci. Total Environ. 2014, 468–469, 933–942. [Google Scholar] [CrossRef] [PubMed]
  8. Liu, J.T.; Wang, M.; Gao, Z.J.; Chen, Q.; Wu, G.W.; Li, F.Q. Hydrochemical characteristics and water quality assessment of groundwater in the Yishu River basin. Acta Geophys. 2020, 68, 877–889. [Google Scholar] [CrossRef]
  9. Li, Y.S.; Zhang, Z.J.; Fei, Y.H.; Chen, H.H.; Qian, Y.; Dun, Y. Investigation of quality and pollution characteristics of groundwater in the Hutuo River Alluvial Plain, North China Plain. Environ. Earth Sci. 2016, 75, 581. [Google Scholar] [CrossRef]
  10. Pignotti, E.; Dinelli, E.; Birke, M. Geochemical characterization and rare earth elements anomalies in surface- and groundwaters of the Romagna area (Italy). Rendiconti Lincei 2017, 28, 265–279. [Google Scholar] [CrossRef]
  11. Babiker, I.S.; Mohamed, M.A.A.; Hiyama, T. Assessing groundwater quality using GIS. Water Resour. Manag. 2007, 21, 699–715. [Google Scholar] [CrossRef]
  12. Bethencourt, M.; Fernandez-Montblanc, T.; Izquierdo, A.; Gonzalez-Duarte, M.M.; Munoz-Mas, C. Study of the influence of physical, chemical and biological conditions that influence the deterioration and protection of Underwater Cultural Heritage. Sci. Total Environ. 2018, 613–614, 98–114. [Google Scholar] [CrossRef] [PubMed]
  13. Liu, B.H.; Zhan, H.; Lu, X.C.; Liu, Y.R.; Huang, L.X.; Wei, Z.R. Biodegradation of carbon tetrachloride from groundwater in an upflow solid-phase biofilm system. RSC Adv. 2020, 10, 7500–7508. [Google Scholar] [CrossRef] [Green Version]
  14. Li, P.Y.; Qian, H.; Wu, J.H.; Zhang, Y.Q.; Zhang, H.B. Major Ion Chemistry of Shallow Groundwater in the Dongsheng Coalfield, Ordos Basin, China. Mine Water Environ. 2013, 32, 195–206. [Google Scholar] [CrossRef]
  15. de Andrade, E.M.; Palacio, H.A.; Souza, I.H.; de Oliveira Leao, R.A.; Guerreiro, M.J. Land use effects in groundwater composition of an alluvial aquifer (Trussu River, Brazil) by multivariate techniques. Environ. Res. 2008, 106, 170–177. [Google Scholar] [CrossRef]
  16. Abelson, P.H. Groundwater contamination. Science 1984, 224, 673. [Google Scholar] [CrossRef] [Green Version]
  17. Bulut, O.F.; Duru, B.; Cakmak, O.; Gunhan, O.; Dilek, F.B.; Yetis, U. Determination of groundwater threshold values: A methodological approach. J. Clean. Prod. 2020, 253, 120001. [Google Scholar] [CrossRef]
  18. Liu, D.; Qi, X.; Li, M.; Zhu, W.F.; Zhang, L.L.; Faiz, M.A.; Khan, M.I.; Li, T.X.; Cui, S. A resilience evaluation method for a combined regional agricultural water and soil resource system based on Weighted Mahalanobis distance and a Gray-TOPSIS model. J. Clean. Prod. 2019, 229, 667–679. [Google Scholar] [CrossRef]
  19. Grimmeisen, F.; Lehmann, M.F.; Liesch, T.; Goeppert, N.; Klinger, J.; Zopfi, J.; Goldscheider, N. Isotopic constraints on water source mixing, network leakage and contamination in an urban groundwater system. Sci. Total Environ. 2017, 583, 202–213. [Google Scholar] [CrossRef]
  20. Lin, S.S.; Shen, S.L.; Zhou, A.; Lyu, H.M. Assessment and management of lake eutrophication: A case study in Lake Erhai, China. Sci. Total Environ. 2021, 751, 141618. [Google Scholar] [CrossRef]
  21. Liu, J.T.; Gao, Z.J.; Wang, Z.Y.; Xu, X.Y.; Su, Q.; Wang, S.; Qu, W.L.; Xing, T.J. Hydrogeochemical processes and suitability assessment of groundwater in the Jiaodong Peninsula, China. Environ. Monit. Assess. 2020, 192, 384. [Google Scholar] [CrossRef] [PubMed]
  22. Jandu, A.; Malik, A.; Dhull, S.B. Fluoride and nitrate in groundwater of rural habitations of semiarid region of northern Rajasthan, India: A hydrogeochemical, multivariate statistical, and human health risk assessment perspective. Environ. Geochem. Health 2021, 43, 3997–4026. [Google Scholar] [CrossRef]
  23. Mandal, R.; Das, A.; Sudheer, A.K.; Kumar, S.; Verma, S.; Gaddam, M.; Deshpande, R.D. Sources, controls, and probabilistic health risk assessment of fluoride contamination in groundwater from a semi-arid region in Gujarat, Western India: An isotope-hydrogeochemical perspective. Environ. Geochem. Health 2021, 43, 4043–4059. [Google Scholar] [CrossRef]
  24. He, Z.; Han, D.; Song, X.; Yang, S. Impact of human activities on coastal groundwater pollution in the Yang-Dai River plain, northern China. Environ. Sci. Pollut. Res. 2020, 27, 37592–37613. [Google Scholar] [CrossRef] [PubMed]
  25. Sener, S.; Sener, E.; Varol, S. Hydro-chemical and microbiological pollution assessment of irrigation water in Kizilirmak Delta (Turkey). Environ. Pollut. 2020, 266, 115214. [Google Scholar] [CrossRef] [PubMed]
  26. Chen, X.C.; Luo, Q.; Wang, D.H.; Gao, J.J.; Wei, Z.; Wang, Z.J.; Zhou, H.D.; Mazumder, A. Simultaneous assessments of occurrence, ecological, human health, and organoleptic hazards for 77 VOCs in typical drinking water sources from 5 major river basins, China. Environ. Pollut. 2015, 206, 64–72. [Google Scholar] [CrossRef]
  27. Liu, Y.; Hao, S.R.; Zhao, X.R.; Li, X.; Qiao, X.C.; Dionysiou, D.D.; Zheng, B.H. Distribution characteristics and health risk assessment of volatile organic compounds in the groundwater of Lanzhou City, China. Environ. Geochem. Health 2020, 42, 3609–3622. [Google Scholar] [CrossRef]
  28. Harun, H.H.; Kasim, M.R.M.; Nurhidayu, S.; Ash’aari, Z.H.; Kusin, F.M.; Karim, M.K.A. Association of Physicochemical Characteristics, Aggregate Indices, Major Ions, and Trace Elements in Developing Groundwater Quality Index (GWQI) in Agricultural Area. Int. J. Environ. Res. Public Health 2021, 18, 4562. [Google Scholar] [CrossRef]
  29. Ramanathan, A.L. Seasonal variation in the major ion chemistry of Pandoh Lake, Mandi District, Himachal Pradesh, India. Appl. Geochem. 2007, 22, 1736–1747. [Google Scholar] [CrossRef]
  30. Singh, C.K.; Kumar, A.; Shashtri, S.; Kumar, A.; Kumar, P.; Mallick, J. Multivariate statistical analysis and geochemical modeling for geochemical assessment of groundwater of Delhi, India. J. Geochem. Explor. 2017, 175, 59–71. [Google Scholar] [CrossRef]
  31. Singh, K.P.; Malik, A.; Mohan, D.; Sinha, S. Multivariate statistical techniques for the evaluation of spatial and temporal variations in water quality of Gomti River (India)—A case study. Water Res. 2004, 38, 3980–3992. [Google Scholar] [CrossRef] [PubMed]
  32. Boonkaewwan, S.; Sonthiphand, P.; Chotpantarat, S. Mechanisms of arsenic contamination associated with hydrochemical characteristics in coastal alluvial aquifers using multivariate statistical technique and hydrogeochemical modeling: A case study in Rayong province, eastern Thailand. Environ. Geochem. Health 2021, 43, 537–566. [Google Scholar] [CrossRef] [PubMed]
  33. Gao, Z.; Han, C.; Xu, Y.; Zhao, Z.; Luo, Z.; Liu, J. Assessment of the water quality of groundwater in Bohai Rim and the controlling factors-a case study of northern Shandong Peninsula, north China. Environ. Pollut. 2021, 285, 117482. [Google Scholar] [CrossRef]
  34. Abdul-Wahab, D.; Adomako, D.; Abass, G.; Adotey, D.K.; Anornu, G.; Ganyaglo, S. Hydrogeochemical and isotopic assessment for characterizing groundwater quality and recharge processes in the Lower Anayari catchment of the Upper East Region, Ghana. Environ. Dev. Sustain. 2021, 23, 5297–5315. [Google Scholar] [CrossRef]
  35. Gao, Z.J.; Liu, J.T.; Li, F.Q.; Wang, M.; Feng, J.G.; Wu, G.W. Hydrochemical Characteristics and Temporal Variations of Geothermal Water Quality in Tangtou, Shandong, China. Water 2019, 11, 1643. [Google Scholar] [CrossRef] [Green Version]
  36. Liu, J.T.; Gao, Z.J.; Wang, M.; Li, Y.Z.; Ma, Y.Y.; Shi, M.J.; Zhang, H.Y. Study on the dynamic characteristics of groundwater in the valley plain of Lhasa City. Environ. Earth Sci. 2018, 77, 646. [Google Scholar] [CrossRef]
  37. Piper, A.M. A graphic procedure in the geochemical interpretation of water-analyses. Eos Trans. Am. Geophys. Union 1944, 25, 914–928. [Google Scholar] [CrossRef]
  38. Jang, Y.C.; Townsend, T. Sulfate leaching from recovered construction and demolition debris fines. Adv. Environ. Res. 2001, 5, 203–217. [Google Scholar] [CrossRef]
  39. van den Brand, T.P.H.; Roest, K.; Chen, G.-H.; Brdjanovic, D.; van Loosdrecht, M.C.M. Adaptation of Sulfate-Reducing Bacteria to Sulfide Exposure. Environ. Eng. Sci. 2016, 33, 242–249. [Google Scholar] [CrossRef]
  40. Pant, R.R.; Zhang, F.; Rehman, F.U.; Wang, G.X.; Ye, M.; Zeng, C.; Tang, H.D. Spatiotemporal variations of hydrogeochemistry and its controlling factors in the Gandaki River Basin, Central Himalaya Nepal. Sci. Total Environ. 2018, 622, 770–782. [Google Scholar] [CrossRef]
  41. Liu, F.; Song, X.F.; Yang, L.H.; Han, D.M.; Zhang, Y.H.; Ma, Y.; Bu, H.M. The role of anthropogenic and natural factors in shaping the geochemical evolution of groundwater in the Subei Lake basin, Ordos energy base, Northwestern China. Sci. Total Environ. 2015, 538, 327–340. [Google Scholar] [CrossRef]
  42. Li, P.Y.; Wu, J.H.; Qian, H.; Zhang, Y.T.; Yang, N.A.; Jing, L.J.; Yu, P.Y. Hydrogeochemical Characterization of Groundwater in and Around a Wastewater Irrigated Forest in the Southeastern Edge of the Tengger Desert, Northwest China. Expo. Health 2016, 8, 331–348. [Google Scholar] [CrossRef]
  43. Gibbs, R.J. Mechanisms controlling world water chemistry. Science 1970, 170, 1088–1090. [Google Scholar] [CrossRef] [PubMed]
  44. Gaillardet, J.; Dupre, B.; Louvat, P.; Allegre, C.J. Global silicate weathering and CO2 consumption rates deduced from the chemistry of large rivers. Chem. Geol. 1999, 159, 3–30. [Google Scholar] [CrossRef]
  45. Ion, I.; Ion, A.C.; Calin, M.R.; Radulescu, I.; Bogdan, D. Assessment of Chemical Parameters and Natural Radionuclides Concentrations in Carbonated Natural Mineral Water and Contribution to Radiation Dose. Rom. J. Phys. 2019, 64, 804. [Google Scholar]
  46. Liu, X.; Wang, X.L.; Zhang, L.; Fan, W.Y.; Yang, C.; Li, E.H.; Wang, Z. Impact of land use on shallow groundwater quality characteristics associated with human health risks in a typical agricultural area in Central China. Environ. Sci. Pollut. Res. 2021, 28, 1712–1724. [Google Scholar] [CrossRef]
  47. Sohrabi, M.; Mehrjerdi, M.Z.; Karimi, S.; Tavallali, V. Using gypsum and selenium foliar application for mineral biofortification and improving the bioactive compounds of garlic ecotypes. Ind. Crop. Prod. 2020, 154, 112742. [Google Scholar] [CrossRef]
  48. Zhang, Q.Y.; Xu, P.P.; Qian, H.; Yang, F.X. Hydrogeochemistry and fluoride contamination in Jiaokou Irrigation District, Central China: Assessment based on multivariate statistical approach and human health risk. Sci. Total Environ. 2020, 741, 140460. [Google Scholar] [CrossRef]
  49. Schoeller, H. Qualitative evaluation of groundwater resources. In Methods and Techniques of Groundwater Investigation and Development; UNESCO: Paris, France, 1965; pp. 54–83. [Google Scholar]
  50. Li, P.Y.; Wu, J.H.; Qian, H. Hydrochemical appraisal of groundwater quality for drinking and irrigation purposes and the major influencing factors: A case study in and around Hua County, China. Arab. J. Geosci. 2016, 9, 15. [Google Scholar] [CrossRef]
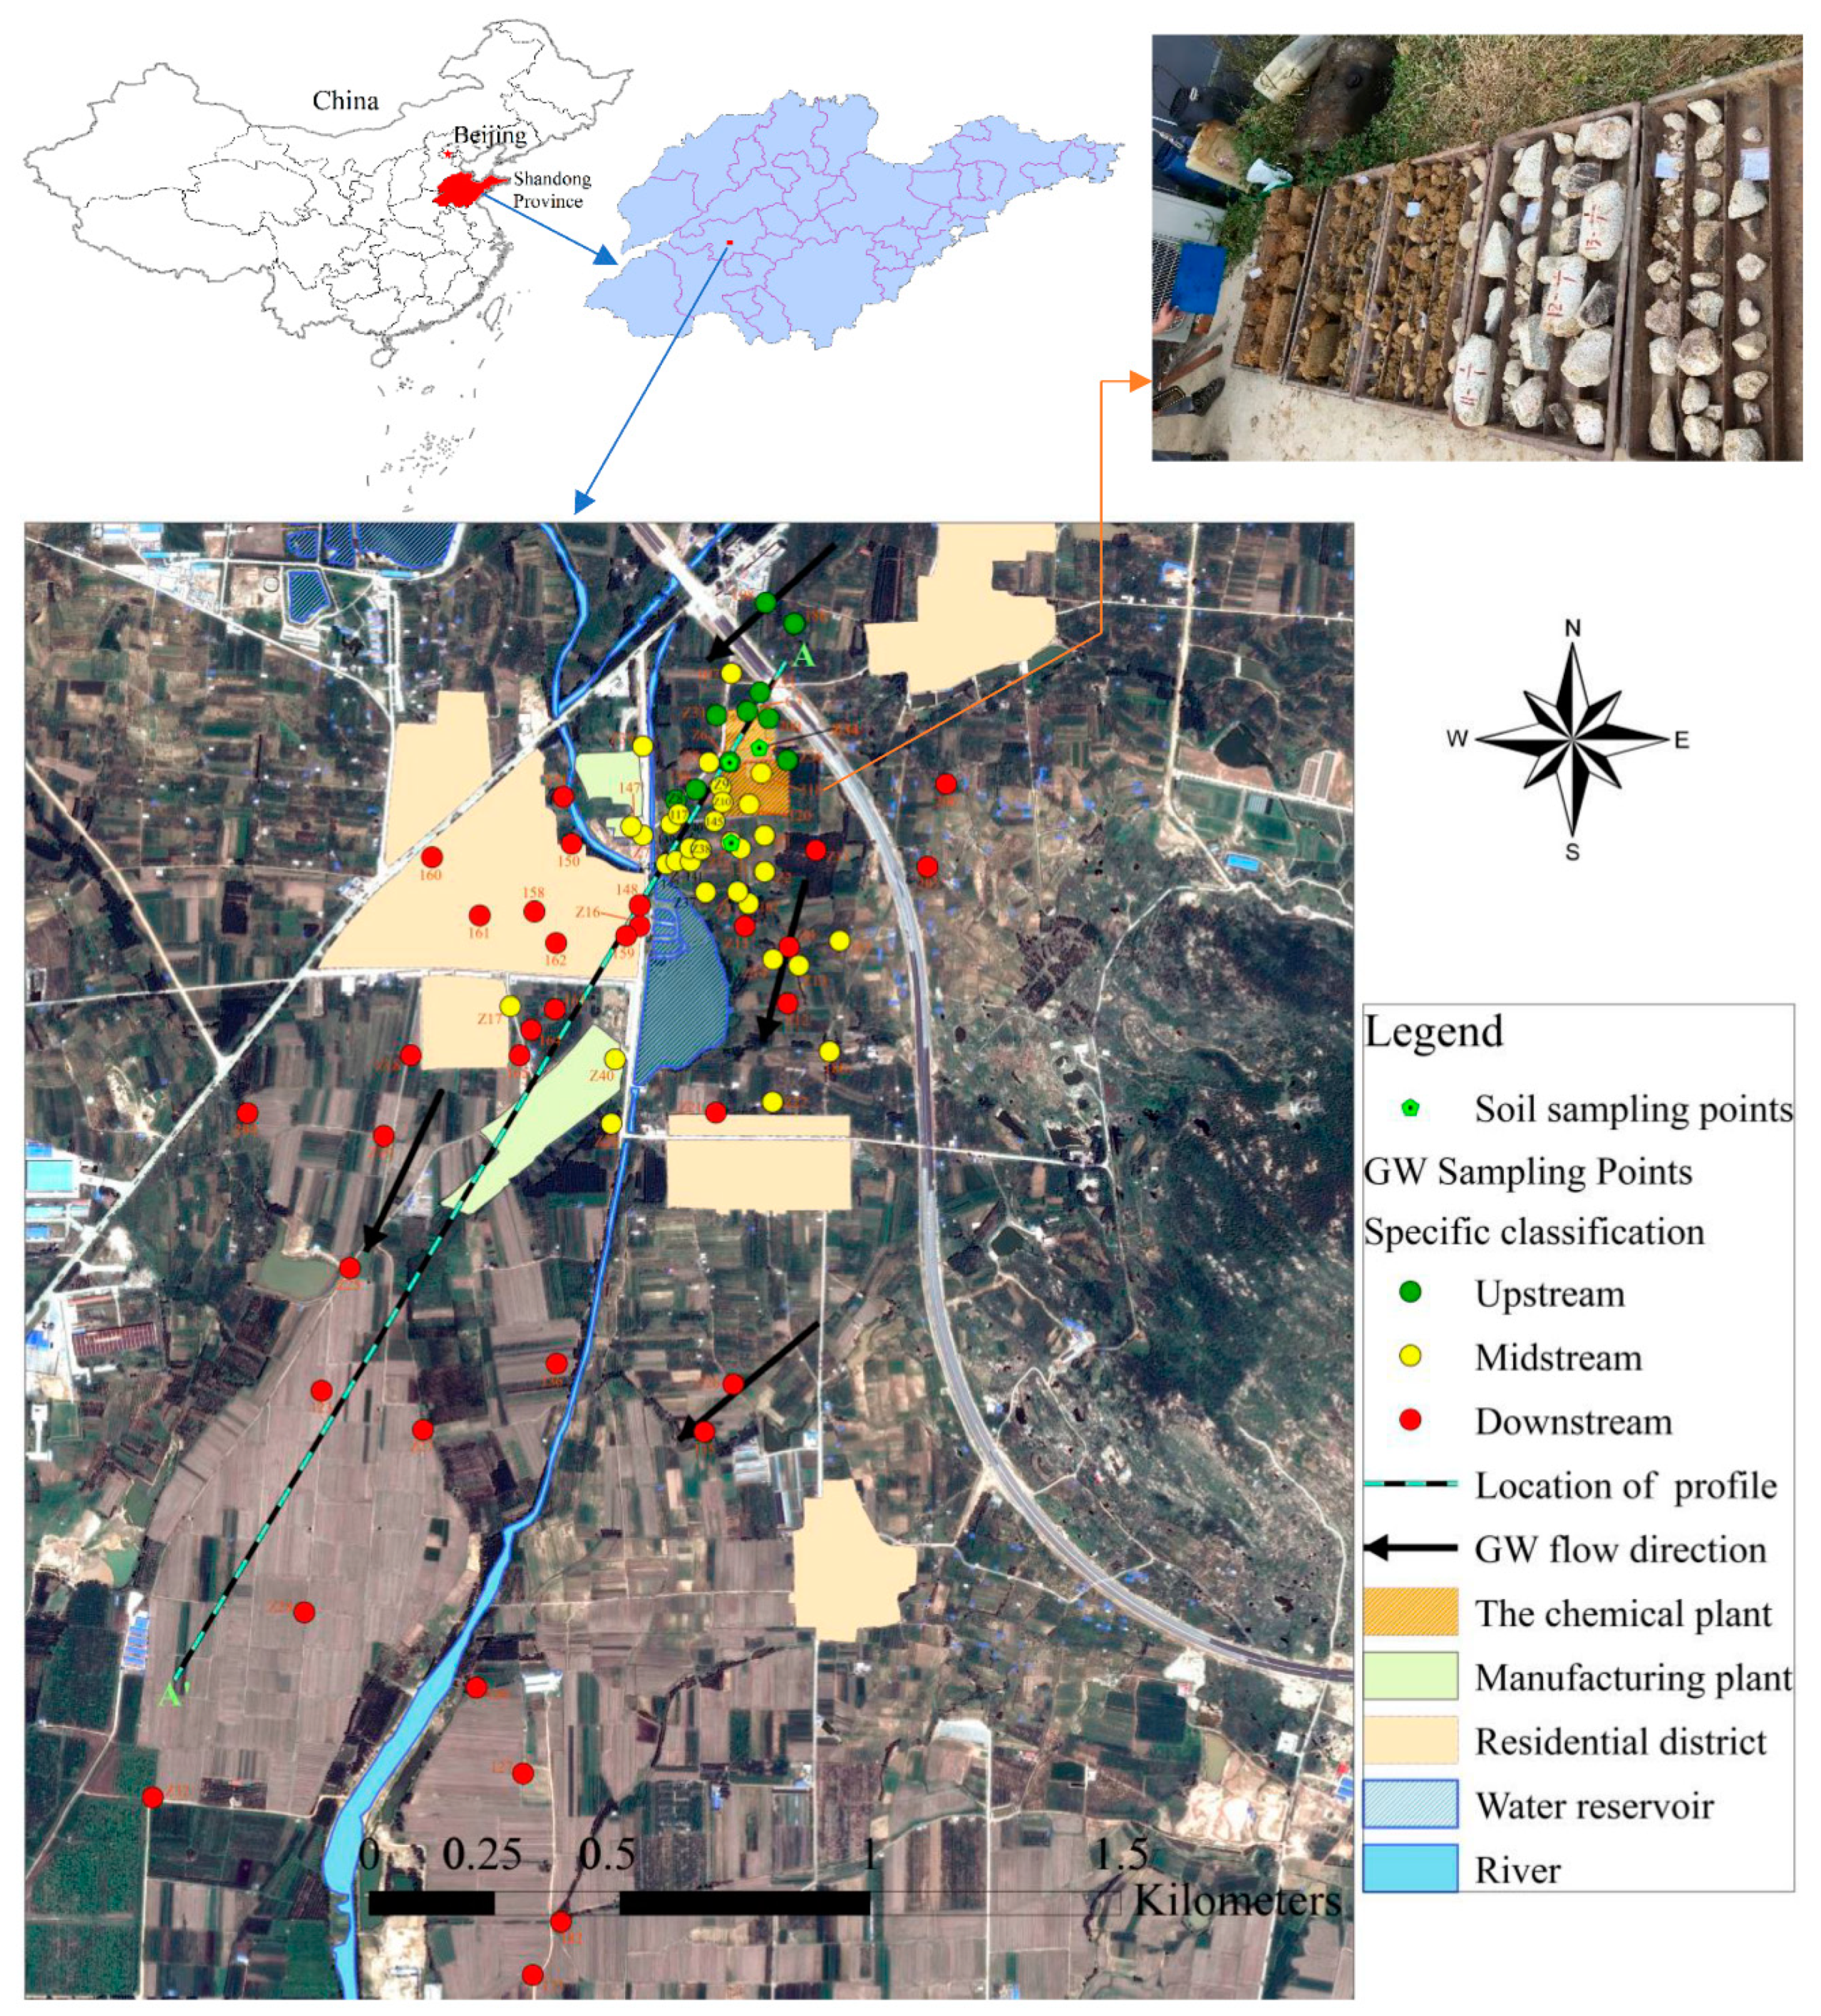
Figure 1. Location of groundwater samples and soil samples.
Sustainability 14 00660 g001
Figure 2. Geologic profile of A–A’.
Sustainability 14 00660 g002
Figure 3. Piper diagram representing the chemistry of the groundwater.
Sustainability 14 00660 g003
Figure 4. (a) The plot of TDS versus Cl/(Cl + HCO3) (b) and TDS versus (Na+)/(Na+ + Ca2+).
Sustainability 14 00660 g004
Figure 5. Spatial variability in groundwater salinity.
Sustainability 14 00660 g005
Figure 6. Gaillardet diagrams of groundwater samples (a) (HCO3/Na+) versus (Ca2+/Na+), (b) (Mg2+/Na+) versus (Ca2+/Na+).
Sustainability 14 00660 g006
Figure 7. The ratio diagram of γ(K+ + Na+) and γ(Cl).
Sustainability 14 00660 g007
Figure 8. Binary diagram: (a) (Ca2+ + Mg2+) versus (HCO3 + SO42−), (b) (SO42− + Cl) versus (HCO3), (c) (Ca2+) versus (SO42−), (d) (Ca2+) versus (HCO3), (e) (Ca2+ + Mg2+) versus (HCO3), (f) (Ca2+) versus (Mg2+), (g) (Ca2+ + Mg2+)/(HCO3) versus (SO42−/HCO3), (h) (Na+ − Cl) versus (Ca2+ + Mg2+) − (HCO3 + SO42−), (i) CAI-II versus CAI-I.
Sustainability 14 00660 g008aSustainability 14 00660 g008b
Figure 9. Distribution plot of heavy metal contents in soil.
Sustainability 14 00660 g009
Figure 10. Comparison point plot of the excessive rate and detection frequency of organic pollutants.
Sustainability 14 00660 g010
Figure 11. The bar and line plot of the detection frequency of organic pollutants.
Sustainability 14 00660 g011
Figure 12. The bar and line plot of the excessive rate of organic pollutants.
Sustainability 14 00660 g012
Figure 13. The content variation plot of CCl4 and CCl3F in three groups.
Sustainability 14 00660 g013
Figure 14. The content variation plot of C2H4Cl2 and C2H2Cl4 in three groups.
Sustainability 14 00660 g014
Figure 15. The content variation plot of C2HCl3 and C2Cl4 in three groups.
Sustainability 14 00660 g015
Figure 16. The content variation plot of CH2ClCHCl2 and CHCl3 in three groups.
Sustainability 14 00660 g016
Table 1. The specific classification and sampling depths of the shallow groundwater samples.
Groundwater ClassificationSample NumberSampling Depth (m)Sample NumberSampling Depth (m)Sample NumberSampling Depth (m)
UpstreamZ31-14.5200-211.5Z36-210.4
Z31-26.6200-319.8Z36-316.5
Z31-39.1Z6-27.31385.4
Z335.3Z6-310.4Z8-212
C3-27.71866.5Z8-320.8
C3-311.81086.4
MidstreamZ5-13.7Z2-29.3Z14-314.8
Z5-27.8Z2-312.8Z1312.8
Z5-312.21433.3Z22-29.6
1074.21424.4Z22-311.3
Z9-211.11414.71033.2
Z9-317.61405.11804.4
Z10-210.3Z38-27.6Z20-24.8
Z10-316Z38-311.2Z20-36.3
120-213.2Z35-212.5Z40-24.6
120-326Z35-319.8Z40-36.6
118481215.6Z17-25.7
139-25.61026.8Z17-37.4
139-37.2Z37-28.1Z39-29.5
1174Z37-312.2Z39-315.8
1455.3Z3-28.6Z7-25.9
Z1-29Z3-313.1Z7-38.8
Z1-312.8Z14-211.514720.5
DownstreamZ11-29.61624.91359.2
Z12-315.115830.21364.7
Z412.316119.3Z27-213.5
Z15-28.316035.5Z27-321
Z15-311.81513.8173-28.3
Z21-261501.4173-39.3
Z21-37.3Z18-217.2182-26.7
165-24.4Z18-327182-37.6
165-35.6Z19-212.1Z29-216.7
163-24.3Z19-316.4Z29-325.8
163-35.3Z25-210.9Z32-216.8
1643.8Z25-314.4Z32-325.8
148-24.41236.81275.7
148-35.4Z28-2131263.1
Z16-28.7Z28-317.82054.1
Z16-313.72044.92066.2
1594.2Z2611.6
Table 2. General statistics about the physicochemical parameters of the groundwater samples.
ParametersUnitsMinimumMaximumMeanSDCV (%)
pH 5.778.086.950.344.92
TDSmg/L374.001910.00874.98349.3339.92
Clmg/L29.60765.00147.20127.5486.64
SO42−mg/L110.00502.00183.9457.6531.34
NO3mg/L0.0098.3021.0218.6988.88
HCO32−mg/L40.00380.00177.3867.3937.99
Ca2+mg/L61.60375.00140.3957.7541.14
Mg2+mg/L13.0067.1027.7310.4637.70
K+mg/L0.9580.504.979.80197.23
Na+mg/L25.90219.0061.6439.1763.55
Mn+mg/L0.165090.48233.49727.95311.77
Table 3. Pearson correlation matrix between different physical and chemical parameters.
pHK+Na+Ca2+Mg2+ClSO42−HCO3TDSECNO3
pH10.033−0.003−0.533 **−0.517 **−0.587 **−0.0390.486 **−0.382 **−0.378 **−0.154
K+ 10.410 **0.301 **0.1380.224 *0.1570.452 **0.472 **0.466 **0.469 **
Na+ 10.325 **0.273 **0.392 **0.400 **0.383 **0.467 **0.610 **0.397 **
Ca2+ 10.845 **0.875 **0.366 **0.0160.830 **0.904 **0.483 **
Mg2+ 10.804 **0.518 **−0.1790.675 **0.725 **0.206 *
Cl 10.162−0.191 *0.767 **0.850 **0.228 *
SO42− 10.0860.366 **0.386 **0.197 *
HCO3 10.1410.239 **0.393 **
TDS 10.875 **0.554 **
EC 10.599 **
NO3 1
* Significant correlation at the 0.05 level (two tailed), ** significant correlation at the 0.01 level (two tailed).
Table 4. Principal component loadings and explained variance for the first three components.
ParameterComponent 1Component 2Component 3
EC0.9690.104−0.054
Ca2+0.933−0.188−0.058
TDS0.9110.052−0.091
Cl0.861−0.358−0.122
Mg2+0.819−0.3710.264
NO30.5810.448−0.307
Na+0.5750.4620.239
HCO30.1190.876−0.042
pH−0.4930.6460.26
K+0.4730.573−0.257
SO42−0.4660.1220.802
Explained variance (%)49.24920.5189.347
The absolute values of the loading values larger than 0.75 are in bold.
Table 5. General statistics of heavy metals in 25 soil samples.
ItemFeMnKCaNaMg
Z34Mean (mg/kg)25,057.14486.1425,114.298127.1420,614.296360.00
Maximum (mg/kg)35,100114029,70012,50030,6008370
Minimum (mg/kg)14,20034318,300349013,8003260
SD7670.48289.044647.382758.486567.452027.76
Z35Mean (mg/kg)49,287.50732.8814,495.0029,262.5025,400.0013,005.00
Maximum (mg/kg)66,500127021,90044,90030,20021,800
Minimum (mg/kg)23,100309697010,10018,6005810
SD20,435.29349.576280.9715,850.104816.045770.15
Z06Mean (mg/kg)20,800540.728,00012,94825,7104762
Maximum (mg/kg)36,000140035,80026,10037,0008070
Minimum (mg/kg)11,20021019,100290012,5002550
SD9173.51337.106741.418348.628966.782106.38
AllMean (mg/kg)31,714.88586.5722,536.4316,779.2123,908.108042.33
Table 6. Organic pollution characteristics of the groundwater in the study area.
CompoundDetection Limit (μg/L)/RatioAverage Detection Concentration (μg/L)Water Quality Standard (μg/L)Over-Limit Ratio (%)
Trichlorofluoromethane0.5/42.37%666.12 10,0000.85
Carbon tetrachloride0.5/39.83%2059.82 239.83
Trichloroethene0.5/38.98%175.74 706.78
1,1,2-Trichloroethane0.5/39.83%145.22 528.81
Perchloroethylene0.5/27.97%157.62 405.08
1,1,2,2-Tetrachloroethane0.5/34.75%410.67 4005.93
Chloroform0.5/46.61%69.36 6010.17
Table 7. Difference of detection values of organic pollutants in groundwater.
CompoundUnitsWater Quality StandardDetection MaximumDetection Minimum
Trichlorofluoromethaneμg/L10,00020,4000.5
Carbon tetrachlorideμg/L269,5002.2
Trichloroetheneμg/L7059000.6
1,1,2-Trichloroethaneμg/L535000.6
Perchloroethyleneμg/L4042400.9
1,1,2,2-Tetrachloroethaneμg/L40011,7001.8
Chloroformμg/L608110.6
Publisher’s Note: MDPI stays neutral with regard to jurisdictional claims in published maps and institutional affiliations.