Article

Assessment of the Sustainability of Concrete by Ensuring Performance during Structure Service Life

Department of Reinforced Concrete Structures, Technical University of Civil Engineering Bucharest, 020396 Bucharest, Romania
*
Author to whom correspondence should be addressed.
Sustainability 2022, 14(2), 617; https://doi.org/10.3390/su14020617
Submission received: 9 December 2021 / Revised: 28 December 2021 / Accepted: 5 January 2022 / Published: 6 January 2022

Abstract

:
The article presents an original method to assess the sustainability of concrete. The method uses three parameters, namely, performance, lifetime and environmental impact, to calculate a sustainability index. The originality and simplicity of the proposed method is shown when finding the sustainability index, where the first two factors (service life and performance) are kept constant. This approach is possible within the context of the new proposals that specify the durability of structural concrete in EN 1992 and EN 206. It allows the classification of concrete according to its performance, through environmental action resistance classes (ERC). For this purpose, specific experimental methods were used in order to determine the performance of concrete exposed to carbonation. The concretes were prepared with two cement types with additions (CEM II/A-S and CEM II/A-M (S-LL)). Based on the carbonation resistance classes (first parameter—performance) and exposure classes, the thickness of the concrete cover layer was determined to ensure a certain service lifetime (second parameter—service lifetime). Lastly, the global warming potential was calculated for each composition, allowing the users of the method to select the compositions with the lowest environmental impact.

1. Introduction

Sustainability is a general concept based on three dimensions: ecological, economical and sociocultural. This concept simultaneously and holistically deals with these requirements which have a different impact on sustainability. New trends in sustainability are clearly ecologically oriented (Figure 1, strong sustainability) and are the main target for our proposal presented in this article, to assess the sustainability of concrete [1].
It goes without saying that the building sector has an important influence on climate change. However, it would be incomplete to analyze constructions exclusively through their environmental impact. The method presented in the article aims for a more objective approach, related to the revision proposals of the European reinforced concrete standards.
Looking at the situation in Romania, there are indirect mentions of sustainability: Law no. 177/2015 [2] with the last amendments and completions of Law no. 10 (the Romanian building quality law published in the official Gazette of Romania) on quality in construction. This specifies the basic requirements of constructions, mainly related to hygiene, health and the environment, energy saving and sustainable use of natural resources. In this law, there are no unitary approaches to sustainability or guidelines to quantify and link such requirements, leading to an impossible enforcement of the law. Obviously, in the not-too-distant future, sustainability will become an important requirement for reinforced concrete structures. Therefore, an approach that can quantify this requirement will be needed and will take the following into account:
  • Sustainability in the design of reinforced concrete elements and structures;
  • Implementation of a system to classify reinforced concrete buildings from a sustainability perspective, based on indicators that are not related only to the environmental impact;
  • Development of a tool to assess sustainability at different levels of reinforced concrete, such as materials, elements and structures;
  • Optimization of the choice of materials/solutions/technologies to meet the requirements related to sustainability.
The method presented in the present article is a proposal to quantify the sustainability potential of concrete. Currently, the behavior over time of reinforced concrete structures is referred to only in terms of durability, which is naturally related to environmental or economical aspects. The method uses three parameters, namely, performance, lifetime and environmental impact, to calculate a sustainability index. The originality and simplicity of the proposed method presented in the article consists in the fact that by applying the relation to determine the sustainability index, the first two factors of service life and performance are constant. This approach is possible in the context of the new proposals to specify the durability of structural concrete in EN 1992 and EN 206.
Ensuring the durability of reinforced concrete structures is no longer strictly related to maintaining some of the concrete properties when exposed to different environments. It has acquired a global importance that is related to the sustainability of the built environment. Factors such as excessive consumption of materials needed for repair works, the negative effects on the environment through CO2 emissions and the large amount of energy needed to produce concrete are why we need to develop a different approach to assess the sustainability of concrete.
Additionally, the need to expand the utilization of blended cements, which obviously have a lower environmental impact, incentivizes the development of a new approach. In the current norms, whether we are talking about the unified European [3] or the national ones, there are no differences regarding the requirements for concrete formulations depending on cement type. The only thing that is specified in the national norms is related to the possibility of using a certain type of cement in one field/environment or another. The use of the same concrete formulations, i.e., W/C ratio, regardless of the cement type used, leads to different performances for environmental actions and implicitly to different service lifetimes (i.e., for the same W/C ratio, concretes prepared with different cement types have different carbonation depths, and consequently, service lifetimes of reinforced concrete constructions built with these concretes are different). In addition, there is also a lack of coherence of provisions in different countries. Considering the need for a unitary approach at the European level, our group proposes a performance method to characterize the durability of concrete, through environmental exposure resistance classes (ERC) [4,5,6,7]. This approach represents an alternative to the current descriptive one and will be present in the European regulations that concern reinforced concrete. In [4], the concept of environmental resistance class is presented in detail (for the first time) as a new method to specify the durability of structural concrete, a method implemented in the EN 1992 and EN 206 (CEN documents prepared by Joint Working Committee consisting of TC 104/SC1 and CEN TC 250/SC2, of which the first author of this article was a member).
The definition of the exposure resistance classes should be performance based, which will allow a technological development without the need to amend the classes. The definition should also be related to exposure conditions defined in the system of exposure classes, and with requirements corresponding to realistic requirements while not necessarily being the final ones. This would allow use of experience and observations from practice, to calibrate the requirements and to adjust concrete specifications in accordance with observations from real structures under normal service conditions. The requirement for carbonation resistance classes should be related to long-term exposure, Exposure Class XC3, while chloride resistance class should be related to Exposure Class XS2 as these are stable over time and can also be simulated with long-term tests in laboratories. Exposure Class XC3 gives the conditions where the rate of carbonation is relatively high and conditions where the rate of corrosion is not insignificant. Given that the end of life used in the calibration deriving minimum cover requirements is defined as carbonation, reaching the reinforcement causing depassivation/start corrosion XC3 exposure produces worse conditions than XC4 with respect to carbonation rate. The higher relative humidity in concrete exposed to XC4 means, however, that it will carbonate at a rate that is slower than in XC3 but start to corrode more quickly [4]. The definition and method of determining the carbonation resistance class are given in Section 3 of the paper.
The current generation of European standards for concrete contains a descriptive system of requirements (e.g., specification of maximum water/cement ratio, minimum cement content, minimum thickness of the concrete cover) and classes (e.g., exposure classes, consistency classes, compressive strength classes) to describe the performance (durability) of concrete. This system has some significant limitations in terms of durability when it is necessary to use new construction materials without having experience of their long-term use (e.g., new cements), or in ensuring the same service life, etc. Exposure resistance class (ERC) is a scientifically based concept that can be applied to determine the cement type areas of use, optimizing the concrete mix according to the exposure class, and is therefore an effective source of CO2 emission limitation. It creates the possibility to determine the water/cement ratio and the thickness of the concrete cover layer depending on cement type in order to achieve equal performance over the service life of the structures.
The application of the ERC concept allows the classification of concrete through the resistance classes to environmental actions, thus ensuring the same performance, a fundamental element in the application of the proposed method. Based on the carbonation resistance classes (the first constant—performance) and exposure classes, the thickness of the concrete cover layer was determined to ensure a certain service lifetime (second constant—service lifetime). Finally, the global warming potential was calculated for each composition, consequently allowing the users of the method to select the compositions with the lowest impact on the environment.

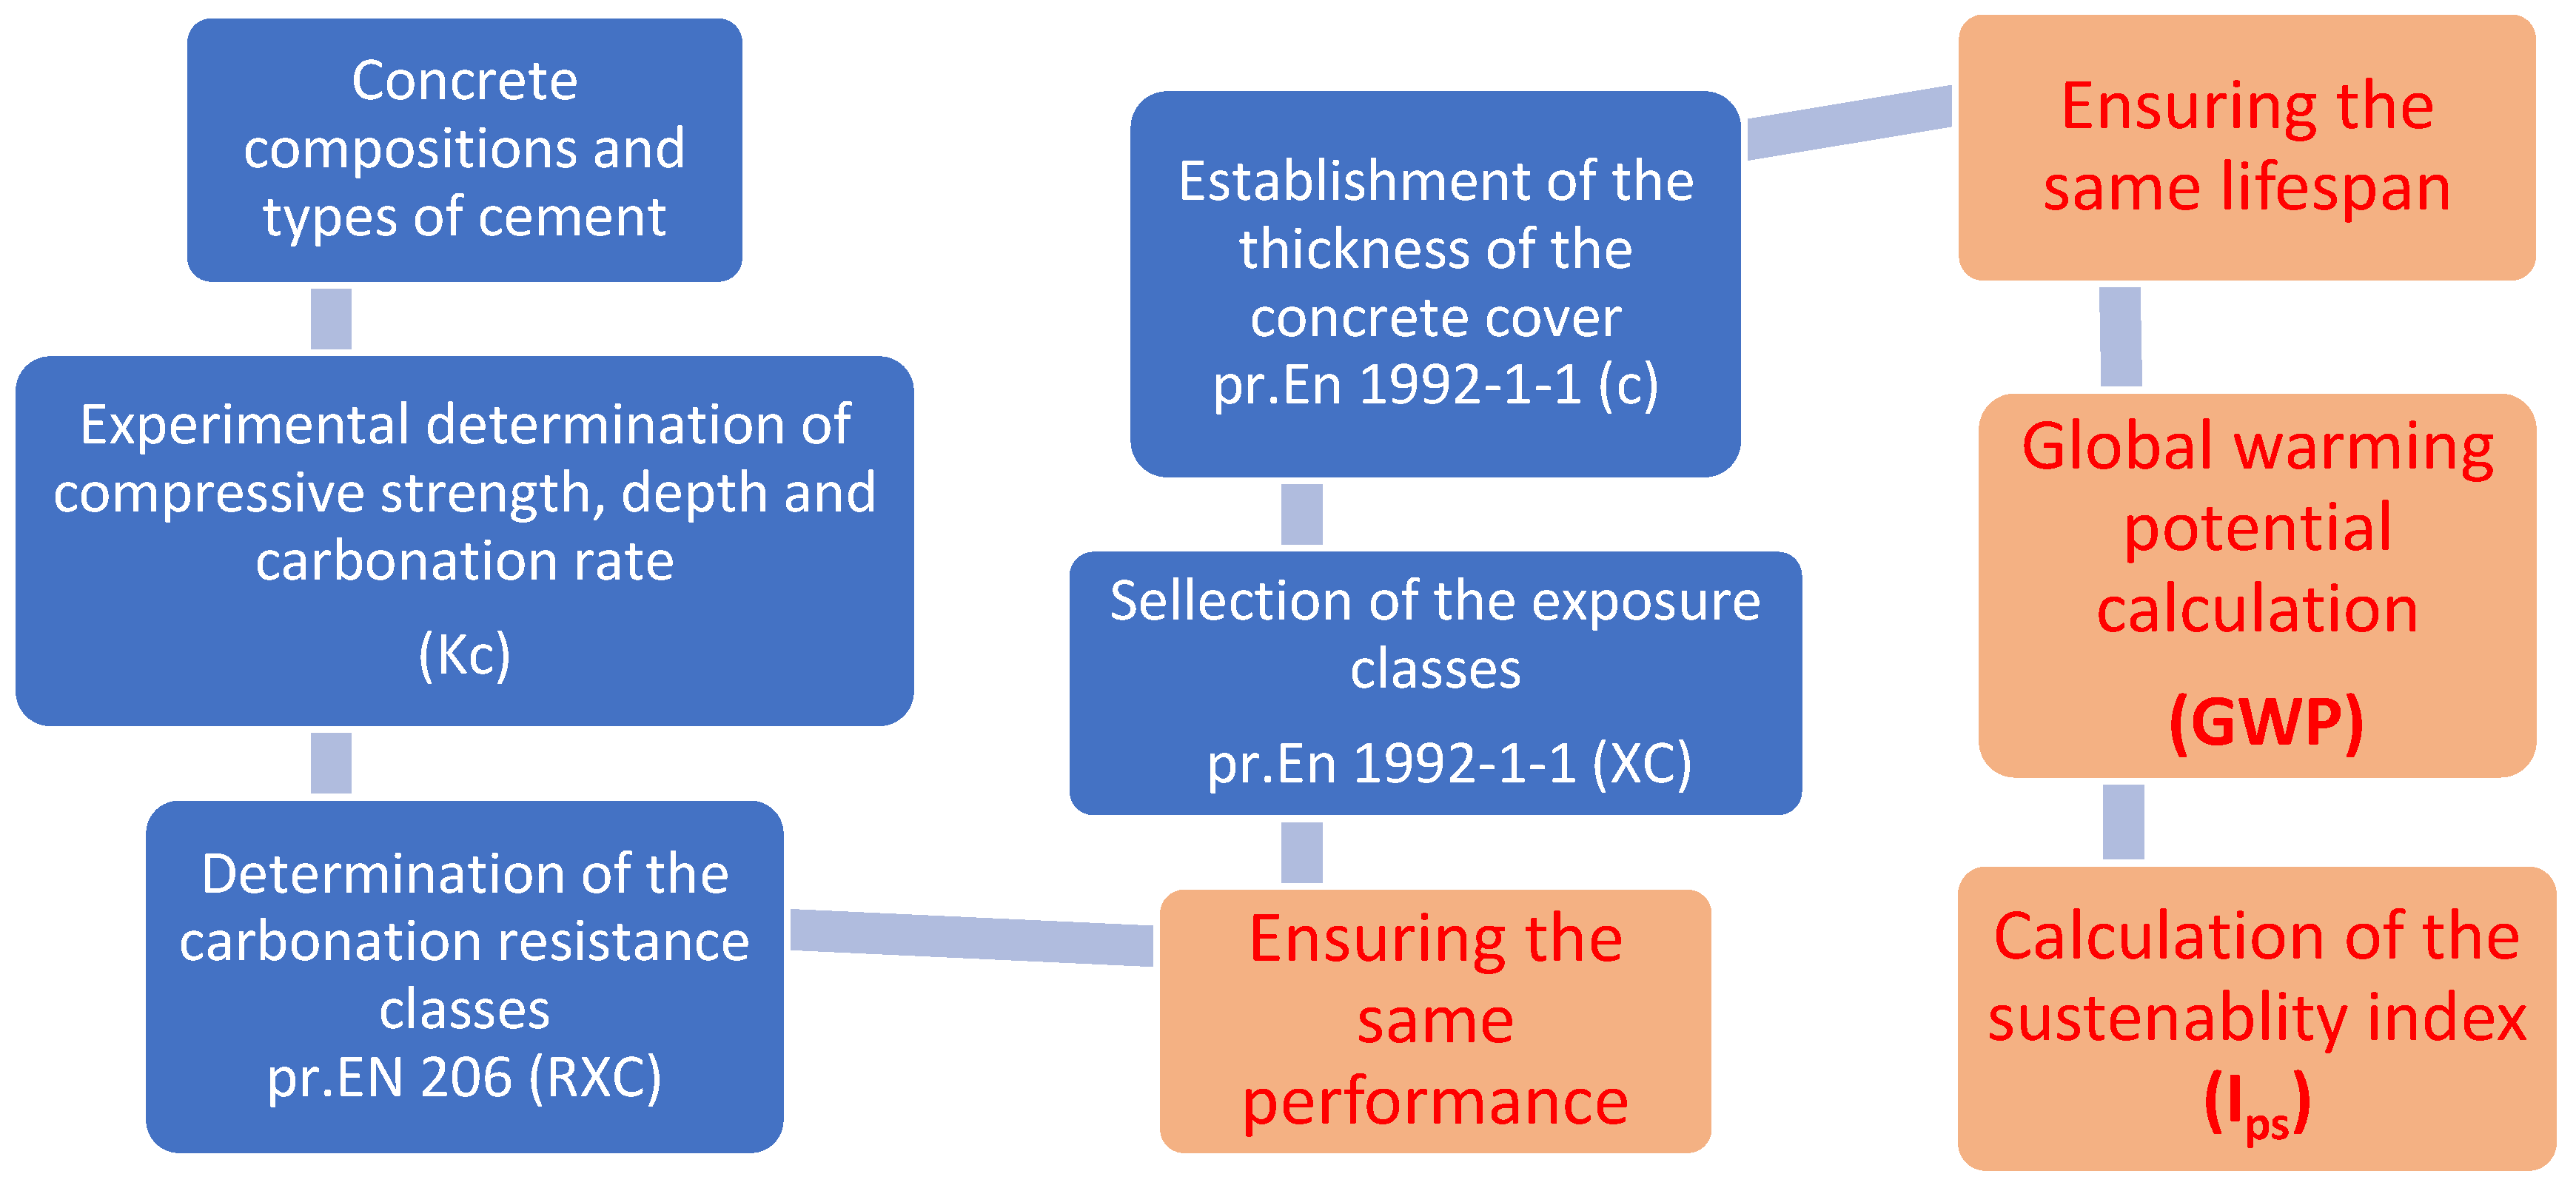
2. General Presentation of the Concept

2.1. General Considerations

At the European level, there are special concerns for the field of sustainability, both in unified European regulations and national strategies developed by EU countries, but also in the academic and research community. One recent academic example is that within the European University for Smart Urban Coastal Sustainability EU-CONEXUS, there is a course dedicated to this topic within the Minor “Coastal Development and Sustainable Maritime Tourism”, entitled “Sustainable Built Environment”.
The European Committee for Standardization (CEN) developed regulations that cover the case of new and existing constructions, all types of buildings and introduce the integrated performance of buildings throughout the life cycle. A number of standards address this issue for constructions and construction products in terms of environmental, economic and social performance. Within these unified European regulations, standards that must deal with the structural/technical or functional performances of the constructions are sketched, but not yet elaborated. Some countries in the European Union have clear strategies in this field and have developed their own guidelines and systems to assess sustainability [8,9]. Furthermore, there are internationally recognized initiatives for the classification of constructions from the sustainability perspectives that classify constructions, for example, BREEAM [10] in the United Kingdom or DGNB [11] in Germany.
The sustainability of constructions is regarded and presented most of the time in a somewhat simplistic way, often only from an ecological or energy efficiency point of view. The more complex approaches that holistically and multidimensionally analyze the pillars of sustainability are almost exclusively based on environment, economy and sociocultural aspects.
At the European level, there are approaches that are similar to the method proposed in this article, the design method developed by the Joint Research Center at the EC [12] or related to the association and interconnection between performance, service life and environmental impact [13,14] which refer, in particular, to reinforced concrete. The design method developed by the Joint Research Center at the EC [12] is a sustainable structural design (SSD) methodology having as essential parameters the environmental and structural performance during a lifetime. Emphasis is placed on associating the results of the environmental analysis with the performance analysis, which is treated in a probabilistic manner by introducing a simplified method of performance-based assessment. Finally, a global assessment parameter is calculated based on environmental costs, structural rehabilitation costs and financial losses resulting from disruptions in use, which allows different categories of stakeholders to make objective and informed decisions.
In [13] and [14], Muler et al. proposed a method to assess sustainability by calculating a building material sustainability potential index:
B u i l d i n g   M a t e r i a l   S u s t a i n a b i l i t y   P o t e n t i a l = S e r v i c e   L i f e × P e r f o r m a n c e E n v i r o n n e m e n t a l   I m p a c t
In this approach, the authors used different types of materials and formulations, obtaining different performance levels for the compressive strengths. Furthermore, they determined the service lifetime by a probabilistic approach, based on the carbonation depth and the environmental impact.
The fundamental difference between the method proposed in this article and the one in [13] and Ref. [14] is that in this case, the performance and the service lifetime are constant, and the calculation of the sustainability index for different types of materials/formulations results in the determinations of the environmental impact. The originality of the method proposed in the present article consists in a simplified but not simplistic analysis of sustainability having an impact on the environment, service life and structural performance, strictly related to the specific regulations for reinforced concrete. Sustainability analysis can thus be performed on three levels, for concrete as a material in itself, for reinforced concrete elements and for structures. In this article, the sustainability assessment is exemplified for reinforced concrete as a structural material.

2.2. Principles and Stages of the Method

The method makes a connection between these 3 steps:
  • SERVICE LIFE
  • PERFORMANCE
  • ENVIRONMENTAL IMPACT
In Figure 2 are presented the application steps for determining the carbonation resistance class and for the experimental study on how to determine the thickness of the concrete cover.
The application steps are as follows:
  • Service life determination. This is considered in accordance with the specific regulations: 50 or 100 years. Probabilistic methods can be applied if different service lifetimes are desired [15]; the presented method considers the provisions of the revision proposal of EN 1992-1-1, which presents the thickness of the concrete cover depending on the carbonation resistance class (RXC) and exposure class (XC) for lifetimes of 50 years and 100 years, respectively (Table 1).
  • Establishing the performance of the concrete. In this article, the performance is established for the compressive strength of the concrete and the depth of carbonation. Different types of cements and formulations are used to reach the same performance levels;
  • For different component materials and formulations, but for the same levels of performance and service life, it is possible to determine the environmental impact, thus allowing to select the formulation with the lowest environmental impact.

3. Application of the Method

3.1. Service Life

As the method has a practical regulatory applicability, the service lifetimes considered are 50 or 100 years. Obviously, this approach is possible considering the provisions of the European standards EN 206 [16] and EN 1992-1-1 [17] draft revisions.

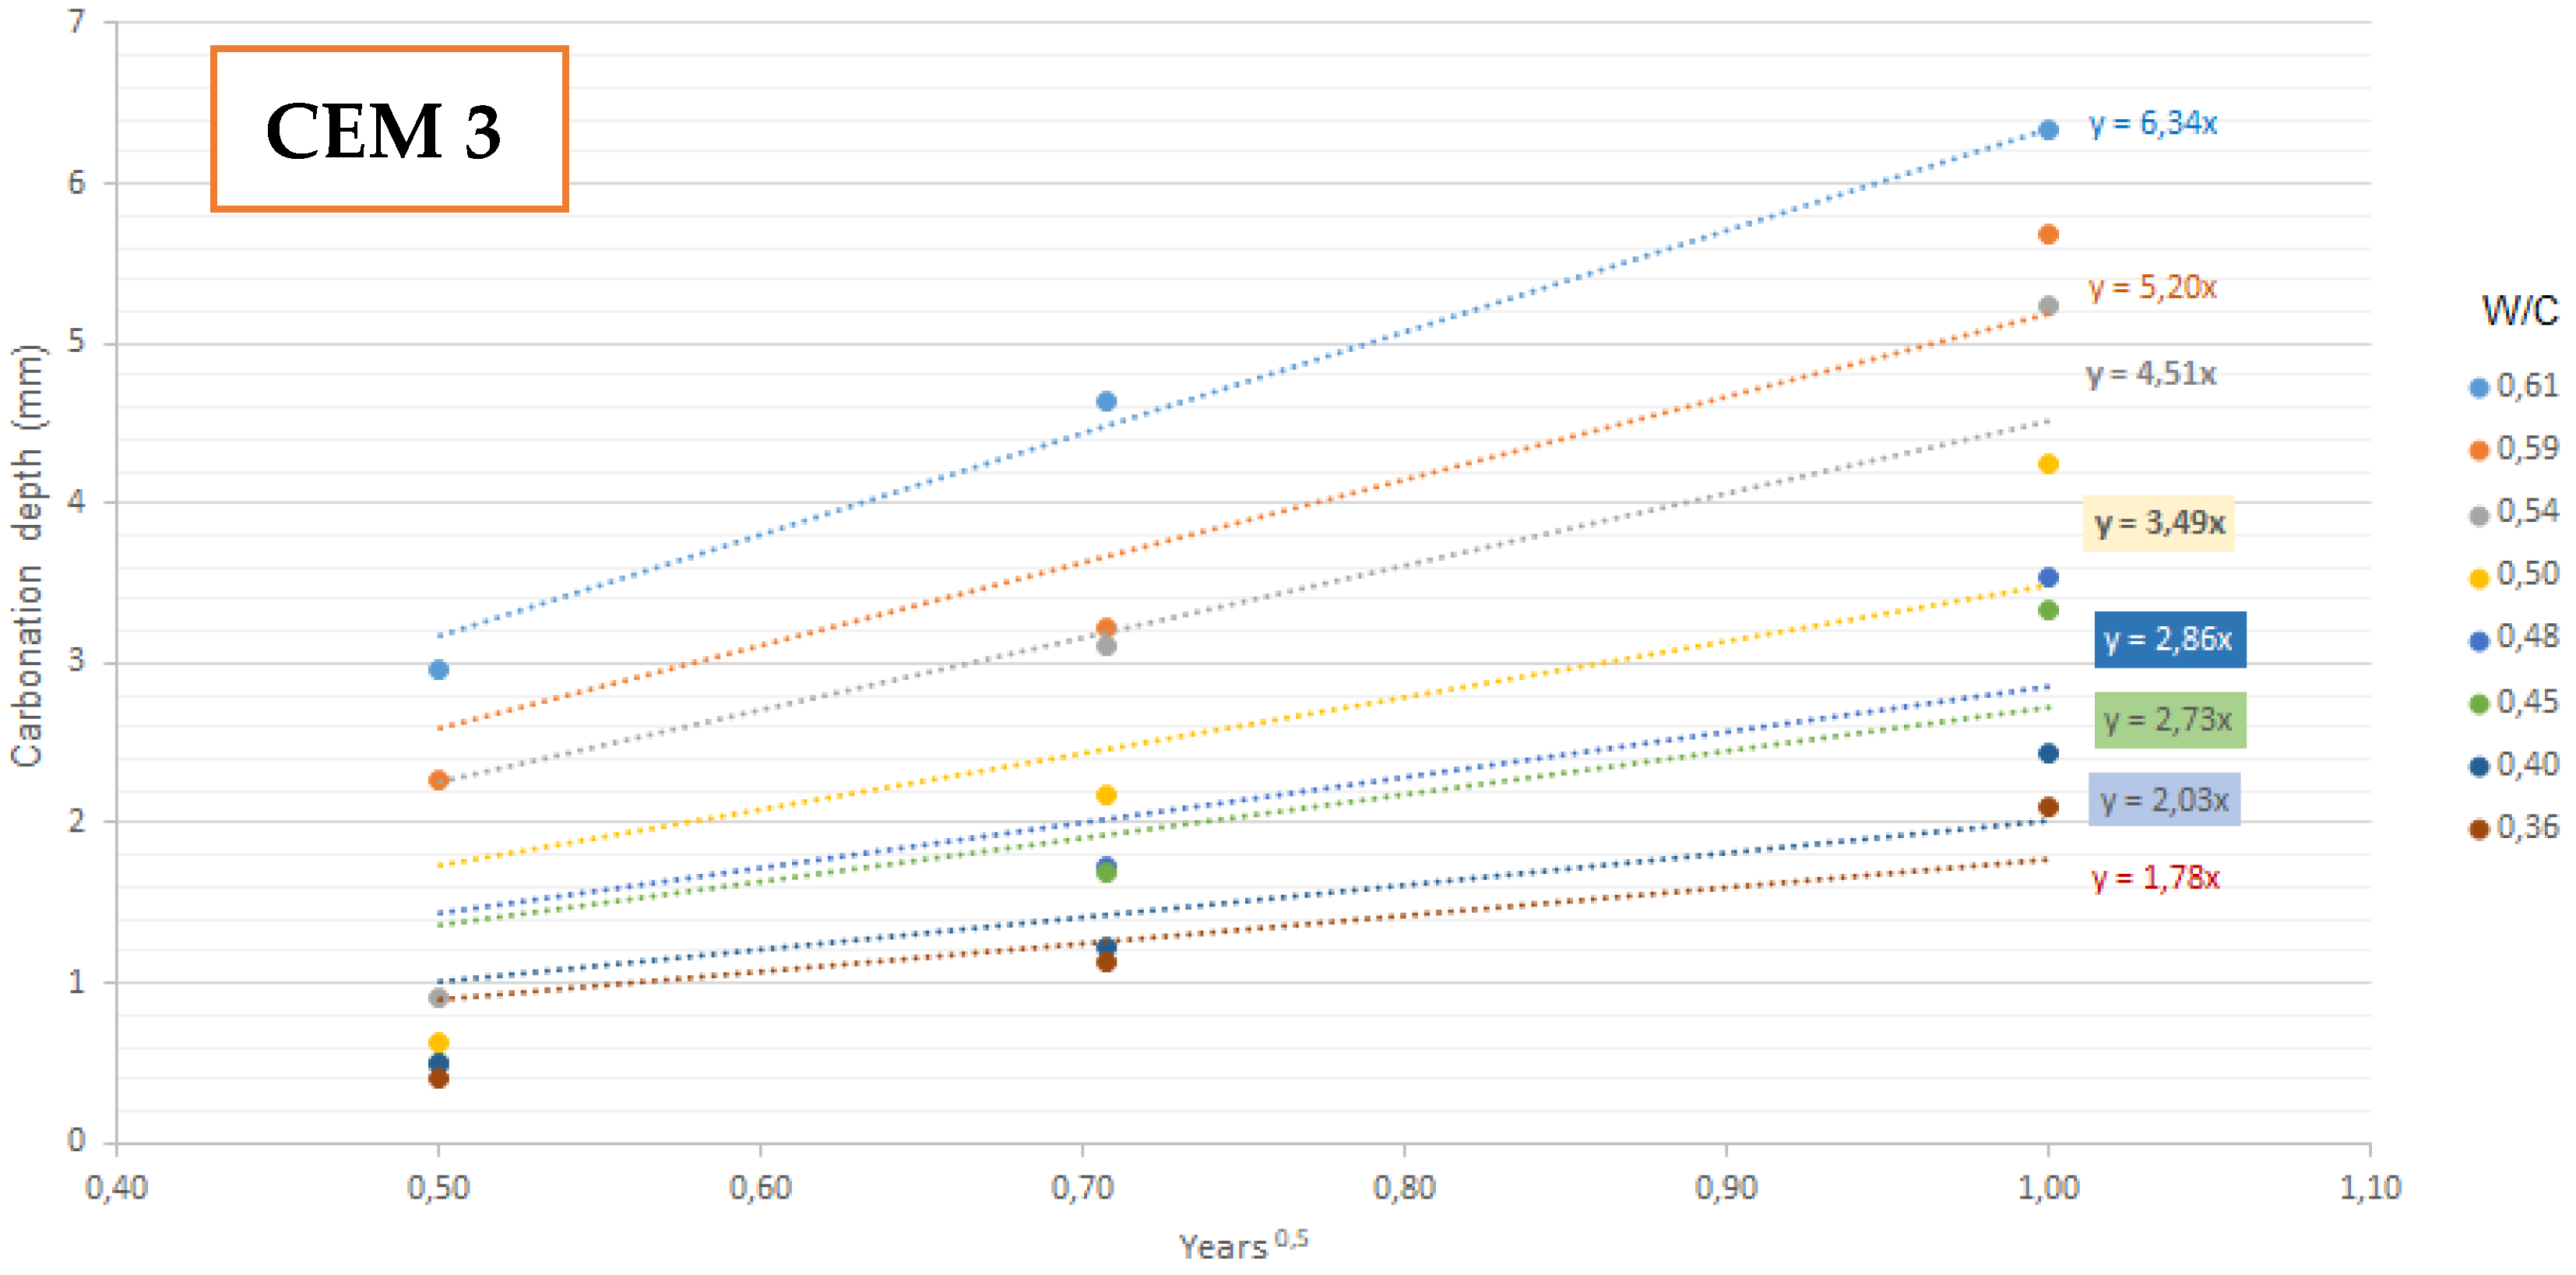
3.2. Determining the Carbonation Performance of Concrete

3.2.1. Defining Carbonation Resistance Classes

The designation of ERCs for resistance against corrosion induced by carbonation (RXC) is derived from the carbonation depth in mm (characteristic value of 90% fractile) expected to be obtained after 50 years under reference conditions (400 ppm CO2 in a constant 65% RH environment and at 20 °C). Referring to a nominal diffusion process, it has the dimension of a carbonation rate (mm/square root of time expressed in years) [4]. In order to determine the carbonation resistance class, the following steps must be completed:
  • Experimental determination of carbonation depth under controlled conditions of temperature, humidity and CO2 concentration;
  • Calculation of Kc (carbonation rate) for the ages at which experimental determinations were performed;
  • Calculation of carbonation depth X c at 50 years age ( X c = K c t ) ;
  • Determining the values of the W/C ratios that ensure the achievement of the different carbonation resistance classes (Table 2);
  • Determining the thickness of the concrete cover layer for reinforcement.
Table 1 presents proposals regarding the values of the carbonation depth depending on the carbonation resistance classes, exposure and structure service lifetime [17].

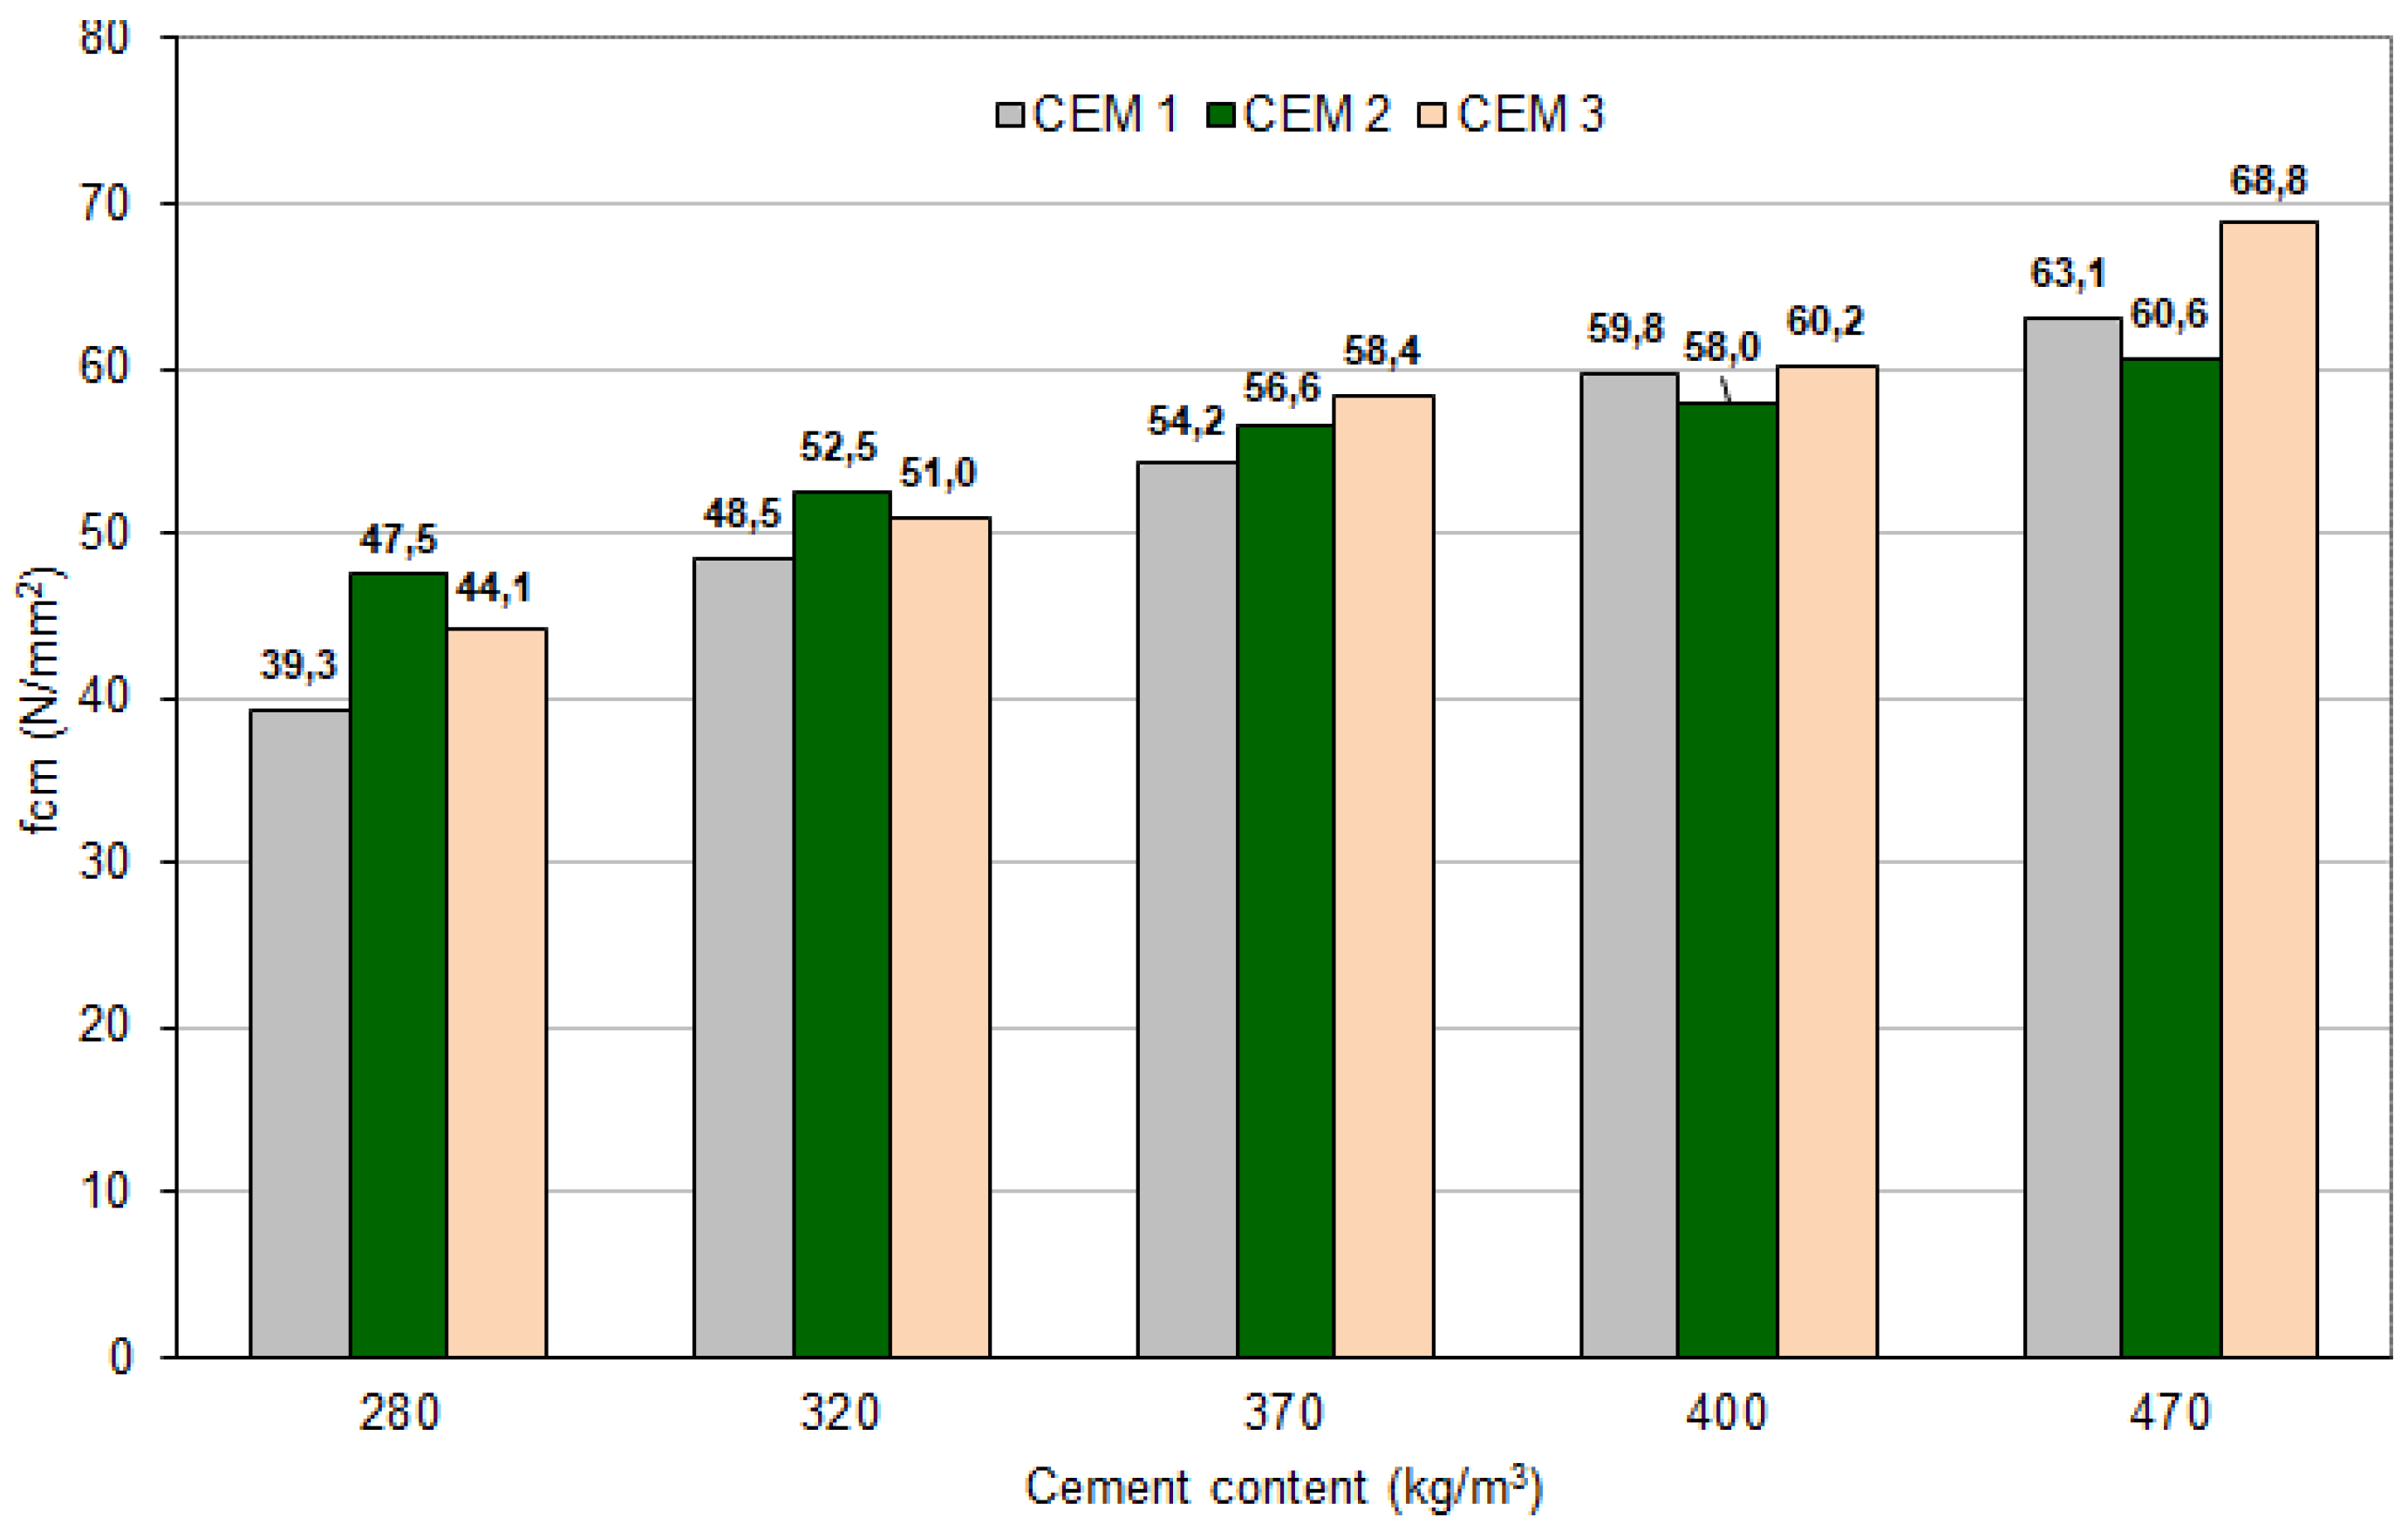
3.2.2. Experimental Study

For the study and application of the method, concretes were prepared with two types of cements:
  • CEM II/AM (S-LL) 32,5R manufactured with different percentages of slag and limestone; and
  • CEM II/AS 32,5R type, with the following percentages of blending materials:
    • CEM II/A-M (S-LL) 32.5R—slag 10%, limestone 7%—hereafter referred to as CEM 1;
    • CEM II/A-M (S-LL) 32.5R—slag 14%, limestone 4%—hereafter referred to as CEM 2;
    • CEM II/A-S 32.5R—slag 17%, limestone 3%—hereafter referred to as CEM 3.
The formulations of concrete were named according to the cement used type—CEM 1, CEM 2 and CEM 3.
Properties of Fresh Concrete.
The concretes were prepared with superplasticizer/hyperplasticizer admixture, at different cement contents, according to Table 3, for slumps between 100 and 150 mm. The properties of fresh concrete were presented to highlight the W/C ratios obtained with similar cement dosages for the same consistence class, to emphasize the performance of fresh concrete. The W/C ratio is an essential parameter for the assessment of the strength and durability of concrete. Different concretes were prepared using these cements, with cement contents between 280 and 470 kg/m3, aggregates sizes 0–4 mm (35%), 4–8 mm (15%), 8–16 mm (21%) and 16–32 mm (29%) and superplasticizer (dinaphthalmethane–sulfonate base)/hyperplasticizer (polycarboxylate base) admixture.
Properties of Hardened Concrete.
During the research program, compressive strengths and carbonation depths were measured for the concretes with three types of cements, up to the age of 1 year. Cubic samples were used, and the results presented are the average obtained on three samples. Tests were performed according to the provisions of EN 206 [3].

Compression Resistance

The values of the compressive strengths for the three types of cements are presented in Figure 3 at the age of 28 days, Figure 4 at the age of 90 days, Figure 5 at the age of 180 days and Figure 6 at the age of 1 year. The values of compressive strength and their evolution in time depend on many factors related to the characteristics of the clinker, the fineness of grinding, the types and percentages of additions, etc. In cases where combinations of several additions in different percentages are used, it is particularly difficult to estimate the level and evolution of the strengths, experimental research being the main method of evaluation.
From the presented graphs, some aspects regarding the strength of concrete and its evolution over time can be observed: At the age of 28 days, concretes prepared with CEM 2 have higher compressive strengths than concretes prepared with CEM 1 and CEM 3, for cement contents less than or equal to 400 kg/m3; at the age of 90 days, the compressive strengths of concrete prepared with CEM 2 are higher than in other types of concrete, for cement contents less than or equal to 320 kg/m3. This is also observed at the age of 180 days and 1 year; for high cement contents, of 470 kg/m3, concretes prepared with CEM 3 have the highest compressive strength for ages greater than or equal to 7 days; at the ages of 180 and 365 days, for the cement content of 400 kg/m3 and the same W/C ratio = 0.4, the compressive strengths are similar for concretes prepared with CEM 1 and CEM 3 and significantly lower for CEM 2.

Determination of the Carbonation Resistance Class

During the research program, measurements of the average carbonation depth were performed, with samples being kept for 7 days in water, then in standardized laboratory conditions (humidity 65%, temperature 20 °C, natural CO2 concentration) up to test age. Through these values, the carbonation rates and, implicitly, the concrete cover thickness of the reinforcement were calculated. It should be noted that the carbonation depths of concrete samples maintained under standardized laboratory conditions are usually significantly higher than those of samples kept outdoors or in the climatic chamber according to [19] (humidity 65%, temperature 20 °C, CO2 concentration 0.4%).
In the present study, an example of carbonation resistance classification for samples maintained under standardized laboratory conditions is presented. It is exemplified in detail for CEM 3 cement type. Figure 7 shows the evolution of carbonation depth up to the age of 365 days for different W/C ratios. The carbonation rate was determined by calculating the slope of the line fitted through the points with y (carbonation depth) and x (square root of time) coordinates, Figure 8.
Knowing coefficient Kc, the carbonation depth can be determined at 50 or 100 years, i.e., the classification in carbonation resistance classes. The average carbonation depth can be calculated using the equation:
X c = K c t
where:
K c = carbonation rate, in mm/years0.5;
t = effective time, in years.
Carbonation rates obtained for concretes prepared with CEM 3 cement are presented in Figure 9. Table 4 shows the carbonation depths at 50 years, calculated according to the values of K c and a proposal of carbonation resistance classification for this type of cement.
A similar approach was applied for the two CEM 1 and CEM 2 cements.
For a series of mixtures using the same blending materials, the carbonation resistance class is determined by plotting the carbonation rate (y-axis) as a function of the W/C ratio and fitting the regression line between these points. This line allowed the determination of the W/C ratios, rounded to the nearest 0.01, which give carbonation rates of 2.83, 4.24 and 5.66 mm/year0.5. These W/C ratios are the highest that can be used for concretes prepared with the same amounts of blending materials, for carbonation resistance classes RC20, RC30 and RC40, respectively. The carbonation rate is dependent on the W/C ratio—the lower the rate, the lower the ratio. The main factor that influences carbonation is diffusion, which is in fact a function of the pore system of concrete influenced by the type of cement, W/C ratio and degree of hydration. At the same time, these factors influence the strength of concrete; therefore, carbonation rate is a function of its strength.
Figure 10, Figure 11 and Figure 12 show the synthesis of the results obtained for the three cement types in which the performances of the concrete are practically highlighted both from the point of view of the compressive strengths at 28 days and of the carbonation resistances classes. In this case, the fact that concrete is compliant if the carbonation class is equal to or less than RXC 40 was considered as a hypothesis. Thus, a maximum W/C ratio that allows achieving a certain equal performance when using different types of cements can be highlighted. Further, if such diagrams are plotted for different cement types using identical blending materials in the concrete formulation, the concrete can theoretically be classified in carbonation resistance classes depending on the compressive strength obtained at 28 days.
The results obtained from Figure 10, Figure 11 and Figure 12 are summarized in Table 5. The table shows the maximum W/C ratios and cement dosage which permit the concretes prepared with the three types of cements to be included in the RXC20, RXC30 and RXC40 carbonation resistance classes, respectively. The advantage of such an approach is that once these diagrams are drawn up for a certain type of cement/composition, in continuous production, the verification of the classification of concrete in certain classes of resistance to the action of carbonation can be based on the values of compressive resistance. Thus, it is no longer necessary to experimentally determine the Kc coefficient, which is made more difficult by requiring equipment that an ordinary concrete manufacturer does not have.
Table 6 and Figure 13 show a comparison between the revision proposals of EN 1992-1-1 [17] and EN 206 [16] and the obtained experimental results.
It is observed that for a W/C ratio = 0.5, in concretes prepared with CEM II/A (EN 206 proposal) and CEM II/A-S—CEM 3, the carbonation resistance class is RC3, while for the other types of concrete prepared with CEM II/A-M, the carbonation resistance class is RC5 (CEM2) and RC6 (CEM1). The differences indicate the different influences of the environment on the cements, as well as the influence of the types and percentages of admixtures.
Table 7, Table 8 and Table 9 show the concrete cover for the reinforcements depending on the carbonation resistance classes and the designed service life.
It is observed that we can obtain the same performance, for example, class RC3, for all types of cements tested, but using different W/C ratios for the two types of cements CEM II/A-S 32.5R (CEM 3) and CEM II/A-M 32.5R (CEM 1 and CEM 2) and thus ensure the same service lifetime of 50 or 100 years by providing a certain thickness of concrete cover for the reinforcement depending on the exposure class.
Depending on the number of materials used, we can move on to the next stage of applying the method, namely, establishing the environmental impact.

3.3. Environmental Impact

Environmental impact assessment is obviously essential for the application of the proposed method. Classification of the impact categories is carried out according to [13,20,21] and presented in Table 10.
As indicated in numerous international studies, cement has the most important environmental impact if referred to the other components of concrete, which makes the approach presented in the article even more significant. Of course, one of the most important measures that can be applied is the use of blended cement and aiming not to affect the durability of concrete, basically another measure of sustainability. All these factors indicated in Table 10 can be calculated, thus indicating the environmental impact of concrete. One of the most important indicators that could be considered in a sustainability analysis for concrete is the one referring to the global warming potential (GWP). Table 11 shows the GWP values for the materials used in experimental research [12,22].

3.4. Calculation of the Sustainability Index

There is a calculation proposal for the sustainability index using the formula [13]:
I p s = S e r v i c e   L i f e × P e r f o r m a n c e E n v i r o n n e m e n t a l   I m p a c t
The performance of the concrete can be established, as it was presented, initially, by calculating the Kc coefficient and framing in carbonation resistance classes, then for the current verifications indirectly through the performances obtained at the corresponding compressive resistance, using graphs of the type presented in Figure 10, Figure 11 and Figure 12. This way, one can obtain the same classes of carbonation resistance, and thus, the same performances, regardless of the type of cement used, but obviously using different compositions. The service life can also be ensured to be constant, of 50 or 100 years, depending on the classification in certain classes of carbonation resistance and exposure and the provision of a certain thickness of concrete cover (Table 7, Table 8 and Table 9).
The originality and simplicity of the proposed method presented in the article consist in the fact that by applying the relation to determine the sustainability index, the first two factors (service life and performance) are constant, so that the formula becomes:
I p s = C o n s t a n t E n v i r o n n e m e n t a l   I m p a c t
The value of I p s thus depends exclusively on the environmental impact.
Table 12 shows the concrete formulations that allow the same performance (exposure classes) and GWP values, considering the values presented in Table 11.
It can be observed that different component materials and formulations can be used to achieve the same performance of concrete (RXC classes). Obviously, for these different materials and formulations, the environmental impact is different. In fact, the analysis presented shows that concretes prepared with CEM 3 cement have the lowest environmental impact. A constant service life can be ensured considering the thickness of the concrete cover layer presented in Table 7, Table 8 and Table 9. For impact calculation, the types of materials used are definitely considered (including the blended cement types), but also the amounts needed to ensure the same performance.

4. Conclusions

This article aimed at a simplified method to assess the sustainability of concrete with practical applicability based on the future provisions of standards for the specification, performance and production of concrete and design of concrete elements.
The method considers the performance, service lifetime and environmental impact in order to determine the sustainability index. The originality of the method consists in the fact that the performance and the lifetime are constant, and the choice of the materials can be carried out according to the GWP. The method was applied considering carbonation resistance as a performance criterion, by performing experimental assessments on concretes prepared with different cement types and amounts of additions. It was thus demonstrated that in order to reduce the environmental impact, a certain formulation/cement type with the lowest GWP can be selected, while ensuring the same performance and service lifetime. In the present experimental study, this is the formulation with CEM 3 cement.
The application of this method was based on the determination of carbonation resistance classes and can be extended to other actions, e.g., chlorides or freeze–thaw. This method may allow the use of materials with a lower environmental impact, especially blended cements, without affecting concrete performance in any way or leading to a service lifetime reduction of reinforced concrete elements and structures. Sustainability must be an important requirement for reinforced concrete structures in the future.

Author Contributions

Conceptualization, D.G.; Funding acquisition, R.V. and A.A. (Alexandru Aldea); Investigation, R.V., A.A. (Adelina Apostu), C.A. and A.G.; Methodology, D.G.; Project administration, A.A. (Alexandru Aldea); Validation, A.A. (Adelina Apostu) and A.G.; Writing—original draft, D.G.; Writing—review & editing, C.A. and A.G. All authors have read and agreed to the published version of the manuscript.

Funding

This research was funded by [Romanian Ministry of National Education] grant number [UTCB-CDI-2021-019].

Institutional Review Board Statement

Not applicable.

Informed Consent Statement

Not applicable.

Data Availability Statement

Not applicable.

Acknowledgments

Funding for this research was obtained by the Ministry of National Education (MEN) under grant number UTCB-CDI-2021-019. This support is gratefully acknowledged.

Conflicts of Interest

The authors declare no conflict of interest.

References

  1. Morandín-Ahuerma, I.; Contreras-Hernández, A.; Ayala-Ortiz, D.A.; Pérez-Maqueo, A. Socio–Ecosystemic Sustainability. Sustainability 2019, 11, 3354. [Google Scholar] [CrossRef] [Green Version]
  2. Ministry of Development Public Works and Administration-Law No. 10, the Building-Quality Law. Official Gazzette of Romania. Available online: http://legislatie.just.ro/Public/DetaliiDocument/5729 (accessed on 1 December 2021).
  3. EN 206-Concrete—Part 1: Specification, Performance, Production and Conformity; British Standards Institution: London, UK, 2000; Available online: https://www.allbeton.ru/upload/iblock/d27/bs_en_206_1_2000_concrete_part_1_specification_performance_production_and_conformity.pdf (accessed on 1 December 2021).
  4. Steinar Leivestad Convenor. Durability Exposure Resistance Classes, a new system to specify durability în EN 206 and EN 1992, JWG -Joint Working Group Durability JWG 250/104-N27. 2017. [Google Scholar]
  5. Steinar Leivestad. Durability, Concrete, Environment and Sustainability în the Eurocodes; Standard Norge: Oslo, Norway, 2019. [Google Scholar]
  6. JWG TC104/SC1-TC250/SC2 N26; Exposure Resistance Classes-Draft for Proposal on a New System to Specify Durability în EN 206 and EN 1992. Technical Background Documentation; European Committee for Standardization CEN: Brussels, Belgium, 2014.
  7. CEN/TC 250/SC 2/WG 1 N 912; New ERC Concept, National Freedom; CEN: Brussels, Belgium, 2020.
  8. Guideline for Sustainable Building, by Federal Ministry for the Environment, Nature Conservation, Building and Nuclear Safety (BMUB). Public Relations Division 11055 Berlin Germany Federal Ministry for the Environment, Nature Conservation, Building and Nuclear Safety- Edited by BMUB, Division B I 5—Civil Engineering, Sustainable Construction, Building Research. Available online: www.bmub.bund.de/english (accessed on 1 December 2021).
  9. Stubbs, B. Plain English Guide to Sustainable Construction-Constructing; Excellence Warwick House: London, UK, 2016. [Google Scholar]
  10. Building Research Establishment Environmental Assessment Methodology. Available online: www.bream.com (accessed on 1 December 2021).
  11. DGNB. DGNB System, Kriterium, Pro 2.1, Baustelle/Bauprozess. 2015. Available online: https://static.dgnb.de/fileadmin/dgnb-system/de/gebaeude/neubau/kriterien/06_PRO2.1_Baustelle_Bauprozess.pdf (accessed on 1 December 2021).
  12. Tsimplokoukou, K.; Lamperti, M.; Negro, P. Building Design for Safety and Sustainability. In Jrc Science and Policy Reports; Joint Research Centre: Brussels, Belgium, 2014. [Google Scholar]
  13. Müller, H.S.; Breiner, R.; Moffatt, J.S.; Haist, M. Design and properties of sustainable concrete. Procedia Eng. 2014, 95, 290–304. [Google Scholar] [CrossRef] [Green Version]
  14. Müller, H.S.; Haist, M.; Moffatt, J.S.; Breiner, R. Design, material properties and structural performance of sustainable concrete. Procedia Eng. 2017, 171, 22–32. [Google Scholar] [CrossRef]
  15. International Federation for Structural Concrete. Model Code for Service Life Design; Fib Bulletin 34; International Federation for Structural Concrete: Lausanne, Switzerland, 2006. [Google Scholar]
  16. CEN/TC 104/SC 1/WG 1 N 237; Draft 4 Working Draft of EN 206-Part 100 Exposure Resistance Classes; CEN: Brussels, Belgium, 2019.
  17. CEN/TC 104/SC 1/WG 1 N 237, Eurocode 2: Design of concrete structures—Part 1-1: General rules - Rules for buildings, bridges and civil engineering structures; German and English version prEN 1992-1-1; CEN: Brussels, Belgium, 2021.
  18. EN 12390-10:2018; Determination of the Carbonation Resistance of Concrete at Atmospheric Levels of Carbon Dioxide; CEN: Brussels, Belgium, 2018.
  19. EN 14630:2006; Products and Systems for the Protection and Repair of Concrete Structures—Test Methods Determination of Carbonation Depth in Hardened Concrete by the Phenolphthalein Method; CEN: Brussels, Belgium, 2006.
  20. EN ISO 14040:2006; Environmental Management—Life Cycle Assessment—Principles and Framework; CEN: Brussels, Belgium, 2006.
  21. EN ISO 14044:2006; Environmental Management—Life Cycle Assessment—Requirements and Guidelines; CEN: Brussels, Belgium, 2006.
  22. EN 15804:2012-04; Sustainability of Construction Works—Environmental Product Declarations—Core Rules for the Product Category of Construction Products; CEN: Brussels, Belgium, 2012.
Figure 1. Sustainability pillars [1].
Sustainability 14 00617 g001
Figure 2. Application steps for the proposed method.
Sustainability 14 00617 g002
Figure 3. Variation of compressive strengths depending on cement content at the age of 28 days.
Sustainability 14 00617 g003
Figure 4. Variation of compressive strengths depending on cement content at the age of 90 days.
Sustainability 14 00617 g004
Figure 5. Variation of compressive strengths depending on cement content at the age of 180 days.
Sustainability 14 00617 g005
Figure 6. Variation of compressive strengths depending on cement content at the age of 1 year.
Sustainability 14 00617 g006
Figure 7. Evolution of carbonation depth over time.
Sustainability 14 00617 g007
Figure 8. Variation of carbonation depth as a function of the square root of time.
Sustainability 14 00617 g008
Figure 9. Kc values depending on the W/C ratio and compressive strength at 28 days for CEM 3.
Sustainability 14 00617 g009
Figure 10. Compressive strengths at 28 days, carbonation rates and classification according to the W/C ratios for concretes prepared with CEM 1.
Sustainability 14 00617 g010
Figure 11. Compressive strengths at 28 days, carbonation rates and classification depending on W/C ratios for concretes prepared with CEM 2.
Sustainability 14 00617 g011
Figure 12. Compressive strengths at 28 days, carbonation rates and classification depending on W/C ratios for concretes prepared with CEM 3.
Sustainability 14 00617 g012
Figure 13. Carbonation resistance classes of concretes prepared with CEM II/A (supplementary proposal EN 206 [9]) and with the three concrete types, respectively.
Sustainability 14 00617 g013
Table 1. Minimum values of the concrete cover thickness.
Preliminary ValuesMinimum Values of the Concrete Cover for Service Lifetimes of 50 and 100 Years
Exposure
Classes
RXC20RXC30RXC40
50 Years100 Years50 Years100 Years50 Years100 Years
XC1101510201020
XC2101515202030
XC3152020252535
XC4152020252535
Table 2. Carbonation resistance classes.
Preliminary ValuesCarbonation Resistance Classes RXC
RXC20RXC30RXC40RCX0
Class definition, carbonation depth at 50 years (mm)203040-
StandardEN 12390-10 [18]
Descriptive criteriaMaximum W/C ratio
CEM I
CEM II A *TBDTBDTBDTBD
CEM II B
CEM III A
Note *: To be determined (TBD), applicable in this example/experimental study.
Table 3. Properties of fresh concrete.
Cement Content (kg/m3)Slump (mm)W/C RatioDensity (kg/m3)
CEM 1, 0,6% Hyperplasticizer Admixture
2801250.612364
3201250.492322
3701200.432405
4001200.402399
4701150.372366
CEM 2, 0,6% hyperplasticizer admixture
2801200.582360
3201200.502396
3701250.432423
4001200.402394
4701250.362415
CEM 3, 1% superplasticizer admixture
2801050.592367
3201050.502364
3701200.452359
4001050.402359
4701150.362403
Table 4. Carbonation depth values at 50 years calculated according to Kc values and proposal of carbonation resistance classification.
W/CKc, (mm/y0.5)XC, (mm)/50 YearsRXC Proposal
0.616.3444.83RXC50
0.595.2036.77RXC40
0.544.5131.89RXC40
0.503.4924.68RXC30
0.482.8620.22RXC30
0.452.7319.30RXC20
0.402.0314.35RXC20
0.361.7812.59RXC20
Table 5. Maximum W/C ratios and cement dosage of concrete prepared with the three cement types, for the three carbonation resistance classes.
Carbonation
Resistance Class
Kc, (mm/Year0.5)Maximum W/C Ratios/Cement Dosage (kg/m3)
CEM 1CEM 2CEM 3
RXC202.830.38/4600.40/4000.44/365
RXC304.240.45/3500.47/3400.52/320
RXC405.660.52/3100.54/3000.60/270
Table 6. Carbonation performance classified by W/C ratio and cement type.
Carbonation
Resistance Class
RC2
(RXC20)
RC3
(RXC30)
RC4
(RXC40)
RC5
(RXC50)
RC6
(RXC60)
RC7
(RXC70)
Cement typeMaximum W/C ratio
CEM 1 0.400.43 0.490.61
CEM 2 0.400.430.50 0.58
CEM 30.400.480.50.540.590.61
CEM II/A-prEN 2060.450.50.550.60.65
Table 7. Concrete cover thickness depending on carbonation resistance class and W/C ratio for concretes prepared with CEM1.
CEM 1
W/CExposure ClassXC1XC2XC3XC4
Design Service Life (Years)50100501005010050100
0.38RXC201015101515251525
0.45RXC301015152020302030
0.52RXC401020152525352540
Table 8. Concrete cover thickness depending on carbonation resistance class and W/C ratio for concretes prepared with CEM 2.
CEM 2
W/CExposure ClassXC1XC2XC3XC4
Design Service Life (Years)50100501005010050100
0.40RXC201015101515251525
0.47RXC301015152020302030
0.54RXC401020152525352540
Table 9. Concrete cover thickness depending on carbonation resistance class and W/C ratio for concretes prepared with CEM3.
CEM 3
W/CExposure ClassXC1XC2XC3XC4
Design Service Life (Years)50100501005010050100
0.44RXC201015101515251525
0.52RXC301015152020302030
0.60RXC401020152525352540
Table 10. Environmental impact categories of industrial processes.
CategoryDesignationUnit
CED-fossilsCumulative Energy Demand (non-renewable)Joule
CED-renewableCumulative Energy Demand (renewable)Joule
GWPGlobal Warming Potentialkg CO2—equivalent
ODPOzone Depletion Potentialkg R11—equivalent
APAcidification Potentialkg SO2—equivalent
NPNutrification PotentialKg PO4—equivalent
POCPPhotochemical Ozone Creation PotentialKg C2H4—equivalent
Table 11. GWP values for cements, aggregates and admixtures.
CementsGlobal Warming Potential, GWP [kg CO2/kg]
1. CEM II/A-M (S-LL) 32.5R slag 10%, limestone 7%0.664
2. CEM II/A-M (S-LL) 32.5R slag 14%, limestone 4%0.662
3. CEM II/A (S-LL) 32.5R slag 17%, limestone 3%0.661
Aggregates
Sand1.06 × 10−3
Gravel1.06 × 10−3
Admixtures (superplasticizer, hyperplasticizer)0.944
Table 12. GWP as a function of carbonation resistance class and formulation of concrete.
Carbonation
Resistance
Class
Component Materials [kg/m3]
and
GWP [kgCO2/m3]
Concrete Mix with Different CEMENT Type Formulation
CEM 1CEM 2CEM3
RXC20Cement460400365
Aggregates172718191848
Admixtures2.762.43.65
GWP310269246
RXC30Cement350340320
Aggregates187018731875
Admixtures2.12.043.3
GWP236229216
RXC40Cement310300270
Aggregates189619021929
Admixtures1.861.82.7
GWP209202183
Publisher’s Note: MDPI stays neutral with regard to jurisdictional claims in published maps and institutional affiliations.

