Article

Computing Models to Predict the Compressive Strength of Engineered Cementitious Composites (ECC) at Various Mix Proportions

1
Engineering Department, College of Engineering, University of Sulaimani, Kurdistan Region, Sulaimaniyah 46001, Iraq
2
Department of Civil Engineering, Komar University of Science and Technology, Kurdistan Region, Sulaimaniyah 46001, Iraq
3
Civil Engineering Department, University of Halabja, Kurdistan Region, Halabja 46006, Iraq
4
Department of Highway and Bridge Engineering, Technical Engineering College, Erbil Polytechnic University, Erbil 44001, Iraq
5
Department of Civil Engineering, College of Engineering, Nawroz University, Duhok 42001, Iraq
6
CERIS, Civil Engineering, Architecture and Georresources Department, Instituto Superior Técnico, Universidade de Lisboa, Av. Rovisco Pais, 1049-001 Lisbon, Portugal
*
Authors to whom correspondence should be addressed.
Sustainability 2022, 14(19), 12876; https://doi.org/10.3390/su141912876
Submission received: 18 June 2022 / Revised: 19 September 2022 / Accepted: 20 September 2022 / Published: 9 October 2022
(This article belongs to the Special Issue Concrete with Recycled and Sustainable Materials)

Abstract

:
Concrete has relatively high compressive strength (resists breaking when squeezed) but significantly lower tensile strength (vulnerable to breaking when pulled apart). The compressive strength is typically controlled by the ratio of water-to-cement when forming the concrete, and tensile strength is increased by additives, typically steel, to create reinforced concrete. In other words, we can say concrete is made up of sand (which is a fine aggregate), ballast (which is a coarse aggregate), cement (which can be referred to as a binder), and water (which is an additive). Highly ductile material engineered cementitious composites (ECC) were developed to address these issues by spreading short polymer fibers randomly throughout a cement-based matrix. It has a high tensile strain capacity of more than 3%, hundreds of times more than conventional concrete. On the other hand, among the other examined qualities, compressive strength (CS) is a critical property. Consequently, developing reliable models to predict an ECC’s compressive strength is crucial for cost, time, and energy savings. It also includes instructions for planning construction projects and calculating the optimal time to remove the formwork. The artificial neural network (ANN), nonlinear model (NLR), linear relationship model (LR), multi-logistic model (MLR), and M5P-tree model were all proposed as alternative models to estimate the CS of ECC mixtures created by fly ash in this research (M5P). To create the models, a large amount of data were gathered and evaluated, totaling roughly 205 mixes. Various mixture proportions, fiber length, diameter, and curing durations were explored as input variables. To test the effectiveness of the suggested models, several statistical evaluations, including determination coefficient (R2), Mean Absolute Error (MAE), Scatter Index (SI), Root Mean Squared Error (RMSE), and Objective (OBJ) value, were utilized. Based on the statistical evaluations, the ANN model performed better in forecasting the CS of ECC mixes incorporating fly ash than other models. This model’s RMSE, MAE, OBJ, and R2 values were 4.55 MPa, 3.46 MPa, 4.39 MPa, and 0.98, respectively. A large database presented in this investigation can be used as the bench mark for future mixture proportions of the ECC. Moreover, the sensitivity analysis showed the contribution of each mixture ingredient on the CS of ECC.

1. Introduction

In many respects, concrete is a far more complex material to model in the inelastic range than steel. The research community has relatively recently embraced fracture mechanics as a model to capture its cracking. Given the importance of the topic, a separate chapter is devoted to this form of fracture. Concrete is the most commonly utilized building material. Thus, researchers and the construction industry have introduced new materials and technology to make it as durable as possible. Engineered cementitious composites (ECC) are among the high-performance cement-based materials that were produced. The most dramatic limitations of normal concrete are brittleness, low tensile strength, and low ultimate tensile strains. Therefore, developing new materials to overcome the deficiencies mentioned above of normal concrete is a significant part of research to help the construction industry implement more advanced materials. Engineered cementitious composites (ECC) are a fiber-reinforced high-performance material developed as an alternative to traditional concrete by Li and colleagues [1,2,3,4]. Unlike other high-performance fiber-reinforced cementitious materials, ECC’s microstructures are tuned using micromechanical models to produce high ductility, with fracture widths confined to less than 100 µm and ultimate tensile strain capacities as high as 5% [5].
Concrete durability depends upon the degree of exposure, the concrete grade (or strength), and the cement content. A high-density, alkali-resistant concrete will better resist the effects of moisture penetration. Since concrete is a porous material, reinforcement bars within the concrete will be subject to possible corrosion if safeguards are not taken. Adequate concrete ‘cover’ to the reinforcement should be included in the specifications to reduce moisture or salts penetrating the rebar. Should the rebar corrode, it will expand, and the considerable forces involved cause the concrete to crack. ECC has great toughness, spalling resistance, lower micro-crack widths, and high impermeability advantages. ECC offers many applications, including dam restoration, pavement slab patching, and earthquake damage component reinforcing [6,7,8,9,10]. ECC is often composed of cement, fly ash, sand, water, a chemical additive, and randomly scattered fibers. The kind, form, and volume % of elements used in the mixture, as well as the fiber qualities, all contribute to the design of a composites’ material properties [5]. Fibers composed of polypropylene (PP), polyethylene (PE), and polyvinyl alcohol (PVA) are utilized in the production of ECCs. The ECCs’ tensile capacity was improved due to the incorporation of these fibers in their construction. The tensile strength of PVA fiber is higher than that of PP fiber, whereas the flexural strength and toughness of ECC reinforced with PVA fiber are superior to those of ECC reinforced with PP fiber [11].
ECC has a compressive strength comparable to that of ordinary to high-strength concrete. Normal concrete is brittle but ECC is ductile and, as a result of this quality, has a wide range of applications and a bright future in various industries [12]. When determining the overall quality of concrete, one of the most important mechanical parameters to look at is compressive strength [13,14]. To produce environmentally friendly ECC, the cement can be replaced with other industrial waste ashes such as fly ash [15]. For example, Yu and Leung, 2017 [15] observed that strain-hardening cementitious composites with ultra-high-volume fly ash (80% of binder content) could be produced with a CS of 69.2 at 28 days.
Moreover, they concluded that this type of ECC is applicable for many structural applications, and the material cost and the environmental impact are significantly reduced due to the substitution of high percentages of cement with industrial wastes. Kan et al. [16] studied the effect of fineness and calcium content of fly ash on the mechanical properties. They concluded that fly ash with a higher calcium content caused an improvement in the CS at different curing times. Other investigations regarding the mechanical properties of ECC were conducted by Yu et al. [17].
With continued research into the CS for ECC, standard approaches for determining the CS for normal concrete may no longer be applicable to ECC mixtures. As CS is sensitive to the mixture’s proportions and dependent on various characteristics, engineers should be provided with easier procedures and mathematical formulas to forecast the outcomes of experiments [18]. Soft computing approaches could be considered a viable solution [19]. When mathematical models fail to explain how the problem’s primary features are connected adequately, these approaches may be utilized to produce alternatives and solutions for both linear and nonlinear difficulties [20,21].
In the cement-based composites research field, artificial intelligence systems for assessing and predicting the mechanical characteristics of cement-based materials are a hot issue to provide the construction industry with new approaches and strategies for application. Machine learning has developed as a potent method for determining structural and material performance. Over the last decade, machine learning (ML) emerged as a powerful technology to determine structure and material performance [22,23]. ML models use a large amount of accumulated or measured actual data containing features with a wide range of values, making such models highly generalizable and robust [24]. Among different soft computing models, ANN and M5P-tree models were used extensively in civil and material engineering. The ANN algorithm requires a trial-and-error approach to find the network parameters, such as the number of hidden layers and neurons, which is time-consuming. However, the M5P algorithm is a robust technique that provides understandable linear regression for the inputs and outputs in a nonlinear modelling approach to the splitting process [25].
Because of the high volume of concrete consumed and the nature of practical works, a mathematical equation is more useful than a computer model in civil projects. Furthermore, researchers could use a mathematical model and evaluate and modify its parameters and coefficients. In the meantime, machine learning methods may yield more robust results than other empirical methods for model development. In contrast, the main disadvantages of these methods are their black-box nature, which does not allow us to have a concept of how the problem is solved and only the final results are accessible. However, other model techniques such as LR, NLR, and MLR models give us an equation. These regression modles are called white-box models, in which researchers could have access to a mathematical equation as a solution for their problem.
Even though ECCs are used everywhere, there are not many studies on predicting the CS of ECCs with fly ash, therefore, it is hard to use them quickly in the building industry. From materials that generate their energy to those that provide greater structural protection, the future of the building is evolving. A new generation of stronger, lighter and more sustainable building materials is coming to solve the construction industry’s main challenges. This requires the development of new models to anticipate how these novel materials will behave. The main goal of this research is to determine how different mixture proportions, such as cement (C) content, fly ash (FA) content, sand (S) content, fiber (F) content, w/b ratio, and superplasticizer (SP) content, affect the compression resistance of ECCs from a young age (3 days) to a long-term cure (180 days). Along with the different modeling approaches, a lot of experimental data, including 205 tested results, were used to reach the following goals: (i) to use statistics to find out how things such as cement, fly ash, sand, fiber, and SP dosage, as well as curing time, w/b ratio, maximum sand size, fiber length, and fiber diameter, affect the CS of green ECC made with fly ash; (ii) to make sure that the building industry can use the models without having to do any testing or analysis in the lab; and (iii) determine which model is most accurate in predicting the CS of sustainable ECC-incorporated fly ash and use that model as the basis for further research and evaluation. In addition, the fundamental contribution of this work is the development of soft computing models to predict the compressive strength of ECC modified with fly ash for efficient usage in the construction sector.

2. Literature Review

Feng et al. [26] utilized the ML model to predict the shear strength of deep reinforced concrete beams with/without web reinforcement. Four ensemble algorithms (i.e., random forest, adaptive boosting, gradient boosting regression tree, and extreme gradient boosting) were considered to illustrate ML with superior accurate performance. Adaptive neuro-fuzzy inference systems were utilized by Bilir et al. [27] to forecast the width of constrained drying shrinkage cracks in slag mortar composites. The model allowed for effective steps to be adopted to prevent concrete cracking, resulting in increased concrete durability. The M5P-tree model was used by Behnood et al. [28] to calculate the dynamic modulus of asphalt concrete. Ahmed et al. [29] successfully used twelve effective mixture proportions and curing conditions as the model input parameters to predict the CS of fly ash-based geopolymer concrete by adapting three common models: linear, nonlinear, and multi-logistic regression models.
Moreover, Ahmed et al. [30] investigated the effects of molarity of NaOH, nano-silica content, the ratio of sodium hydroxide to sodium silicate, binder content, aggregate content, and age on the CS of geopolymer concrete. They created five different models, such as ANN, and M5P-tree, to estimate and forecast the CS of the composite. Due to the limited test data and the number of side variables addressed, applying these empirical formulas to other scenarios is challenging. This necessitates the development of a novel method for accurately estimating the compressive strength of ECC, taking into account the impact of various mixture proportions and curing ages. The studies above showed that machine learning techniques could perform well with many variables while overcoming drawbacks such as a lack of experimental data and the inability to generalize the model to other contexts.
Moreover, the soft computing models regarding the prediction of ECC properties are limited [31,32,33]. Uddin et al. [32] used an ANN model to estimate the compressive and tensile strength of ECC mixtures. They incorporated 79 experimental mixtures with 12 input parameters from the literature to develop the ANN models. They concluded that utilizing an ANN model to estimate the compressive and tensile strength of ECC using PVA fiber is a powerful strategy.
Due to the limited number of studies on developing different ML models, this study was conducted to predict the compressive strength using five dissimilar models and ten input parameters.

3. Methodology and Models

3.1. Data Collection

The collected data from various pieces of literature for this paper were 205 datasets inserted into an excel sheet; the data were randomly sorted, statistically assessed, divided, and separated into three groups. The largest group, 70% of the data, was named the training dataset and utilized to develop the models. The other two groups, each with 15% of the datasets, were used for testing and validating the proposed models [17,33]. Table 1 summarizes the ECC mixes database and the measured CS of ECC produced with various mix proportions and fly ash contents. The majority of prior studies discussing the effect of different mixtures on the characteristics of ECCs were collected, and their data were retrieved based on the authors’ searches.
Table 1 shows the input dataset, which includes (a) content of cement (C) by weight (kg/m3), (b) fly ash (FA) content (kg/m3), (c) w/b ratio (%), (d) SP content by kg/m3, (e) sand (S) content (kg/m3), (f) maximum size of sand (MSS) (µm), (g) fiber (F) content by weight (kg/m3), (h) fiber length (FL) (mm), (i) fiber diameter (FD) (µm), and (j) curing period (T). The presented dataset, which contained the 10 independent components listed above, was used to anticipate the CS of ECC created with various combinations using many techniques compared to the observed reported CS (MPa). The idea behind using all the input parameters indicated above is to reduce the number of trial batches in the laboratory to easily optimize the number of ingredients for a targeted CS. The technique employed in this experiment is shown in Figure 1.

3.2. Modeling

A direct association between CS and CS cannot be established. Based on the examined data findings in the next section, other components and input variables of ECC mixes include cement percentage, fly ash content, sand content, the maximum size of sand, fiber content, fiber length, fiber diameter, w/b ratio, SP dose, and curing period up to 180 days. As a result, five different soft computing methodologies for quantifying the effect of each parameter on the CS of ECC combinations are presented, as illustrated below.

3.2.1. Linear Relationship Model (LR)

As mentioned before, this study focuses on designing a model that evaluates the effect of the maximum number of parameters on the compressive strength of ECC. Linear regression is a general method for evaluating the compressive strength [69], as shown in Equation (1):
σ c = α 1 + α 2   ( w c )
where α 1 and α 2 ,   σ c and w c are model parameters, compressive strength (CS), and water/cement ratio. The curing time, other mix contents, and other components and variables of the ECC mix altered with FA are not included in the preceding model despite their influence on the compressive strength. The sum of error squares and the least square approach using the EXCEL program by utilizing a solver was used to compute the value of each parameter in the current model. Equation (2) is offered to acquire more trustworthy scientific findings, incorporating all mix proportions and variables that may impact CS.
CS =   α 1 + α 2 ( C ) + α 3 ( FA ) + α 4 ( w b ) + α 5 ( MSS ) + α 6 ( S ) + α 7 ( SP ) + α 8 ( F ) + α 9 ( FL ) + α 10 ( FD ) + α 11 ( T )  
where C represents cement content (kg/m3); FA represents fly ash content (kg/m3); w/b represents water-to-binder ratio; MSS stands for the maximum size of sand (µm); S stands for sand content (kg/m3); SP stands for superplasticizer dosage (kg/m3); F stands for fiber content (kg/m3); FL stands for fiber length (mm); and FD stands for fiber diameter (µm). Furthermore, the model parameters are α1, α2, α3, α4, α5, α6, α7, α8, α9 α10, and α11. Since all factors may be changed linearly, Equation (2) can be used to extend Equation (1). While many factors may influence CS and interact with one another, this is not necessarily the case. Consequently, the model should be updated frequently to appropriately predict the compressive strength [69,70].

3.2.2. Nonlinear Model (NLR)

In general, one may use Equation (3) to design an NLR model [71,72]. The relationship between different factors in Equations (1) and (2) may be stated in Equation (3) to anticipate the CS of typical ECC mixes and ECCs combined with FA.
CS = α 1 ( C ) α 2 ( w b ) α 3 ( SMS ) α 4   ( S ) α 5 ( SP ) α 6 ( F ) α 7 ( FL ) α 8 ( FD ) α 9 ( T ) α 10 + α 11 ( C ) α 12 ( w b ) α 13 ( SMS ) α 14   ( S ) α 15 ( SP ) α 16 ( F ) α 17 ( FL ) α 18 ( FD ) α 19 ( T ) α 20 ( FA ) α 21
The model parameters are the same as previously defined for the LR model. Moreover, similar to the LR model, the sum of error squares and the least square approach using the EXCEL program by utilizing a solver was used to compute the value of each parameter.

3.2.3. MLR Model

The MLR, a regression technique, may be utilized when the expectable variable has a parameter greater than two stages [73]. MLR stands for Multiple Linear Regressions and is a statistical procedure that is comparable to Multiple Linear Regression. The equation may be used to calculate the variance between predictable and independent variables (4).
CS = α 1 ( C ) α 2 ( FA ) α 3 ( w b ) α 4 ( SMS ) α 5   ( S ) α 6 ( SP ) α 7 ( F ) α 8 ( FL ) α 9 ( FD ) α 10 ( T ) α 11
Equation (4), on the other hand, has the disadvantage of being unable to predict the CS of ECCs without FA content. Consequently, this model’s FA content should be more than zero (FA content > 0%).

3.2.4. ANN Model

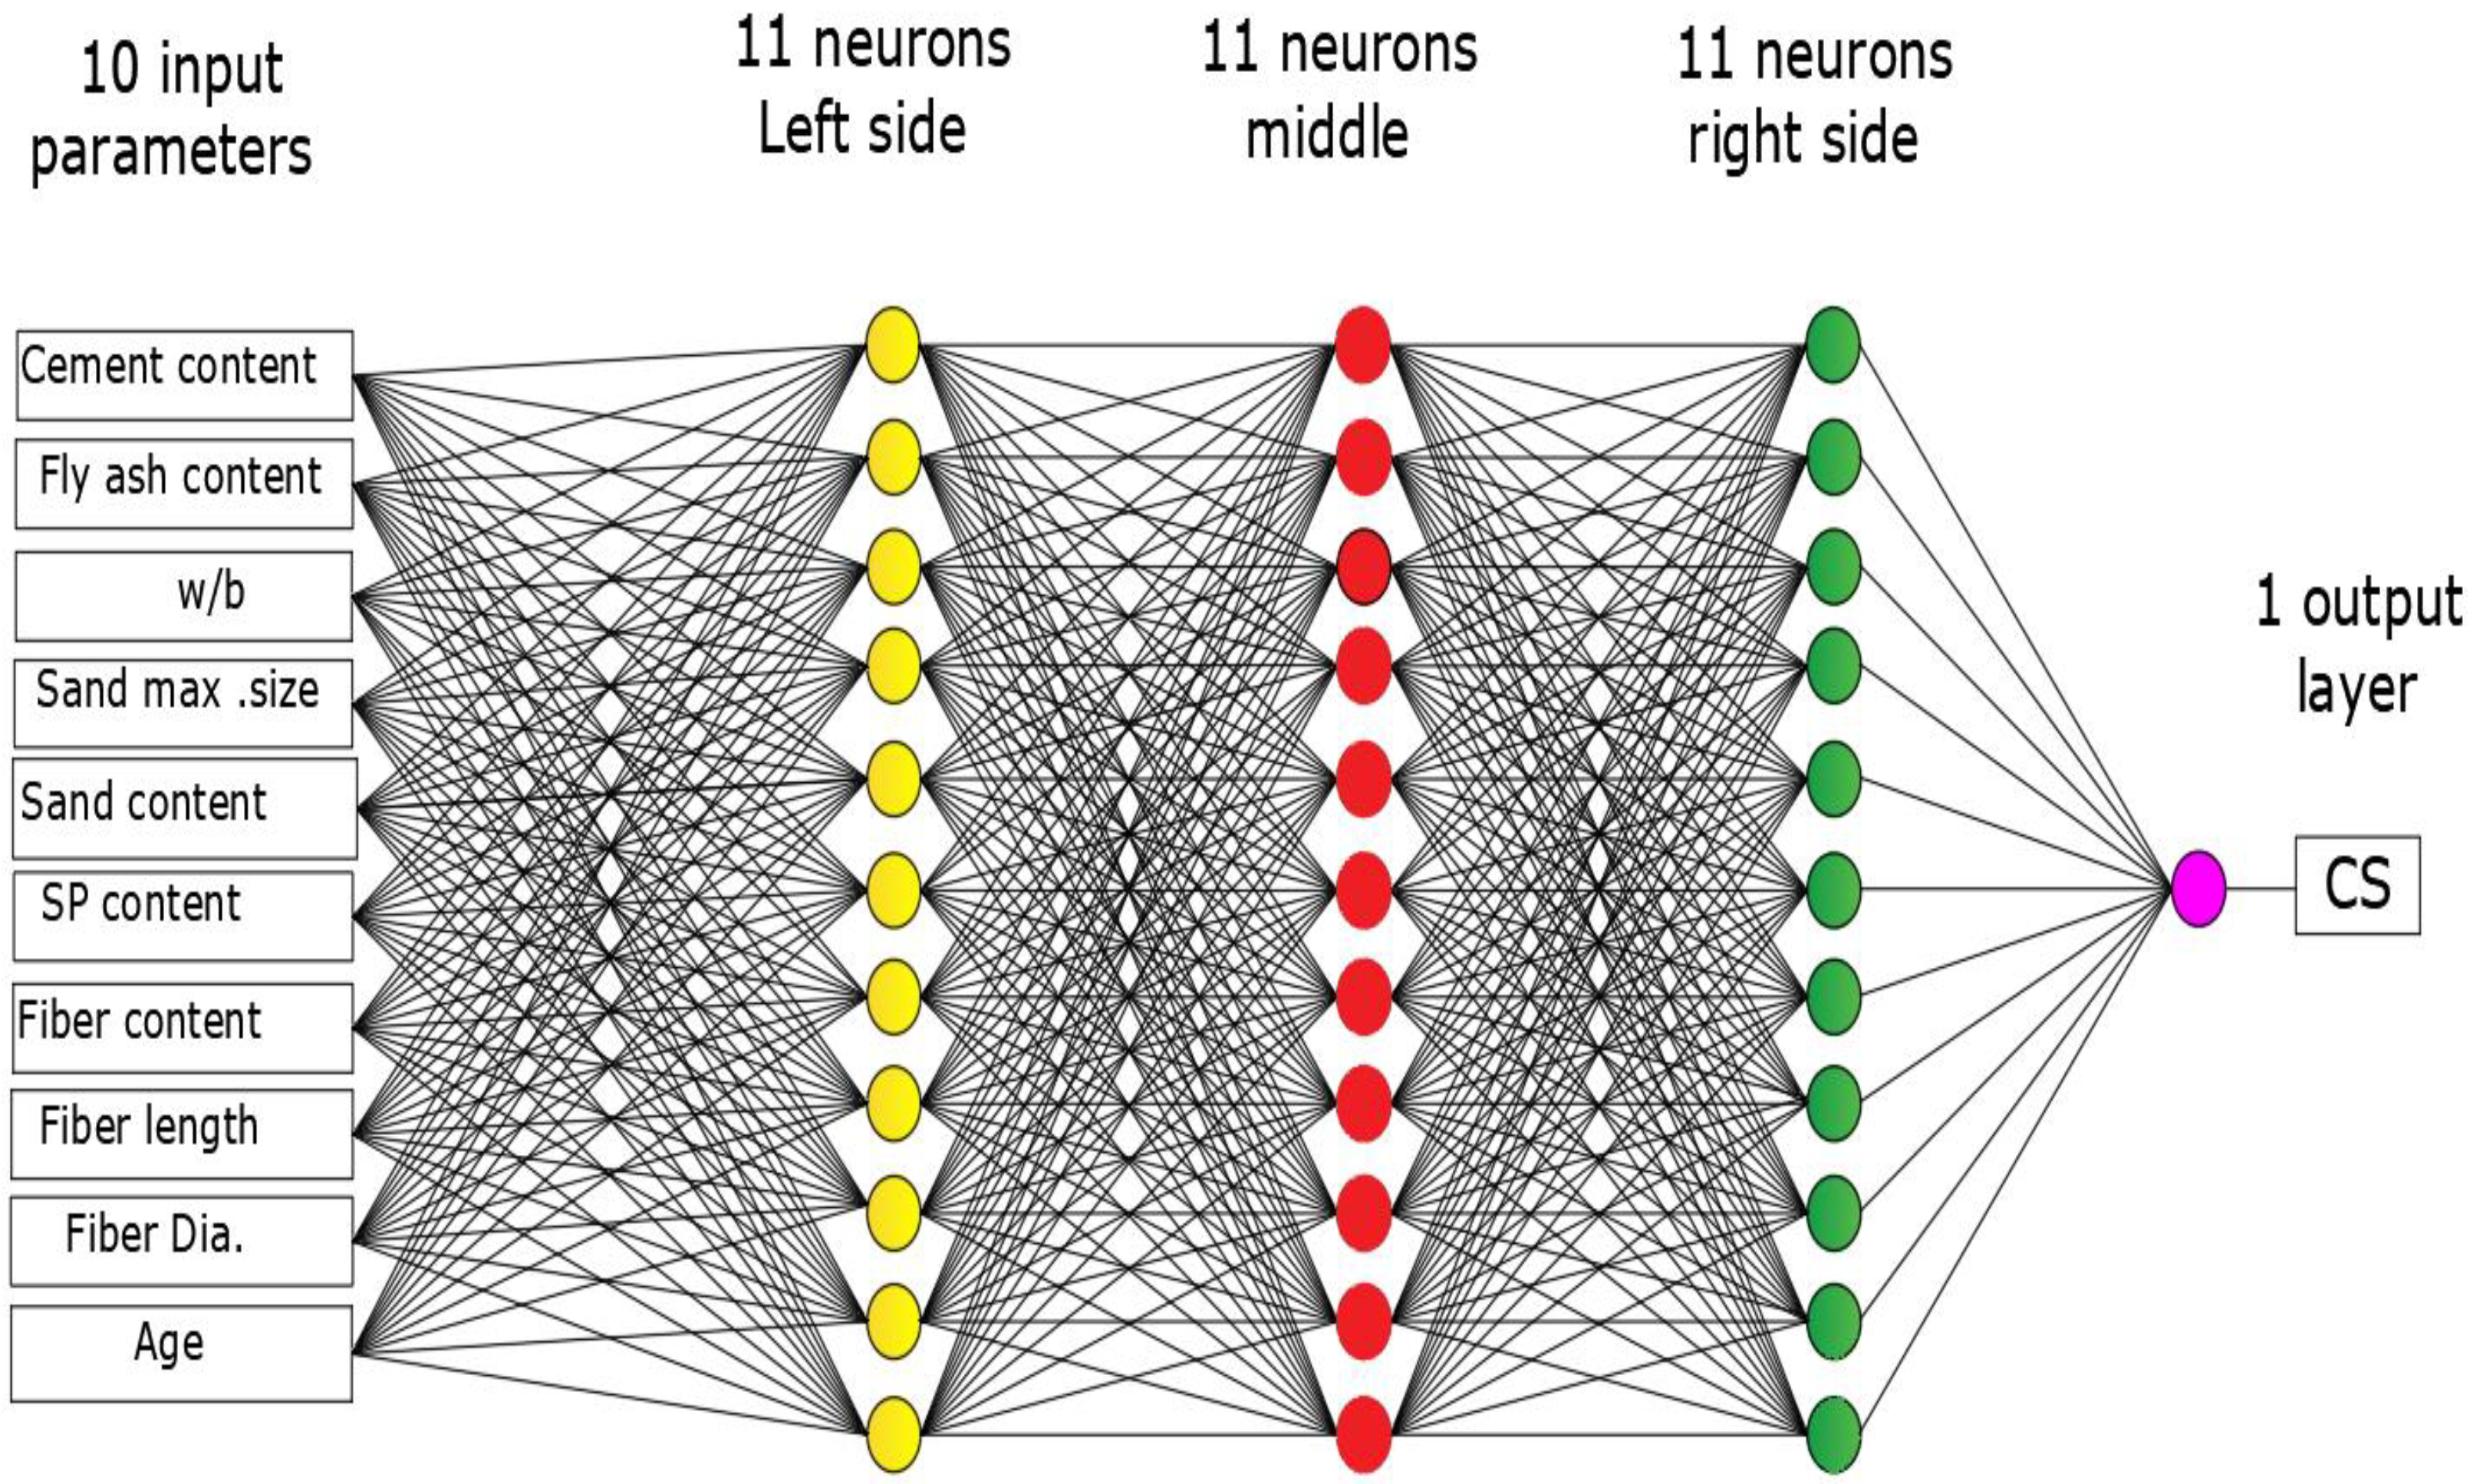
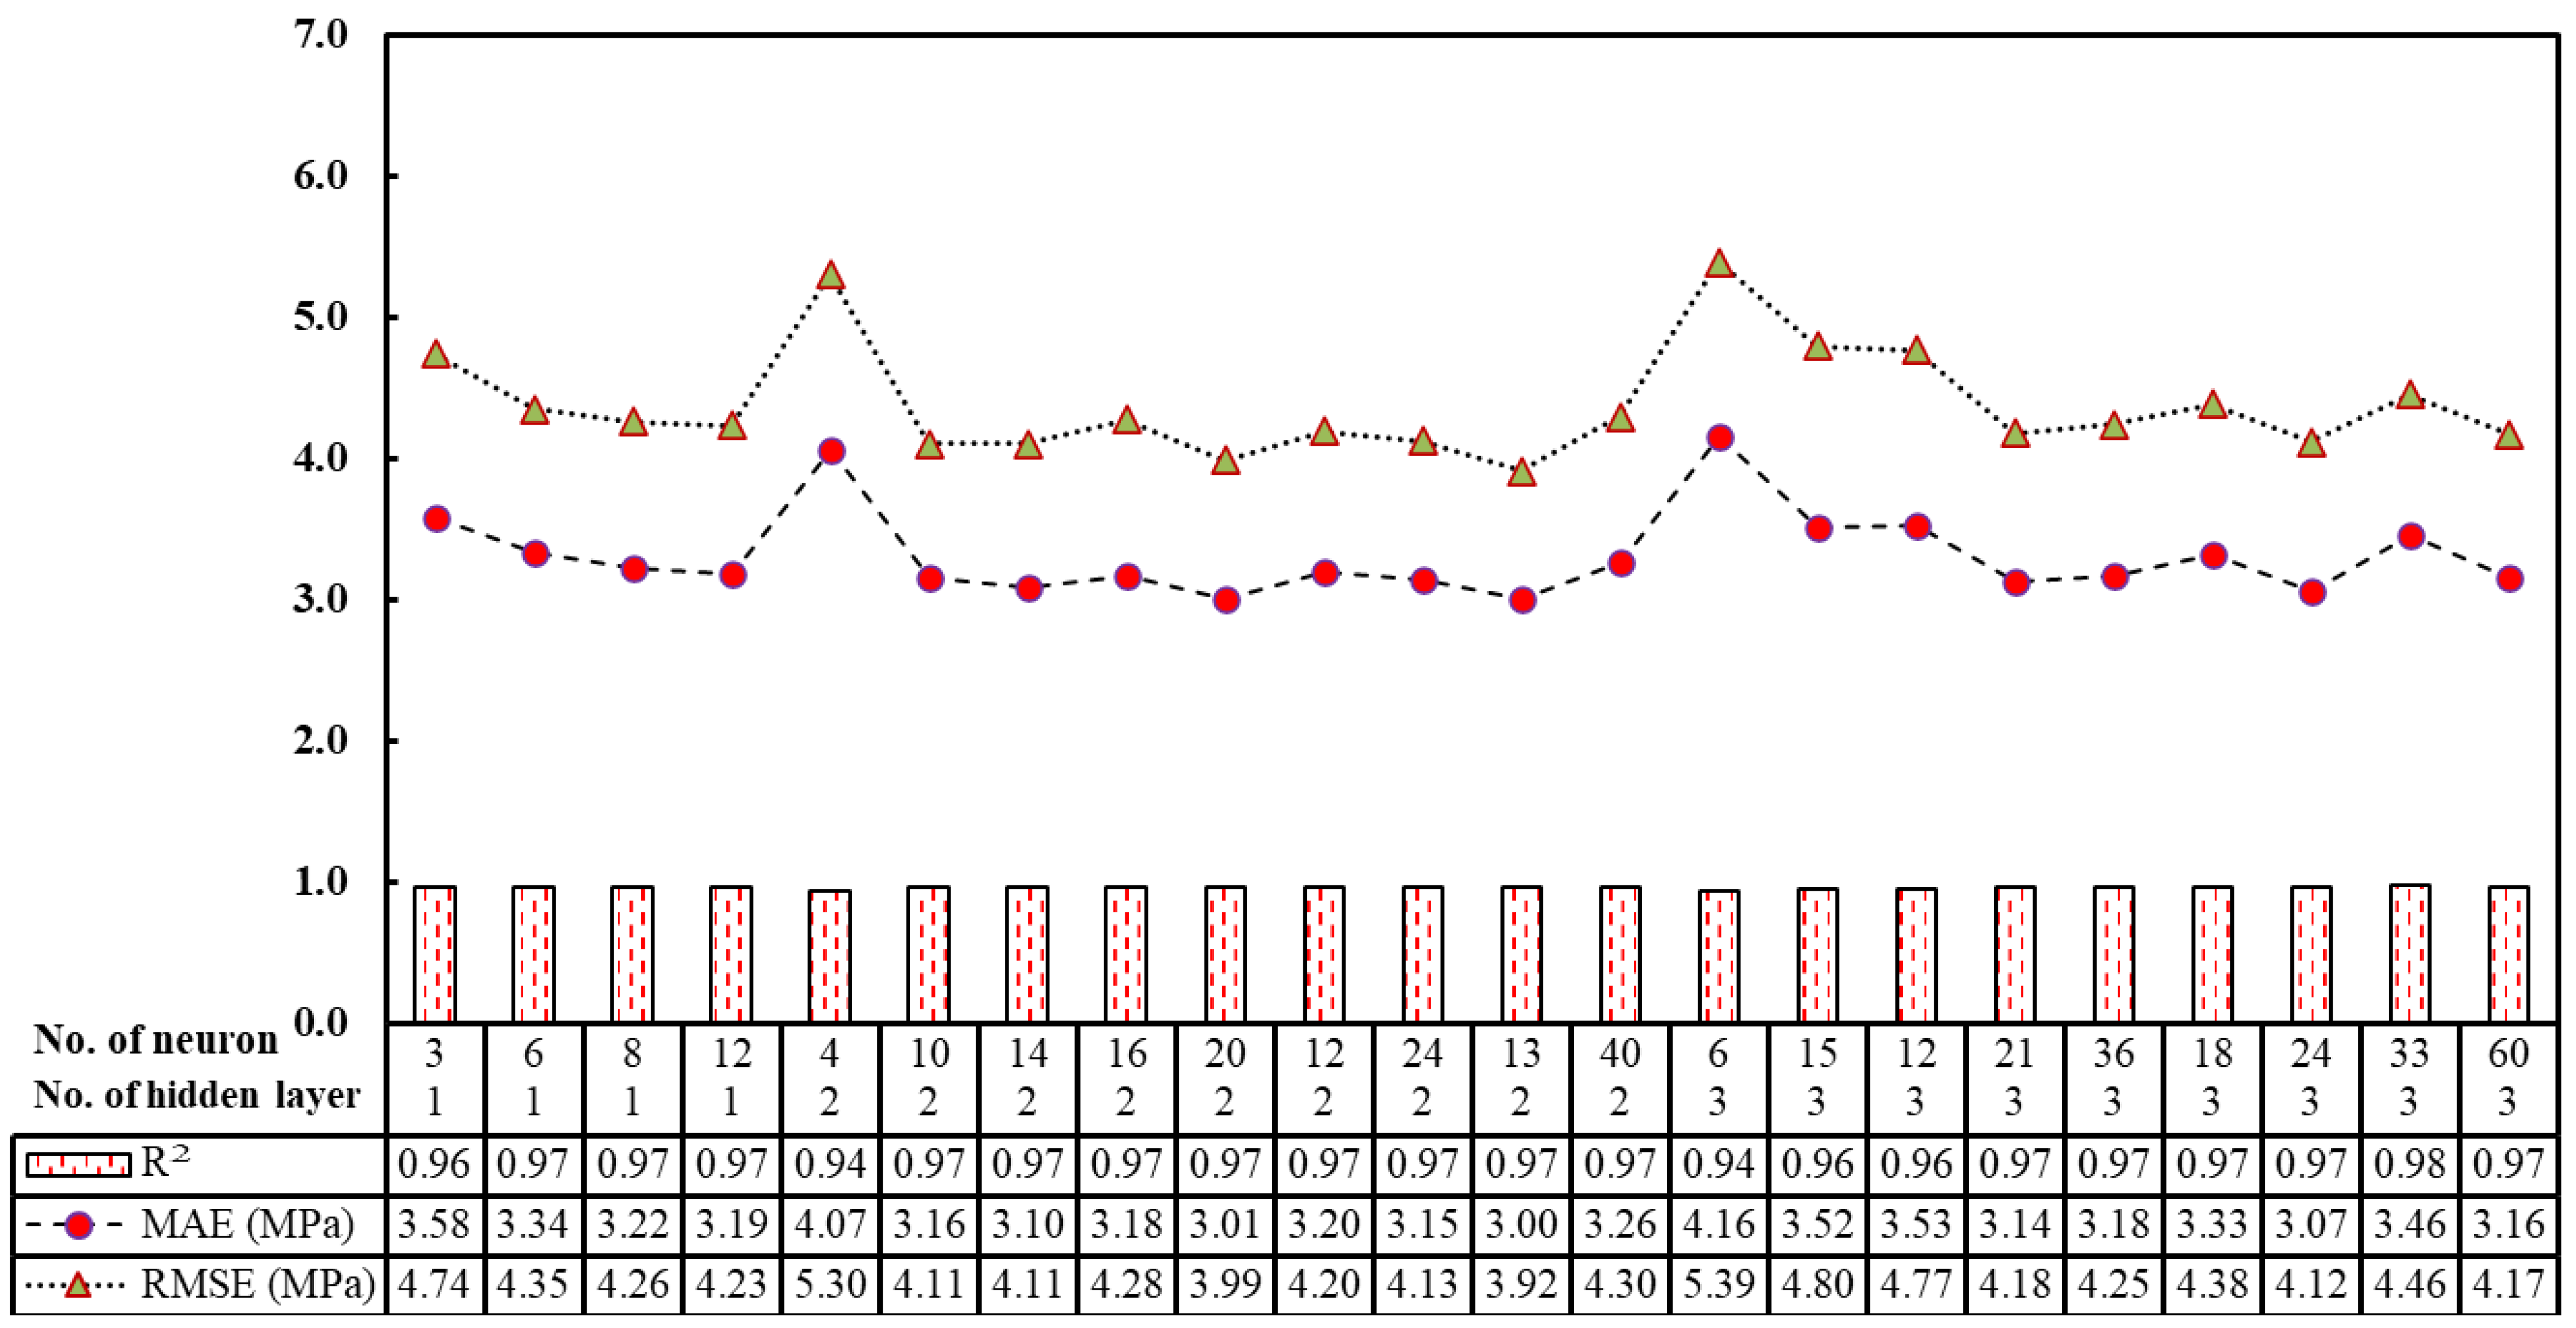
The inverse of forwarding neural networks is ANNs [74,75]. It is constructed of three separate, layer types: input, output, and hidden. The input layer receives the signal to be inspected. The output layer is responsible for performing essential tasks such as prediction and classification. True computational ANN engines have infinite hidden layers between the input and output levels. Data travel from the source to the destination layer, similar to the feed-forward network in the ANN. Over trial cycles, the multi-hidden layer result was improved to determine the best number of hidden layers for a model in error reduction and R2 [76]. The constructed ANN was trained and evaluated for different hidden layers to establish an ideal network topology based on the projected CS of ECCs, including FA with the CS of the actual collected data. To obtain high ANN efficiency, the authors looked at hidden layers, neurons, momentum, learning rate, and iterations. Finally, they observed that the CS of the SCC containing fly ash is best predicted when the ANN has three hidden layers, each with eleven neurons (as shown in Figure 2), 2000 iterations, 0.2 learning rate, and 0.1 momentum, which provided the greatest R2 and the lowest MAE and RMSE (shown in Figure 3). The general equations of the ANN model may be found in Equations (5)–(7) [76,77,78].
From linear node 0:
CS = Threshold + ( Node   1 1 + e B 1 ) + ( Node   2 1 + e B 2 ) +  
From sigmoid node 1:
B 1 = Threshold +   ( Attribute Variable )  
From sigmoid node 2:
B 2 = Threshold +   ( Attribute Variable )  

3.2.5. M5P-Tree Model (M5P)

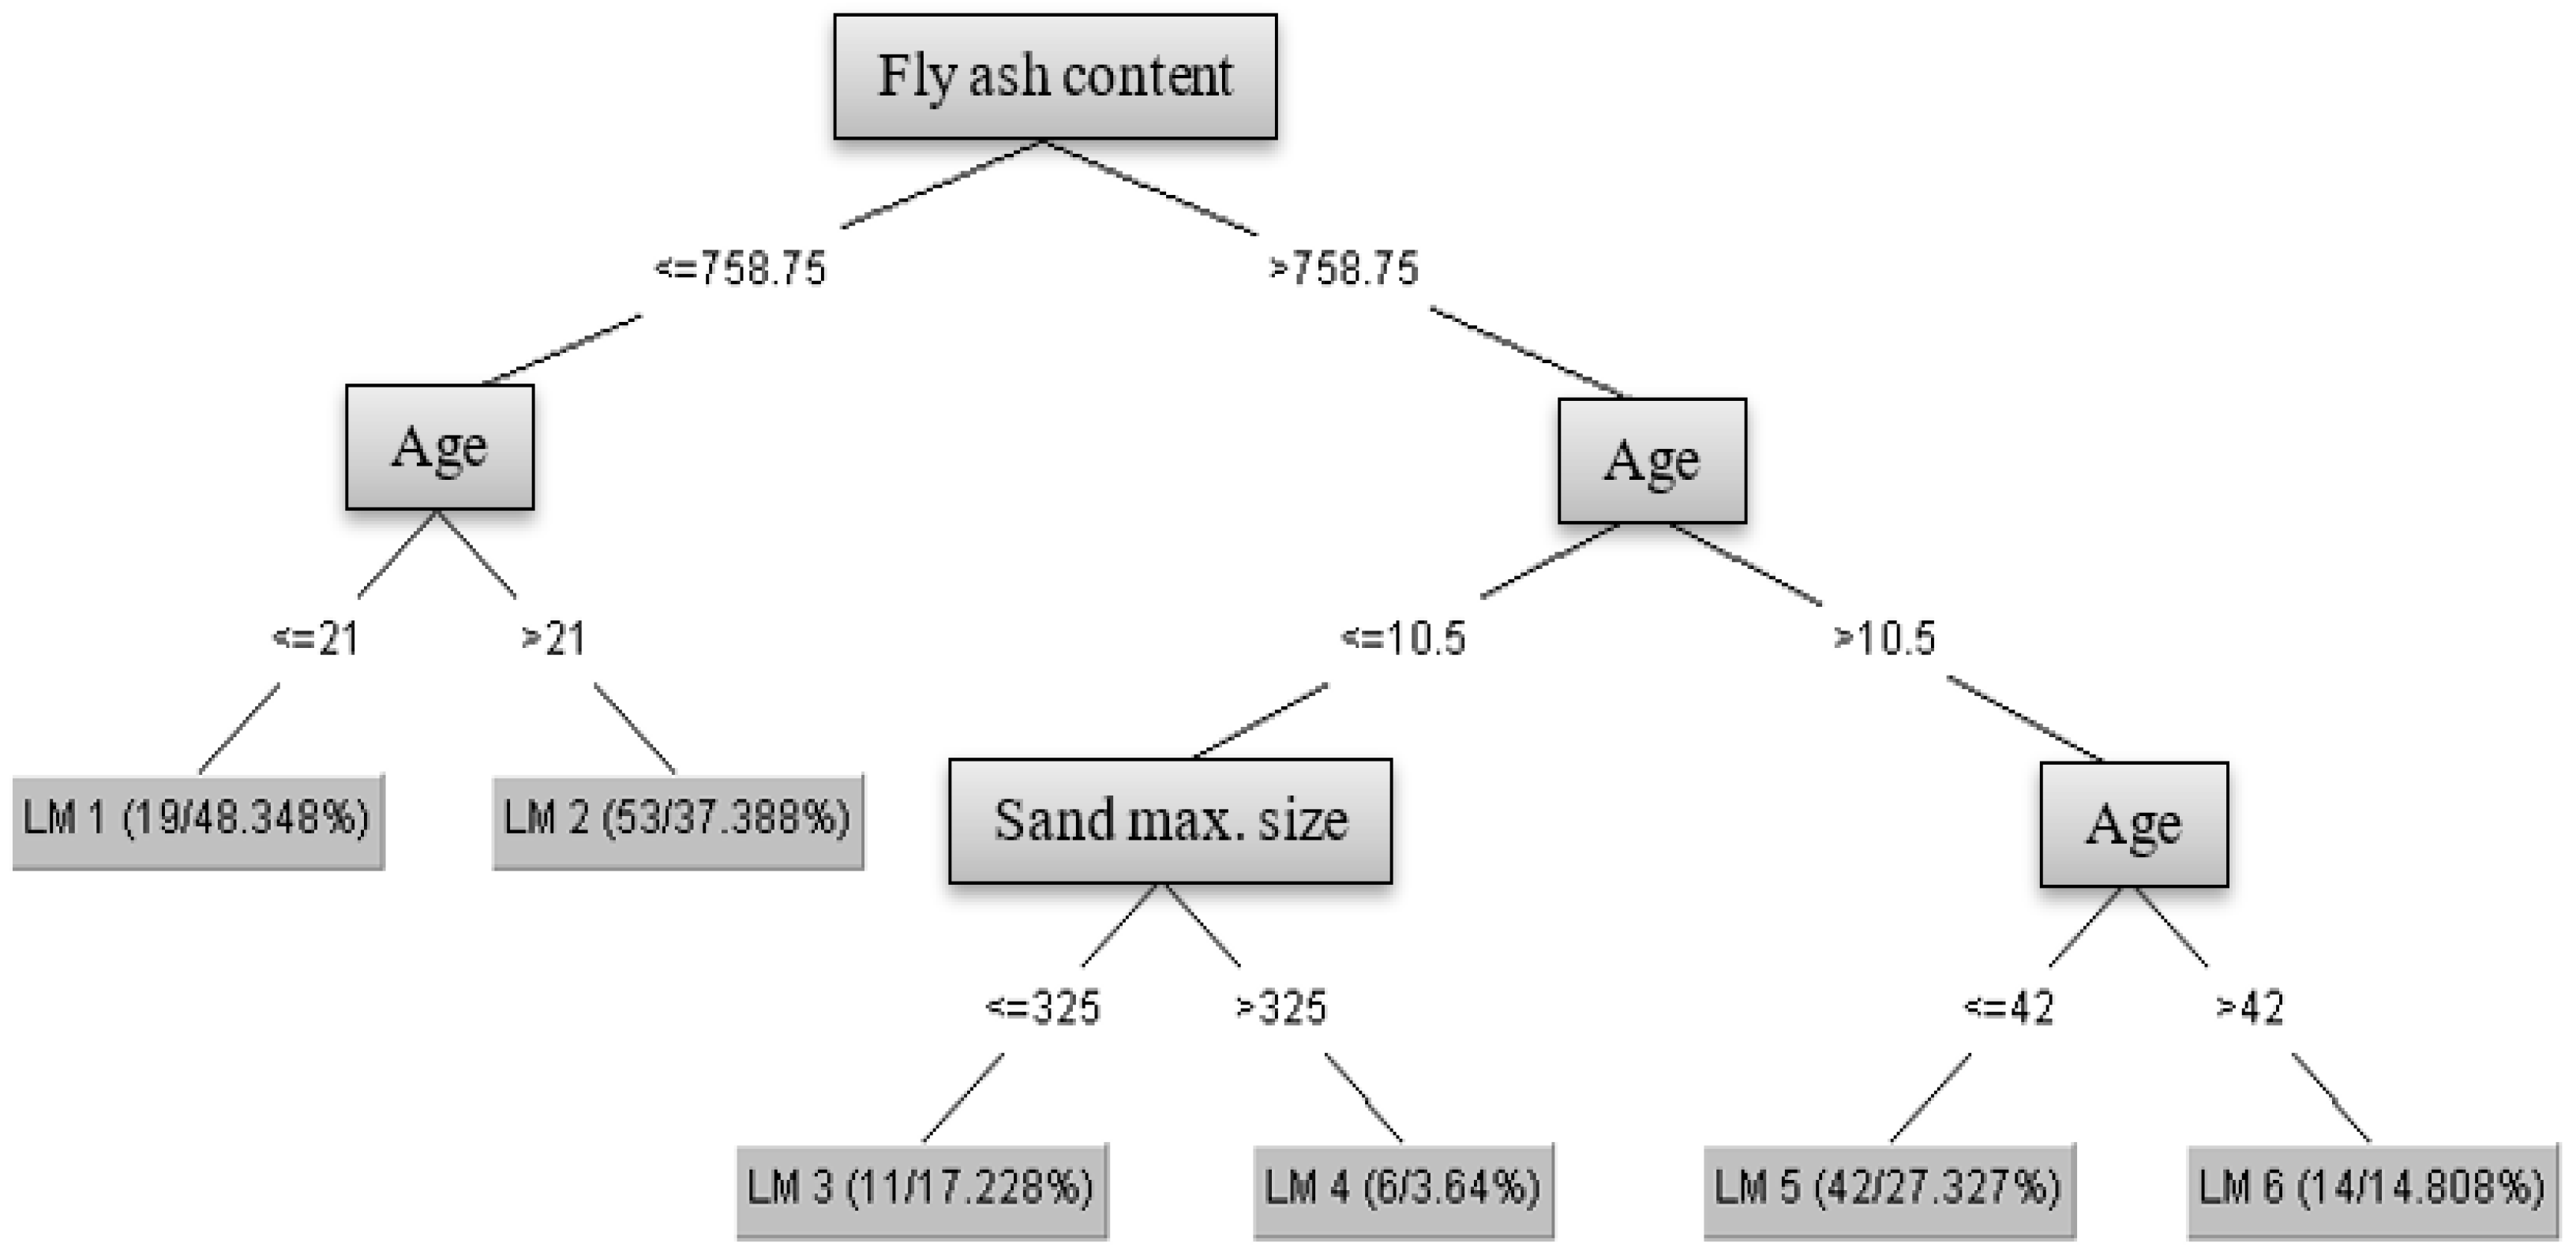
M5P-tree is a modified version of the Quinlan M5 technique [79,80]. One of the key benefits of tree modeling is its capability to efficiently manage massive volumes of data with an infinite number of attributes and dimensions. Error estimates and details on the tree division criteria used in the M5P-tree model are displayed on each node. Any function associated with that node is evaluated using the feature that most reduces expected error. The M5P-tree model’s tree division criteria are derived from node-level error estimations. The M5P-tree error represents the standard deviation of a node’s class value. The feature that minimizes the expected error reduction after analyzing each attribute at that node is used to divide the nodes. The data for child nodes (subtree or smaller nodes) have a lower standard deviation SD due to the branching approach. After evaluating all alternative structures, nodes that serve as parents (larger nodes) choose the structure with the best chance of reducing errors. This division is also in charge of generating a massive tree-like structure that encourages overfitting. Figure 4 depicts the correlations of tree-shaped branches. Additionally, the M5P-tree model’s general equation form is the same as the linear regression equation, as illustrated in Equation (8).
CS =   α 1 + α 2 ( C ) + α 3 ( FA ) + α 4 ( w b ) + α 5 ( MSS ) + α 6 ( S ) + α 7 ( SP ) + α 8 ( F ) + α 9 ( FL ) + α 10 ( FD ) + α 11 ( T )
where C represents cement content (kg/m3); FA represents fly ash content (kg/m3); w/b represents water-to-binder ratio; MSS stands for the maximum size of sand (µm); S stands for sand content (kg/m3); SP stands for superplasticizer dosage (kg/m3); F stands for fiber content (kg/m3); FL stands for fiber length (mm); and FD stands for fiber diameter (µm). Furthermore, the model parameters are α1, α2, α3, α4, α5, α6, α7, α8, α9 α10, and α11.

3.3. Assessment Criteria for the Developed Models

Diverse assessing metrics were used to investigate and evaluate the efficacy of the proposed models, which may be estimated using the equations provided below:
R 2 = (   p = 1 p ( t p   t ) ( y p   y ) [ p = 1 p ( t p   t ) 2 ] [ p = 1 p ( y p   y ) 2 ]   ) 2
RMSE = p = 1 p ( y p t p ) 2 p  
MAE = p = 1 p | ( y p t p ) | p  
SI = RMSE   t  
OBJ = ( n tr n all RMSE tr +   MAE tr R tr 2 + 1 ) + ( n tst n all RMSE tst +   MAE tst R tst 2 + 1 )  
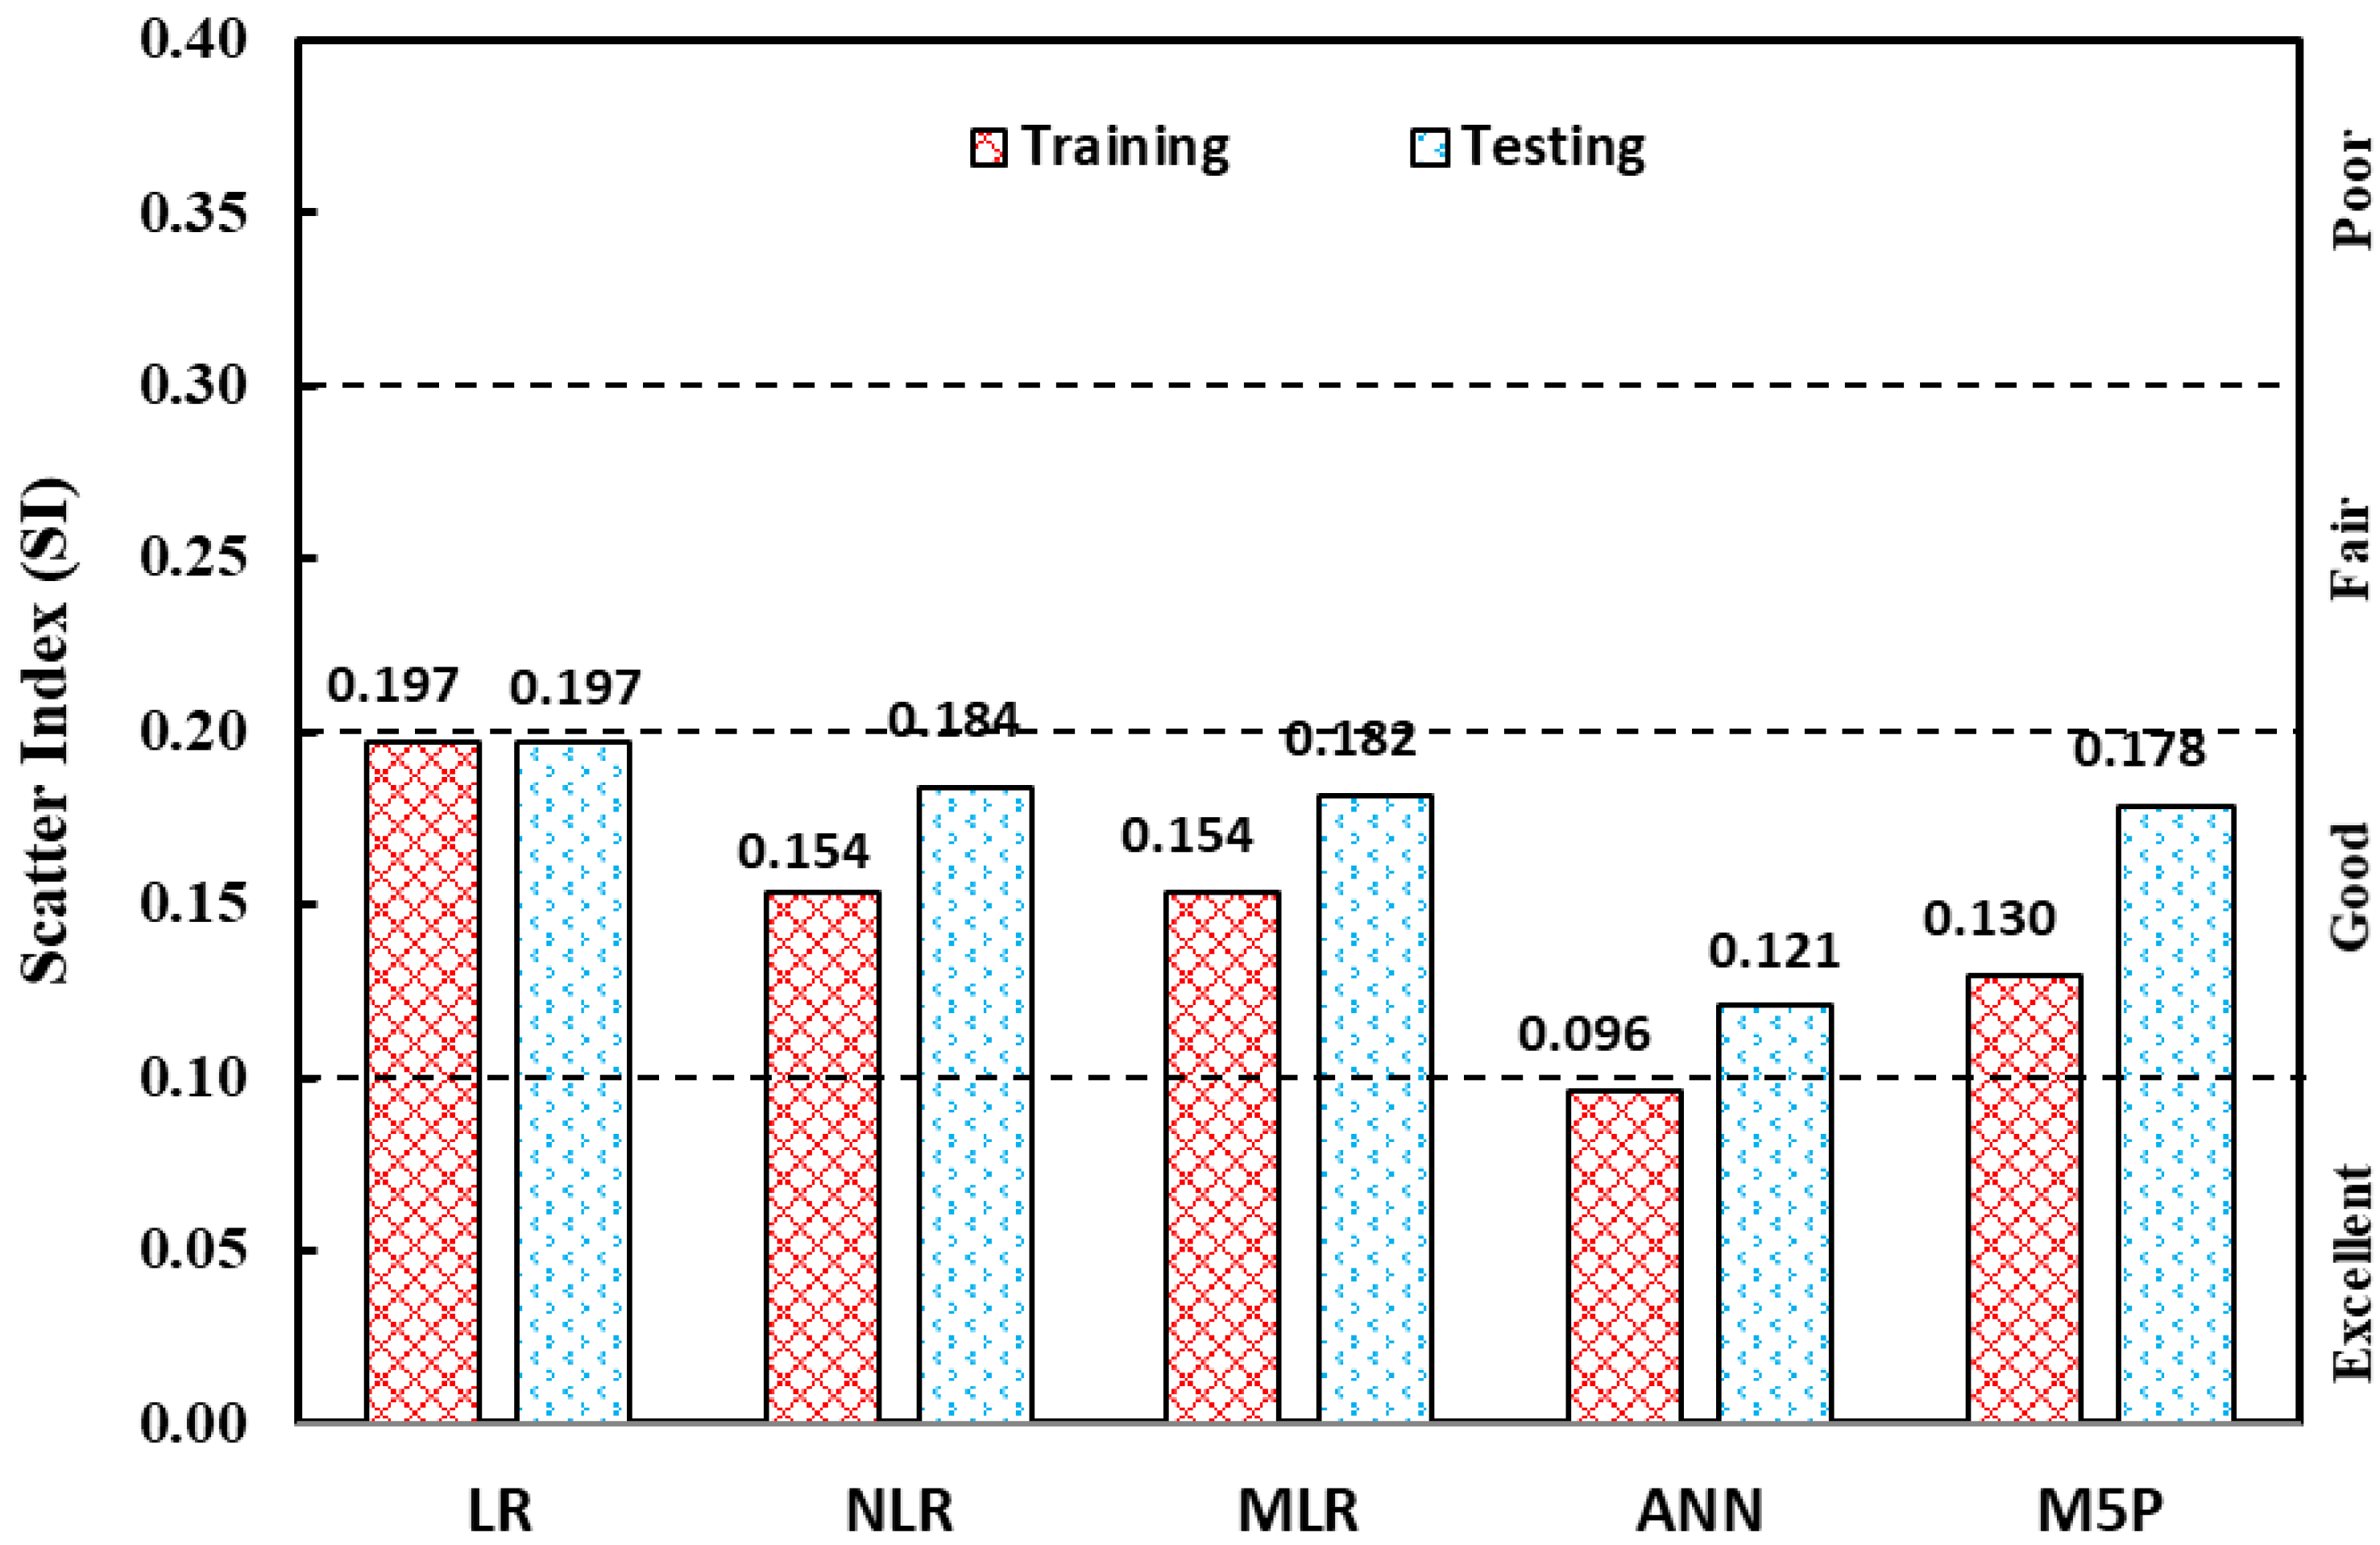
yp and tp indicate the expected and actual values of the route pattern, respectively, as shown in the previous formulations. The mean of the actual and projected values is denoted by T′ and y′, respectively. The letters tr signify trained datasets, the letters tst denote tested datasets, and the letter n denotes the number of patterns (collected data) in the linked dataset. When it comes to the SI parameter, when it is more than 0.3, (reasonably) when it is between 0.2 and 0.3, (well) when it is between 0.1 and 0.2, and (excellently) when it is less than 0.1, a model performs (poorly) when it is greater than 0.3 [79,80].

4. Results and Discussion

4.1. Statistical Analysis

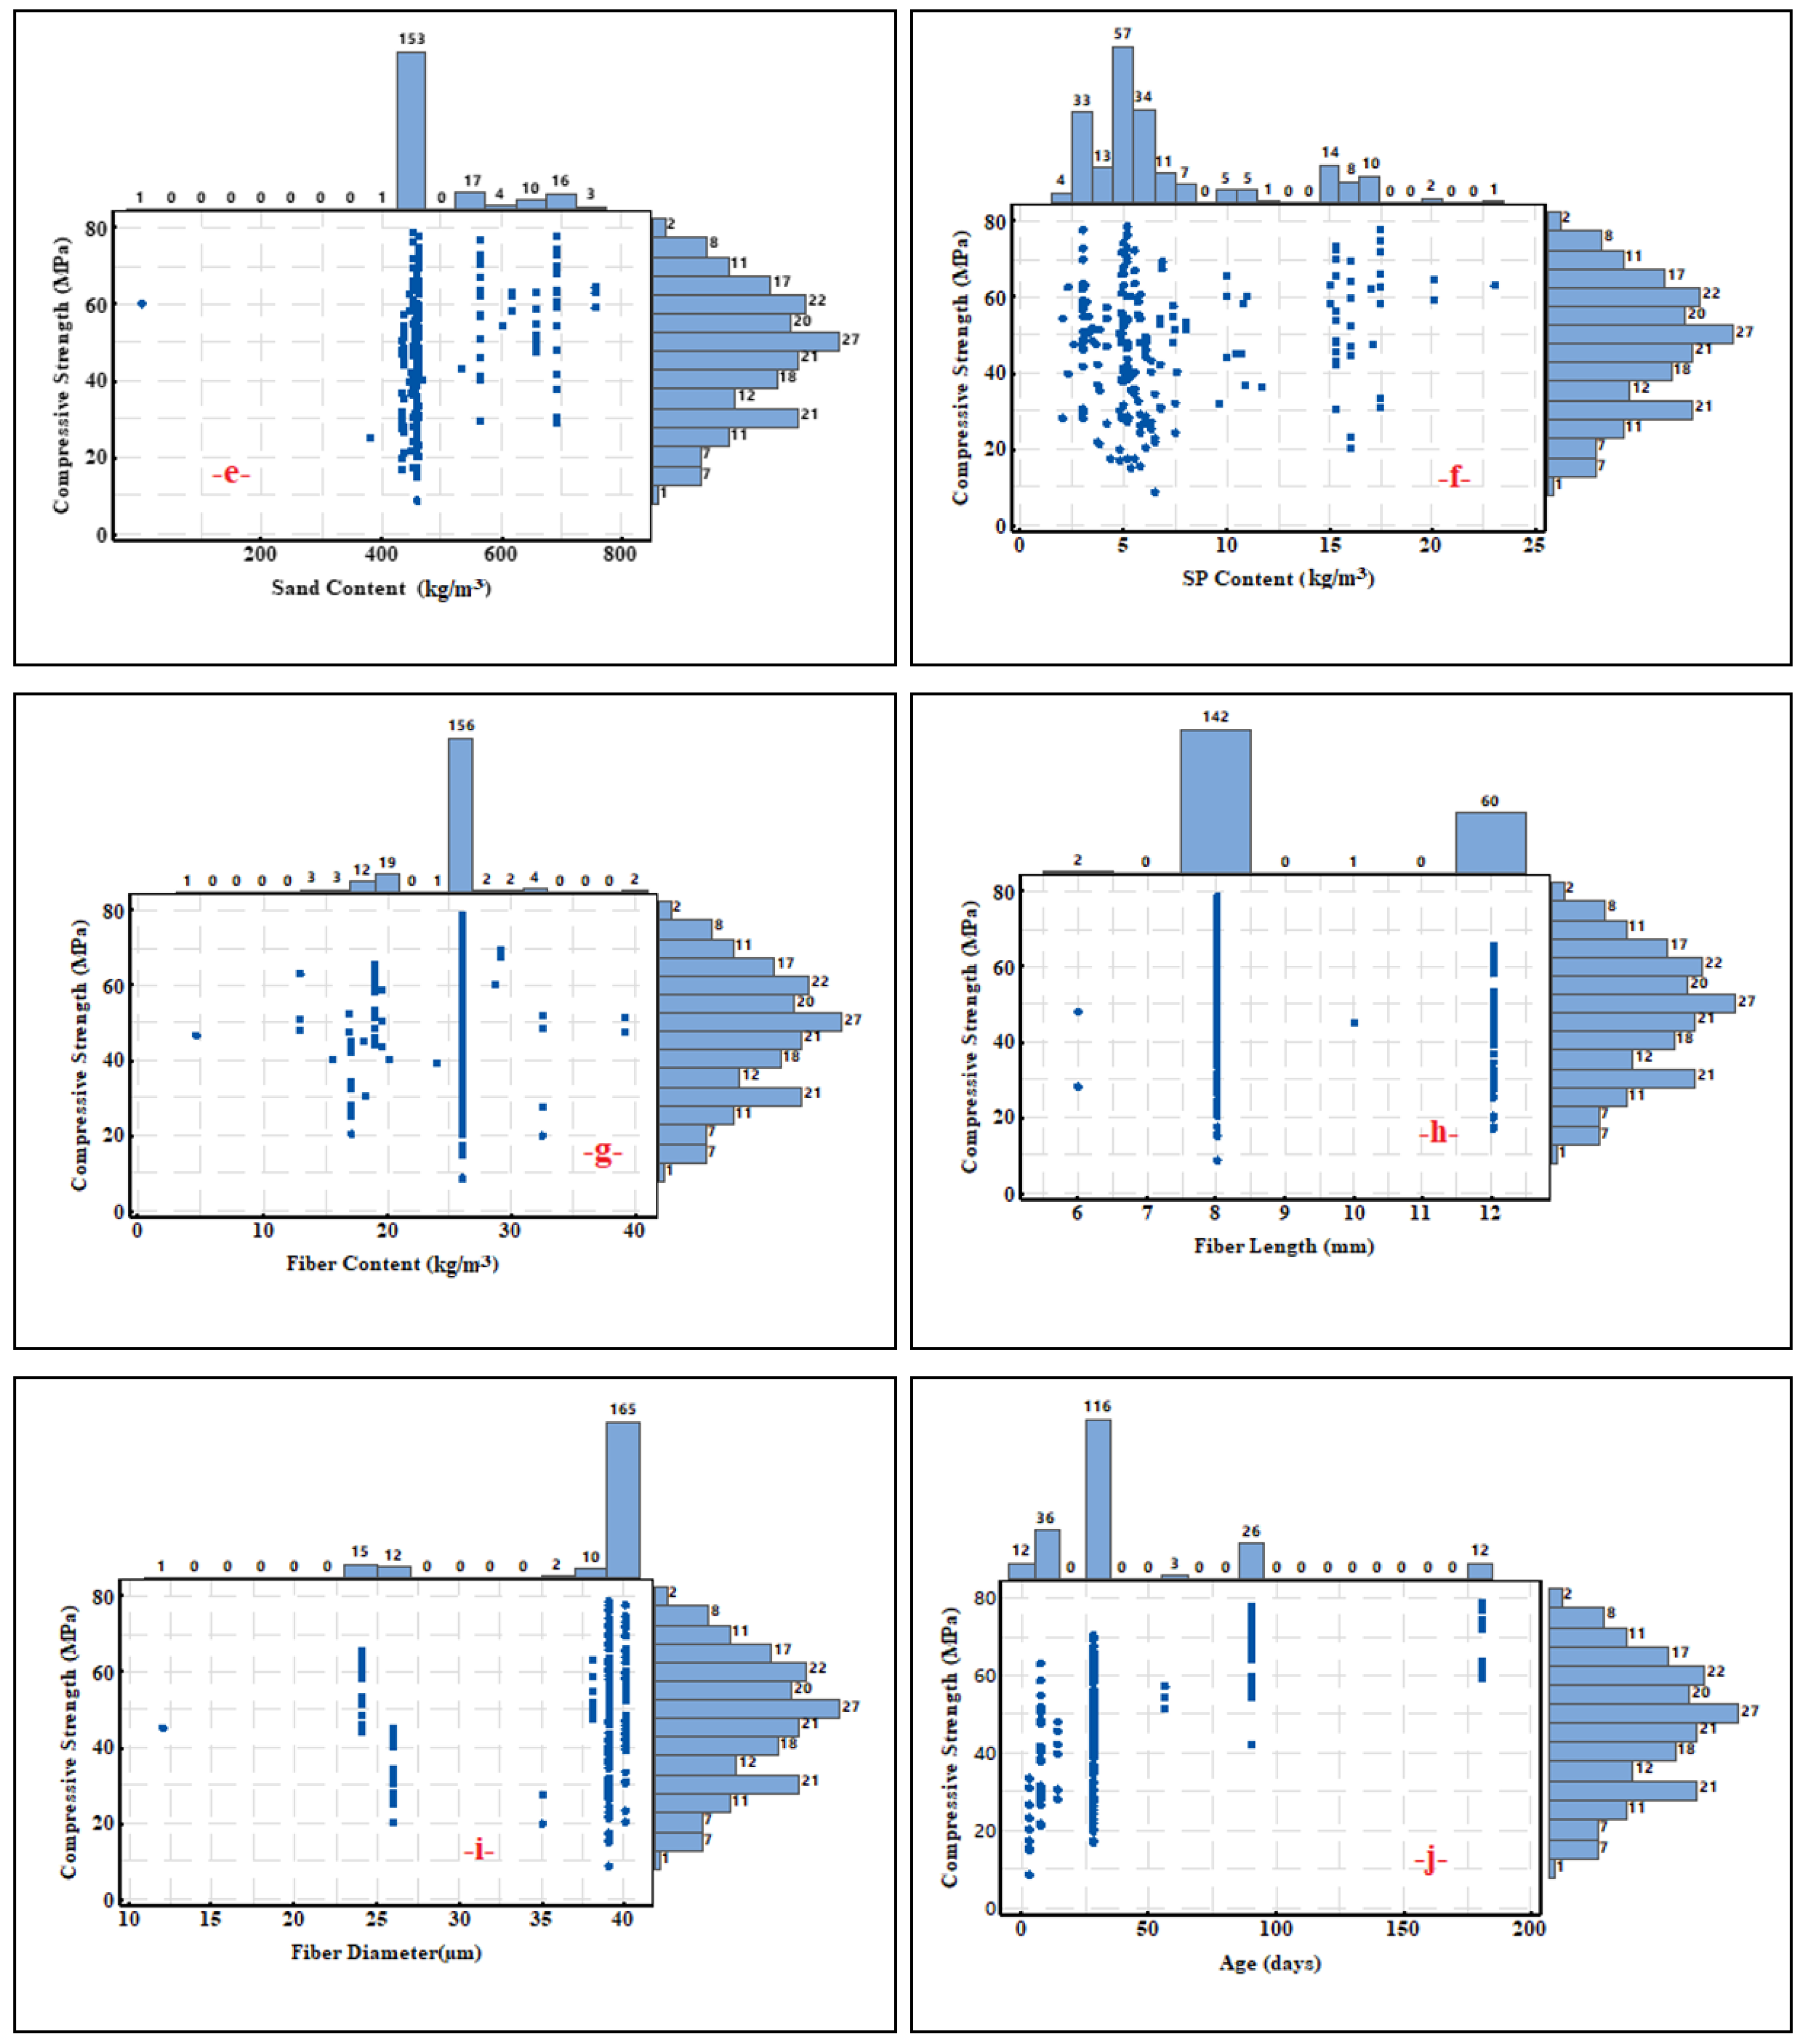
This part of the paper is all about the statistical analysis of the dependent and independent variables separately to determine whether a strong relationship exists between each variable and the compressive strength of the ECCs. Thus, the plot of all considered parameters including (i) cement content (Figure 5a), (ii) fly ash content (Figure 5b), (iii) w/b (Figure 5c), (iv) maximum size of sand (Figure 5d), (v) sand content (Figure 5e), (vi) SP content (Figure 5f), (vii) fiber content (Figure 5g), (viii) fiber length (Figure 5h), (ix) fiber diameter (Figure 5i), and (x) curing time (Figure 5j) were plotted and analyzed with actual CS; in addition, the normal distribution of CS extracted from prior studies is illustrated in Figure 6. Additionally, to clarify the distribution of every variable with the compressive strength, statistical functions such as Standard Deviation (SD), Variance, Skewness, minimum, average, maximum, and Kurtosis were calculated in Table 2 to demonstrate the distribution of each variable.
As mentioned previously, the behavior of ECCs is directly related to fiber length and diameter. Therefore, both properties and fiber content were considered input variables. Most of the fibers used in the previous studies were PVA fiber with fiber lengths between 6 mm and 12 mm and fiber diameters between 12 µm and 40 µm. Additionally, the fiber contents ranged from 4.55 kg/m3 to 39 kg/m3. Portland cement (OPC) Type I was the most used cement for producing ECC mixes.
Moreover, based on past studies, the sand used was micro silica sand with a maximum size ranging from 100 µm to 4750 µm. The sand content ranged from 380 kg/m3 to 756 kg/m3. Based on the past investigations, the SP type was a polycarboxylate-based high-range water-reducing admixture used to achieve the workability properties of ECC mixes.
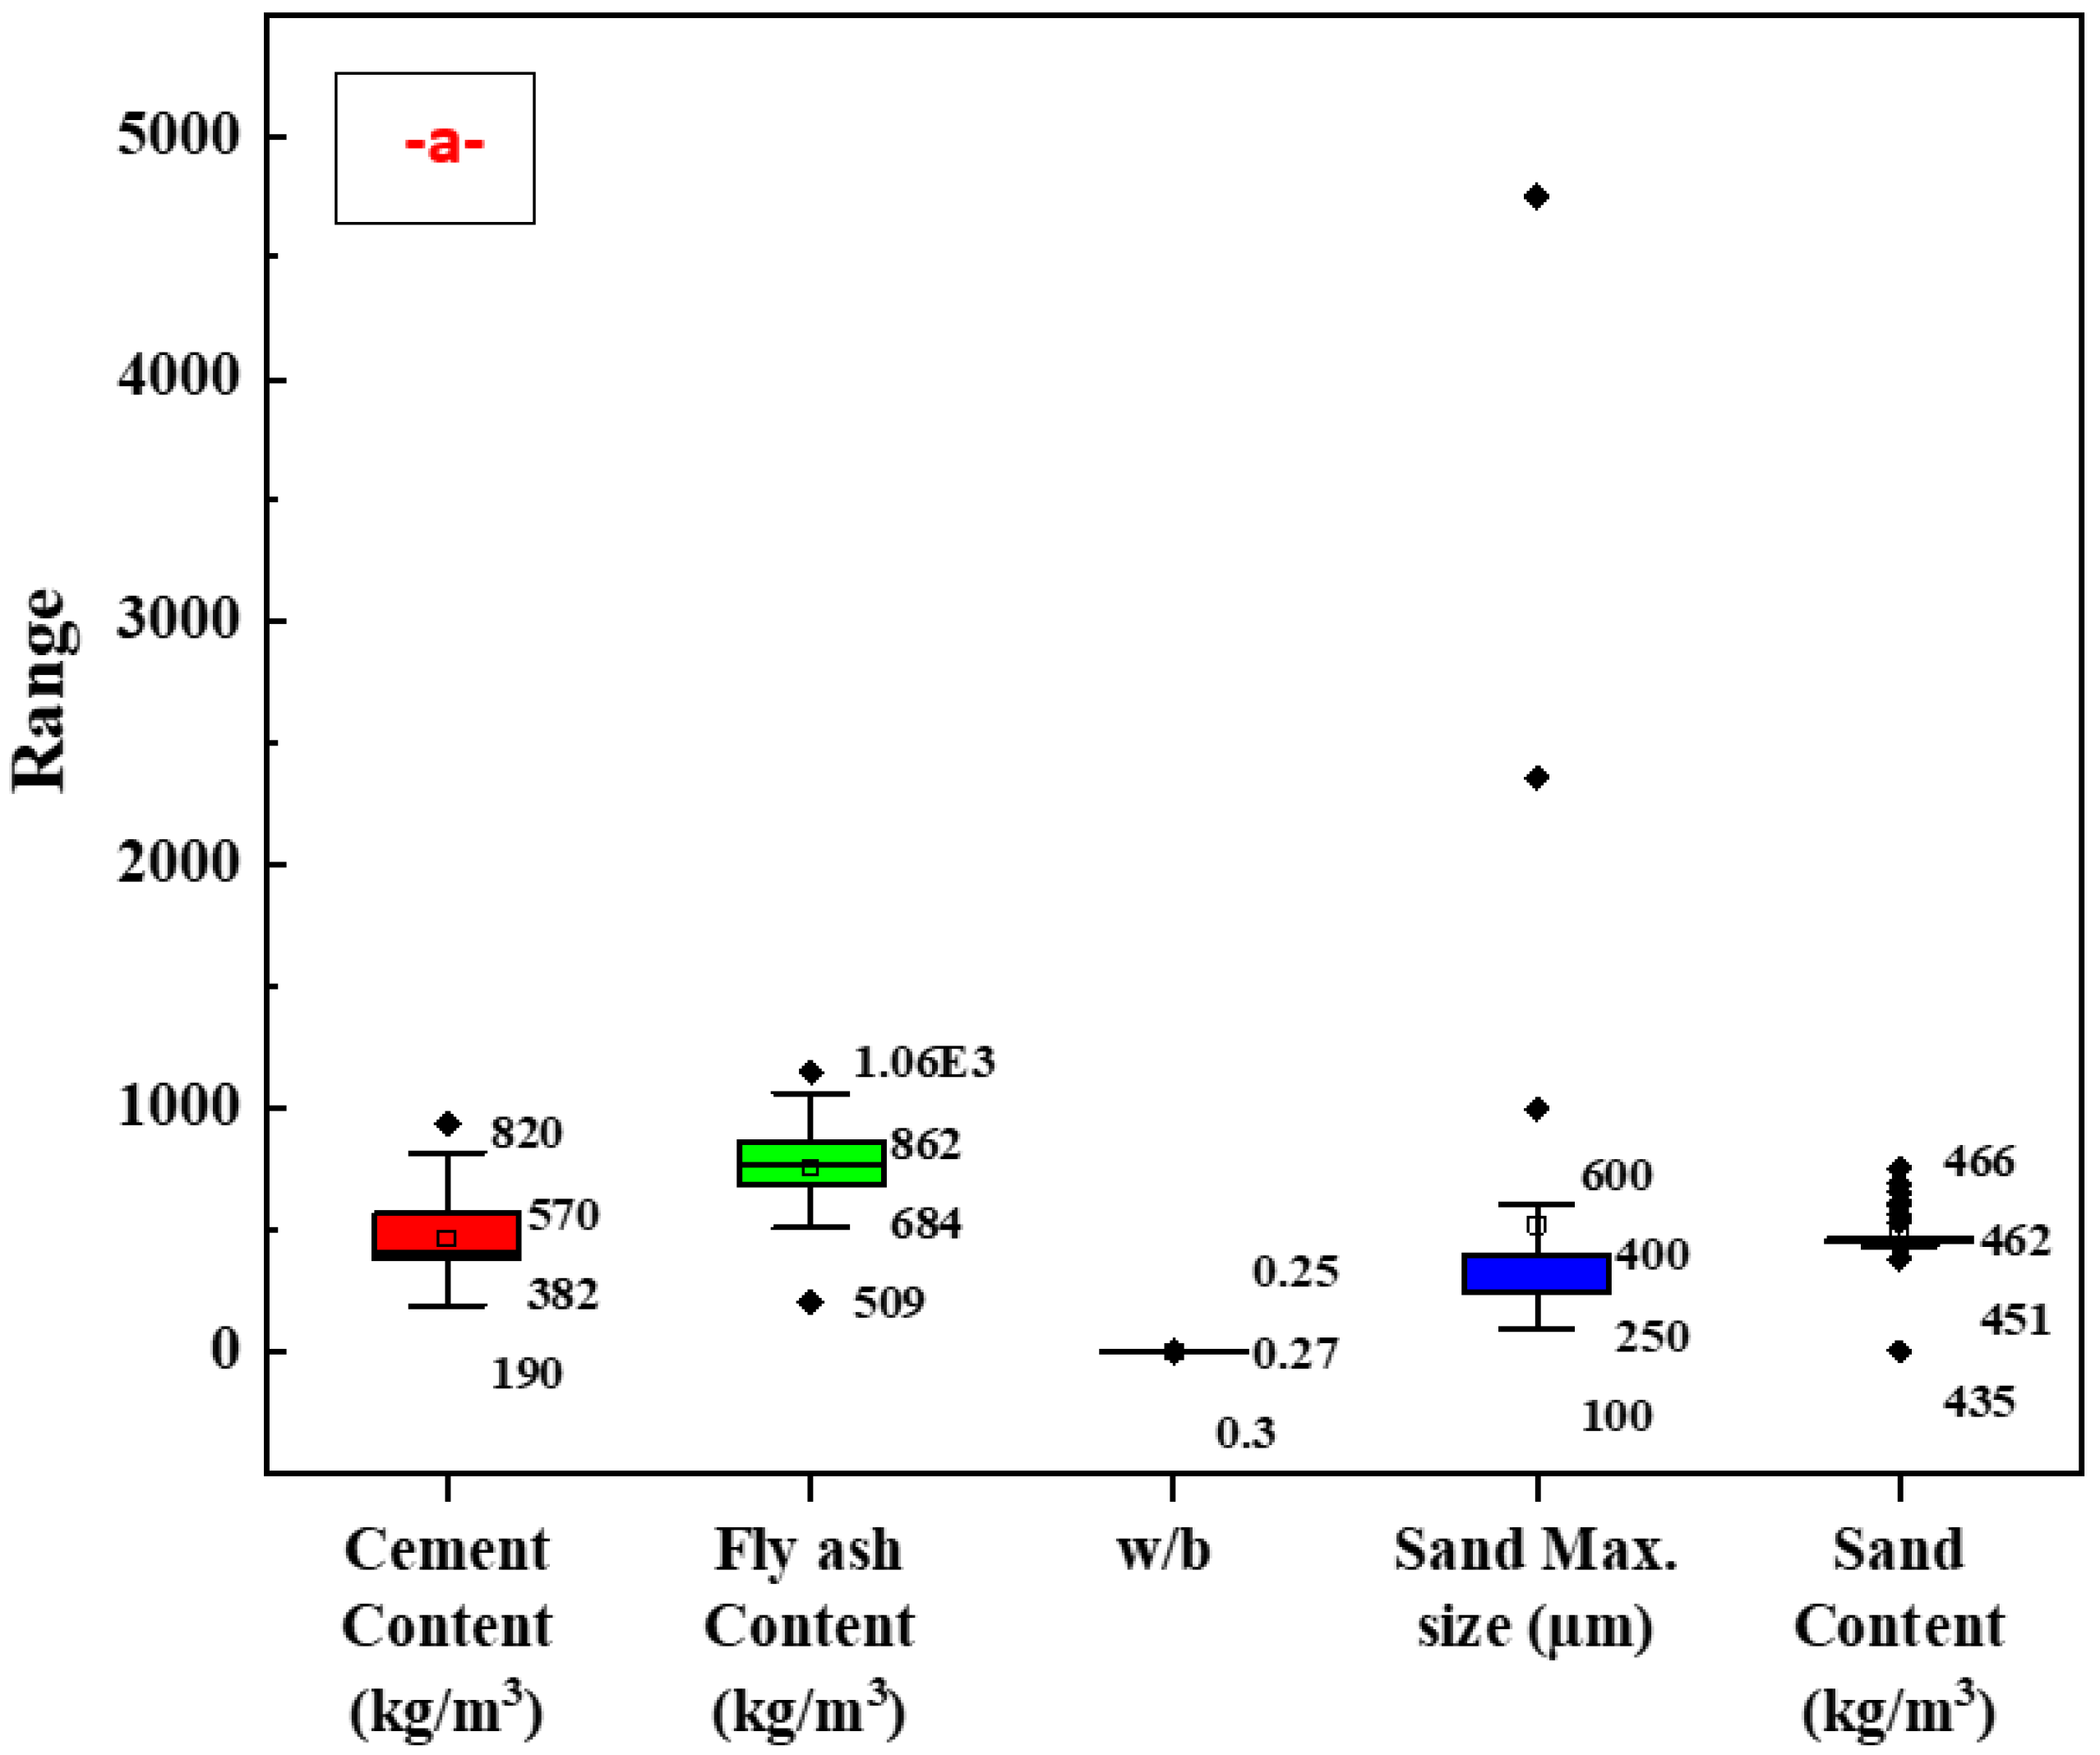
Finally, a box plot for the input model parameters was plotted in Figure 7a, b to show the distribution and ranges of the input model parameters. A box plot is a standardized method for representing the distribution of data using a five-number summary (“minimum,” first (lower) quartile (Q1), median, third (upper) quartile (Q3), and “maximum”). It can provide information about your outliers and their values.

4.2. Model Outputs

4.2.1. The LR Model

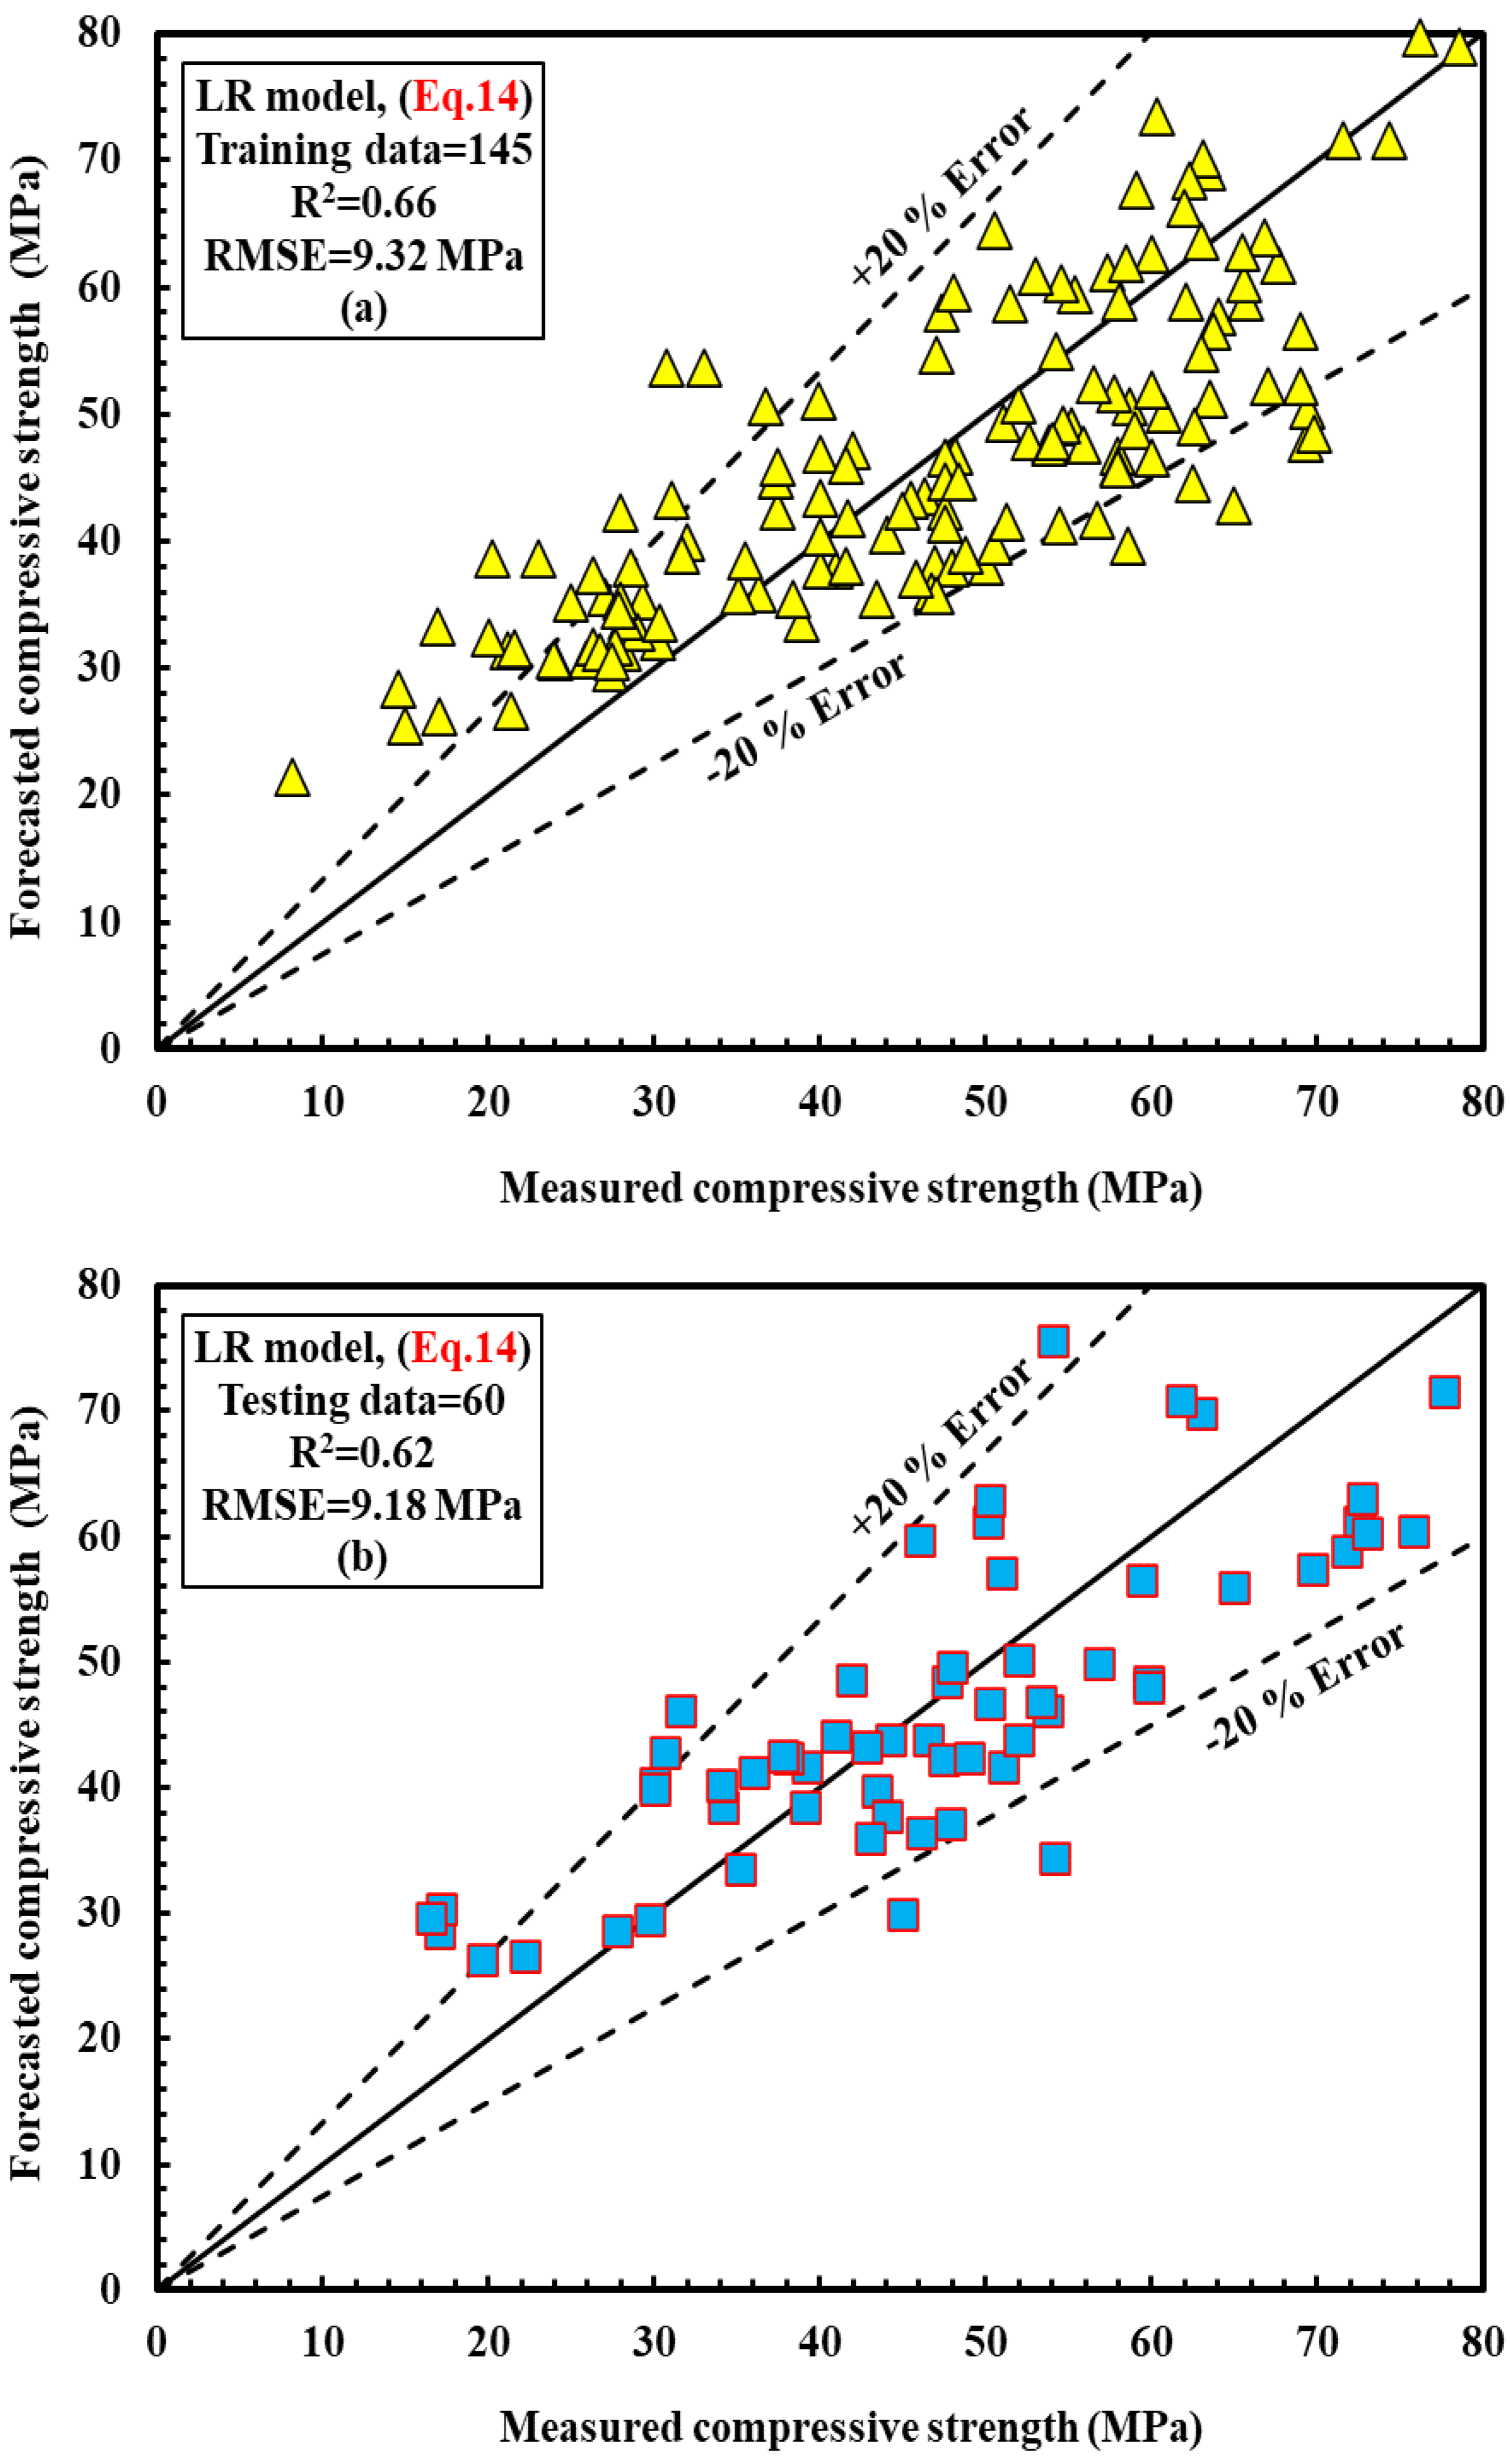
Figure 8a,b demonstrate the relationship between measured and anticipated ECC CS for training and assessment. The sum of error squares and the least square approach was used to compute the value of each parameter in the current model. According to this model, the w/b ratio and fiber diameter significantly influence the CS of ECC integrated with fly ash. Equation (14) shows the LR model Equation with varied weight parameters:
CS = 2.324 + 0.044 ( C ) 0.011 ( FA ) + 16.23 ( w b ) + 0.004 ( SMS ) + 0.006 ( S ) + 0.66 ( SP ) 0.26 ( F ) + 0.224 ( FL ) + 0.385 ( FD ) + 0.205 ( T )  
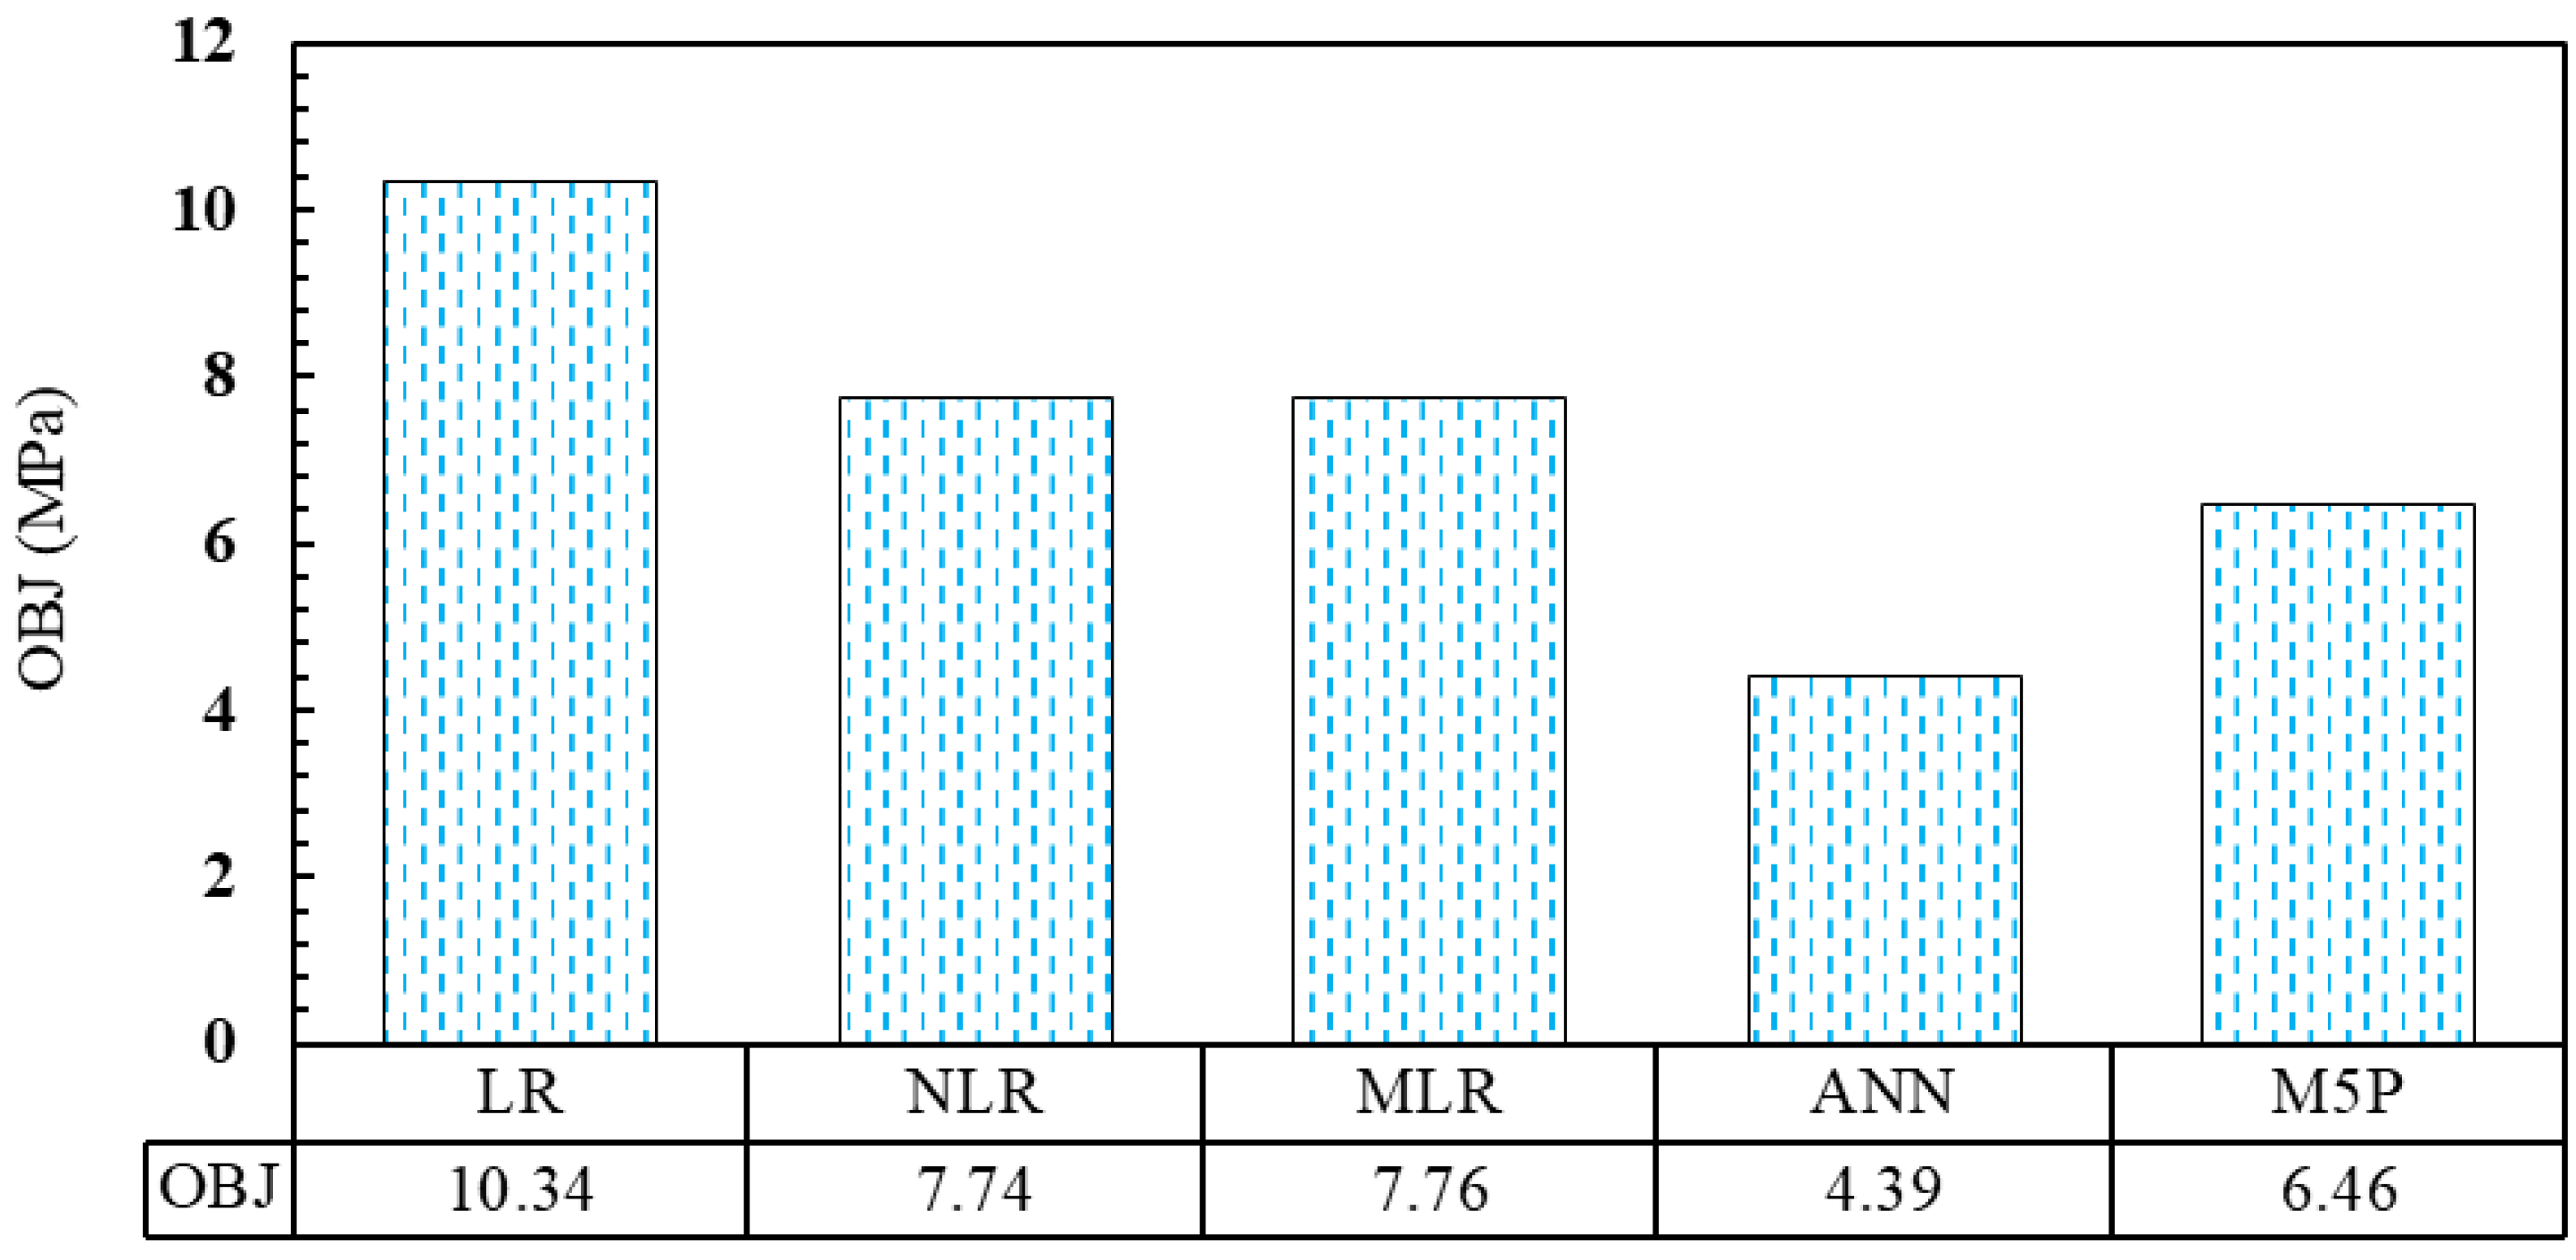
As seen in the equation above, the w/b ratio has the biggest impact on the CS. This might be consistent with the experimental findings reported in the literature. This model’s R2, RMSE, and MAE assessment parameters are 0.66, 9.32, and 7.76 MPa, respectively. Furthermore, as shown in Section 5, the current model’s OBJ and SI values for the training dataset are 10.34 and 0.197, respectively.

4.2.2. NLR Model

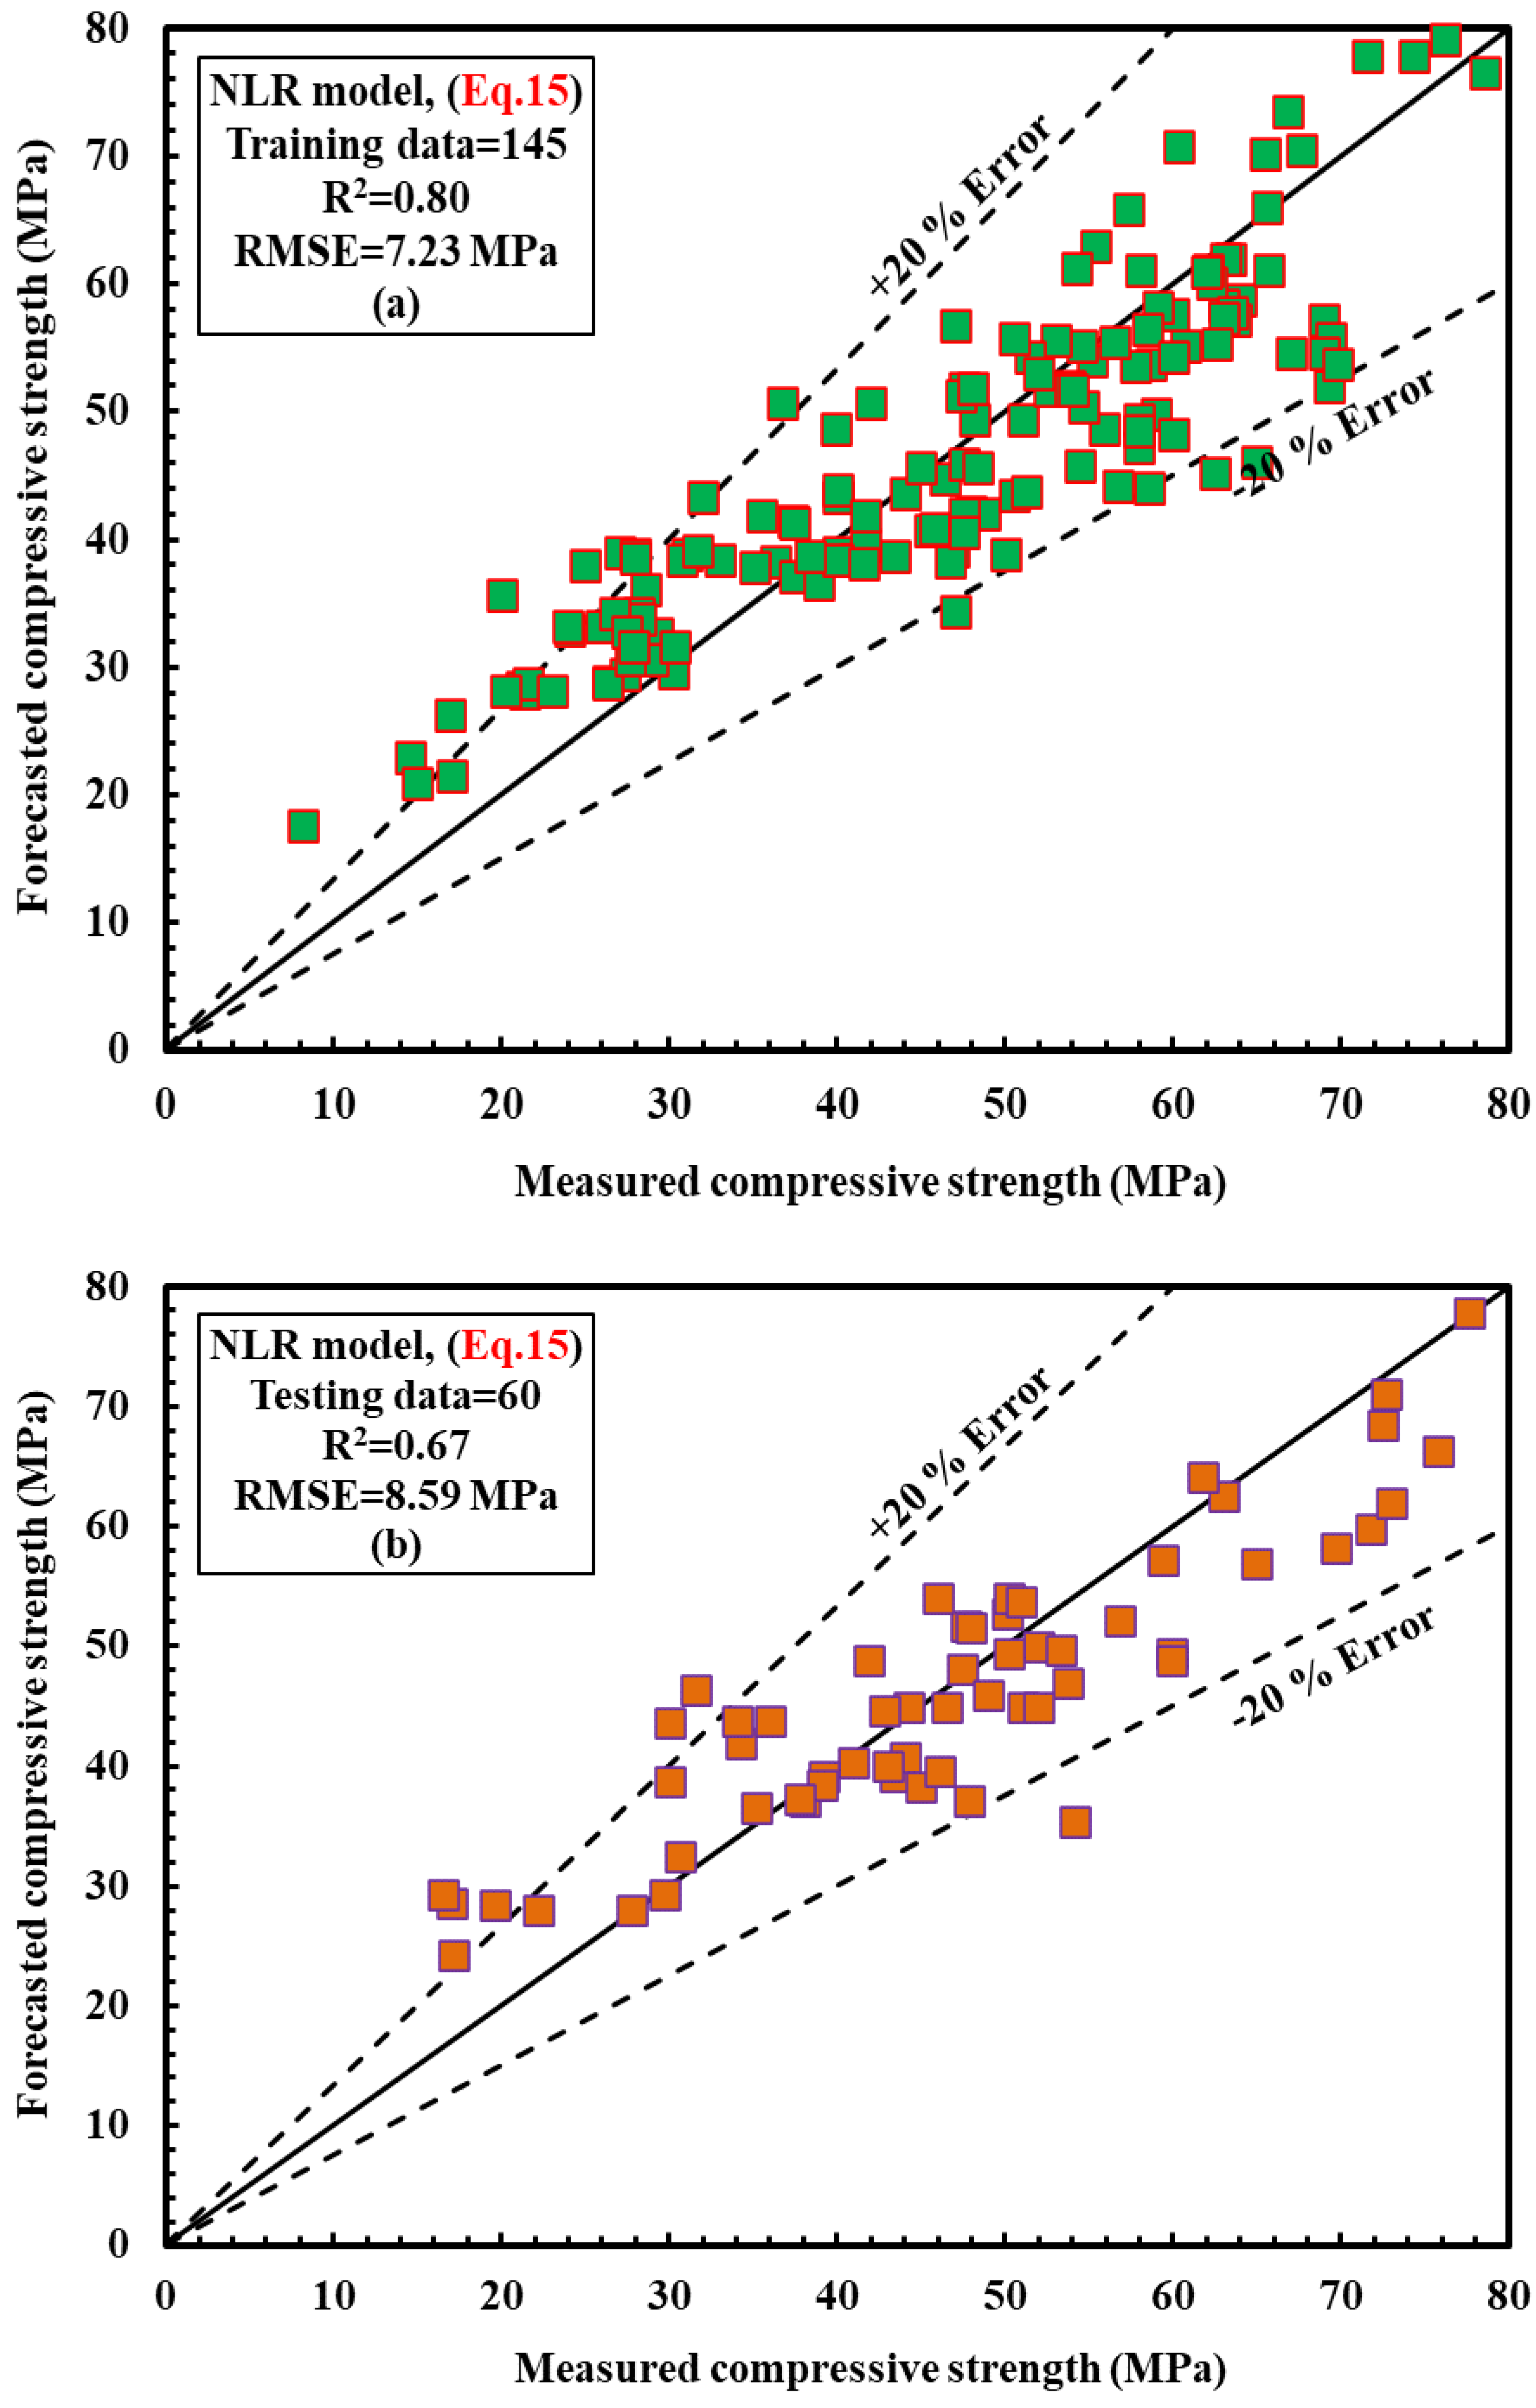
Figure 9a,b demonstrate the relationship between predicted and real CS retrieved from earlier ECC mix experiments that used fly ash as a training and testing dataset. The maximum sand and fiber concentration, as well as fiber size, are the most important elements impacting the CS of ECC mixes, according to the current model. Many experimental programs from prior research, as indicated in Table 1, backed this up. The CS of ECCs containing fly ash was significantly affected by increasing the maximum size of sand and changing the number of fibers. Equation (15) suggests the following formula for the NLR model with different variable parameters:
CS = 4269895 ( C ) 0.605 ( w b ) 1.572 ( MSS ) 4.425   ( S ) 0.076 ( SP ) 2.767 ( F ) 22.26 ( FL ) 1.604 ( FD ) 1.005 ( T ) 0.612 + 0.946 ( C ) 0.488 ( w b ) 0.082 ( MSS ) 0.069   ( S ) 0.151 ( SP ) 0.106 ( F ) 0.092 ( FL ) 0.112 ( FD ) 0.095 ( T ) 0.207 ( FA ) 0.153
A measurement of this model’s R2, RMSE, and MAE is 0.80 MPa, 7.23 MPa, and 5.95 MPa. The OBJ and SI values for the training dataset are 7.74 and 0.154, respectively.
Figure 9. (a) Comparison of the CS of ECC mixtures that were tested and the CS that the NLR model predicted; (b): testing datasets.
Sustainability 14 12876 g009

4.2.3. MLR Model

For training and testing datasets, Figure 10a,b compare projected CS to actual CS recovered from prior investigations of ECC mixes created with fly ash. Similar to other models, previous research suggests that the cement concentration is the most significant parameter that influences the CS of ECC mixtures, including fly ash, as shown in Table 1. For the MLR model with different variable parameters, Equation (16) may be used to anticipate the CS of ECC, including fly ash:
CS = 0.945 ( C ) 0.488 ( FA ) 0.153 ( w b ) 0.082 ( MSS ) 0.069   ( S ) 0.151 ( SP ) 0.106 ( F ) 0.091 ( FL ) 0.112 ( FD ) 0.094 ( T ) 0.208  
This model’s R2, RMSE, and MAE assessment parameters are 0.79, 7.29, and 5.95 MPa, respectively. In addition, the OBJ and SI values for the current model’s training dataset are 7.76 and 0.154, respectively.

4.2.4. ANN Model

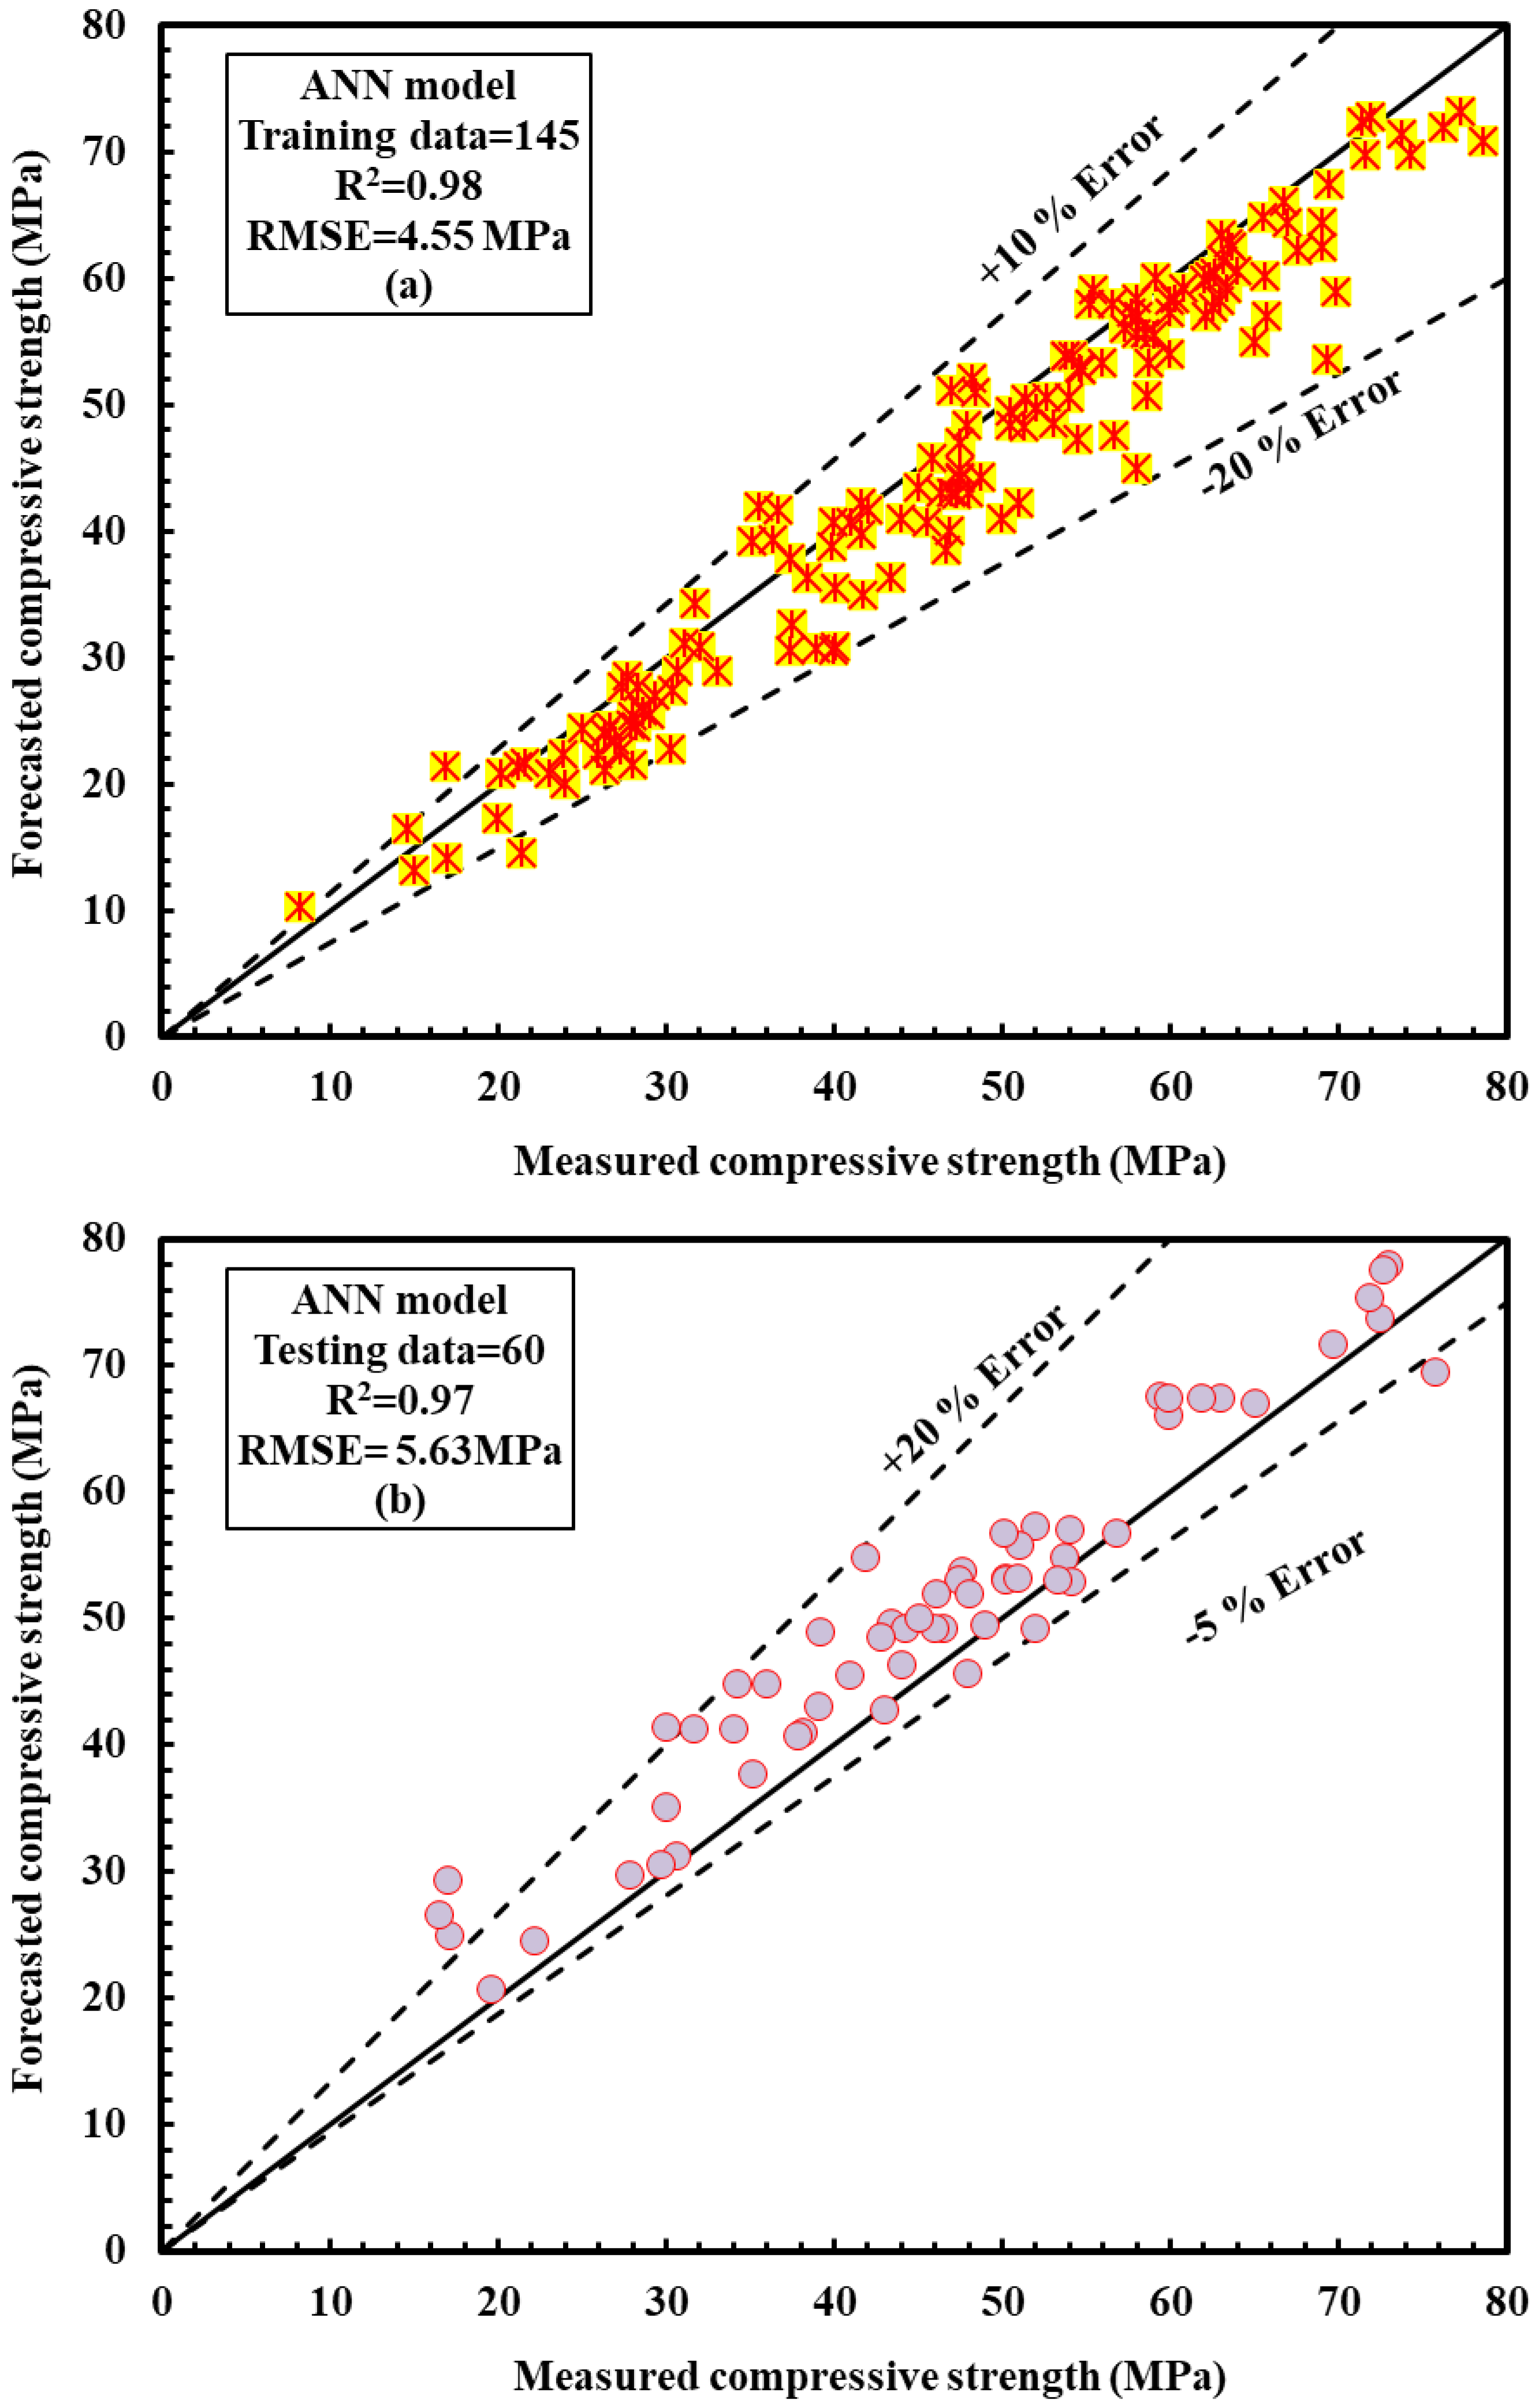
Figure 11a,b compare estimated and measured CS of SCC generated with fly ash for training and testing datasets. The training datasets have an error line of +10% and −20%, whereas the testing data has an error line of +20% and −5 percent, which is better than the other suggested models. R2 has an assessment parameter of 0.98, RMSE has a value of 4.55, and MAE has a parameter of 3.46. For the training data, the current model’s OBJ and SI values are 4.39 and 0.096, respectively.

4.2.5. M5P Model

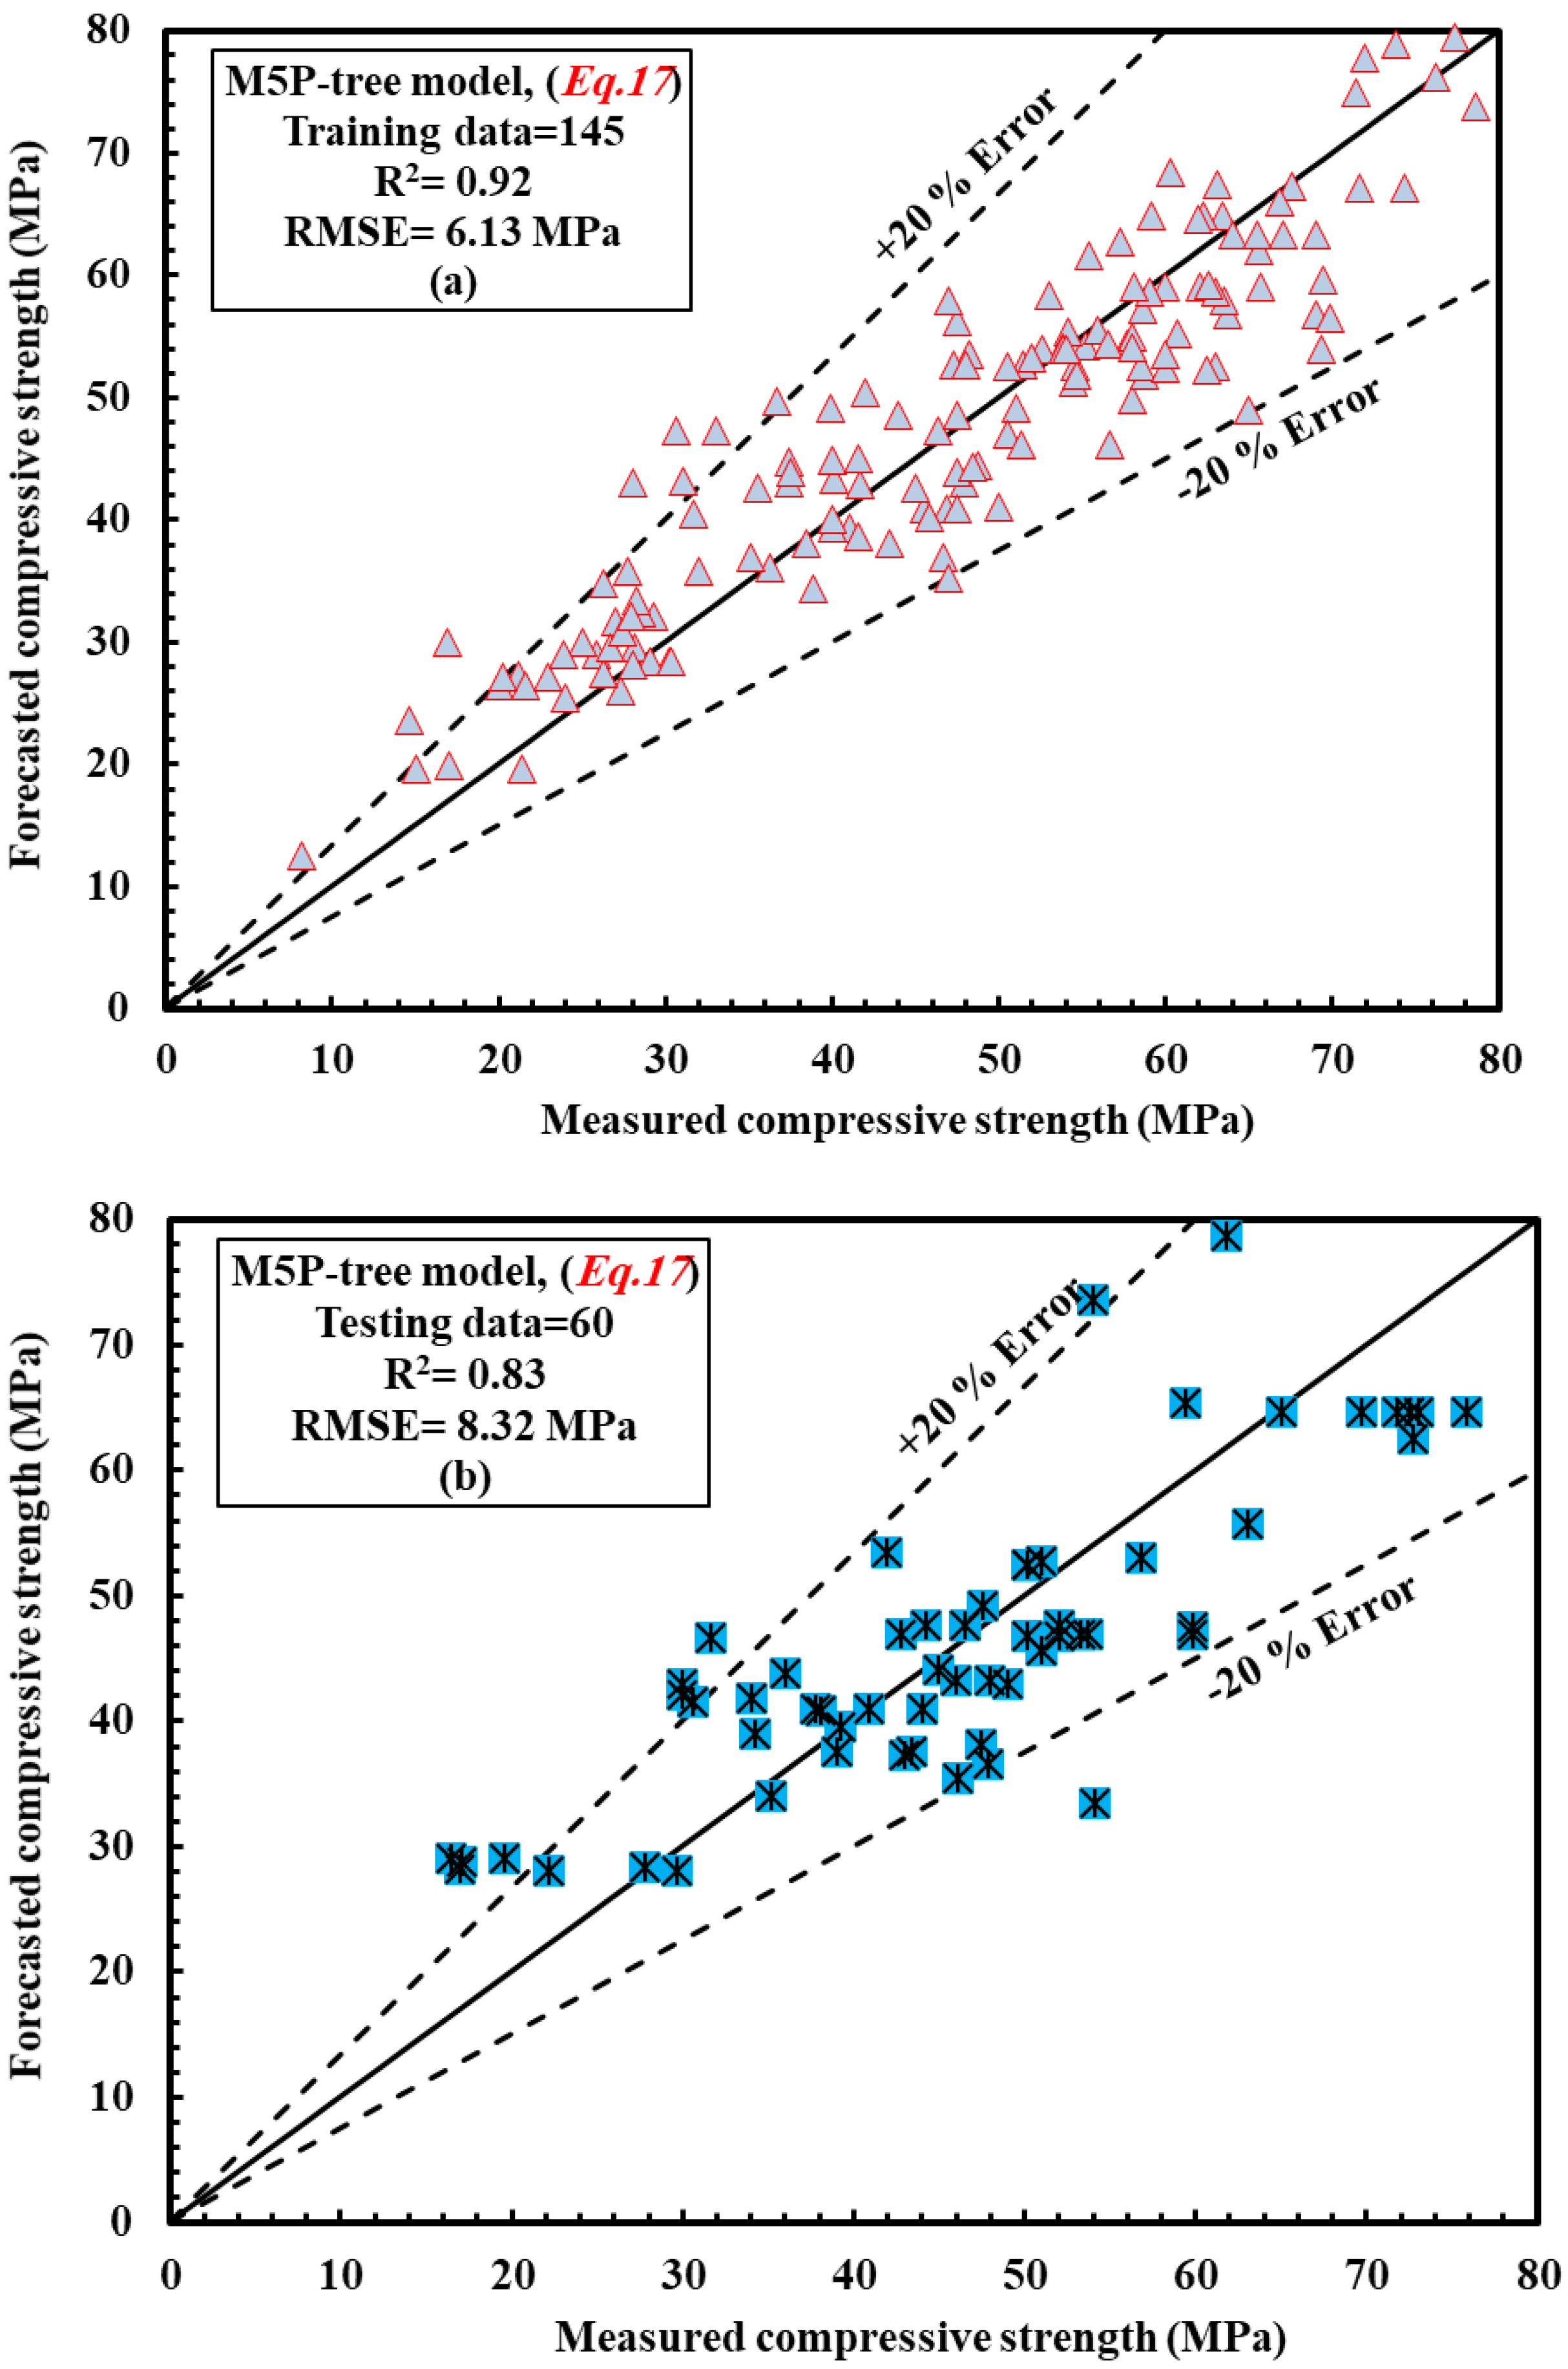
Figure 12a,b demonstrate the predicted and actual CS of the ECC mixes, including fly ash for training and testing datasets. Similar to the previous models, it was revealed that the w/b ratio of ECC mixes, including fly ash, has the greatest influence on the CS of ECCs, which accords with the experimental data provided in Table 1. In addition, the model parameters are described in Table 3, and the model variables will be chosen based on the linear tree registration function.
CS =   α 1 + α 2 ( C ) + α 3 ( FA ) + α 4 ( w b ) + α 5 ( MSS ) + α 6 ( S ) + α 7 ( SP ) + α 8 ( F ) + α 9 ( FL ) + α 10 ( FD ) + α 11 ( T )  
The assessment parameters for this model are 0.92, 6.13 MPa, and 4.87 MPa, respectively. Furthermore, the OBJ and SI values of the current model’s training dataset are 6.46 and 0.13, respectively.

5. Model Comparisons

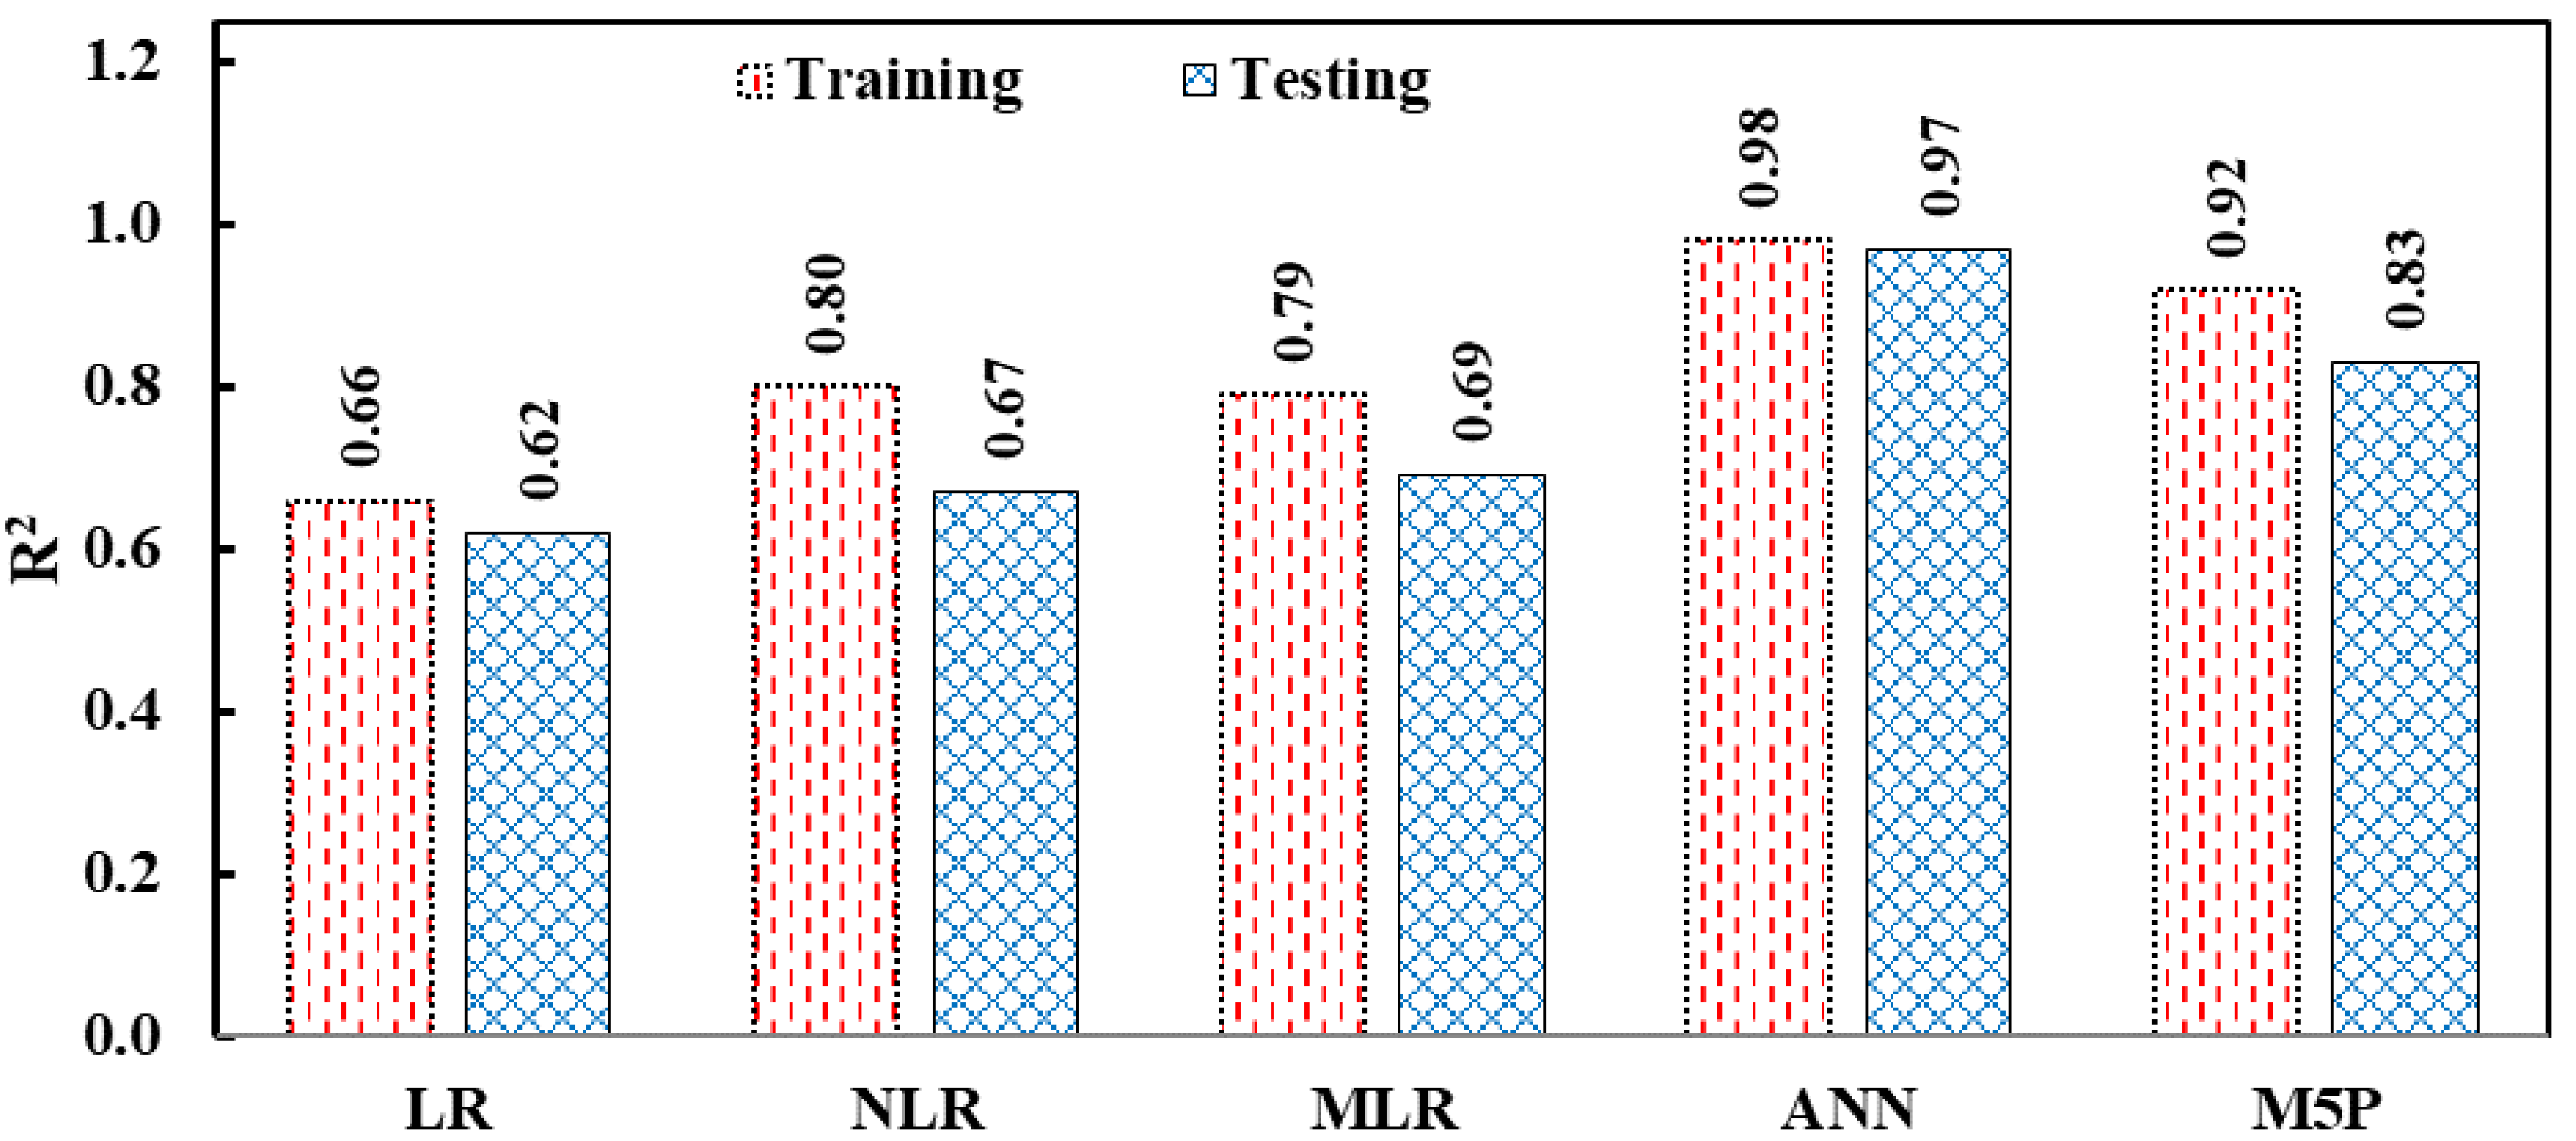
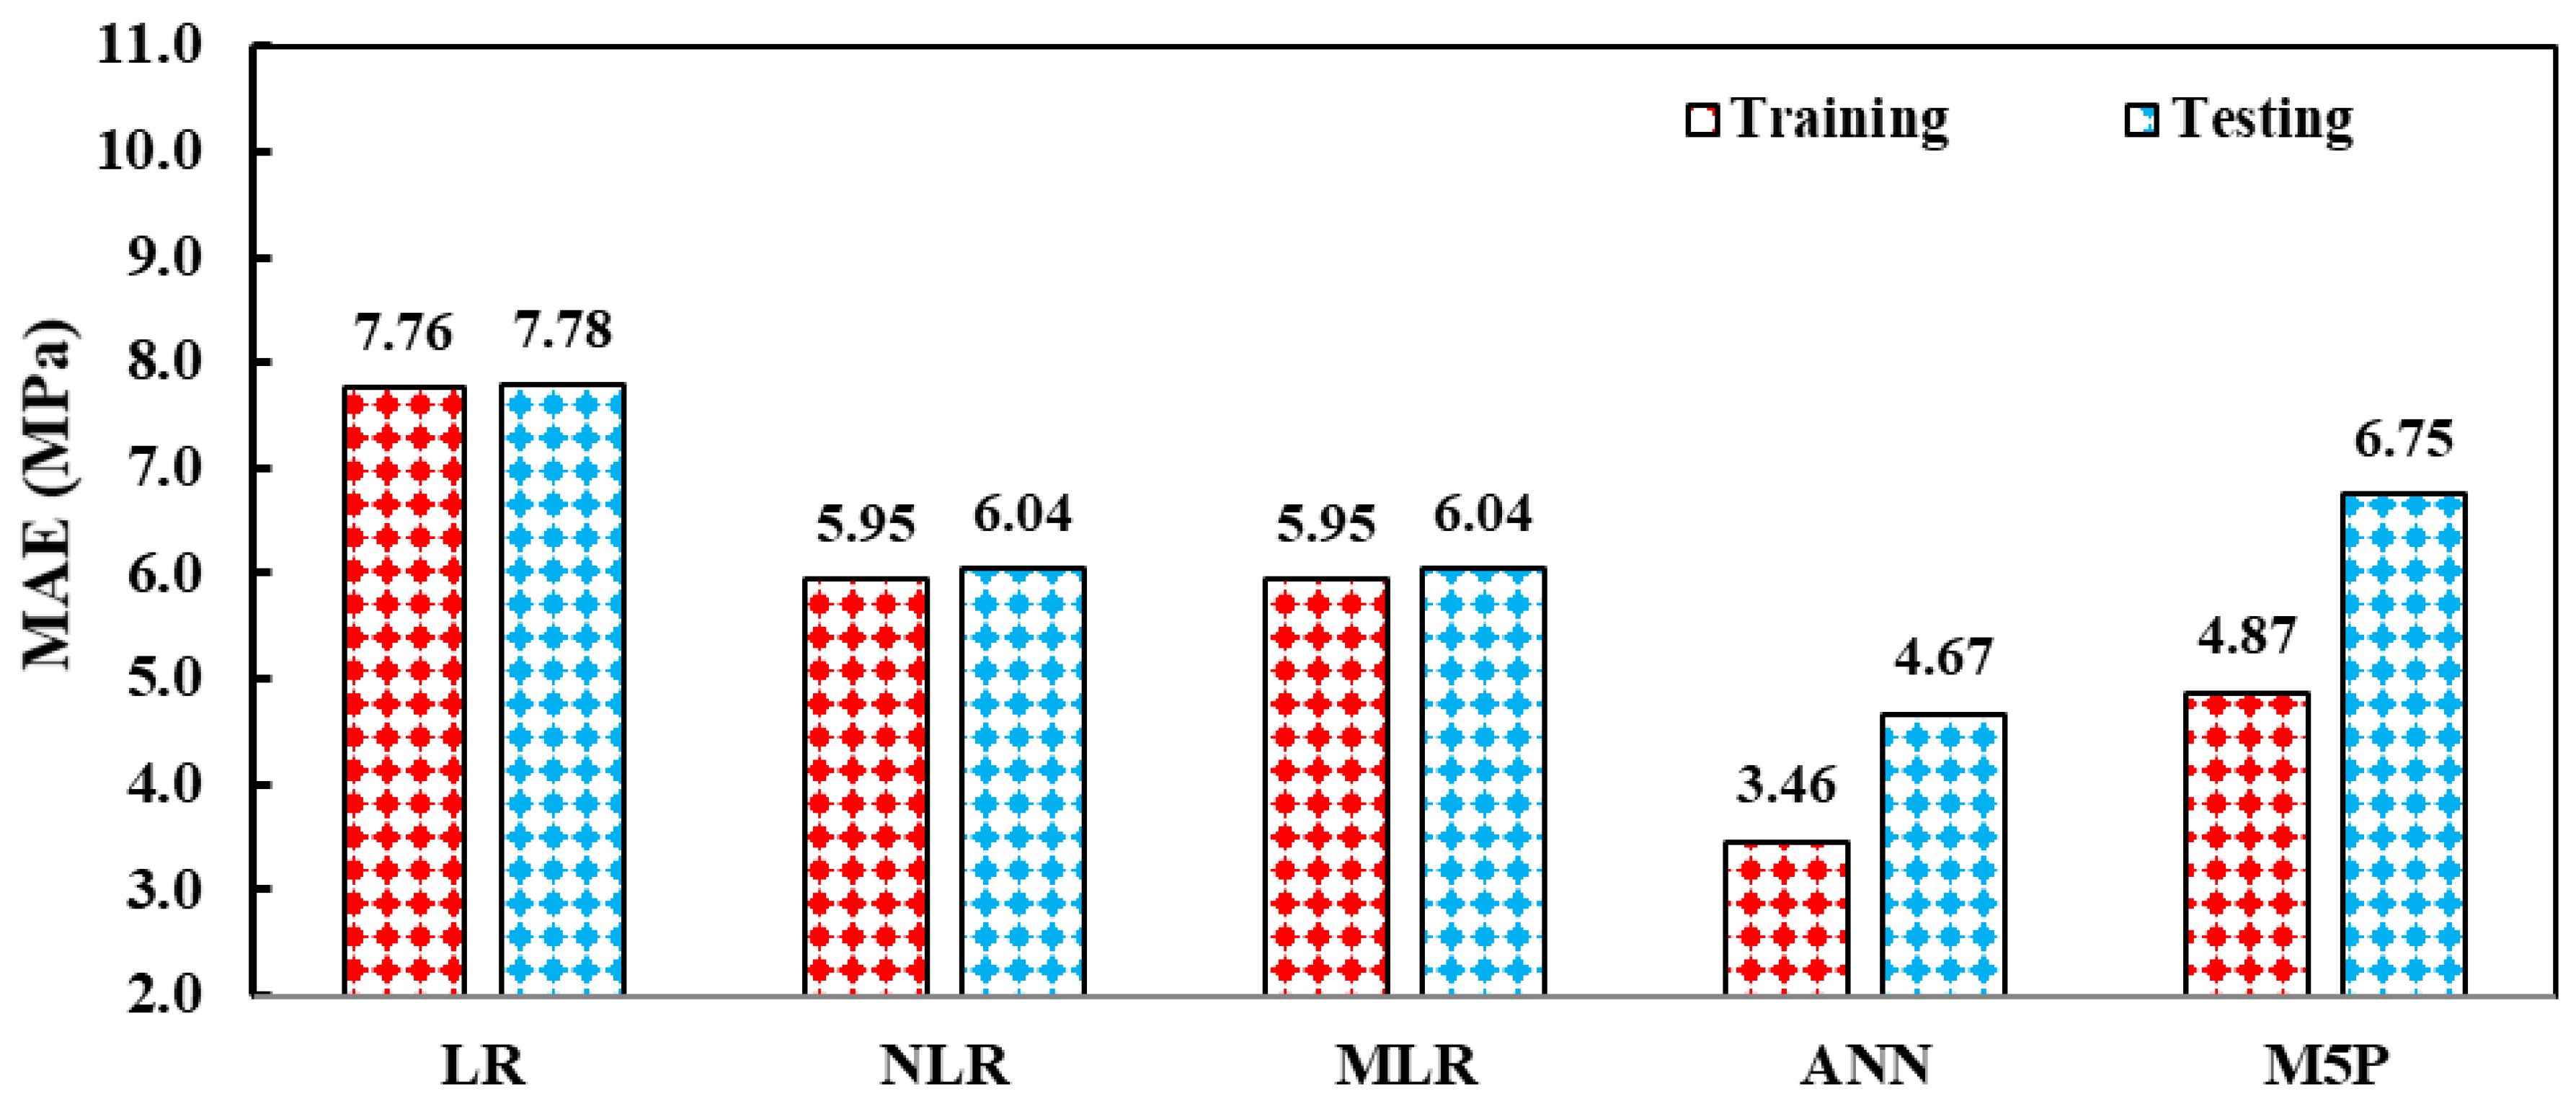
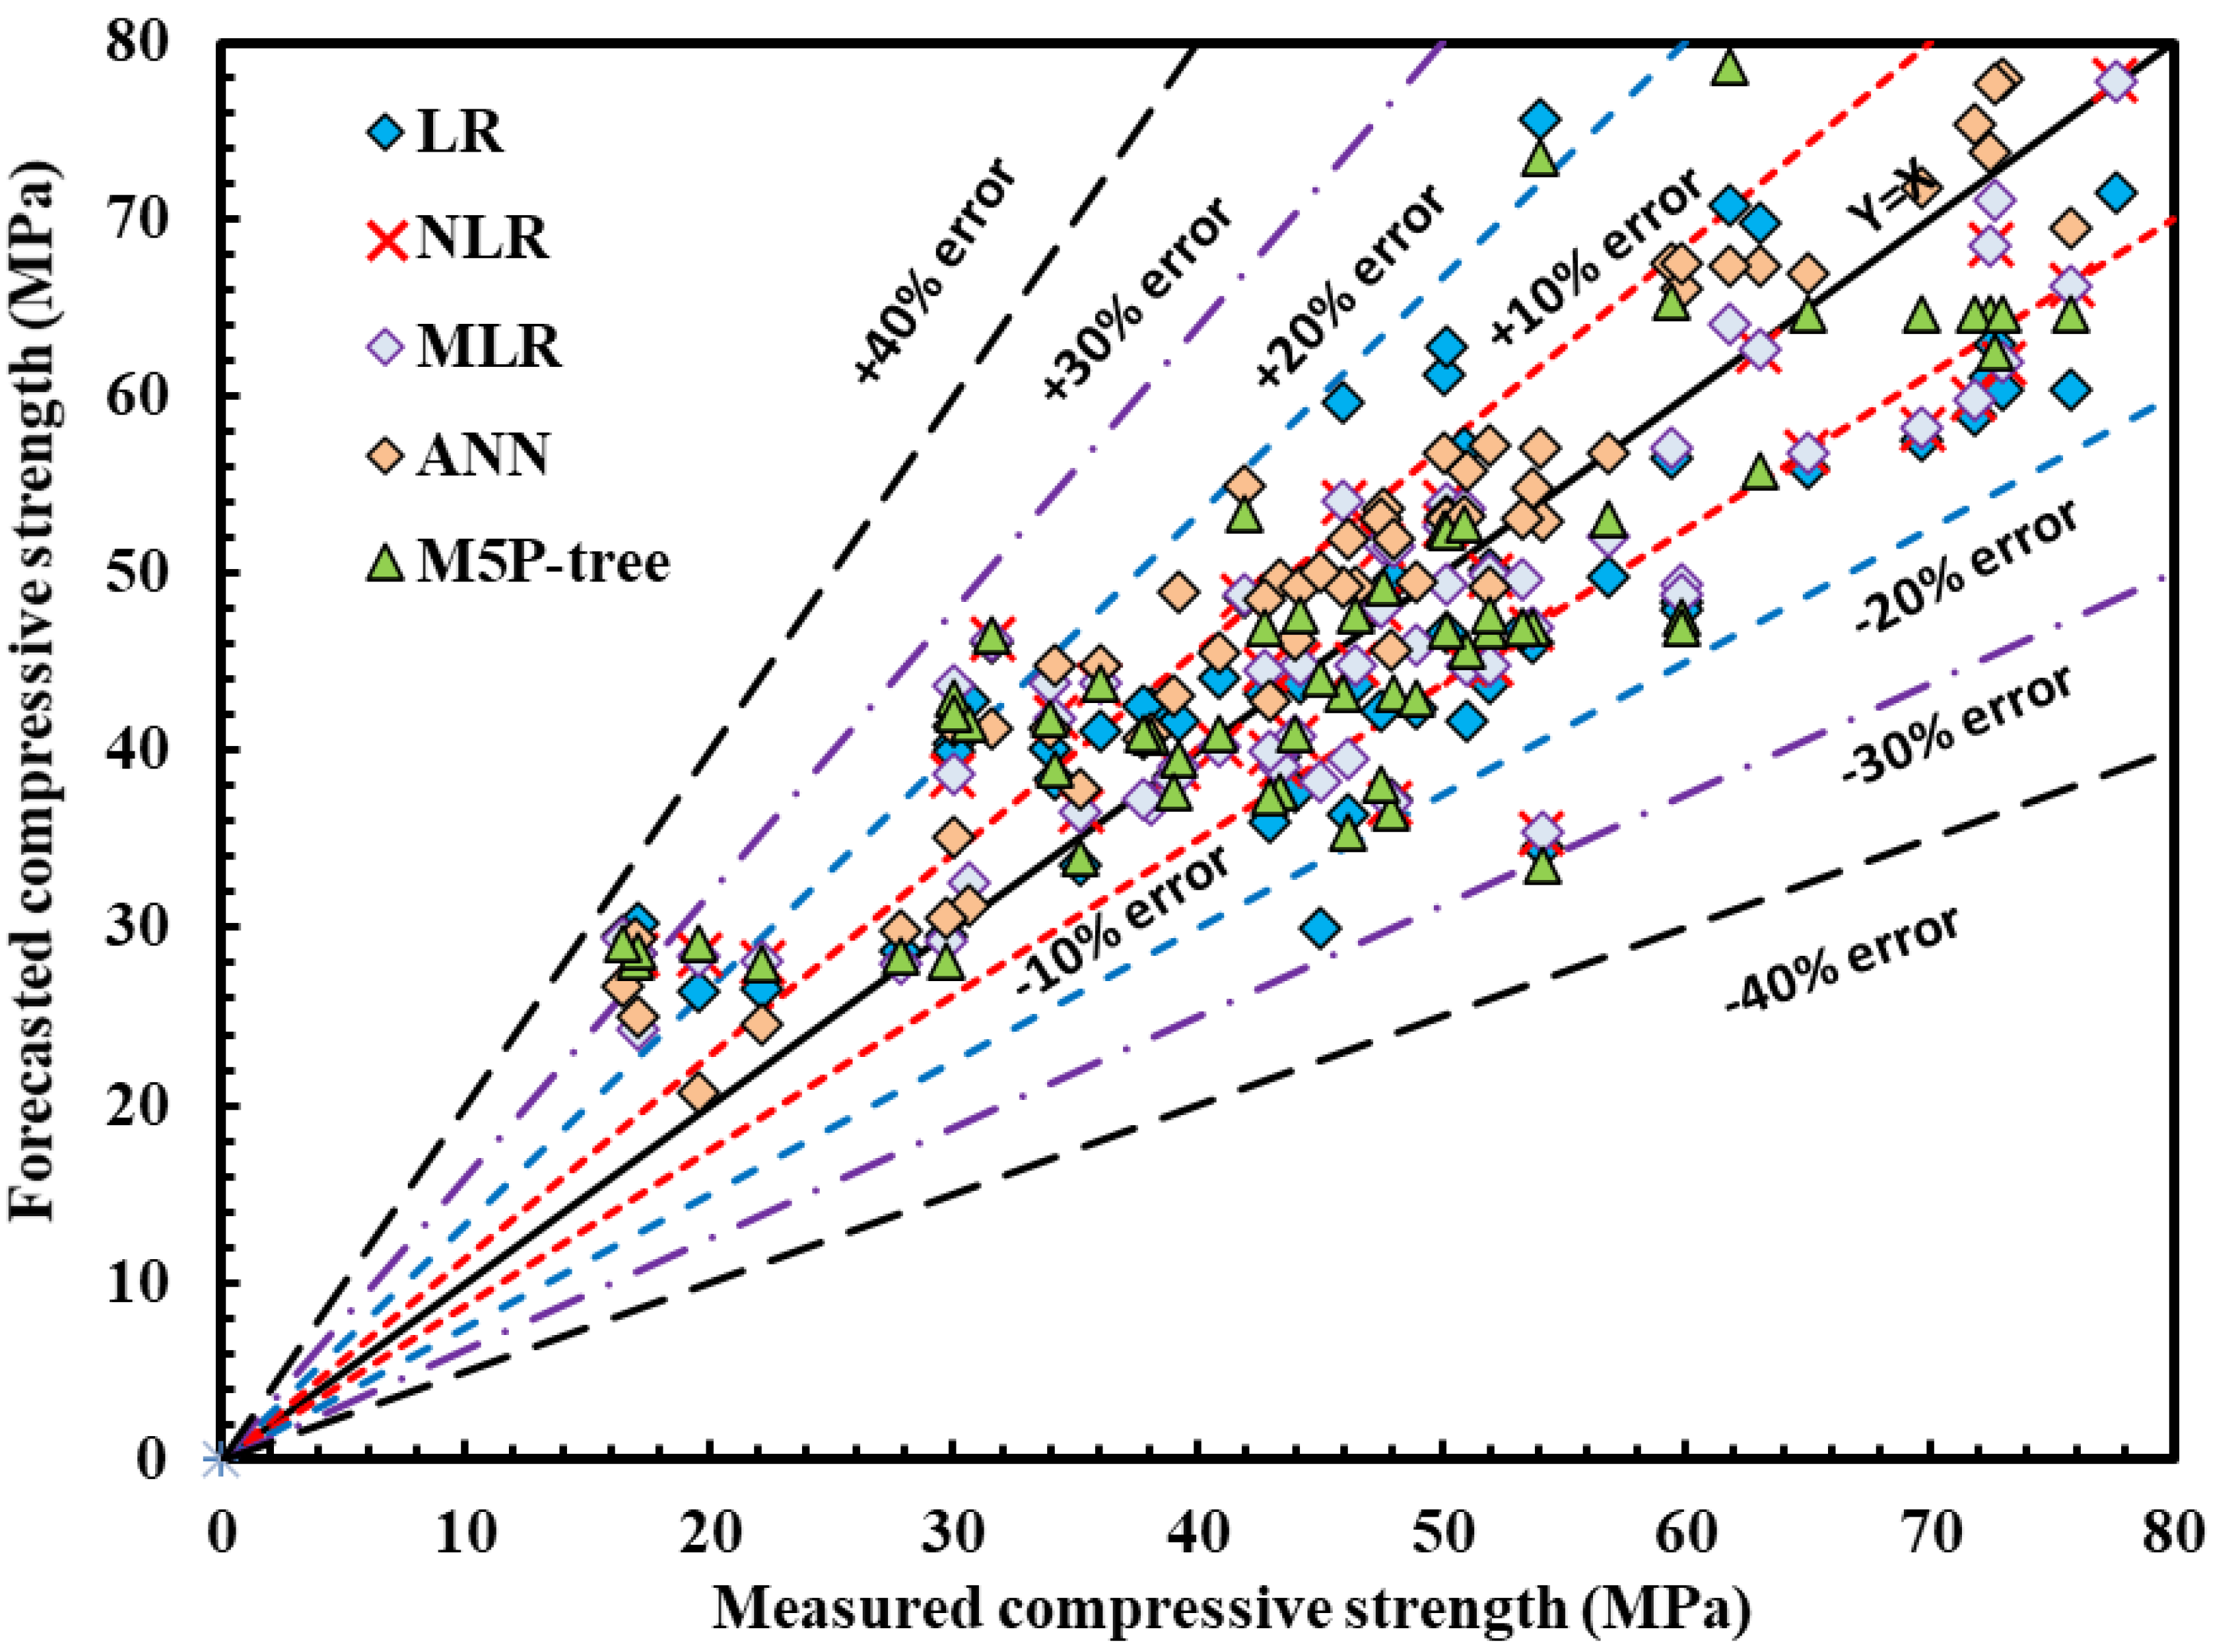
The statistical indicators provided in Section 4 were used to measure the accuracy of each model in predicting the compressive strength of ECC. When compared to the LR, NLR, MLR, and M5P models, the ANN model has a higher R2 and lower RMSE and MAE values, as shown in Figure 13, Figure 14 and Figure 15 for R2 values, RMSE, and MAE, respectively. Figure 16 shows model CS estimates for ECC mixes with fly ash based on testing datasets. The residual error for all models that use training and testing datasets is also shown in Figure 17. The estimated and forecasted CS scores for the ANN model are similar in Figure 16 and Figure 17, suggesting that the ANN model outperforms other models.
Figure 18 shows the OBJ values for all produced models. The LR, NLR, MLR, M5P, and ANN models have respective pressures of 10.34 MPa, 7.74 MPa, 7.76 MPa, 6.46 MPa, and 4.39 MPa. The OBJ value of the ANN model was 76% lower than that of the NLR and MLR models; it was also 135% lower than the LR model and 47% lower than the M5P model. This also demonstrates that the ANN technique is more reliable in predicting the CS of ECC mixes with FA.
Figure 19 displays the SI values for the specified models throughout the training and testing procedures. Figure 19 shows that all phases’ SI values were between 0.1 and 0.2, showing that all models except the ANN model performed well. On the other hand, the ANN model’s SI training dataset values were between 0 and 0.1, suggesting that it performed well. Furthermore, the ANN model has lower SI values than other techniques, much as the other performance criteria. The ANN model has a 100% lower SI value in the training phase than the LR model and a 62.8 percent lower SI value in the testing phase. Furthermore, the ANN model showed lower SI values in all phases than the NLR and MLR models, including 60.4 percent lower in training and 51.20 percent lower in testing. This also showed that the ANN model is more competent and accurate than the LR, NLR, M5P, and MLR models for predicting the CS of ECC mixtures, including FA.
Finally, it is worth mentioning that all the models with acceptable errors can be used for optimizing the ECC ingredients and CS prediction practically to reduce the number of trial baches in the laboratories and to predict the CS without conducting experimental programs. Moreover, the ANN model can give more accurate results among different models.

6. Sensitivity Analysis

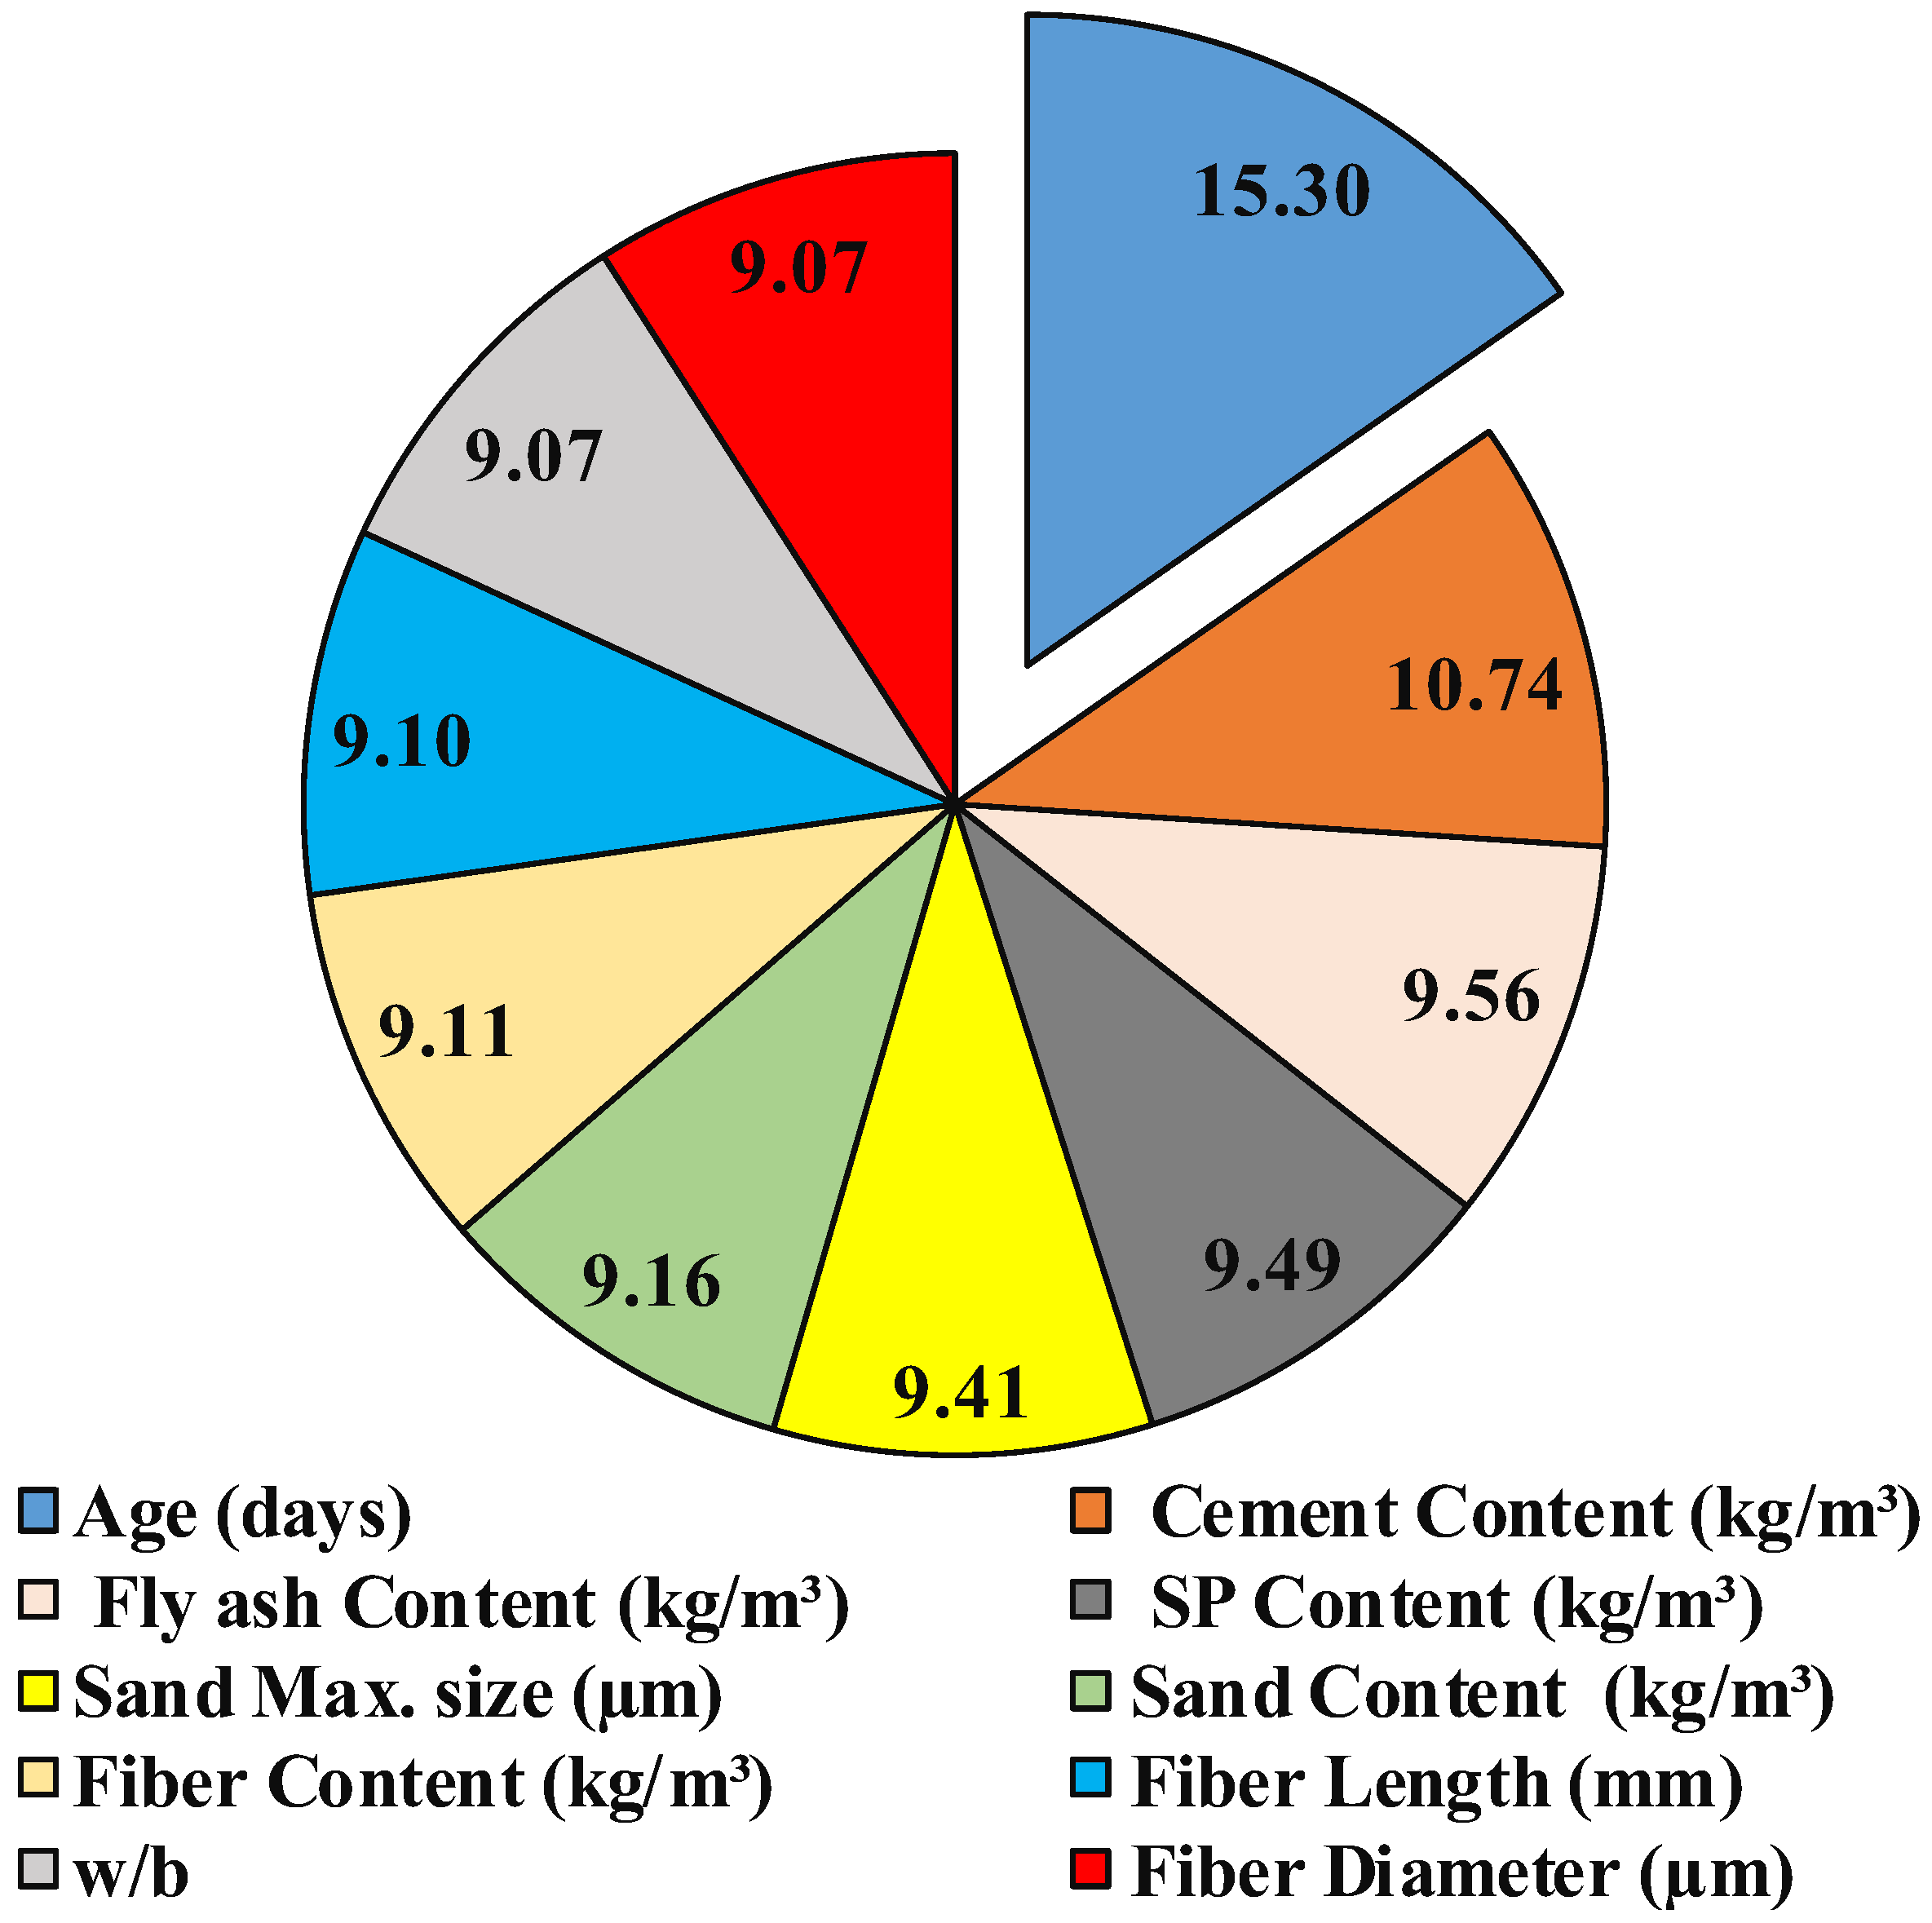
The developed models incorporate a strong ability to predict the compressive strength of ECC, but it is also important to demonstrate how the model’s output varies with the chosen features, which helps to build trust between the predictive model and the user. Sensitivity analysis contributes to a mechanistic understanding of the relationship between the input and output variables and evaluates the most effective input parameters on the output, thus removing insignificant input variables and reducing the complexity and the time required for training the model [29]. Several separate training datasets were employed in the sensitivity analysis, each with a single input variable extracted at a time. The assessment parameters for each training dataset, such as R2, RMSE, and MAE, were established individually. The proportion of model parameter contribution is then computed. The sensitivity assessment result is presented in Figure 20. The results suggest that the most crucial variable for CS prediction is curing time.

7. Conclusions

Precision and accuracy in compressive strength prediction models will save time and money. Based on the investigation and modeling of data generated from previous research to forecast the compressive strength of ECC for 205 various mixed compositions, the following findings were made:
  • The average percentage of FA used in the manufacturing of ECC mixtures was 754.83 kg/m3. In addition, FA replacement with cement ranged from 201 to 1150 kg/m3. The findings from numerous experimental studies had a cure duration ranging from 3 to 180 days;
  • Except the ANN model, the SI values for all models and stages were between 0.1 and 0.2, indicating that all models performed well. The SI values for the ANN model ranged from 0 to 0.1, indicating that it performed well;
  • The ANN model’s OBJ value is 76 percent lower than the NLR and MLR models’, 135 percent lower than the LR model and 47 percent lower than the M5P model. This also demonstrates that the ANN model is more accurate and capable of estimating the CS of ECC mixtures, including FA, than the traditional approach;
  • Overall, the data and analyses revealed that particular amounts of FA might be used successfully in ECC manufacturing. Furthermore, the models created in this work, particularly the ANN model, may be utilized to easily predict the mix proportions and CS of ECCs, lowering the number of experimental tests and trial batches in the laboratory.

Author Contributions

Conceptualization, R.K.; Investigation, A.S.M., W.S.Q. and A.A.A.; Methodology, K.G. and W.M.; Resources, W.S.Q.; Validation, R.K.; Writing—original draft, H.U.A.; Writing—review & editing, R.H.F. and A.A.A. All authors have read and agreed to the published version of the manuscript.

Funding

This research received no external funding.

Conflicts of Interest

The authors declare no conflict of interest.

References

  1. Shah, S.P.; Swartz, S.E.; Ouyang, C. Fracture Mechanics of Concrete: Applications of Fracture Mechanics to Concrete, Rock and Other Quasi-Brittle Materials; John Wiley & Sons: Hoboken, NJ, USA, 1995. [Google Scholar]
  2. Li, V.C.C. Postcrack scaling relations for fiber reinforced cementitious composites. J. Mater. Civ. Eng. 1992, 4, 41–57. [Google Scholar] [CrossRef]
  3. Li, V.C.; Leung, C.K. Steady-state and multiple cracking of short random fiber composites. J. Eng. Mech. 1992, 118, 2246–2264. [Google Scholar] [CrossRef] [Green Version]
  4. Li, V.C.; Wu, H.C. Conditions for pseudo strain-hardening in fiber reinforced brittle matrix composites. Appl. Mech. Rev. 1992, 45, 390–398. [Google Scholar] [CrossRef] [Green Version]
  5. Li, V.C.; Wang, S.; Wu, C. Tensile strain-hardening behavior of polyvinyl alcohol engineered cementitious composite (PVA-ECC). Mater. J. 2001, 98, 483–492. [Google Scholar]
  6. Lim, Y.M.; Li, V.C. Durable repair of aged infrastructures using trapping mechanism of engineered cementitious composites. Cem. Concr. Compos. 1997, 19, 373–385. [Google Scholar] [CrossRef]
  7. Şahmaran, M.; Al-Emam, M.; Yıldırım, G.; Şimşek, Y.E.; Erdem, T.K.; Lachemi, M. High-early-strength ductile cementitious composites with characteristics of low early-age shrinkage for repair of infrastructures. Mater. Struct. 2015, 48, 1389–1403. [Google Scholar] [CrossRef] [Green Version]
  8. Maalej, M.; Quek, S.T.; Ahmed, S.F.U.; Zhang, J.; Lin, V.W.J.; Leong, K.S. Review of potential structural applications of hybrid fiber Engineered Cementitious Composites. Constr. Build. Mater. 2012, 36, 216–227. [Google Scholar] [CrossRef]
  9. Qudah, S.; Maalej, M. Application of Engineered Cementitious Composites (ECC) in interior beam–column connections for enhanced seismic resistance. Eng. Struct. 2014, 69, 235–245. [Google Scholar] [CrossRef]
  10. Pan, Z.; Wu, C.; Liu, J.; Wang, W.; Liu, J. Study on mechanical properties of cost-effective polyvinyl alcohol engineered cementitious composites (PVA-ECC). Constr. Build. Mater. 2015, 78, 397–404. [Google Scholar] [CrossRef]
  11. Yang, E.H.; Li, V.C. Strain-hardening fiber cement optimization and component tailoring by means of a micromechanical model. Constr. Build. Mater. 2010, 24, 130–139. [Google Scholar] [CrossRef]
  12. Madhavi, K.B.; Venugopal, M.; Rajesh, V.; Suresh, K. Experimental study on bendable concrete. Int. J. Eng. Res. Tech. 2016, 5, 501–550. [Google Scholar]
  13. Neville, A.M.; Brooks, J.J. Concrete Technology; Longman Scientific & Technical: London, UK, 1987; pp. 242–246. [Google Scholar]
  14. Neville, A.M. Properties of Concrete; Longman: London, UK, 1995. [Google Scholar]
  15. Yu, J.; Leung, C.K. Strength improvement of strain-hardening cementitious composites with ultrahigh-volume fly ash. J. Mater. Civ. Eng. 2017, 29, 05017003. [Google Scholar] [CrossRef]
  16. Kan, L.L.; Shi, R.X.; Zhu, J. Effect of fineness and calcium content of fly ash on the mechanical properties of Engineered Cementitious Composites (ECC). Constr. Build. Mater. 2019, 209, 476–484. [Google Scholar] [CrossRef]
  17. Yu, K.; Yu, J.; Lu, Z. Mechanical characteristics of ultra high performance strain hardening cementitious composites. In International Conference on Strain-Hardening Cement-Based Composites; Springer: Berlin/Heidelberg, Germany, 2017; pp. 230–237. [Google Scholar] [CrossRef]
  18. Faraj, R.H.; Mohammed, A.A.; Mohammed, A.; Omer, K.M.; Ahmed, H.U. Systematic multiscale models to predict the compressive strength of self-compacting concretes modified with nanosilica at different curing ages. Eng. Comput. 2021, 38, 2365–2388. [Google Scholar] [CrossRef]
  19. Aggarwal, S.; Bhargava, G.; Sihag, P. Prediction of Compressive Strength of SCC-Containing Metakaolin and Rice Husk Ash Using Machine Learning Algorithms. In Computational Technologies in Materials Science; CRC Press: Boca Raton, FL, USA, 2021; pp. 193–205. [Google Scholar]
  20. Gao, W.; Karbasi, M.; Derakhsh, A.M.; Jalili, A. Development of a novel soft-computing framework for the simulation aims: A case study. Eng. Comput. 2019, 35, 315–322. [Google Scholar] [CrossRef]
  21. Almohammed, F.; Sihag, P.; Sammen, S.S.; Ostrowski, K.A.; Singh, K.; Prasad, C.V.S.R.; Zajdel, P. Assessment of Soft Computing Techniques for the Prediction of Compressive Strength of Bacterial Concrete. Materials 2022, 15, 489. [Google Scholar] [CrossRef]
  22. Almasabha, G.; Alshboul, O.; Shehadeh, A.; Almuflih, A.S. Machine Learning Algorithm for Shear Strength Prediction of Short Links for Steel Buildings. Buildings 2022, 12, 775. [Google Scholar] [CrossRef]
  23. Alshboul, O.; Almasabha, G.; Shehadeh, A.; Al Hattamleh, O.; Almuflih, A.S. Optimization of the Structural Performance of Buried Reinforced Concrete Pipelines in Cohesionless Soils. Materials 2022, 15, 4051. [Google Scholar] [CrossRef]
  24. Kooh, M.R.R.; Thotagamuge, R.; Chau, Y.F.C.; Mahadi, A.H.; Lim, C.M. Machine learning approaches to predict adsorption capacity of Azolla pinnata in the removal of methylene blue. J. Taiwan Inst. Chem. Eng. 2022, 132, 104134. [Google Scholar] [CrossRef]
  25. Amlashi, A.T.; Abdollahi, S.M.; Goodarzi, S.; Ghanizadeh, A.R. Soft computing based formulations for slump, compressive strength, and elastic modulus of bentonite plastic concrete. J. Clean. Prod. 2019, 230, 1197–1216. [Google Scholar] [CrossRef]
  26. Feng, D.C.; Wang, W.J.; Mangalathu, S.; Hu, G.; Wu, T. Implementing ensemble learning methods to predict the shear strength of RC deep beams with/without web reinforcements. Eng. Struct. 2021, 235, 111979. [Google Scholar] [CrossRef]
  27. Bilir, T.; Gencel, O.; Topcu, I.B. Prediction of restrained shrinkage crack widths of slag mortar composites by Takagi and Sugeno ANFIS models. Neural Comput. Appl. 2016, 27, 2523–2536. [Google Scholar] [CrossRef]
  28. Behnood, A.; Daneshvar, D. A machine learning study of the dynamic modulus of asphalt concretes: An application of M5P model tree algorithm. Constr. Build. Mater. 2020, 262, 120544. [Google Scholar] [CrossRef]
  29. Ahmed, H.U.; Mohammed, A.S.; Mohammed, A.A.; Faraj, R.H. Systematic multiscale models to predict the compressive strength of fly ash-based geopolymer concrete at various mixture proportions and curing regimes. PLoS ONE 2021, 16, e0253006. [Google Scholar] [CrossRef] [PubMed]
  30. Ahmed, H.U.; Mohammed, A.S.; Faraj, R.H.; Qaidi, S.M.; Mohammed, A.A. Compressive strength of geopolymer concrete modified with nano-silica: Experimental and modeling investigations. Case Stud. Constr. Mater. 2022, 16, e01036. [Google Scholar] [CrossRef]
  31. Alaloul, W.S.; Musarat, M.A.; Haruna, S.; Tayeh, B.A.; Norizan, M.N.B. Chemical attack on concrete containing a high volume of crumb rubber as a partial replacement for fine aggregate in engineered cementitious composite (ECC). Can. J. Civ. Eng. 2022, 49, 11–17. [Google Scholar] [CrossRef]
  32. Uddin, M.N.; Li, L.Z.; Ahmed, A.; Almajhali, K.Y.M. Prediction of PVA fiber effect in Engineered Composite cement (ECC) by Artificial neural Network (ANN). Mater. Today Proc. 2022, 65, 537–542. [Google Scholar] [CrossRef]
  33. Qadir, W.; Ghafor, K.; Mohammed, A. Characterizing and modeling the mechanical properties of the cement mortar modified with fly ash for various water-to-cement ratios and curing times. Adv. Civ. Eng. 2019, 2019, 7013908. [Google Scholar] [CrossRef] [Green Version]
  34. Da Costa, F.B.P.; Righi, D.P.; Graeff, A.G.; Da Silva Filho, L.C.P. Experimental study of some durability properties of ECC with a more environmentally sustainable rice husk ash and high tenacity polypropylene fibers. Constr. Build. Mater. 2019, 213, 505–513. [Google Scholar] [CrossRef]
  35. Felekoglu, B.; Tosun-Felekoglu, K.; Ranade, R.; Zhang, Q.; Li, V.C. Influence of matrix flowability, fiber mixing procedure, and curing conditions on the mechanical performance of HTPP-ECC. Compos. Part B Eng. 2014, 60, 359–370. [Google Scholar] [CrossRef]
  36. Sahmaran, M.; Yildirim, G.; Erdem, T.K. Self-healing capability of cementitious composites incorporating different supplementary cementitious materials. Cem. Concr. Compos. 2013, 35, 89–101. [Google Scholar] [CrossRef]
  37. Huang, X.; Ranade, R.; Ni, W.; Li, V.C. Development of green engineered cementitious composites using iron ore tailings as aggregates. Constr. Build. Mater. 2013, 44, 757–764. [Google Scholar] [CrossRef]
  38. Ma, H.; Qian, S.; Zhang, Z.; Lin, Z.; Li, V.C. Tailoring engineered cementitious composites with local ingredients. Constr. Build. Mater. 2015, 101, 584–595. [Google Scholar] [CrossRef]
  39. Meng, D.; Huang, T.; Zhang, Y.X.; Lee, C.K. Mechanical behaviour of a polyvinyl alcohol fibre reinforced engineered cementitious composite (PVA-ECC) using local ingredients. Constr. Build. Mater. 2017, 141, 259–270. [Google Scholar] [CrossRef]
  40. Soe, K.T.; Zhang, Y.X.; Zhang, L.C. Material properties of a new hybrid fibre-reinforced engineered cementitious composite. Constr. Build. Mater. 2013, 43, 399–407. [Google Scholar] [CrossRef]
  41. Yu, J.; Lin, J.; Zhang, Z.; Li, V.C. Mechanical performance of ECC with high-volume fly ash after sub-elevated temperatures. Constr. Build. Mater. 2015, 99, 82–89. [Google Scholar] [CrossRef]
  42. Zhang, Z.; Qian, S.; Ma, H. Investigating mechanical properties and self-healing behavior of micro-cracked ECC with different volume of fly ash. Constr. Build. Mater. 2014, 52, 17–23. [Google Scholar] [CrossRef]
  43. Yildirim, G.; Sahmaran, M.; Ahmed, H.U. Influence of hydrated lime addition on the self-healing capability of high-volume fly ash incorporated cementitious composites. J. Mater. Civ. Eng. 2015, 27, 04014187. [Google Scholar] [CrossRef]
  44. Abid, S.R.; Hilo, A.N.; Daek, Y.H.; Ayoob, N.S. Mechanical properties of ECC incorporating low-cost PVA fibers. In Applied Mechanics and Materials; Trans Tech Publications Ltd.: Bäch, Switzerland, 2020; Volume 897, pp. 78–84. [Google Scholar] [CrossRef]
  45. Li, L.Z.; Bai, Y.; Yu, K.Q.; Yu, J.T.; Lu, Z.D. Reinforced high-strength engineered cementitious composite (ECC) columns under eccentric compression: Experiment and theoretical model. Eng. Struct. 2019, 198, 109541. [Google Scholar] [CrossRef]
  46. Liu, H.; Zhang, Q.; Gu, C.; Su, H.; Li, V.C. Influence of micro-cracking on the permeability of engineered cementitious composites. Cem. Concr. Compos. 2016, 72, 104–113. [Google Scholar] [CrossRef]
  47. Liu, H.; Zhang, Q.; Li, V.; Su, H.; Gu, C. Durability study on engineered cementitious composites (ECC) under sulfate and chloride environment. Constr. Build. Mater. 2017, 133, 171–181. [Google Scholar] [CrossRef]
  48. Sahmaran, M.; Yücel, H.E.; Demirhan, S.; Arýk, M.T.; Li, V.C. Combined effect of aggregate and mineral admixtures on tensile ductility of engineered cementitious composites. ACI Mater. J. 2012, 109, 627. [Google Scholar]
  49. Said, S.H.; Razak, H.A.; Othman, I. Flexural behavior of engineered cementitious composite (ECC) slabs with polyvinyl alcohol fibers. Constr. Build. Mater. 2015, 75, 176–188. [Google Scholar] [CrossRef] [Green Version]
  50. Meng, D.; Lee, C.K.; Zhang, Y.X. Flexural and shear behaviours of plain and reinforced polyvinyl alcohol-engineered cementitious composite beams. Eng. Struct. 2017, 151, 261–272. [Google Scholar] [CrossRef]
  51. Lepech, M.D.; Li, V.C. Water permeability of engineered cementitious composites. Cem. Concr. Compos. 2009, 31, 744–753. [Google Scholar] [CrossRef]
  52. Qian, S.; Zhou, J.; De Rooij, M.R.; Schlangen, E.; Ye, G.; Van Breugel, K. Self-healing behavior of strain hardening cementitious composites incorporating local waste materials. Cem. Concr. Compos. 2009, 31, 613–621. [Google Scholar] [CrossRef]
  53. Qian, S.Z.; Zhou, J.; Schlangen, E. Influence of curing condition and precracking time on the self-healing behavior of engineered cementitious composites. Cem. Concr. Compos. 2010, 32, 686–693. [Google Scholar] [CrossRef]
  54. Şahmaran, M.; Li, V.C. Durability of mechanically loaded engineered cementitious composites under highly alkaline environments. Cem. Concr. Compos. 2008, 30, 72–81. [Google Scholar] [CrossRef]
  55. Şahmaran, M.; Li, V.C. Influence of microcracking on water absorption and sorptivity of ECC. Mater. Struct. 2009, 42, 593–603. [Google Scholar] [CrossRef]
  56. Şahmaran, M.; Li, V.C. De-icing salt scaling resistance of mechanically loaded engineered cementitious composites. Cem. Concr. Res. 2007, 37, 1035–1046. [Google Scholar] [CrossRef]
  57. Şahmaran, M.; Li, V.C. Durability properties of micro-cracked ECC containing high volumes fly ash. Cem. Concr. Res. 2009, 39, 1033–1043. [Google Scholar] [CrossRef]
  58. Sahmaran, M.; Li, M.; Li, V.C. Transport properties of engineered cementitious composites under chloride exposure. ACI Mater. J. 2007, 104, 604–611. [Google Scholar]
  59. Şahmaran, M.; Lachemi, M.; Hossain, K.M.; Li, V.C. Internal curing of engineered cementitious composites for prevention of early age autogenous shrinkage cracking. Cem. Concr. Res. 2009, 39, 893–901. [Google Scholar] [CrossRef]
  60. Şahmaran, M.; Özbay, E.; Yücel, H.E.; Lachemi, M.; Li, V.C. Frost resistance and microstructure of Engineered Cementitious Composites: Influence of fly ash and micro poly-vinyl-alcohol fiber. Cem. Concr. Compos. 2012, 34, 156–165. [Google Scholar] [CrossRef]
  61. Yang, E.H.; Yang, Y.; Li, V.C. Use of high volumes of fly ash to improve ECC mechanical properties and material greenness. ACI Mater. J. 2007, 104, 620. [Google Scholar]
  62. Yao, Y.; Zhu, Y.; Yang, Y. Incorporation superabsorbent polymer (SAP) particles as controlling pre-existing flaws to improve the performance of engineered cementitious composites (ECC). Constr. Build. Mater. 2012, 28, 139–145. [Google Scholar] [CrossRef]
  63. Gao, S.; Zhao, X.; Qiao, J.; Guo, Y.; Hu, G. Study on the bonding properties of Engineered Cementitious Composites (ECC) and existing concrete exposed to high temperature. Constr. Build. Mater. 2019, 196, 330–344. [Google Scholar] [CrossRef]
  64. Gencturk, B.; Hosseini, F. Evaluation of reinforced concrete and reinforced engineered cementitious composite (ECC) members and structures using small-scale testing. Can. J. Civ. Eng. 2015, 42, 164–177. [Google Scholar] [CrossRef]
  65. Guan, X.; Li, Y.; Liu, T.; Zhang, C.; Li, H.; Ou, J. An economical ultra-high ductile engineered cementitious composite with large amount of coarse river sand. Constr. Build. Mater. 2019, 201, 461–472. [Google Scholar] [CrossRef]
  66. Gulsan, M.E.; Mohammedameen, A.; Sahmaran, M.; Nis, A.; Alzeebaree, R.; Cevik, A. Effects of sulphuric acid on mechanical and durability properties of ECC confined by FRP fabrics. Adv. Concr. Constr. 2018, 6, 199. [Google Scholar] [CrossRef]
  67. Hu, S.; Cai, H.; Hong, R.; Li, M.; Yao, F. Performance test and microstructure of modified PVC aggregate-hybrid fiber reinforced engineering cementitious composite (ECC). Materials 2021, 14, 1856. [Google Scholar] [CrossRef]
  68. Zain, M.F.M.; Abd, S.M. Multiple regression model for compressive strength prediction of high: Performance concrete. J. Appl. Sci. 2009, 9, 155–160. [Google Scholar] [CrossRef]
  69. Demircan, E.; Harendra, S.; Vipulanandan, C. Artificial neural network and nonlinear models for gelling time and maximum curing temperature rise in polymer grouts. J. Mater. Civ. Eng. 2011, 23, 372–377. [Google Scholar] [CrossRef]
  70. Sarwar, W.; Ghafor, K.; Mohammed, A. Modeling the rheological properties with shear stress limit and compressive strength of ordinary Portland cement modified with polymers. J. Build. Pathol. Rehabil. 2019, 4, 25. [Google Scholar] [CrossRef]
  71. Ahmed, H.U.; Abdalla, A.A.; Mohammed, A.S.; Mohammed, A.A.; Mosavi, A. Statistical Methods for Modeling the Compressive Strength of Geopolymer Mortar. Materials 2022, 15, 1868. [Google Scholar] [CrossRef] [PubMed]
  72. Faraj, R.H.; Ahmed, H.U.; Rafiq, S.; Sor, N.H.; Ibrahim, D.F.; Qaidi, S.M. Performance of Self-Compacting Mortars Modified with Nanoparticles: A Systematic Review and Modeling. Clean. Mater. 2022, 4, 100086. [Google Scholar] [CrossRef]
  73. Hall, M.; Frank, E.; Holmes, G.; Pfahringer, B.; Reutemann, P.; Witten, I.H. The WEKA data mining software: An update. ACM SIGKDD Explor. Newsl. 2009, 11, 10–18. [Google Scholar] [CrossRef]
  74. Faraj, R.H.; Mohammed, A.A.; Omer, K.M.; Ahmed, H.U. Soft computing techniques to predict the compressive strength of green self-compacting concrete incorporating recycled plastic aggregates and industrial waste ashes. Clean. Technol. Environ. Policy 2022, 24, 2253–2281. [Google Scholar] [CrossRef]
  75. Ahmed, H.U.; Mohammed, A.S.; Mohammed, A.A. Multivariable models including artificial neural network and M5P-tree to forecast the stress at the failure of alkali-activated concrete at ambient curing condition and various mixture proportions. Neural Comput. Appl. 2022, 34, 17853–17876. [Google Scholar] [CrossRef]
  76. Ahmed, H.U.; Mohammed, A.A.; Mohammed, A. Soft computing models to predict the compressive strength of GGBS/FA-geopolymer concrete. PLoS ONE 2022, 17, e0265846. [Google Scholar] [CrossRef] [PubMed]
  77. Quinlan, J.R. Learning with continuous classes. In Proceedings of the 5th Australian Joint Conference on Artificial Intelligence, Hobart, Tasmania, 16–18 November 1992; Volume 92, pp. 343–348. [Google Scholar]
  78. Malerba, D.; Esposito, F.; Ceci, M.; Appice, A. Top-down induction of model trees with regression and splitting nodes. IEEE Trans. Pattern Anal. Mach. Intell. 2004, 26, 612–625. [Google Scholar] [CrossRef] [PubMed] [Green Version]
  79. Li, M.F.; Tang, X.P.; Wu, W.; Liu, H.B. General models for estimating daily global solar radiation for different solar radiation zones in mainland China. Energy Convers. Manag. 2013, 70, 139–148. [Google Scholar] [CrossRef]
  80. Ahmed, H.U.; Mohammed, A.S.; Mohammed, A.A. Proposing several model techniques including ANN and M5P-tree to predict the compressive strength of geopolymer concretes incorporated with nano-silica. Environ. Sci. Pollut. Res. 2022, 1–25. [Google Scholar] [CrossRef] [PubMed]
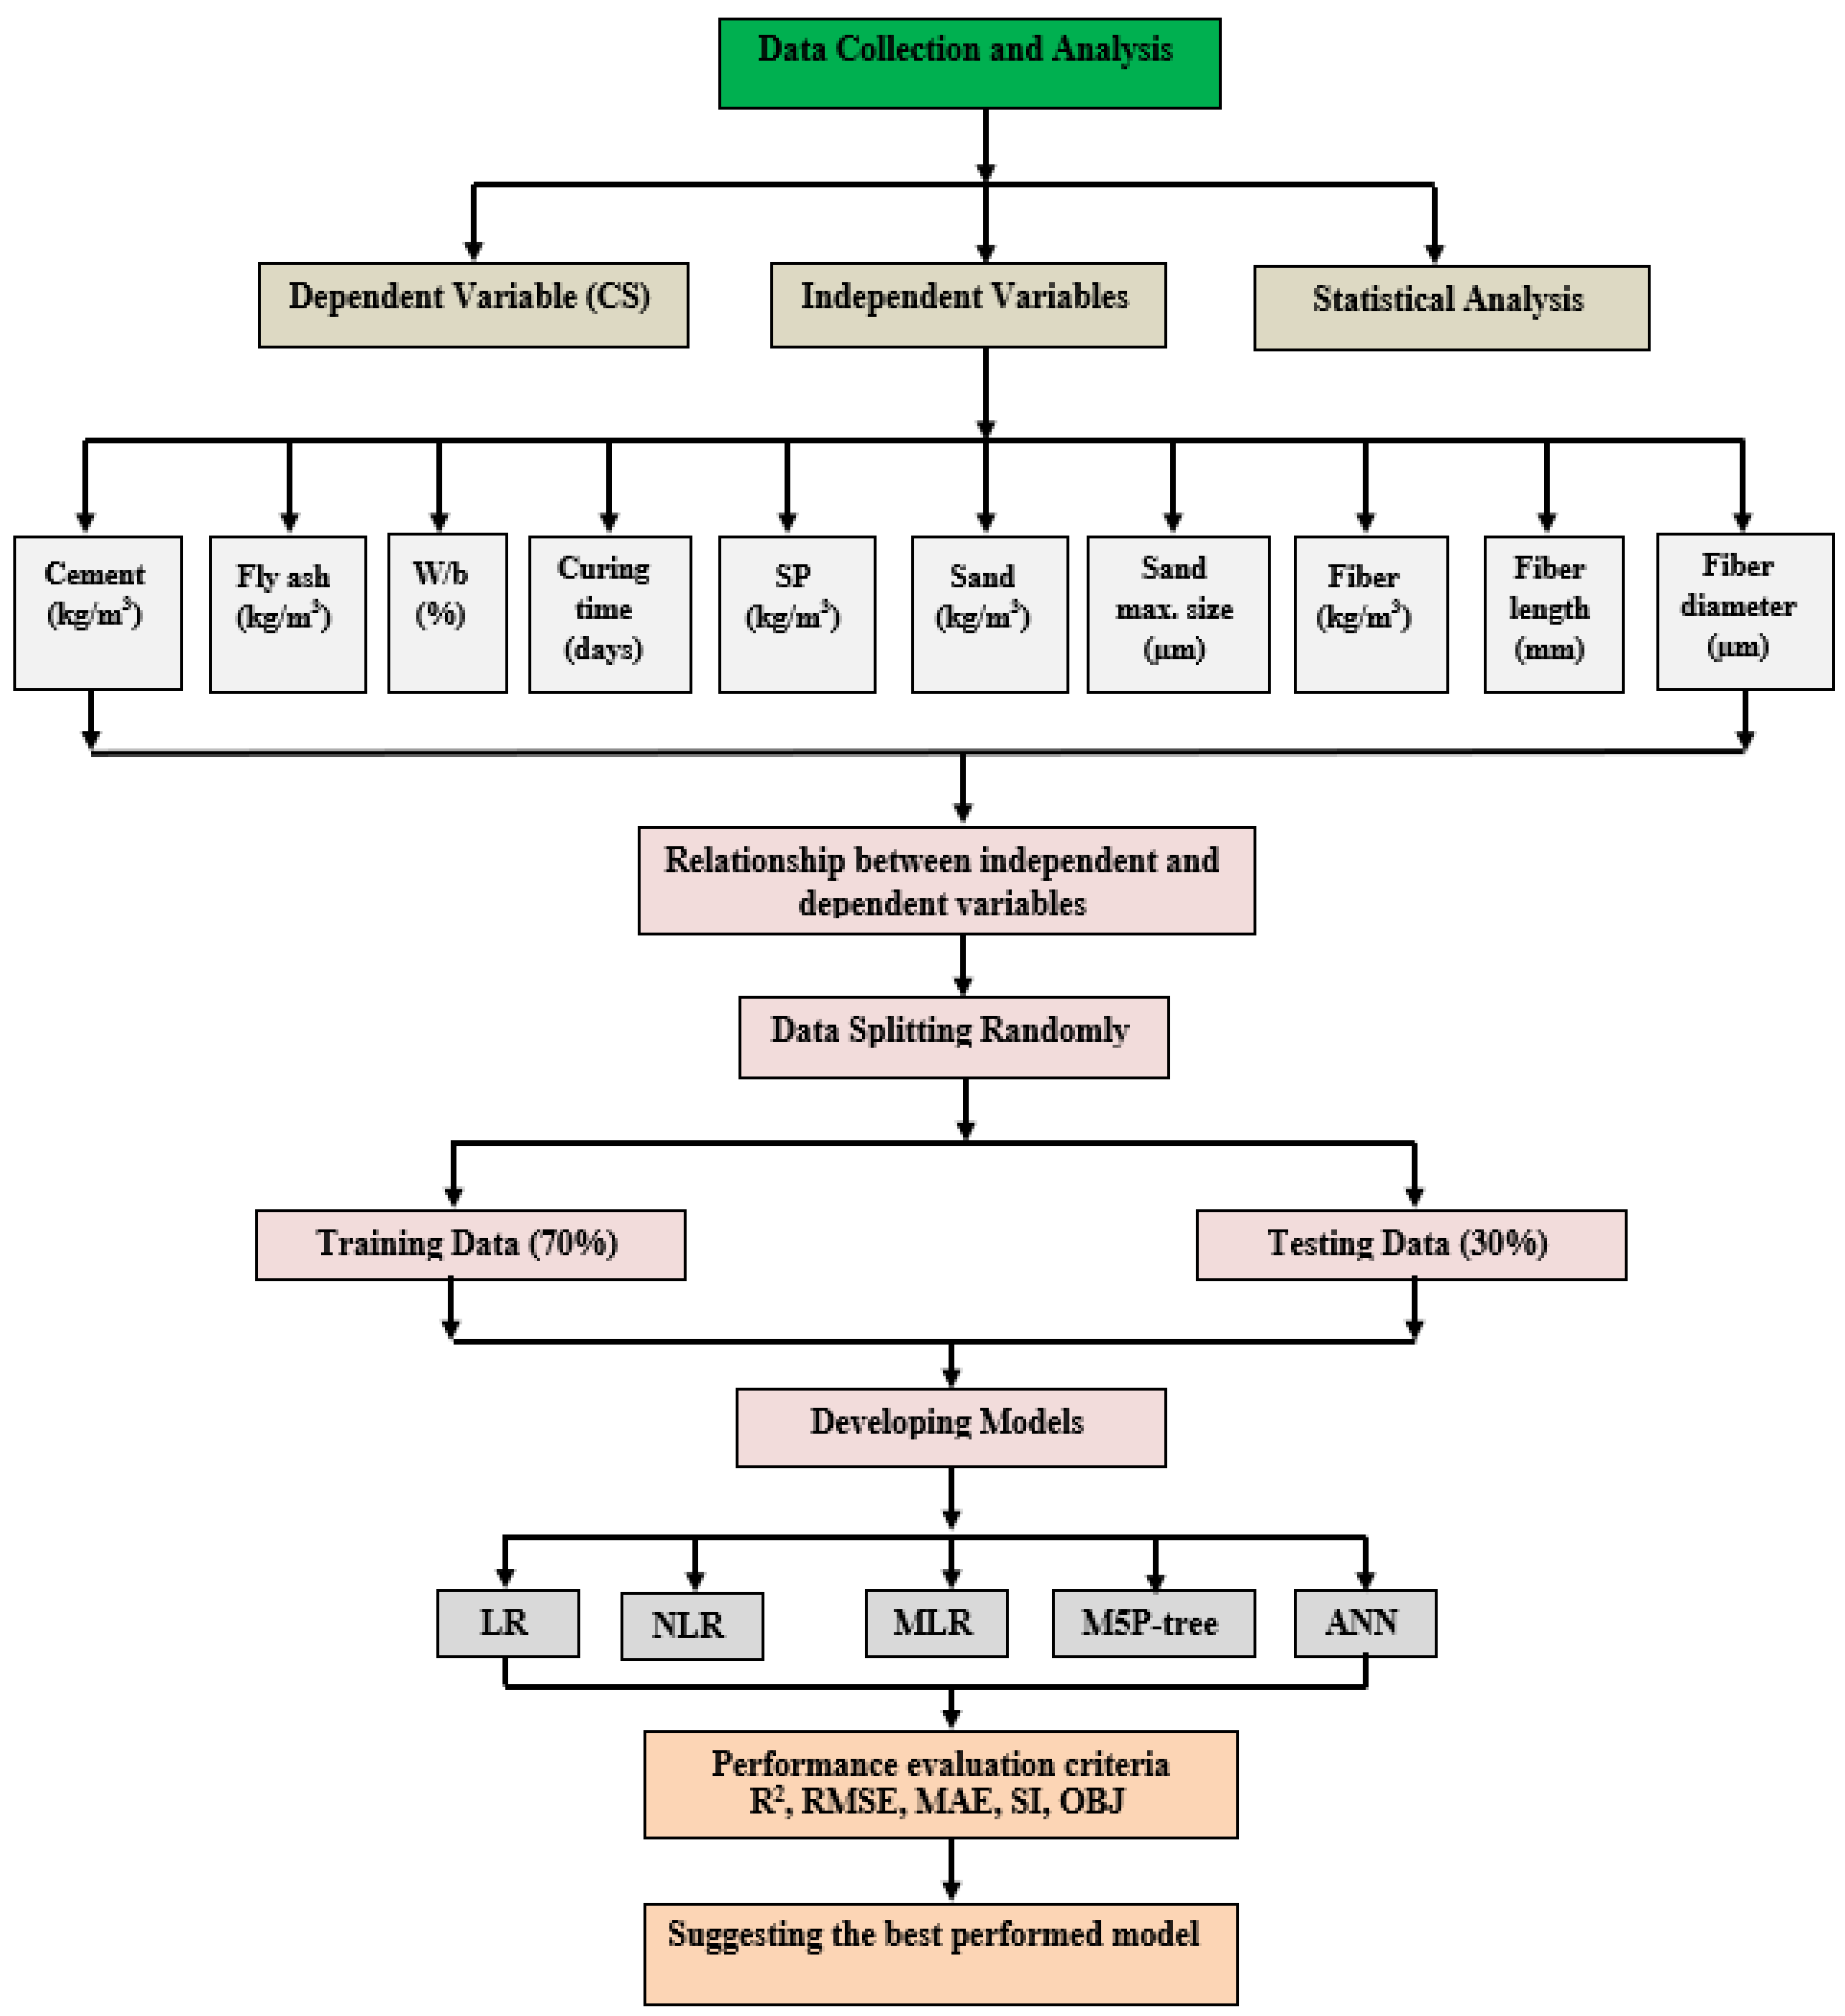
Figure 1. The flow chart diagram process followed in this study.
Sustainability 14 12876 g001
Figure 2. ANN model optimal network architecture.
Sustainability 14 12876 g002
Figure 3. Based on the model’s R2, MAE, and RMSE performances, choose the best-hidden layer and neurons for an ANN model.
Sustainability 14 12876 g003
Figure 4. M5P-tree Pruned model tree.
Sustainability 14 12876 g004
Figure 5. Marginal plot for the CS of ECC versus: (a): cement content; (b): fly ash content; (c): w/b; (d): sand maximum size; (e): sand content; (f): Superplasticizer content; (g): fiber content; (h): fiber length; (i): fiber diameter; (j): specimens ages.
Sustainability 14 12876 g005aSustainability 14 12876 g005b
Figure 6. The CS histogram of the gathered datasets at various curing ages.
Sustainability 14 12876 g006
Figure 7. (a,b): Box plots of input features calculated from the complied datasets.
Sustainability 14 12876 g007aSustainability 14 12876 g007b
Figure 8. Comparison of the CS of ECC mixtures that were tested and the CS that the LR model predicted; (a): training datasets; (b): testing datasets.
Sustainability 14 12876 g008
Figure 10. (a) Comparison of the CS of ECC mixtures that were tested and the CS that the MLR model predicted; (b): testing datasets.
Sustainability 14 12876 g010
Figure 11. (a) Comparison of the CS of ECC mixtures that were tested and the CS that the ANN model predicted; (b): testing datasets.
Sustainability 14 12876 g011
Figure 12. (a) Comparison of the CS of ECC mixtures that were tested and the CS that the M5P model predicted; (b): testing datasets.
Sustainability 14 12876 g012
Figure 13. R2 results for training and testing datasets for various proposed models.
Sustainability 14 12876 g013
Figure 14. RMSE results for training and testing datasets for various proposed models.
Sustainability 14 12876 g014
Figure 15. MAE results for training and testing datasets for various proposed models.
Sustainability 14 12876 g015
Figure 16. Comparison of model predictions of the CS of ECC mixtures with data from the test datasets.
Sustainability 14 12876 g016
Figure 17. CS of ECC mixes residual error diagram utilizing entire datasets for all models.
Sustainability 14 12876 g017
Figure 18. All of the models’ OBJ values.
Sustainability 14 12876 g018
Figure 19. SI performance parameter results of several created models.
Sustainability 14 12876 g019
Figure 20. Contribution of the model parameters in predicting the CS of ECC mixtures.
Sustainability 14 12876 g020
Table 1. The following is a list of the components of ECC mixes that are documented in the literature.
Refer.Cement Content (kg/m3)Fly Ash Content (kg/m3)w/bSandSP Content (kg/m3)FiberAge (Day)CS (MPa)
Max. Size (µm)Content (kg/m3)Content (kg/m3)Length (mm)Diameter(µm)
[24]313–570684–9400.28–0.32300380–5322.5–10.41712262820–45
[34]41211500.2325045610.71810122845
[35]1009.1600.35300757.537.0517.910122845
[36]222–375825–9780.26200–4254324.8–5.042612392827–50
[37]471.6754.50.27300444.110.8268392858
[38]240–545654–9600.252504324.8–10.926–32.512392819–32
[39]5706840.33000.365.728.612392859.86
[40]5706840.562504566.8429839713–69
[41]23210190.262504504.32612392817
[42]250–570684–10000.252504507.5–17.1268392824–47
[43]5706840.274004555.1268392853.8
[44]5706840.272504554.9266397–2828–48
[45]9362010.322506014.2268395654
[46]3938650.2525045752612392841
[47]3938650.2525045752612392840
[48]392–570684–8620.27400–1000451–6893–5.5268397–18028–78
[49]8202050.372006563.07–3.5813–398–1238747–63
[50]5706840.33004565.128.612392859.86
[51]337–570684–9120.2672504542.5–516.912392847–52
[52]5786940.252004627.512612392851
[53,54]5706840.231504545.3268402860
[55,56]5706840.272004554.9268397–2837–48
[57,58]386–570684–8470.27200448–4553.7–4.9268397–9021–55
[59]5706840.272004555.1268397–2837.8–53
[60,61]375–558669–8230.27200435–4462–2.32683914–2827–62
[62]190–571685–10630.252504565.1–6.8268393–288–54
[63]382–636636–8900.2525046216–17.4268403–9017–77
[64]583699.90.25100465.77.620.112402839.9
[65]418–570684–8360.19–0.256004565.7–7.41268402854–58.6
[66]404–502605–7530.24–0.3212–4750756231912242863
[67]5706840.272004567.412683928–9047.6–57
[68]3958690.252004595.14.55–2412402839–51
Table 2. A summary of the statistical analysis of the model’s input parameters.
Input VariablesAverageMedianSt. Div.Min.Max.VarianceSkewnessKurtosis
Cement content (kg/m3)466.11412137.0819093618,791.780.740.85
Fly ash content (kg/m3)754.83763.2173.01201115029,932.73−1.453.27
w/b0.270.270.040.190.560.004.2124.82
Sand max. size (µm)520.05250777.631004750604,707.454.3119.88
Sand content (kg/m3)494.6445692.703807568593.710.554.15
SP content (kg/m3)7.185.264.6522321.601.380.72
Fiber content (kg/m3)24.71264.014.553916.05−1.154.66
Fiber length (mm)9.1681.856123.410.86−1.15
Fiber diameter(µm)37.11395.18124026.85−2.294.15
Age (days)40.222842.6331801817.722.174.30
CS (MPa)47.0047.615.788.278.56249.15−0.15−0.74
Table 3. M5P-tree model parameters for Equation (17).
(LM) num:123456
α1+17.3699+33.6287+84.574+75.5592+126.5619+62.8256
α20.02760.01030.02750.03160.03140.0519
α3--−0.048−0.0379−0.0664−0.0171
α4+17.9526+30.3504−88.3962−88.3962−187.9927−108.9859
α5+0.0012+0.0021+0.0059+0.0061+0.0113+0.0042
α6+0.0064+0.0219--+0.0228
α7+0.2525+0.4094+0.1043+0.1043−0.154+0.3398
α8--−0.2552−0.2552−0.4−0.115
α9-−1.2723----
α10- ----
α11+0.0998+0.1302+0.1242+0.1242+0.1011+0.1453
Publisher’s Note: MDPI stays neutral with regard to jurisdictional claims in published maps and institutional affiliations.