1. Introduction
China is experiencing rapid population aging due to its longer lifespans and declining birth rates. According to World Population Aging 2019, the average life expectancy in the country will increase from 77.3 years now to 81.5 years in 2045–2050 [
1]; the dependency ratio of the aging population (i.e., the number of people aged 65 and over as a percentage of the number of working people aged 16–64) will increase from 17.7% at the current stage to 47.5% in 2050 [
2]. According to the data of the 7th census, the number of elderly people aged 60 or older in China is currently 264.02 million, accounting for 18.7% of the national population, up 5.44 percentage points compared to the 6th census; the number of elderly people aged 65 years or older is 190.64 million, accounting for 13.5% of the national population, up 4.6 percentage points compared to the 6th census. In order to promote balanced population development and mitigate the adverse effects of the aging trend, China has proposed liberalizing the birth policy of two and three children in January 2016 and May 2021, respectively, but the effect is not satisfactory for the high cost of childcare. According to the National Bureau of Statistics (NBS), the birth rate dropped from 13.27 per 1000 in 2010 to 7.52 per 1000 in 2021.
The increasing age of the population has led to a rise in the old-age dependency ratio (
Figure 1 and
Figure 2). This demographic change has led to a gradual decrease in the number of people contributing to pension insurance relative to the number of pension recipients, putting enormous financial pressure on the pay-as-you-go (PAYG) social security system [
3], while the coverage of pensions in China is continuing to expand (
Figure 3 and
Figure 4). Based on the current trend, according to the China Pension Fund Actuarial Report 2019–2050, the accumulated balance of the basic pension insurance fund for urban employees nationwide will peak in 2027 and be depleted in 2035, then begin to run a deficit [
4]. Furthermore, the average age of pensioners in China now is nevertheless lower than 55 years [
5]. Therefore, the growing pension expenditure gap, the gradually increasing number of the elderly population, the increasing pressure of pension payments, and the severely insufficient pension fund income will lead to the inevitable trend of pension policy reform. Due to enforceability of the policy, sustainability of the financial input, and the rigid characteristics of benefits, the delayed retirement policy becomes an inevitable choice of the government. The Ministry of Human Resources and Social Security has already proposed suggestions that men’s retirement age should be raised by one year every six years, and women’s retirement age should be raised by one year every three years, so that the goal of retirement at age 65 for both men and women can be roughly achieved by 2045. In addition, whether delayed retirement can bring a certain degree of welfare improvement to delayed retirees is also an important determinant of whether this policy can really be implemented effectively.
Then, relative to normal retirement, (1) can delayed retirement policy truly reduce the pressure of pension payments and achieve the sustainability of SSF? (2) Can delayed retirement truly improve the welfare of delayed retirees, and which policy is more effective: voluntary delayed retirement (workers choose the best time to delay retirement according to their own preferences) or passive delayed retirement (workers retire at fixed point set by the government) policy? (3) How do changes in life expectancy, labor productivity, and birth rate affect the effects of voluntary delayed retirement policy, and what are the results if these factors are at work at the same time?
The original work was first proposed by refs. [
6,
7,
8], after being developed by a series of scholars, and is now widely used in all aspects of social security. Ref. [
9] considered voluntary retirement decisions and bequest motives and found that an appropriate level of pensions can promote sustained economic growth if the rate of capital return converges to the level of capital at the golden rate. Ref. [
10] incorporated unexpected bequests and precautionary savings into the OLG framework and discussed the effects of different social security systems on savings, consumption, and wealth of the next generation, while we discussed the effects of different retirement decisions on the contemporary population under the PAYG system.
From a workforce perspective, ref. [
11] suggested that delayed retirement may affect female labor supply and fertility through the path of intergenerational dependency, while we found that the propensity to delay retirement gradually decreases as fertility increases. Ref. [
12] argued that whether the effect of delayed retirement on the labor market is job crowding out or creation depends on the relationship between supply and demand. If the labor market is oversupplied, employment of the elderly will have a job crowding out effect on the young, and conversely, it would cause a job creation effect. This paper certainly provides an argument for the feasibility of the research idea of our paper at a time when China is experiencing an inadequate labor supply.
From a welfare perspective, ref. [
13] emphasized that the optimal level of social security benefits depends on the trade-off between benefits to the elderly and the distorted costs. Ref. [
14] argued that voluntary labor supply may lead to welfare losses, while we emphasized that the welfare gains or losses of delayed retirees from a voluntary delayed retirement policy depend on the gap between the welfare gains due to income effects and the welfare losses incurred in old age due to reduced leisure. Ref. [
15] emphasized that the impact of a fully funded social security system on individual welfare is uncertain, and this paper emphasizes the impact of the social security system under PAYG.
From the perspective of influencing factors, refs. [
16,
17] introduced uncertainty about the lifespan. Ref. [
18] considered endogenous birth rates and provided a detailed analysis of the role of the child, arguing that the decline in birth rates may be due to the fact that children are no longer perceived as compensation for their parents and therefore birth rates are getting lower. In contrast, this paper extrapolates the birth rate and considers the impact of the birth rate on the sustainability of the SSF and on delayed deferred retirees’ welfare. Refs. [
19,
20] discussed age-dependent productivity changes. In contrast to the above literature, this paper considers the effects of lifespan, birth rate, and labor productivity on the effects of delayed retirement policies.
Our analysis makes use of insights from several important branches of the literature, such as refs. [
19,
21,
22,
23,
24]. The similarity between this paper and ref. [
21] is that both explore the advantages and disadvantages of different retirement policies through a welfare perspective. The difference is that ref. [
16] considers the AK model and does not include the effect of the burden factor of SSF. This paper considers the AKL model and tries to use the sustainability of the social security system as a second quantitative analysis perspective and conducts a comparative analysis of three retirement policies: normal retirement, voluntary delayed retirement, and passive delayed one.
This paper differs from ref. [
22] in that we first consider the exogenous birth rate (which is endogenous in this paper). Second, we consider not only normal retirement and voluntary delayed retirement but also passive delayed retirement ( Note2: Of course, from the perspective of welfare economics, voluntary delayed retirement is better than passive delayed one, but the advantages and disadvantages of the two delayed retirement versus normal retirement policies are not known, because normal retirement means more leisure and delayed retirement means more income, consumption, while both consumption and leisure are important components of utility and welfare, so it is not certain who dominates. In reality, passive delayed retirement policies do exist, so this paper tries to consider and compare passive delayed retirement policies as well). Third, our model framework incorporates not only the birth rate and longevity factors but also the labor productivity of the elderly. Fourth, this paper stays only in the case where the sign of the first-order derivative of the analytical solution (the direction of influence on the economic variables) can be determined, while we try to analyze and judge numerically when the sign cannot be determined. Fifth, we further quantify the changes in the sustainability of the SSF and the welfare effects due to the changes in these variables. Finally, we also consider the effect of the superposition of these factors. Ref. [
19] focused on the link between the negative utility of labor, uncertain longevity, and age-dependent labor productivity. This paper argues that longer lifespans lead individuals to retire later, a finding that coincides with ours. Ref. [
23] use a dynamic programming approach to argue that an individual would delay retirement if he or she expects future retirement to be more valuable than in the present, while we use the OLG model framework to quantify this value using sustainability of the SSF and welfare improvement of those who delay retirement. Ref. [
24], on the other hand, condensed the classic ideas of refs. [
6,
8], which provided the basis for studying the OLG framework.
For the criterion of welfare improvement for delayed retirees, the mechanism is: “when people choose delayed retirement, his labor income would increase, then he would consumption more and save more, (so leisure would be reduced), thus his utility would increase (thus utility would be reduced), welfare would increase (welfare would be reduced).” Thus, the ultimate welfare effect of delayed retirement relative to normal retirement depends on the gap between the welfare increase resulting from the income effect and the welfare loss due to the reduction in leisure. For the criterion of the sustainability of the SSF, the mechanism is: “when people choose delayed retirement, the amount of the total pension fund contributed would increase, the number of years and total amount of pensions paid out would decrease, then the total income of the pension fund pool would increase, total payments of the pool would decrease, so the pensions in payment pressure would decrease, thus the sustainability of the SSF would increase.” The theoretical model is shown in
Figure 5.
We make a judgement about whether an individual’s welfare can be improved by comparing steady-state utility and consumption under each delayed retirement policy relative to normal retirement and judge whether the SSF can be improved by analyzing the steady-state pension level. Furthermore, we also analyze whether social security has a crowding-out effect on savings. Given the complexity of the analytical solution, we compute the above indicators by means of a numerical solution, and then compare the better way to delay retirement. Finally, we perform a robustness check on our baseline model and give policy suggestions. Among the existing studies, refs. [
25,
26] argued that social security has a crowding-out effect on savings. Ref. [
27] emphasized that delayed retirement policies have no effect on SSF under defined contribution plans but significantly increase the SSF under defined benefit plans, while the impact on an individual’s welfare is uncertain due to increased consumption along with reduced leisure.
We find that relative to normal retirement, (1) both voluntary and passive delayed retirement policies improve the sustainability of the SSF; (2) both delayed retirement policies increase the welfare of delayed retirees, and voluntary delayed retirement is optimal. (3) The increase in longevity and labor productivity both further enhance the sustainability of the SSF and increase the welfare of delayed retirees, while an increase in the birth rate enhances this sustainability effect and at the same time weakens the welfare effect, i.e., reduces the welfare gap between voluntary delayed retirement and normal retirement. When multiple factors work simultaneously, the effect is enhanced by superposition if the effects are in the same direction; conversely, the effect is weakened by superposition.
The main contributions are: (1) We argue that delayed retirement is better than normal retirement, and voluntary delayed retirement is better than passive delayed retirement in delayed retirement policies, as the sustainability of SSF and the welfare of delayed retirees are both improved; (2) Revising the views of existing studies [
10,
25,
26] that argued that pensions have a crowding-out effect on savings, we find that the increase in the amount of pensions also further promotes savings. This is partly due to the imperfect social security system in China, where people need to work more to earn money to support their lives and thus have to save preventively, but in developed countries, where the social security system is well established, income from social security pensions is sufficient to support one’s lives normally. On the other hand, traditional cultural factors encourage Chinese people to save more. Furthermore, it is not necessarily true that longevity would lead to increased pressure on the social security system to pay pensions. We find that if the labor supply of the elderly increases at a faster rate than longevity, longevity will instead reduce the old-age dependency ratio and reduce the pressure on pension payments. (3) In the existing literature, there is almost no literature that considers the birth rate, longevity (influence demographic structure), and the labor productivity of the elderly population (influence employment) in the same framework, and the existing literature only stays in the case where the direction of the influence of the economic variables is determined by the analytical solution, while this paper attempts to judge and analyze them by means of numerical solutions, complementing the existing literature in terms of methodology.
4. Calibration and Solution
We analyze the trend of steady-state variables under different policies by numerical solution, and then compare the different retirement policies. Furthermore, we will discuss how the birth rate, lifespan, and labor productivity influence the effect of voluntary delayed retirement policy (similarly to analyze other policies).
4.1. Calibration
To judge the existence and stability of the numerical solution, we first calibrate the parameters. As China is labor intensive, the labor income share is lower than that of developed countries. The share of capital income in developed countries is generally taken, (see literature [
22,
33,
34] for details), so we set the capital income share as
according to [
35].
In existing literature, the value of TFP
differs greatly. [
34] set
, [
36] set
. Since China has gradually changed from a high-speed growth stage to a medium-low growth stage, we calibrate
in this paper. The discount rate is from the literature [
37],
. In the Chinese social security system, individuals undertake 8% of the payroll tax burden, enterprises bear 20%, and the total contribution rate is 28%, while the contribution rate of individual workers (including self-employed workers) bears 18%. Therefore, we calibrate the contribution rate
. The social security contribution rate in [
38] takes the value of
. Birth rate
comes from NBS, we set it as
. Ref. [
38] sets the birth rates of urban and rural residents in China from 2006 to 2012 as
and
respectively. In reference to NBS data, we give gradient values to reflect the effect of changes in birth rates.
Considering that the average life expectancy in China is gradually increasing, as of 2020, the average life span reached 77.3 years old. When considering the influence of other variables, we calibrate the probability of longevity
, when considering the influence of longevity, we give a sequence value according to the gradient to reflect the impact of lifespan changes. Leisure preference is based on [
22], we set
. When passive delayed retirement is used, the delayed retirement length is
. According to a report from ref. [
39], the child-rearing cost of a single child roughly accounts for 20–30% of a family’s disposable income. Therefore, we set the child-rearing cost as
. In this paper, the labor productivity of the young is set as 1, so we set the labor productivity of the old as
; when other conditions are held constant, we set a series of gradients from small to large to reflect the trend of labor productivity on the effect of voluntary delayed retirement policy. Since the fertility of women of child-bearing age is gradually decreasing, we set the fertility preference as
, as shown in
Table 1 for details.
4.2. Existence and Stability of Equilibrium Solutions
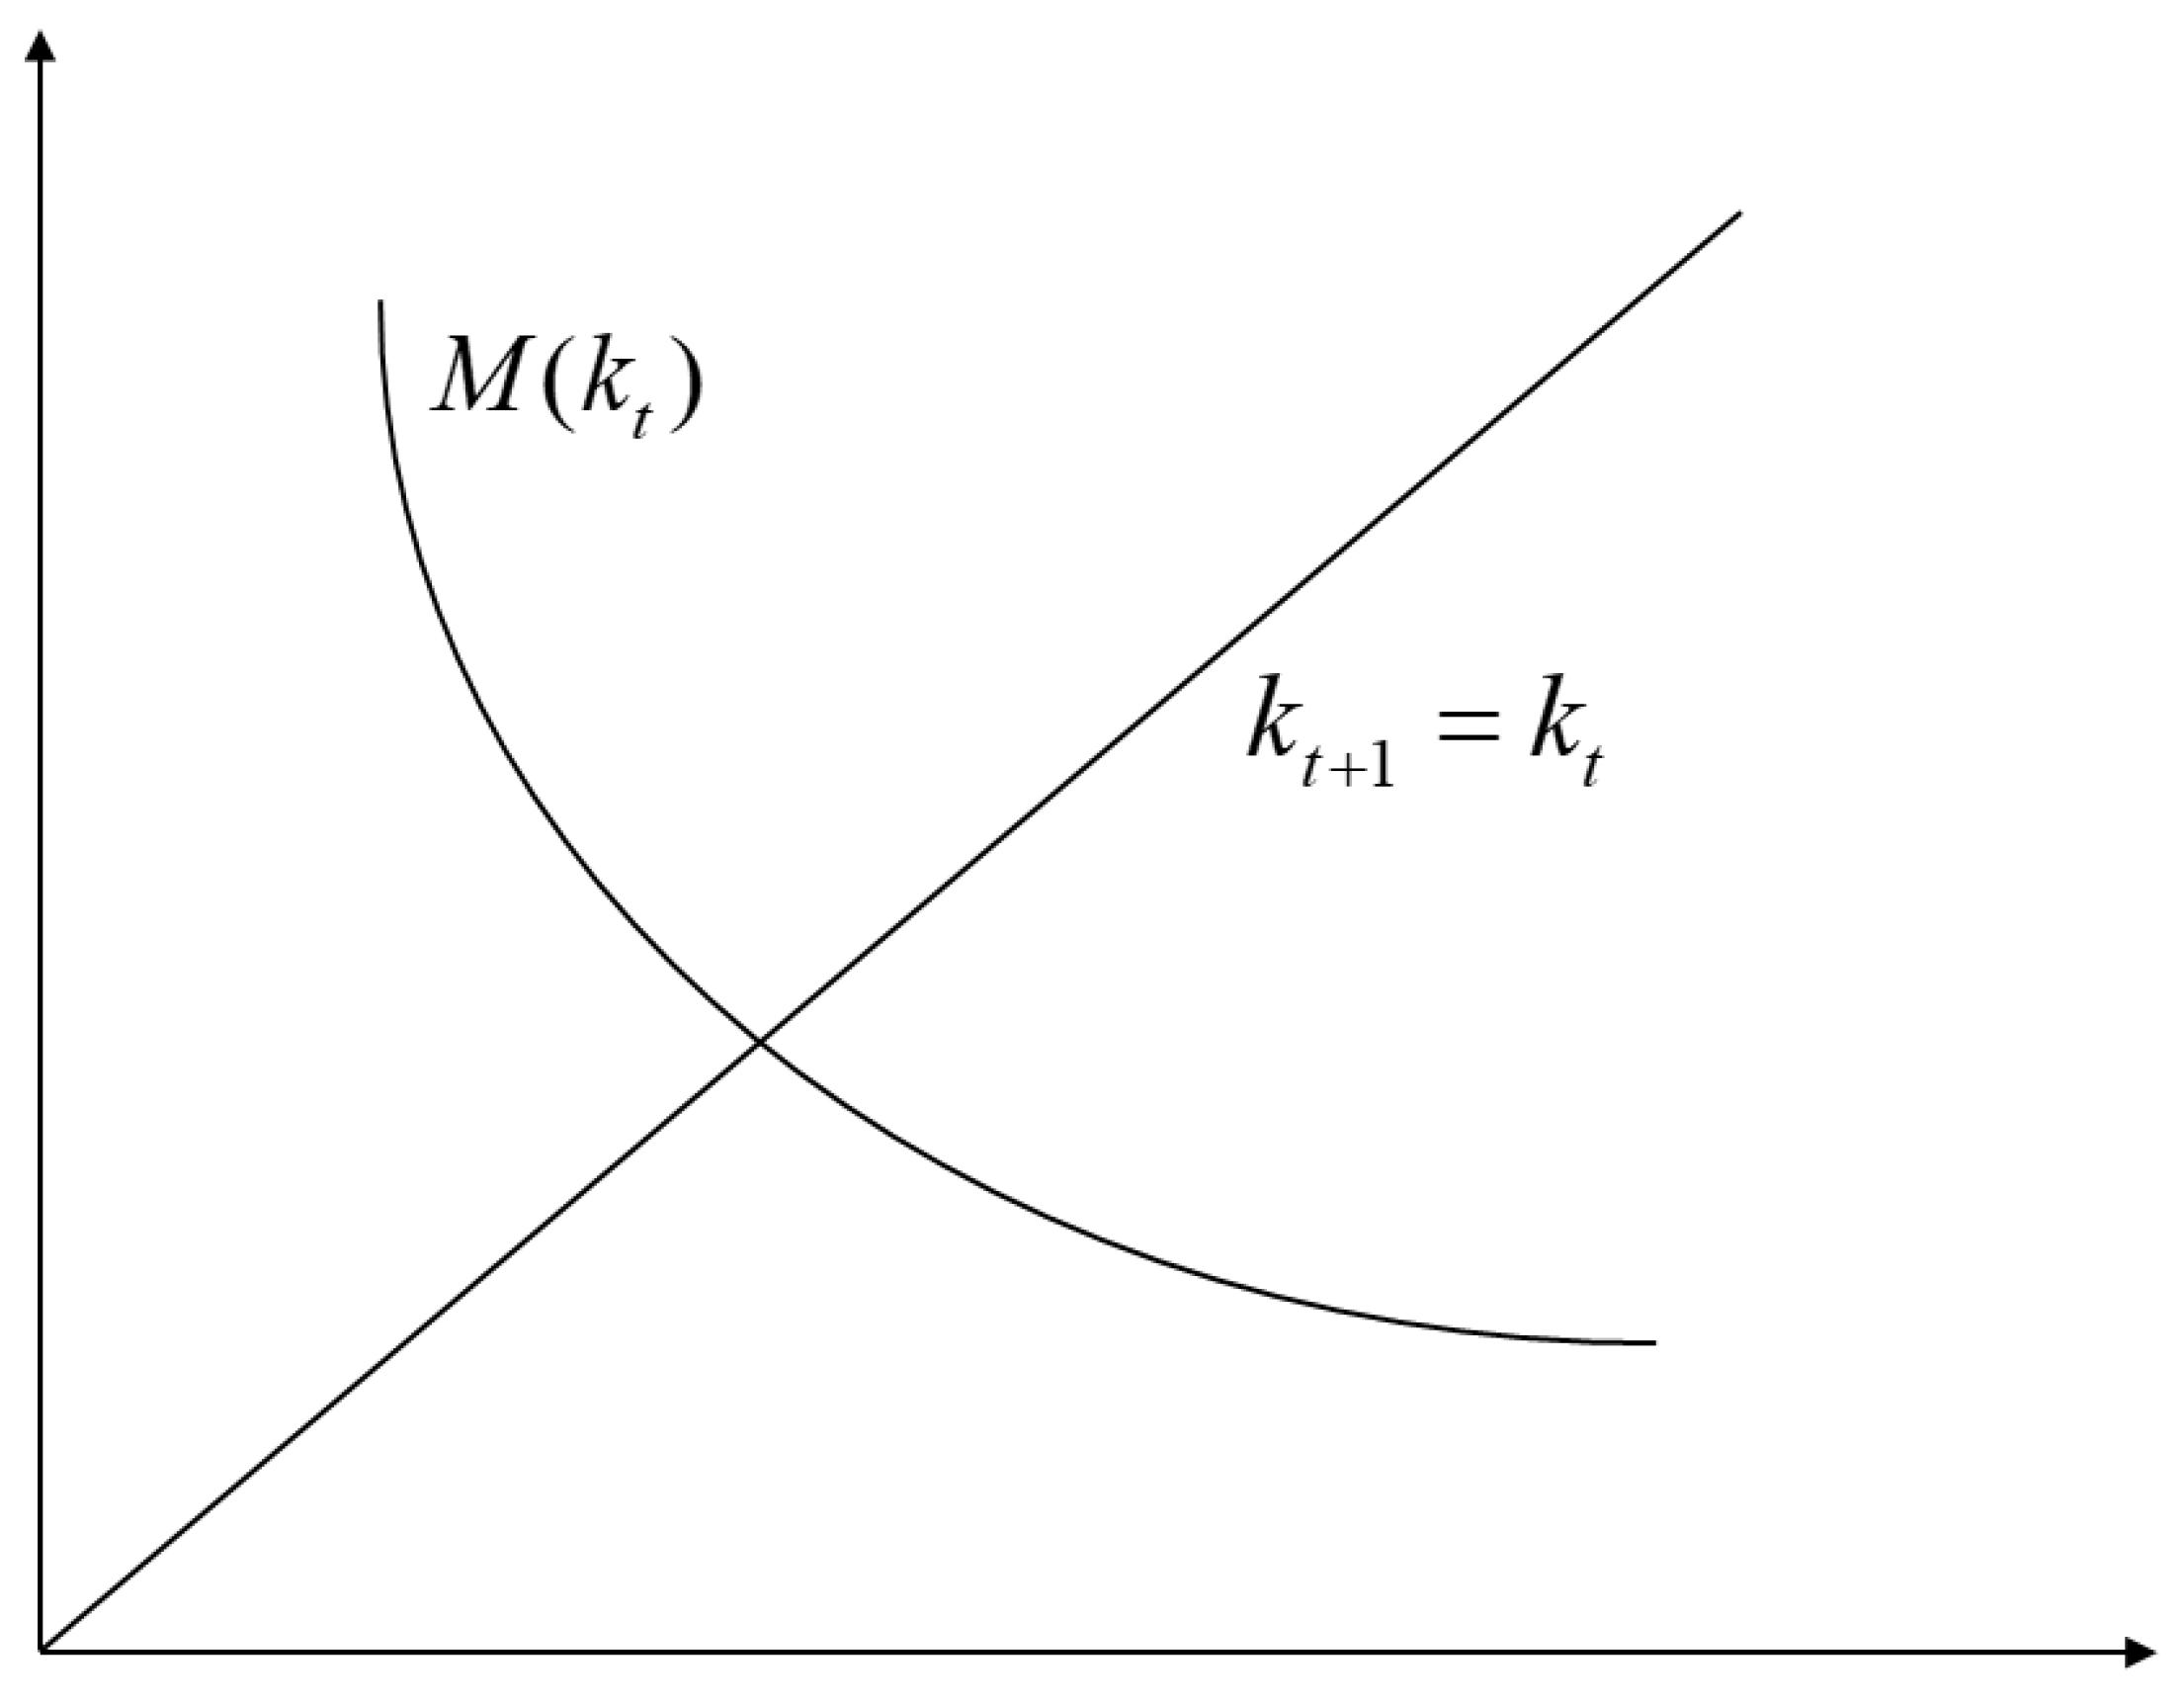
From Equations (18), (23), and (27), we can know that the solution of equations only depends on the parameters; once the parameters are given, the solution is constant. The function of capital-labor ratio
is denoted on the right of Equations (18), (23), and (27) as
. After calibration and from the image method (
Figure 7), we know that
,
,
exist, i.e., Equations (19), (24), and (28) all have equilibrium solutions. The existence, as well as the stability of equilibrium solutions, are mentioned and explained in [
24,
33].
The stability of the equilibrium solution needs to satisfy:
Given the above parameters, it has been verified that Equation (18) satisfies (voluntary delayed retirement):
where:
Equation (23) satisfies (normal retirement):
Equation (27) satisfies (Passive delayed retirement):
That is, the steady-state equilibrium conditions of the solution hold.
4.3. Results
In a steady state: (1) If delayed retirement (voluntary and passive) can improve the sustainability of the SSFs, then and holds. (2) If utility, savings, and consumption of the representative individuals in delayed retirement have increased relative to normal retirement, it means that delayed retirement has improved the welfare of delayed retirees; otherwise, it has not improved. (3) We consider the influence of birth rate, labor productivity, life expectancy, and any of their superposition effects on the effect of voluntary delayed retirement policy. We denote the steady-state economic variables under voluntary delayed retirement, passive delayed retirement, and normal retirement as: , respectively. Among the steady-state variables, capital-labor ratio and utility are percentage changes relative to normal retirement, while pension, total consumption, savings, and delayed retirement time are level changes relative to normal retirement.
In
Figure 8, the blue dotted line and red solid lines indicate the changes of each steady-state variable under voluntary delayed retirement and passive delayed retirement relative to normal retirement, respectively. From
Figure 8a, it can be seen that the steady-state capital-labor ratio satisfies
in any given birth rate, which is due to the fact that delayed retirement leads to an increase in the total effective labor supply in the market of the same period. Thus, the steady-state capital-labor ratio is lower than that in normal retirement, while the total labor supply increases the most in voluntary delayed retirement (
); thus, the capital-labor ratio is the lowest in voluntary retirement. Furthermore, this gap to normal retirement gradually decreases as the birth rate increases because of the increase in savings due to the increase in income of delayed retirees and the fact that capital comes only from savings, thus gradually diluting the effect of the increase in labor supply.
As shown in
Figure 8b,
, which indicates both voluntary and passive delayed retirement policies increase the sustainability of the SSFs, and voluntary delayed retirement improves the most. On the one hand, the delayed retirees pay more and longer into the SSF (the most for voluntary delayed retirement), according to the principle of “more contributions, more benefits,” the delayed retirees would surely receive higher pensions after retirement. On the other hand, the gap widens as the birth rate increases because an increase in the birth rate means an increase in the number of contributors and total social security income. According to the break-even principle, delayed retirees naturally receive higher pension amounts upon retirement, both of which lead to an increasing steady-state pension gap to normal retirement. If the steady-state pension under the delayed retirement policy is adjusted downward to be equal to that of normal retirement, the social security system would satisfy income > expenditure; there is some money left, indicating that the sustainability of the SSF has been improved and the size of the balance satisfies voluntary > passive > normal retirement = 0. If it continues to break even, the contribution rate must be adjusted downward.
From
Figure 8c–e, it can be seen that relative to normal retirement, steady–state consumption, utility, and savings satisfy
, i.e., voluntary delayed > passive delayed > normal retirement, delayed retirement improves the welfare of delayed retirees, indicating that the increase in utility generated by income effect under delayed retirement is greater than the loss of utility due to reduced leisure in old age, and this gap (to normal retirement) gradually decreases with the increase in birth rate. The main reasons are as follows: (1) Income effect increases the consumption of representative individuals over the life cycle, leading to a gradual decrease in the marginal utility of consumption and a gradual increase in the marginal utility of leisure, thus prompting individuals to consume more leisure in old age, in the meantime, higher income levels prompt the old to have the ability to reduce the delayed time of retirement less. (2) An increase in the birth rate implies a higher labor supply and higher SSFs income; thus, individuals receive higher pensions when social security breaks even, which attracts older people to retire earlier, as shown in
Figure 8f. (3) Older people may be more inclined to return to their families and take care of their grandchildren because of the higher labor productivity and income of young people. Therefore, the reduction in delayed retirement thus implies a reduction in the welfare effect of the income, which eventually leads to a gradual reduction in the welfare gap with normal retirement.
In addition, comparing
Figure 8b,e, we know that the increases in the amount of pension received in steady-state after delaying retirement promotes individuals to save more. Of course, the income effect gradually decreases due to an increase in the birth rate, which finally leads to a gradual decrease in this promotion effect.
4.4. Impact of Changes in Life Span, Birth Rate, and Labor Productivity
On the basis of the above analysis, taking normal retirement as the benchmark, this section considers the effects of increases in life expectancy, birth rate, labor productivity, and the superposition of them on the effects of voluntary delayed retirement policy, respectively (the same to analyze the impact of passive delayed retirement).
Longer life expectancy is accompanied by the possibility of longer years of pension receipt on the one hand, and the willingness to retire later, on the other hand [
40,
41]. The former would weaken the sustainability of the SSF of the delayed retirement policy, while the latter would enhance this effect. Based on the analysis in
Figure 6, we first explore the net impact of life–birth rate changes on the effect of voluntary retirement delay policy.
In
Figure 9, the black dotted line, the blue and the red short line indicate the changes in steady−state variables of longevity probabilities at
,
, and
, respectively, for voluntary delayed retirement relative to normal retirement when the birth rate is constant.
From
Figure 9a, we can see that the steady−state capital−labor ratio satisfies
, i.e., voluntary delayed retirement’s capital−ratio is lower than that in normal retirement, for a more effective labor supply under delayed retirement in the same period. Second, the gap gradually increases as life expectancy increases, indicating that those who live longer tend to retire later, as can also be seen in
Figure 9f. From
Figure 9b, we can see that the longer the life expectancy, the more pensions the delayed retirees would receive after retirement, and this gap gradually increases with the increase of birth rate, which is in line with the law of “more contributions, more benefits,” thus positively contributing to the sustainability of the SSF of voluntary delayed retirement policy. This explains why the labor supply of the elderly increases at a faster rate than life expectancy, thus reducing the dependency ratio of the old, as also mentioned in [
20]. Therefore, the usual conclusion that longer life expectancy leads to a higher burden of social security pension payments does not necessarily hold. From
Figure 9c–e, we find that longer life spans, longer work spans, and higher earnings lead to higher savings, consumption, and utility, and greater welfare improvements from the income effect relative to normal retirement. [
42] emphasizes that the shorter−lived population pays taxes and subsidies to the longer−lived population. Overall, the simultaneous increase in birth rate and longevity has a positive superimposed effect on the sustainability of the SSFs for voluntary delayed retirement policy (
Figure 9b). At the same time, the increase in longevity slows the trend of welfare cuts from delayed retirement policies due to increased birth rates (
Figure 9c–e), and as people with longer life expectancy retire later, the tendency to mitigate this welfare cut is gradually increasing. In addition,
Figure 9a shows that the increasing birth rate gradually mitigates the trend of gradually widening the steady-state capital-labor ratio gap between delayed and normal retirement due to longer life expectancy.
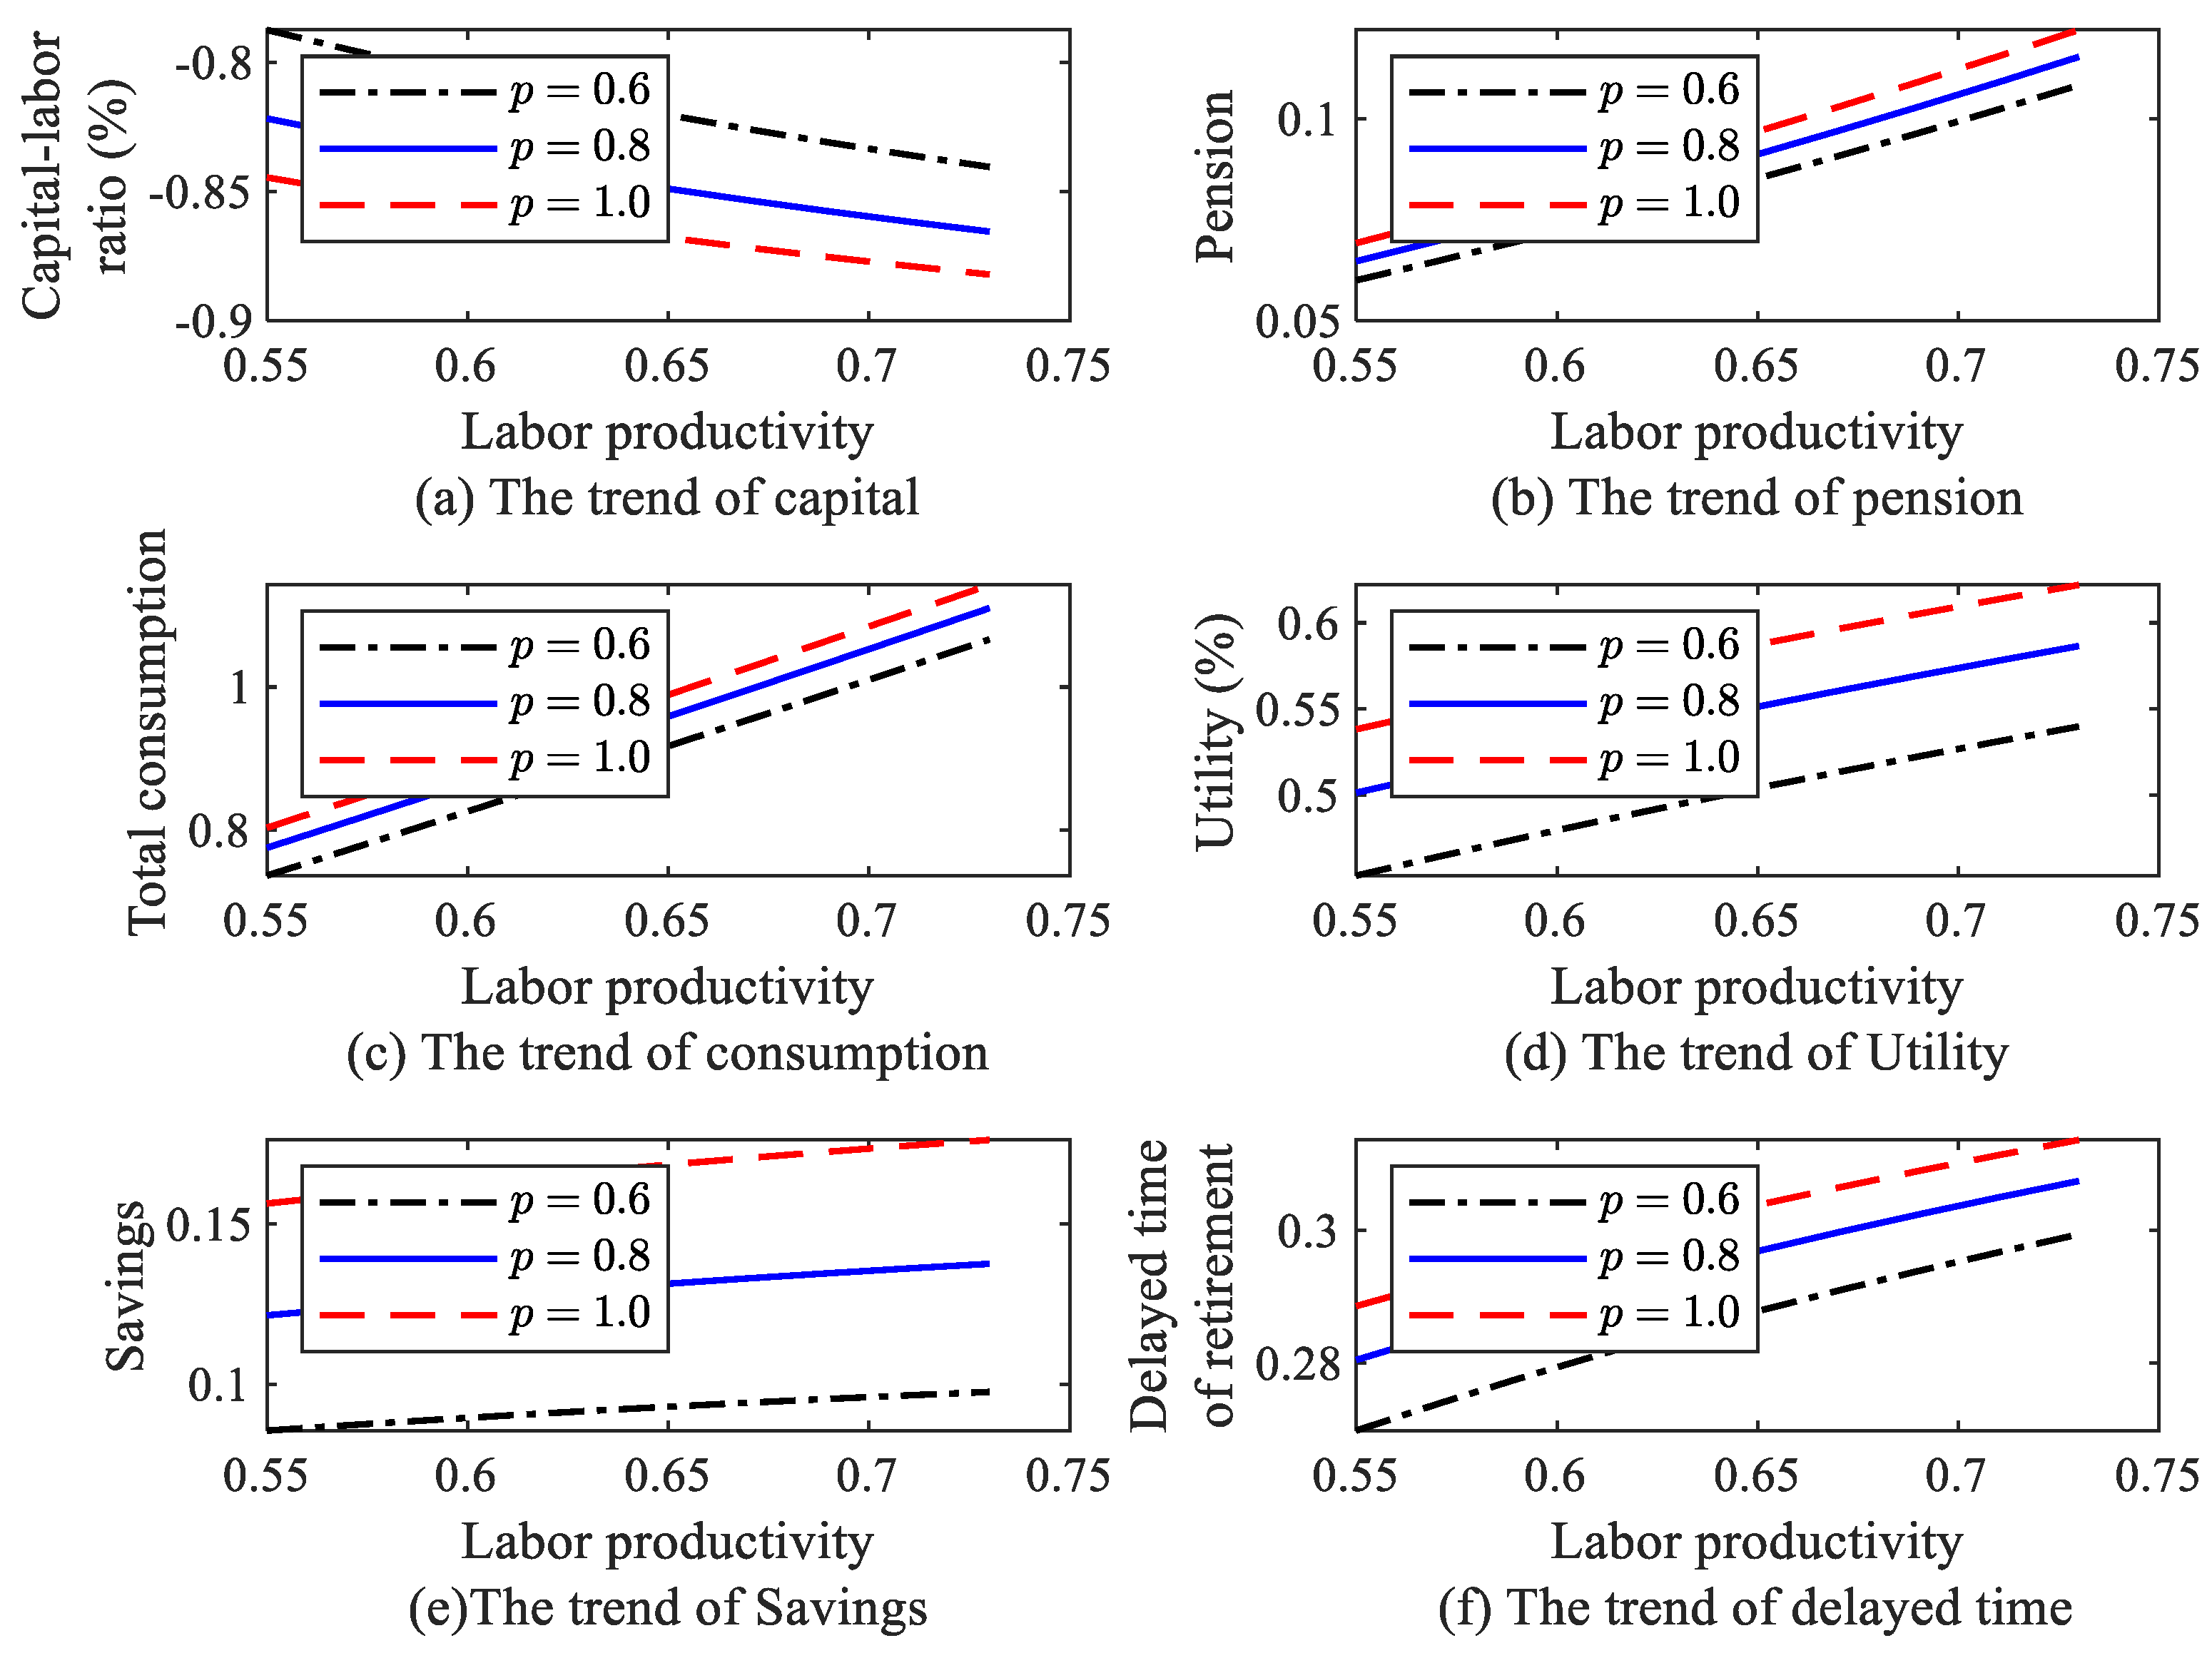
In
Figure 10, the black dotted line, the blue solid line, and the red short line illustrate the changes in each steady−state variable of voluntary delayed retirement relative to normal retirement for labor productivity
,
and
, respectively. When the birth rate is certain, similar to the longevity effect, it can be seen from
Figure 10a that the steady−state capital−labor ratio satisfies
, and the gap between the two increases with labor productivity, because the more labor-productive people tend to retire later (which may also be accompanied by healthier bodies), as can be seen from
Figure 10f. Thus, from
Figure 10b, we find that the higher the labor productivity, the higher the amount of pension one would receive after retirement, improving the sustainability of the SSF for voluntary delayed retirement policy. As shown in
Figure 10c,d, the income effect further improves the welfare of voluntary delayed retirees as labor productivity increases, and longer working hours are associated with higher steady-state income, consumption, savings, and utility.
Therefore, the simultaneous increase in birth rate and labor productivity, on the one hand, has a further superimposed enhancing effect on the sustainability of the SSF of the voluntary delayed retirement policy (
Figure 10b). On the other hand, the increase in labor productivity slows down the welfare weakening tendency of the increase in birth rate on the effect of voluntary delayed retirement policy (
Figure 10c–e).
In
Figure 11, the black dotted line, the blue solid line, and the red short line indicate the changes in each steady-state variable of voluntary delayed retirement relative to normal retirement for labor productivity
,
and
, respectively.
The results of the quantitative analysis in
Figure 9 and
Figure 10 show that increased labor productivity and longer life expectancy both increase the activity of older workers, which further enhances the sustainability of the SSF under voluntary delayed retirement and the welfare improvement effect on delayed retirees. Thus, the simultaneous increase of both has a further superimposed enhancement effect on the policy effect of voluntary delayed retirement. As shown in
Figure 6, when the birth rate is also considered, the welfare effect is weakened by superimposed, and the sustainability effect of the SSF is further enhanced by superimposed.
4.5. Robustness Tests
This section conducts a sensitivity analysis. What we are interested in is whether the judgment of the optimal retirement decision changes due to changes in the model calibration parameters, so we consider the changes in Total Factor Productivity (TFP) and tax rates as robustness tests, which are important economic variables affecting the system. The results are shown in
Table 2. It can be seen that the same conclusions can be obtained as the benchmark model framework when the model benchmark parameters are varied within a reasonable range.
Specifically, when TFP increases: delayed retirement increases individuals’ income, savings, consumption, utility, and capital-labor ratio, which in turn increases the welfare of those who delay retirement. To facilitate the observation of the change in trend, we calculate utility under voluntary delayed retirement policy directly from the utility function (we use the percentage change in utility relative to normal retirement previously), which corresponds to the overall trend in baseline. At the same time, due to the income effect, people’s willingness to delay retirement gradually decreases, reducing the number of years and the amount of social security contributions, thus reducing the amount of steady-state pension received after retirement and weakening the sustainability effect of the SSF.
When the tax rate increases, people’s disposable income decreases due to the increase in expenditure and the decrease in people’s willingness to delay retirement, which reduces the welfare effect led by the income effect. On the other hand, the sustainability of the SSF increases due to the “more contributions, more income, and more benefits for longer contributions.”
5. Conclusions
Taking the sustainability of the SSF payments and the welfare improvement of delayed retirees as judgment criteria, this paper establishes a two-period OLG model to quantitatively compare the policy effects of voluntary delayed retirement, passive delayed retirement, and normal retirement using utility maximization of households, profit maximization of firms, and balance of the SSF of government, respectively.
We find that delayed retirement policies are superior to normal retirement. Among delayed retirement policies, the voluntary delayed retirement policy is better relative to passive delayed retirement. In other words, both delayed retirement policies improve the sustainability of the SSF and increase the benefits of delayed retirees. This suggests that the implementation of delayed retirement policies is feasible and necessary in the current stage of population aging in China.
The paper also analyzes the effects of two demographic variables, lifespan, and birth rate, and labor productivity, which affect the labor supply of the elderly, on the effects of a voluntary delayed retirement policy. We find that an increase in the birth rate improves the sustainability of the SSF under the voluntary delayed retirement policy by increasing the number and number of contributors to the SSF. At the same time, it is the increase in labor supply and pension income due to the increase in the birth rate that leads to a gradual reduction in the willingness of the elderly to delay retirement, which weakens the income and welfare effects of voluntary delayed retirement and therefore gradually reduces the welfare gap between voluntary delayed retirement and normal retirement.
The increase in longevity and labor productivity, on the one hand, further improve the sustainability of the SSF under voluntary delayed retirement policy by increasing the total labor supply and the SSF income in the same period. On the other hand, the income effect of voluntary delayed retirement increases the welfare of delayed retirees, and as labor productivity and longevity increase, the more individuals tend to delay retirement. Thus, the welfare gap between delayed and normal retirement becomes larger, which also shows that if the labor supply of the elderly increases at a faster rate than the length of life span, a longer life span will instead reduce the old-age dependency ratio. Thus, when longevity and labor productivity increase at the same time, the sustainability effect of the SSF is further enhanced and the welfare of delayed retirees is further improved by the overlay. When the birth rate effect is also considered, such a sustainability effect is enhanced, and the welfare effect is weakened by superimposition.


