Article

A Numerical Simulation of the Interaction of Aggregate and Rockfill in a Gangue Fluidized Filling Method

1
School of Mines, China University of Mining and Technology, Xuzhou 221116, China
2
State Key Laboratory of Coal Resources and Safe Mining, China University of Mining and Technology, Xuzhou 221116, China
3
Department of Civil Engineering, University of Ottawa, Ottawa, ON K1N 6N5, Canada
*
Author to whom correspondence should be addressed.
Sustainability 2022, 14(19), 12838; https://doi.org/10.3390/su141912838
Submission received: 14 August 2022 / Revised: 11 September 2022 / Accepted: 3 October 2022 / Published: 8 October 2022
(This article belongs to the Special Issue Sustainable Geotechnical Engineering and Rock Mechanics)

Abstract

:
To solve the problem of gangue discharge in coal mining, fluidized gangue filling technology was developed. The key scientific problem of this technology is the diffusion characteristics of the gangue in the goaf. Therefore, a discrete element fluidized gangue model was established based on the ARR contact model. Based on the Rblock module, a goaf model with a certain void ratio was created, and the meso-parameters of fluidized gangue were calibrated. The fluidized gangue diffusion and rock displacement laws were explored under different grouting speeds, void ratios, and gangue particle sizes. The research results show that with the increase in the grouting speed and void ratio, and the decrease in the gangue particle size, the diffusion radius gradually increases, and the rock displacement in the goaf also gradually increases. Under given geological conditions, the total grouting mass of a single hole can reach 5.63 × 10⁴ kg.

1. Introduction

China is a major coal country and the world’s largest coal market. According to statistics, coal production capacity will remain at 3.9 × 10⁹ t in 2020 [1,2,3]. The level of coal development in China will further increase in the future. According to the prediction of the Chinese Academy of Engineering, in 2030 and 2050, China’s coal will account for 55% and 50% of the primary energy structure [4,5,6]. This large-scale coal development brings about a large amount of gangue discharge, and the cumulative amount of gangue piled up in the country has exceeded 6 × 10⁹ t [7,8,9]. These gangues will cause a large area of land to be occupied, a large amount of smoke and dust, and the emission of toxic and harmful gases. Therefore, the large-scale treatment of mine gangue is imperative.
Many scholars have researched gangue treatment technology and proposed a variety of gangue treatment and disposal methods. Conventional gangue treatment methods mainly include gangue power generation, gangue bricks, and gangue cement [10,11,12]. Traditional gangue disposal methods mainly include solid filling methods and cemented filling forms [13,14,15]. The solid filling method was proposed in 2008. Based on comprehensive mechanized mining, key filling equipment was added that can realize the parallel operation of coal mining and filling under cover of the same hydraulic support and safely and efficiently transport ground filling materials to underground filling [16,17,18]. The cemented filling method uses cement as the cementing material and gangue as the aggregate to make a certain concentration of slurry, filled into the goaf using the filling pipeline [19,20,21].
The above method can dispose of the gangue. For the movement characteristics of gangue in goaf, relevant scholars’ research shows that in the process of solid filling, gangue particles are compacted under the action of compaction mechanism, and the overall strength and natural rest angle of the gangue pile are improved [22,23,24]. During the filling process of cemented filling material, the slump of slurry decreases with the increase of gangue concentration, and the strength of the filling body increases with the growth of cement content [25,26,27].
For the above research results, the investment of solid and cemented filling methods is high, the process is complex, and the treatment capacity is low. The goaf of these two methods is well supported in advance, and the movement of gangue in it is essentially accumulation, so the study of its flow characteristics is meaningless. Summarizing the research results at home and abroad, some foreign scholars have studied the formation process and volume distribution of goaf cavities [28]. The effect of the particle size ratio and additives ratio on the slurry flow characteristics has also been further studied [29,30]. However, there has been little research on the interaction between crushed stone blocks and the slurry in the goaf. Therefore, this paper proposes a fluidized gangue filling method that can treat gangue on a large scale, has a simple process, and low investment cost. The discrete element model of fluidized gangue and the rock block model of goaf is established to explore gangue aggregate’s diffusion law under different working conditions, such as void ratio in goaf, grouting pressure, gangue particle size, and concentration. The diffusion range and grouting scale of fluidized gangue are calculated based on the actual geological conditions.

2. Test Background

2.1. Fluidized Gangue Filling Method

Fluidized gangue filling is proposed here. The filling material is gangue and water, the filling method is pipeline transportation, and the filling power is the pump. Coal mining will destroy the original stress balance of the overlying rock, resulting in the damage and deformation of the rock mass such as stretching, shearing, bending, caving, and fissures. During the mining process, the roof collapsed rock will fill part of the goaf, forming an underground void. These voids will provide space for filling. Firstly, the coal gangue is sorted underground, and then the large-size gangue is broken and mixed with water to prepare fluidized gangue, which is pumped to the gap of goaf through the filling pump and filling the pipeline. The gangue fluidization filling system includes the gangue crushing system, slurry preparation system, and slurry transportation system, respectively responsible for the preparation, transportation, and filling of fluidized gangue, as shown in Figure 1. The process of gangue from separation to filling is shown in Figure 2.

2.2. Key Scientific Issues

As the main filling space of fluidized gangue, goaf is characterized by uneven void quantity and diameter distribution. Therefore, the diffusion radius of fluidized gangue in goaf can only be used as the evaluation standard of filling effect. From the point of view of filling material, the particle size and aggregate concentration are the influencing factors of the filling effect. In terms of filling space, the void ratio of goaf is the influencing factor of the filling effect. In terms of filling power, pump pressure is an influencing factor affecting the filling effect. The numerical model of the interaction between fluidized gangue and goaf is established to explore the diffusion law of fluidized gangue and lay a theoretical foundation for popularizing the fluidized gangue filling method.

3. Test Principle and Scheme

3.1. Simulation Method of Fluidized Gangue and Goaf

  • Simulation method of fluidized gangue
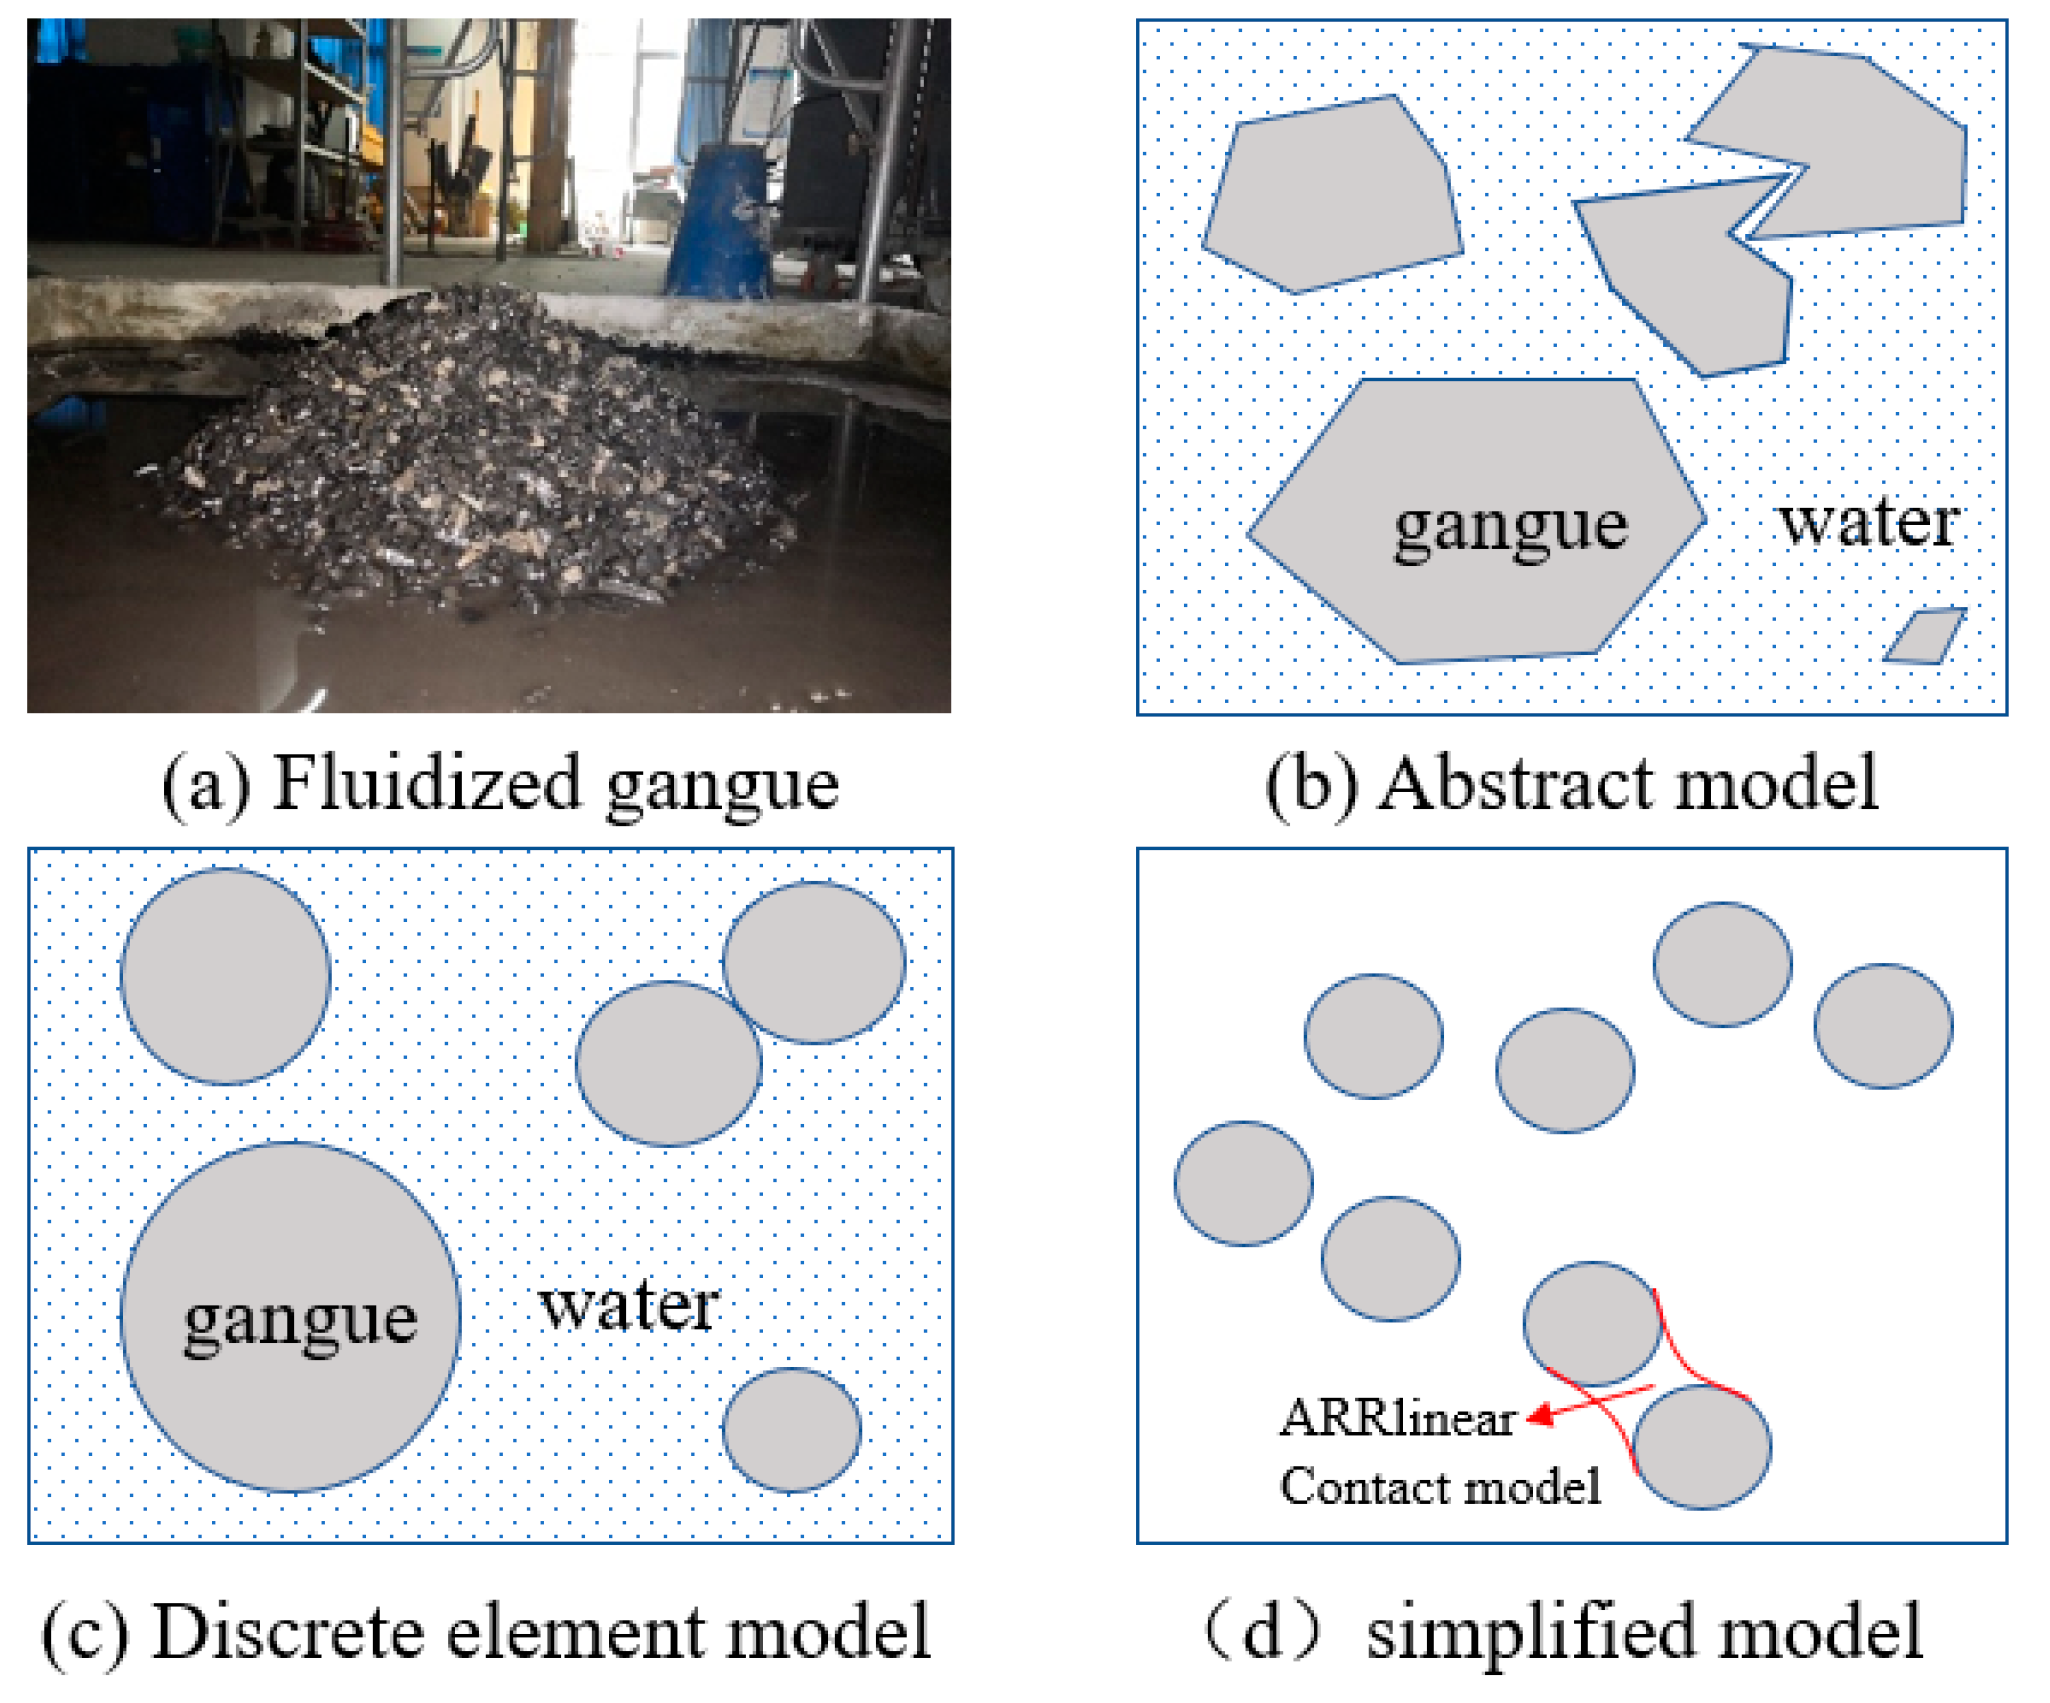
There are three main simulation methods for wet aggregate: single-phase fluid, discrete particle population, and suspension. The discrete particle group has great advantages. The discrete element unit can reconstruct the microstructure of fluidized gangue, and the calculation results can feedback the law of aggregate interaction in fluidized gangue. Therefore, when used to treat fluidized gangue, gangue aggregate is generally described by the discrete element [31,32,33]. In contrast, the ARR (adhesive rolling resistance) linear model describes water and mud, as shown in Figure 3.
The ARR model can represent the adhesion between particles caused by argillaceous material. The main parameters representing rolling are friction coefficient μ and rolling friction coefficient μr. The main viscosity parameters are the maximum attraction F0 and the attraction range D0. The above parameters are the parameters to be calibrated. The attraction Fa between argillaceous and gangue aggregate represents the cementation. It is calculated by the formula (1), where gs is the surface clearance.
F a = { F 0         g s 0     F 0 ( 1 g s D 0 )       0   < g s < D 0 0           g s D 0
2.
Simulation method of goaf
There are two construction methods for the rocks in the goaf: One is to construct the cluster unit based on the spherical particles and rock block template, and the other is to build the Rblock unit based on the rock block template. Using the Rblock element to make rock blocks can improve the balance speed of the software and reduce the probability of broken sphere particles flying out of the domain during a collision. The full name of Rblock is the rigid block, and it is a closed convex rigid block. The inertia tensor is updated in real-time by using the rotating dynamic equation. The contact information among Rblock-facet, Rblock-Rblock, and Rblock-ball is detected and calculated in real-time. Therefore, the interaction information between gangue aggregate and goaf rock can be obtained more accurately using the Rblock module.

3.2. Test Scheme

The experimental scheme is designed to study the effects of grouting speed, void ratio, and gangue particle size on the fluidization grouting effect. The single factor rotation method is used to calculate and analyze the influence of the above factors on the grouting diffusion range and the rock displacement in the goaf. A total of 13 groups of tests were carried out. The gangue selected for the test comes from the Pingdingshan coal mine in Henan province, and the lithology is mudstone with a density of 2.6 kg/m3. The test scheme is shown in Table 1. The third group was the basic experiment.

4. Model Parameter Calibration

4.1. Parameter Calibration Method

Because PFC is a discrete element simulation software, it is necessary to calibrate the parameters of fluidized gangue before simulation, to establish a correspondence between micro parameters and macrophysical parameters [34,35,36]. For the calibration process, as long as the macro-physical parameters exhibited by the interaction between particles are the same as the actual parameters of the fluidized gangue filling material, the adopted parameters can be used to simulate the fluidized gangue. Therefore, the stacking and L box tests were used to calibrate the parameters. The design parameter calibration scheme is shown in Table 2. Design a four-factor three-level orthogonal experiment scheme, a total of 9 groups of experiments. The levels of friction resistance Fric are 0, 0.15, and 0.75 respectively, the levels of rolling resistance coefficient Rfic are 0, 0.1, and 0.5 respectively, the levels of maximum attraction F0 are 0, 2.2 × 10³, and 1.1 × 10⁻² respectively, and the levels of attraction range D0 are 0, 1.5 × 10⁻⁴ and 7.5 × 10⁻⁴ respectively.
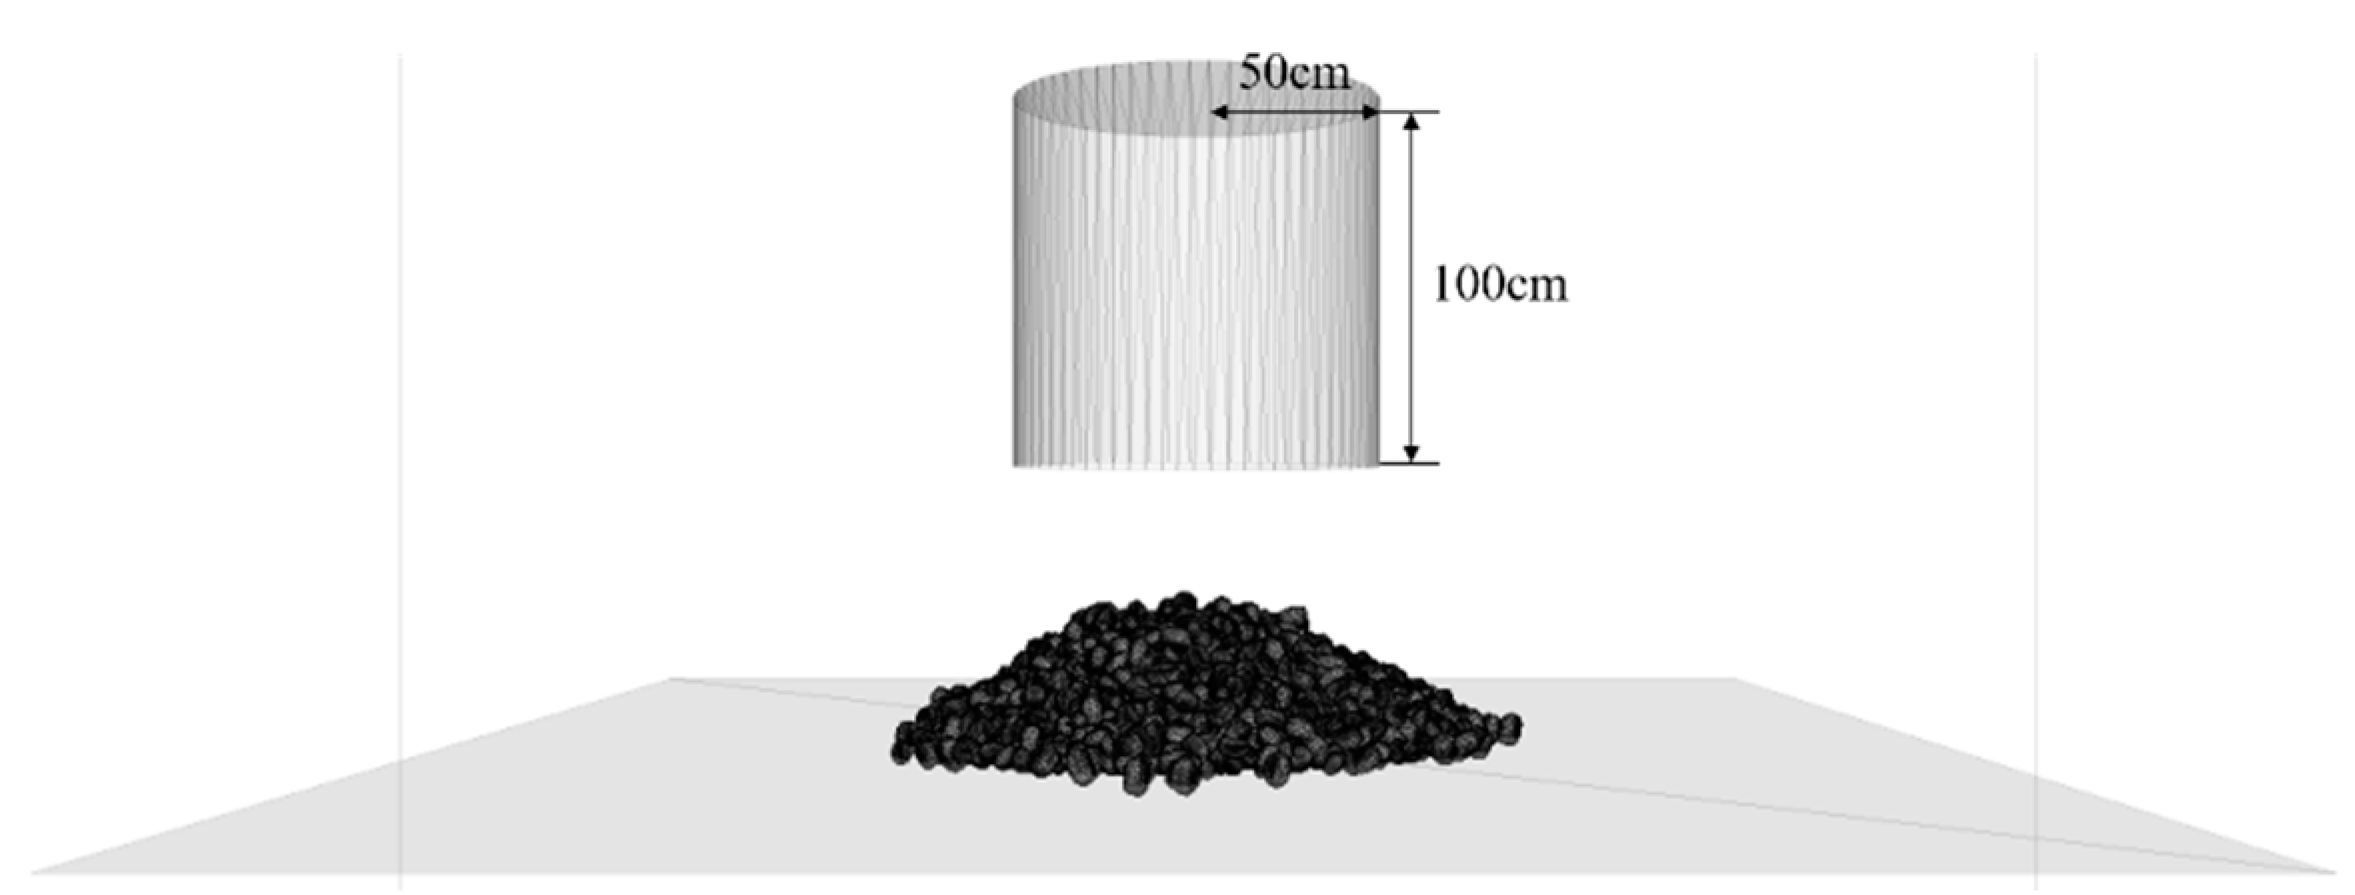
The model for designing the stacking test is shown in Figure 4. The test process is to slowly lift the drum, measure the slump of fluidized gangue after stabilization, and observe whether it is consistent with the laboratory test. The design of the l-box test model is shown in Figure 5. The test process is to open the door inside the L box and observe the flow trace of fluidized gangue.

4.2. Calibration Results of Atacking Test

The slump results of each scheme are shown in Table 3, and some results are shown in Figure 6. When the particle size of gangue is 5–10 mm, the actual slump measured in the laboratory is 172 mm, similar to test 5. Therefore, based on test 5, we continued to fine-tune the parameters for the correction test. The adjusted friction coefficient is 0.75, the maximum attraction is 2.2 × 10⁻³, the attraction range is 7.5 × 10⁻⁴, and the rolling friction coefficient is 0.1. The slump is 172 mm, which is in line with the physical test results, as shown in Figure 6f.

4.3. L Box Calibration Results

The flow traces of some schemes are obtained as shown in Figure 7.
It can be seen from Figure 7 that when the friction coefficient is 0.75, the maximum attraction is 2.2 × 10⁻³, the attraction range is 7.5 × 10⁻⁴, and the rolling friction coefficient is 0.1, the obtained flow trace is closest to the laboratory results, that is, the correction test, as shown in Figure 7f.

5. Model Establishment and Test

5.1. Model Establishment and Process

5.1.1. Goaf Construction

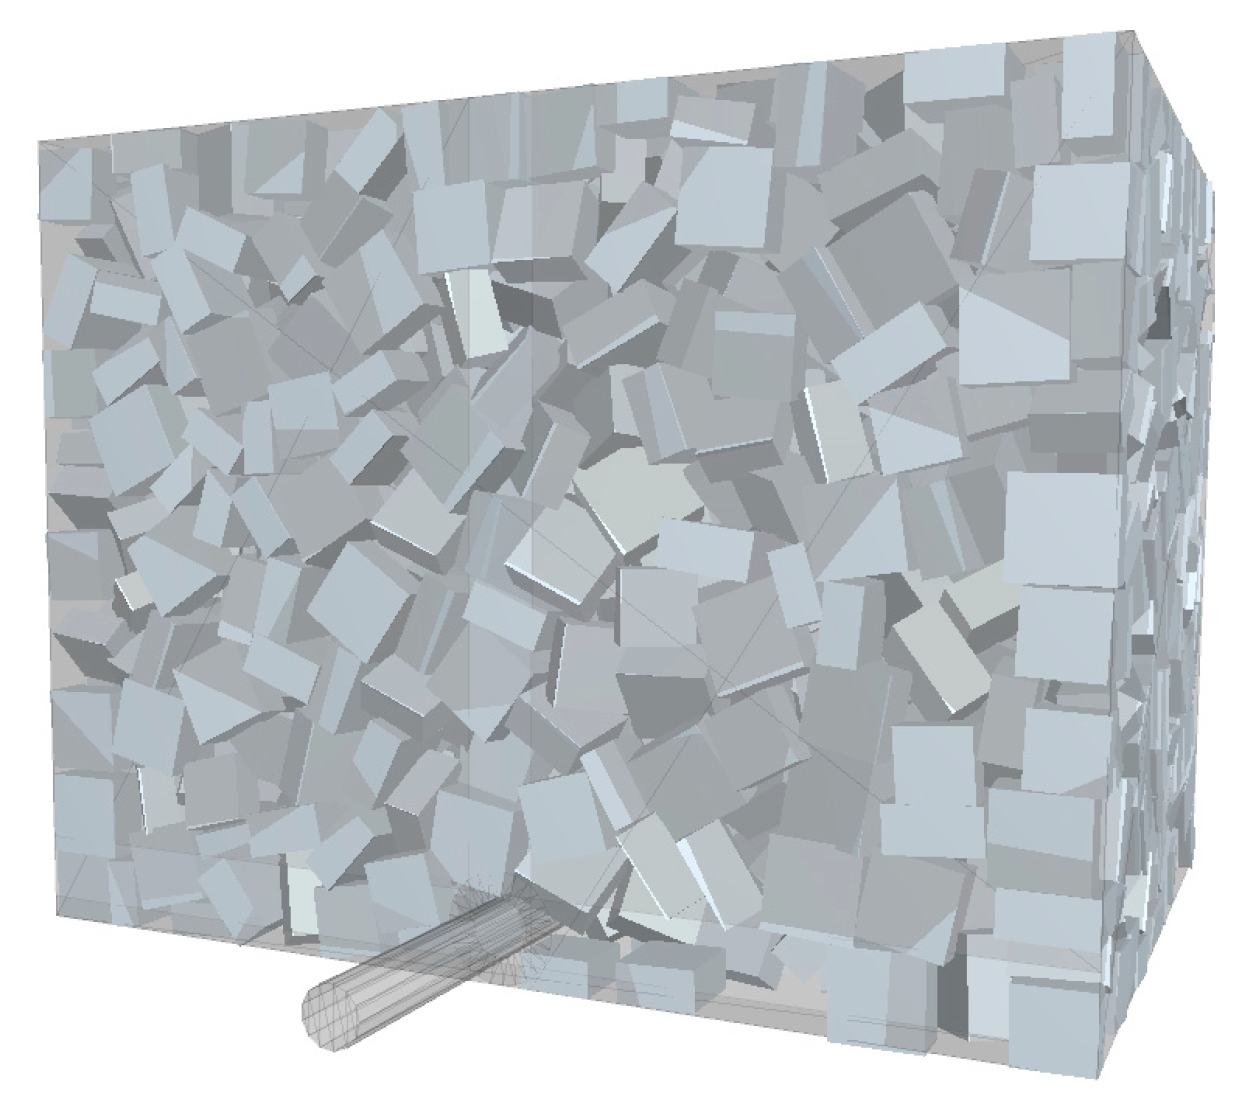
After obtaining the appropriate meso-parameters, the interaction model between the fluidized gangue and the rock in the mined-out area is designed. A box with a length, width, and height of 15 m × 20 m × 15 m is intended to indicate a certain range of goaf. There are stones with a certain void ratio inside to simulate a certain void ratio. And build a grouting pipeline outside with an inner diameter of 300 mm, the length of the outer pipeline in the goaf is 5.0 m, and the size of the internal pipeline is also 5.0 m. Extract the binary image of the rock in the mined-out area, calculate its length, width and height, and reconstruct the Rblock template in PFC3D. Finally, Rblock is filled with the entire goaf with a void ratio of 35%, and the goaf is obtained, as shown in Figure 8.

5.1.2. Construction of Fluid Gangue

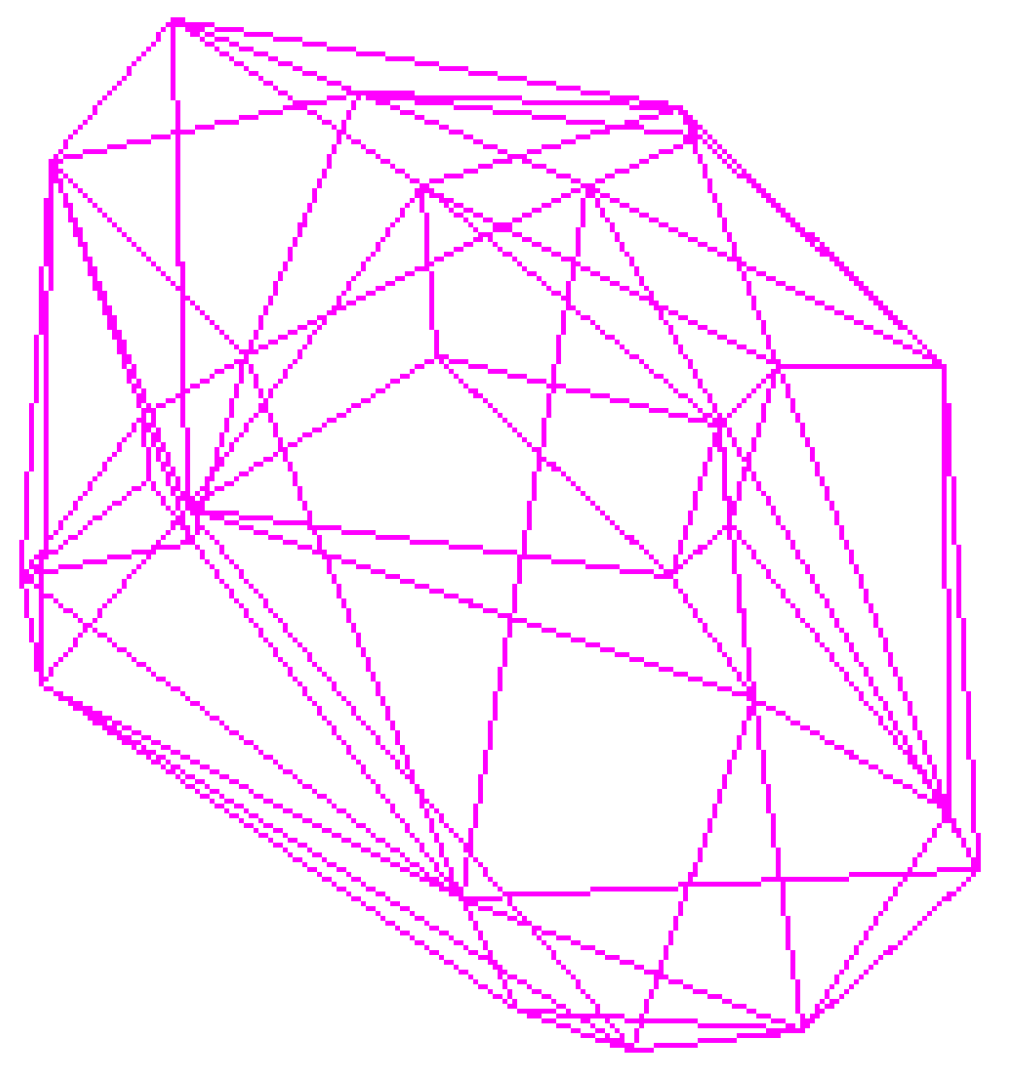
The representative gangue particles taken from the site were measured and photographed in the laboratory [37,38,39]. The captured gangue particles were analyzed in Matlab software, and the color image was transformed into a gray image by the rgb2gray command. Then, the gray was is processed by threshold binarization to generate a digital image. In CAD, multiple groups of closed curves were stacked and connected into a closed surface, and finally, the shape of gangue particles was obtained as shown in Figure 9.

5.2. Slurry Diffusion Law

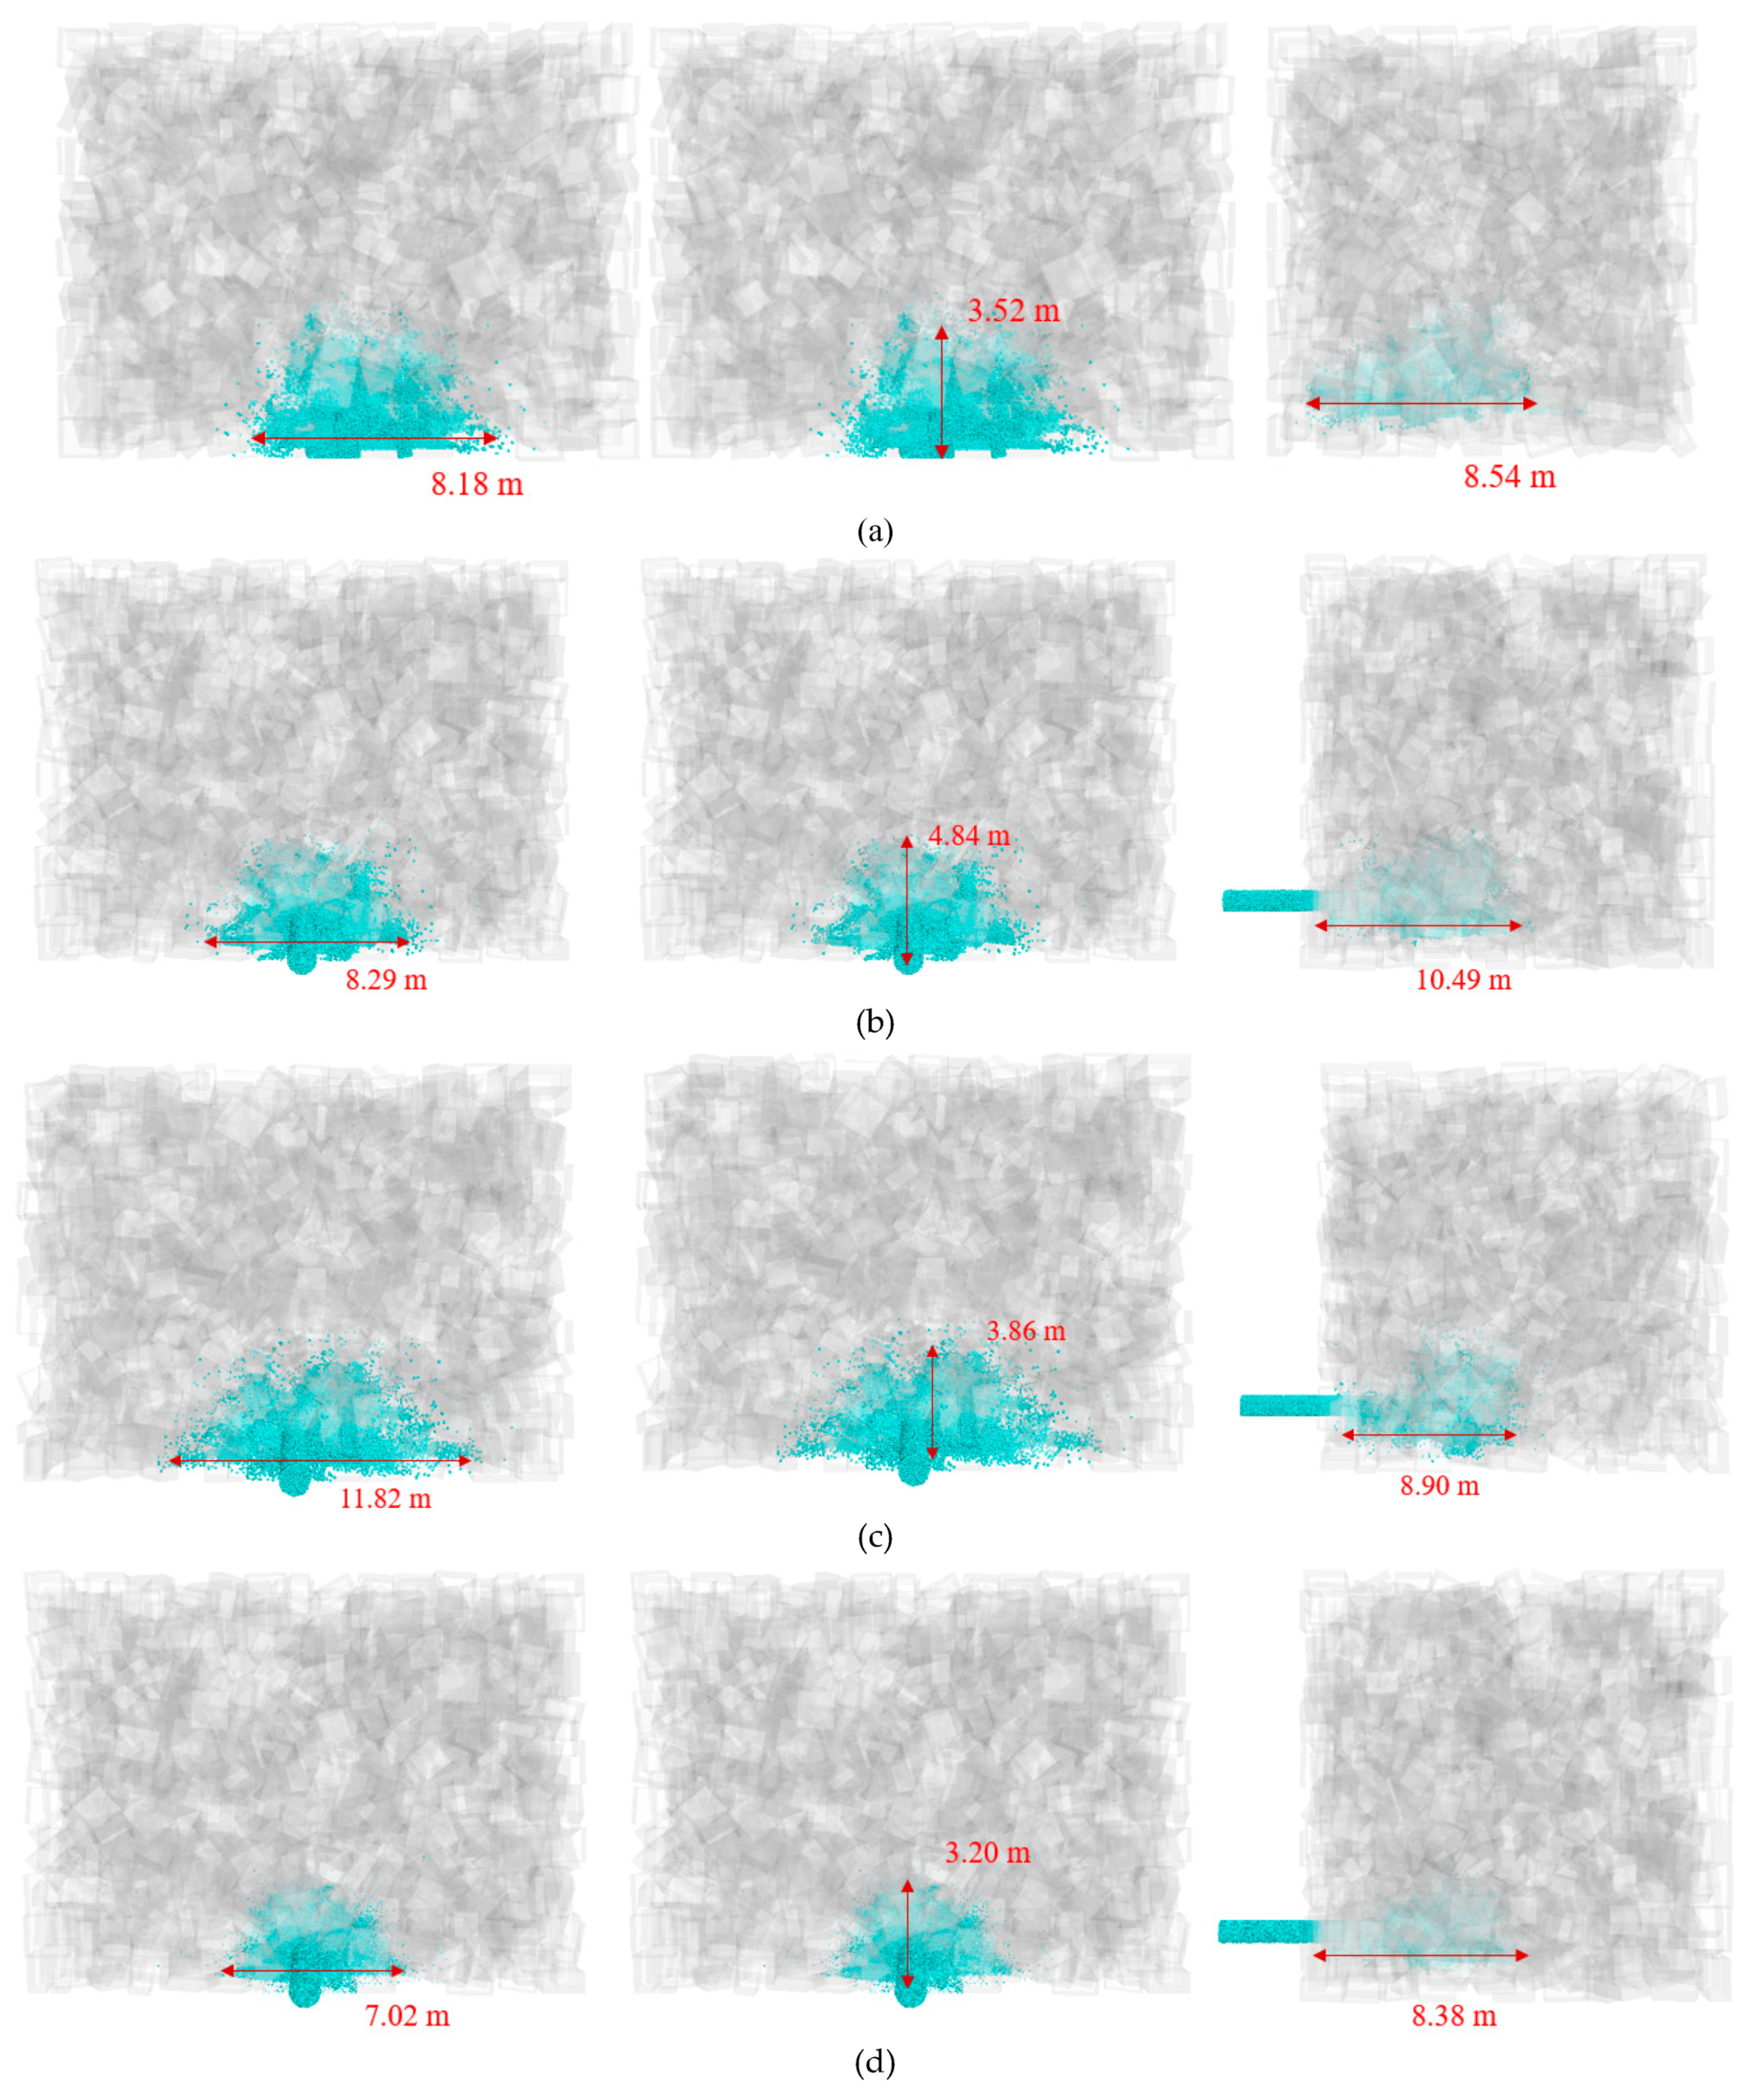
The numerical simulation process first generates the rock pile in the goaf, with a range of 15 m × 20 m × 15 m, rock with a certain void ratio is generated inside. Then, slurry particles with a particle size of 3–8 mm are generated in the grouting pipe, and a certain initial velocity is given outside the pipe. After the slurry leaves the grouting pipe, it will continue to advance a certain distance by relying on inertia and collide with the rocks in the goaf. Numerical simulation was carried out based on the conditions set in Table 1 to analyze the slurry diffusion range under different influencing factors, as shown in Figure 10. See Table 4 for test results.
It can be seen from Table 4 that the influence of grouting speed on slurry diffusion radius was analyzed in test 1, test 2, test 3, test 4, and test 5. When the grouting speeds were 10, 30, 50, 70, and 90 m/s, the diffusion ranges of slurry were 7.62 m × 7.63 m × 2.85 m, 7.95 m × 8.21 m × 2.90 m, 8.18 m × 8.54 m × 3.52 m, 8.22 m × 9.86 m × 3.63 m, and 8.29 m × 10.49 m × 4.84 m, respectively. With the increase of grouting speed, the slurry diffusion range increases gradually.
Test 6, test 7, test 3, test 8, and test 9 analyzed the effect of void ratio on slurry diffusion radius. When the voids were 0.15, 0.25, 0.35, 0.45 and 0.55, the diffusion ranges of slurry were 7.65 m × 6.82 m × 3.18 m, 8.16 m × 7.78 m × 3.50 m, 8.18 m × 8.54 m × 3.52 m, 9.50 m × 8.81 m × 3.54 m, and 11.82 m × 8.90 m × 3.86 m, respectively. With the increase of void fraction, the slurry diffusion range increases gradually, and the width direction rises obviously.
Test 10, test 11, test 3, test 12, and test 13 analyzed the influence of gangue particle size on slurry diffusion radius. When the particle sizes were 0.01, 0.03, 0.05, 0.07, and 0.09, the diffusion ranges of slurry were 8.81 m × 9.05 m × 3.86 m, 8.74 m × 8.58 m × 3.77 m, 8.18 m × 8.54 m × 3.52 m, 7.41 m × 8.50 m × 3.48 m, and 7.02 m × 8.38 m × 3.20 m, respectively. With the increase of particle size, the diffusion range of slurry decreases gradually.

5.3. Law of Rock Movement in Goaf

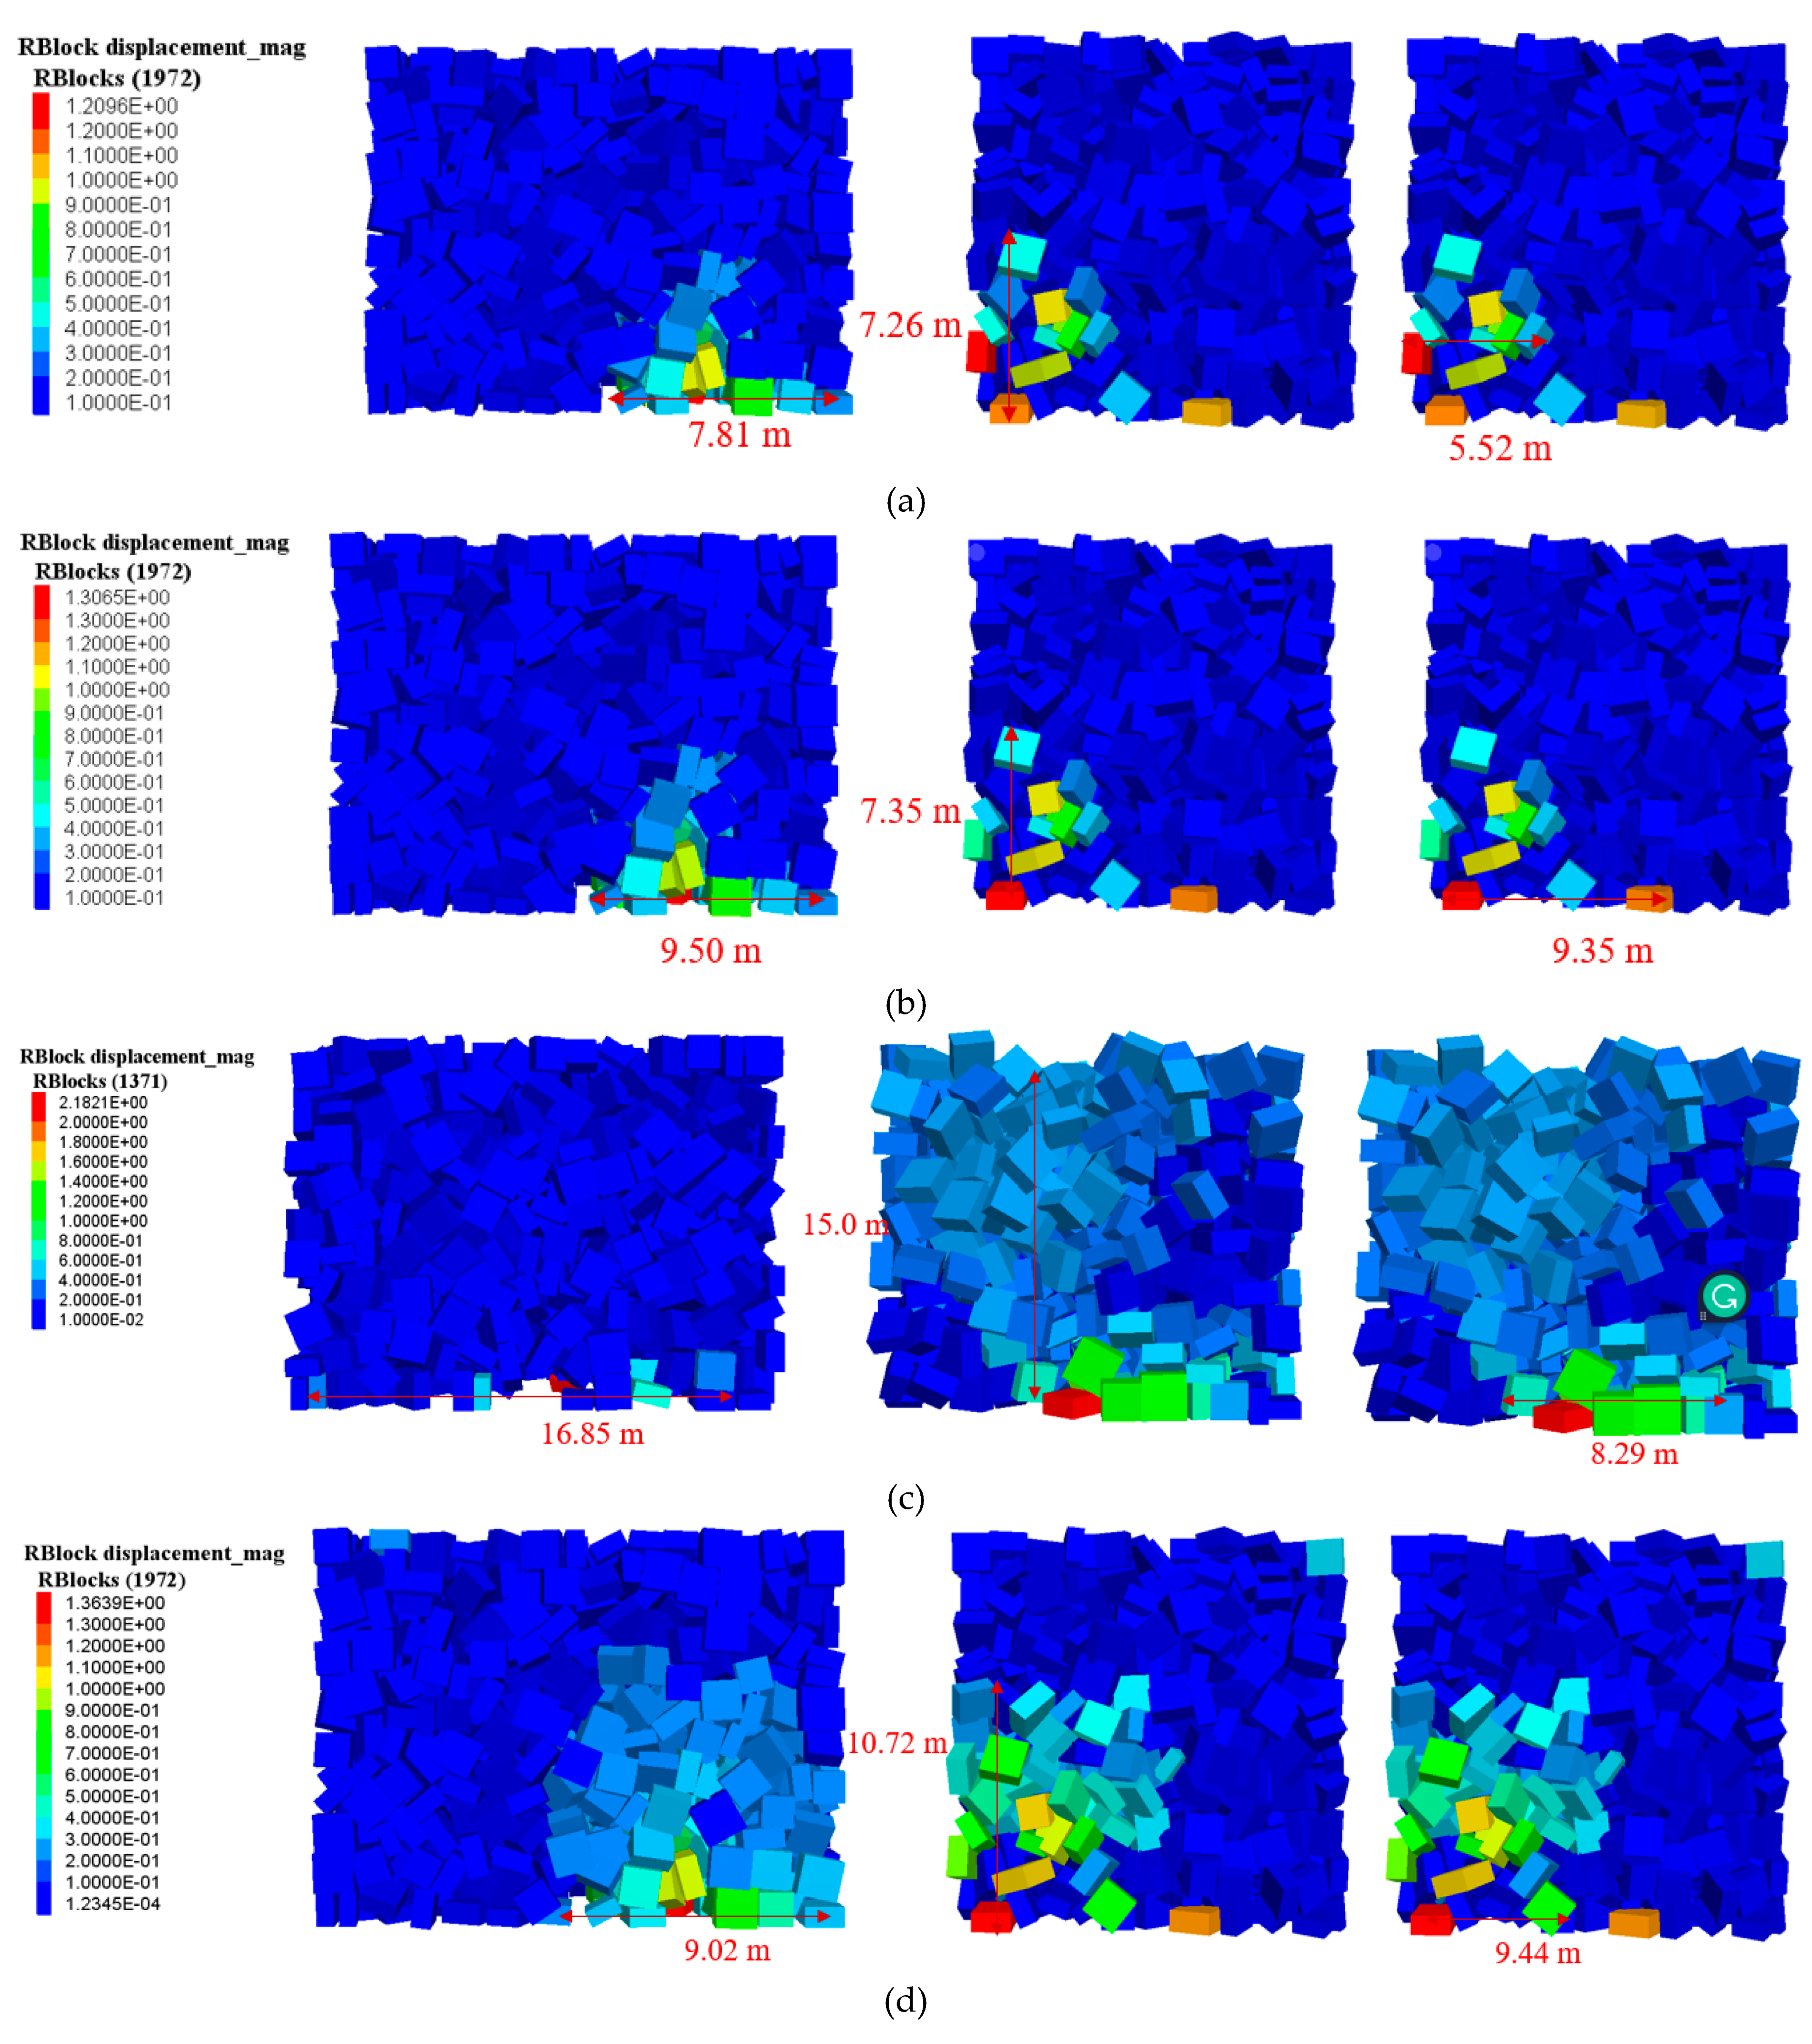
A numerical simulation was conducted based on Table 1 to analyze the influence range of rock movement in goaf under different influencing factors, as shown in Figure 11. See Table 5 for test results.
It can be seen from Table 5 that test 1, test 2, test 3, test 4, and test 5 analyzed the influence of grouting speed on rock displacement in goaf. When the grouting speeds were 10, 30, 50, 70, and 90 m/s, the influence ranges of rock displacement were 7.45 m × 3.38 m × 4.54 m, 7.60 m × 3.50 m × 4.68 m, 7.81 m × 5.52 m × 7.26 m, 7.84 m × 9.34 m × 7.29 m, and 9.50 m × 9.35 m × 7.35 m, respectively. With the increase of grouting speed, the influence range of rock displacement increases gradually. The maximum rock displacements were 1.086 m, 1.206 m, 1.210 m, 1.231 m, and 1.307 m, respectively.
Test 6, test 7, test 3, test 8, and test 9 analyzed the influence of void ratio on rock displacement. When the voids were 0.15, 0.25, 0.35, 0.45, and 0.55, the influence ranges of rock displacement were 6.05 m × 3.35 m × 1.49 m, 7.72 m × 5.26 m × 3.01 m, 7.81 m × 5.52 m × 7.26 m, 8.62 m × 7.44 m × 10.10 m, and 16.85 m × 8.29 m × 15.0 m, respectively. With the increase in grouting speed, the influence range of rock displacement increased gradually and was significantly affected in the width, depth, and height direction. The maximum rock displacements were 0.988 m, 1.237 m, 1.210 m, 1.728 m, and 2.182 m, respectively.
The influence of particle size on rock displacement was analyzed in test 10, test 11, test 3, test 12, and test 13. When the particle sizes were 0.01, 0.03, 0.05, 0.07, and 0.09 m, the influence ranges of rock displacement were 7.34 m × 4.34 m × 5.34 m, 7.42 m × 4.56 m × 6.42 m, 7.81 m × 5.52 m × 7.26 m, 8.91 m × 8.96 m × 9.73 m, and 9.02 m × 9.44 m × 10.72 m, respectively. With the increase of particle size, the influence range of rock displacement increases gradually and is significantly affected by in-depth direction and height direction. This is because at the same grouting speed, the larger the gangue particle size, the greater the kinetic energy, and the greater the rock displacement in the goaf under the impact of gangue particles. The maximum rock displacements were 1.205 m, 1.208 m, 1.210 m, 1.243 m, and 1.364 m, respectively.

6. Results Analysis and Discussion

6.1. Grouting Scale under Specific Conditions

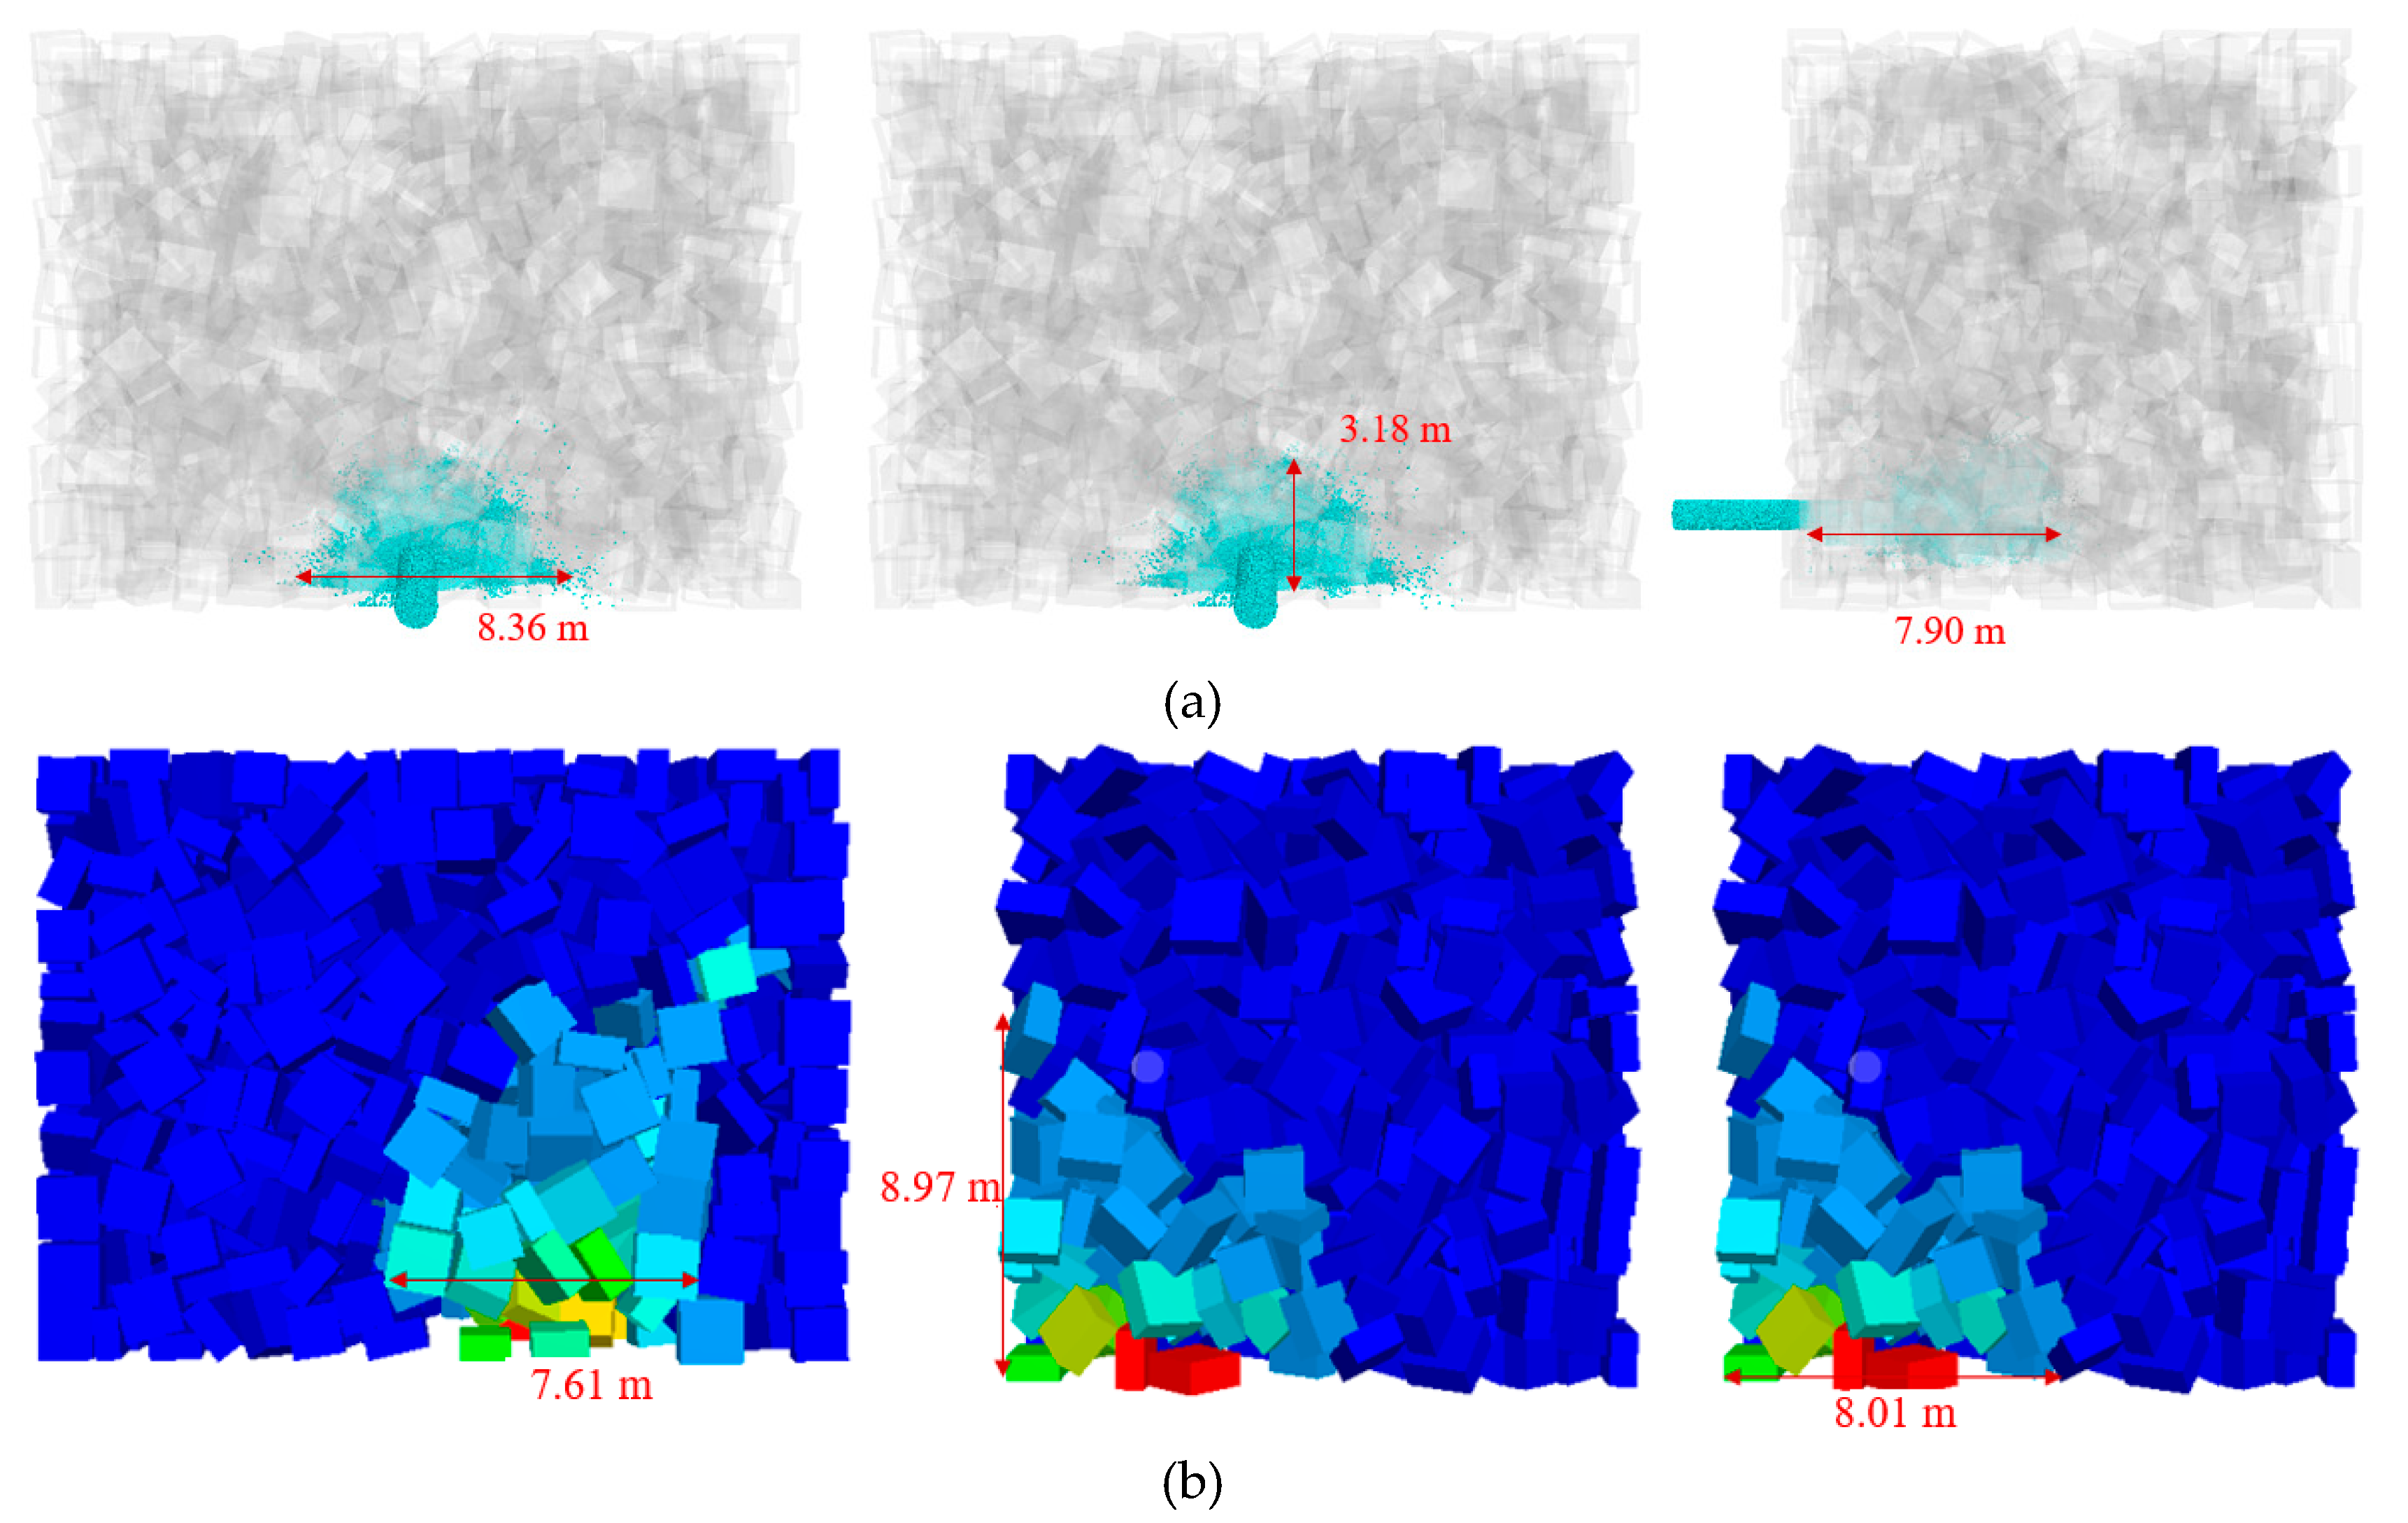
Based on the actual grouting conditions, the grouting time is set as 0.5 h, and the grouting speed is 5 m/s. When the void ratio of goaf is 35%, its diffusion width is 8.36 m, diffusion height is 3.18 m, and diffusion depth is 7.90 m. The influence radius of grouting on goaf rock is 7.61 m wide, 8.01 m deep, and 8.97 m high. The design function is used to calculate the total mass of fluidized gangue, and the PFC3D built-in fish function is used to write the code. Finally, the mass of fluidized gangue in goaf is 5.63 × 10⁴ kg. In the actual filling operation, the grouting quality of a single grouting mouth can reach 5.63 × 10⁴ kg. Slurry diffusion and rock displacement in goaf are shown in Figure 12.

6.2. Optimization and Adjustment of Grouting Technology

The range analysis method analyzes the influence of grouting speed, porosity, and particle size on slurry diffusion range, rock movement range, and maximum rock displacement. The range analysis table is shown in Table 6.
It can be seen from Table 6 that the porosity is the main factor affecting the diffusion range of slurry, the influence range of rock movement, and the maximum displacement of rock, followed by the grouting speed. The slurry diffusion width and rock movement width are seriously affected by porosity. Grout diffusion depth and rock movement depth are seriously affected by grouting speed. The grouting speed seriously affects the slurry diffusion height, and the height of the influence range of rock movement is seriously affected by the porosity. Therefore, the grouting speed should be improved to facilitate grouting, improve grouting depth, further improve grouting volume, and increase gangue treatment capacity.

7. Conclusions

Gangue fluidization filling is a large-scale method of treating gangue. The discrete element model of fluidized gangue and goaf rock is established to explore the interaction law between fluidized gangue and goaf rock. And the diffusion law of gangue aggregate and the influence range of goaf rock displacement under different working conditions are explored. The main conclusions are as follows:
  • The fluidization filling technology of gangue is developed. The interaction model between filling aggregate and goaf rock is constructed. The discrete element simulation method of Fluidized gangue is proposed, and the appropriate meso parameters of gangue are selected through a calibration test. The rock model of goaf based on Rblock structure is constructed.
  • The diffusion range of fluidized gangue under the influence of different grouting speeds, porosity, and gangue particle sizes are analyzed. With the increase of porosity, the diffusion width increases significantly. Diffusion depth and diffusion height are greatly affected by grouting speed. With the rise of grouting speed, diffusion depth and diffusion height increase significantly.
  • The influence range of rock displacement in goaf under the influence of different grouting speeds, porosity, and gangue particle size is analyzed. Porosity affects the maximum displacement of rock, and the range value is 1.194. The width and height of rock displacement are greatly affected by porosity, and the range values are 10.80 and 13.51. The influence depth of rock displacement is greatly affected by grouting speed, and the range value reaches 5.97.
  • To facilitate grouting, improve grouting depth, increase grouting volume, and increase gangue treatment capacity, grouting speed should be increased. When the grouting time is 0.5 h, and the grouting speed is 5 m/s, the single hole grouting amount reaches 5.63 × 10⁴ kg.

Author Contributions

Conceptualization, J.W.; validation, Y.W.; investigation, M.L. and M.S.; resources, M.L.; writing—original draft preparation, J.W.; supervision, M.S.; funding acquisition, J.Z. All authors have read and agreed to the published version of the manuscript.

Funding

This work was supported by the National Science Fund for Distinguished Young Scholars (51725403); the National Natural Science Foundation of China (52004271, 52130402); the China Postdoctoral Science Foundation (2021M693417); the Jiangsu Postdoctoral Research Funding Program (2021K039A).

Institutional Review Board Statement

Not applicable.

Informed Consent Statement

Not applicable.

Data Availability Statement

The original contributions presented in the study are included in the article; further inquiries can be directed to the corresponding author.

Acknowledgments

Thanks to the staff of the China University of Mining and Technology and the University of Ottawa for providing the laboratory.

Conflicts of Interest

The authors declare no conflict of interest.

References

  1. Yuan, J. The future of coal in China. Resour. Conserv. Recycl. 2018, 129, 290–292. [Google Scholar] [CrossRef]
  2. Lin, B.Q.; Liu, J.H. Estimating coal production peak and trends of coal imports in China. Energy Policy 2010, 38, 512–519. [Google Scholar] [CrossRef]
  3. Chen, W.; Xu, R. Clean coal technology development in China. Energy Policy 2010, 38, 2123–2130. [Google Scholar] [CrossRef]
  4. You, C.A.; Xu, X.C. Coal combustion and its pollution control in China. Energy 2010, 35, 4467–4472. [Google Scholar] [CrossRef]
  5. Li, J.; Hu, S. History and future of the coal and coal chemical industry in China. Resources. Conserv. Recycl. 2017, 124, 13–24. [Google Scholar] [CrossRef]
  6. Xie, K.; Li, W.; Zhao, W. Coal chemical industry and its sustainable development in China. Energy 2010, 35, 4349–4355. [Google Scholar] [CrossRef]
  7. Chen, H.; Qi, H.; Long, R.; Zhang, M. Research on 10-year tendency of China coal mine accidents and the characteristics of human factors. Saf. Sci. 2012, 50, 745–750. [Google Scholar] [CrossRef]
  8. Jiang, Y.D.; Pan, Y.S.; Jiang, F.X.; Dou, L.M.; Ju, Y. State of the art review on mechanism and prevention of coal bumps in China. J. China Coal Soc. 2014, 39, 205–213. [Google Scholar]
  9. Miao, X.X.; Qian, M.G. Research on green mining of coal resources in China: Current status and future prospects. J. Min. Saf. Eng. 2009, 26, 1–14. [Google Scholar]
  10. Yu, J.L.; Meng, F.R.; Li, X.C.; Tahmasebi, A. Power generation from coal gangue in China: Current status and development. In Advanced Materials Research; Trans Tech Publications Ltd.: Bäch, Switzerland, 2012; Volume 550, pp. 443–446. [Google Scholar]
  11. Zhou, C.; Liu, G.; Wu, S.; Lam, P.K.S. The environmental characteristics of usage of coal gangue in bricking-making: A case study at Huainan, China. Chemosphere 2014, 95, 274–280. [Google Scholar] [CrossRef] [PubMed]
  12. Zhang, Y.; Ling, T.C. Reactivity activation of waste coal gangue and its impact on the properties of cement-based materials—A review. Constr. Build. Mater. 2020, 234, 117424. [Google Scholar] [CrossRef]
  13. Zhou, H.; Hou, C.; Sun, X.; Qu, Q.; Chen, D. Solid waste paste filling for none-village-relocation coal mining. J. China Univ. Min. Technol. 2004, 33, 154–158. [Google Scholar]
  14. Jian-gong, L.I.U. Solid-filling technology in fully mechanized coal mining. Coal Chem. Ind. 2013, 36, 1545–1551. [Google Scholar]
  15. Cao, L.; Sun, F.; Chen, T.; Teng, Z.; Tang, Y.; Liao, D. Numerical simulation of liquid-solid conversion affecting flow behavior during casting filling process. Acta Met. Sin 2017, 53, 1521–1531. [Google Scholar]
  16. Zhong, Z.; Ooi, J.Y.; Rotter, J.M. The sensitivity of silo flow and wall stresses to filling method. Eng. Struct. 2001, 23, 756–767. [Google Scholar] [CrossRef]
  17. Ghirian, A.; Fall, M. Strength evolution and deformation behaviour of cemented paste backfill at early ages: Effect of curing stress, filling strategy and drainage. Int. J. Min. Sci. Technol. 2016, 26, 809–817. [Google Scholar] [CrossRef]
  18. Zhou, N.; Ma, H.; Ouyang, S.; Germain, D.; Hou, T. Influential factors in transportation and mechanical properties of aeolian sand-based cemented filling material. Minerals 2019, 9, 116. [Google Scholar] [CrossRef] [Green Version]
  19. Choudhary, B.S.; Kumar, S. Underground void filling by cemented mill tailings. Int. J. Min. Sci. Technol. 2013, 23, 893–900. [Google Scholar] [CrossRef]
  20. Yin, B.; Kang, T.; Kang, J.; Chen, Y.; Wu, L.; Du, M. Investigation of the hydration kinetics and microstructure formation mechanism of fresh fly ash cemented filling materials based on hydration heat and volume resistivity characteristics. Appl. Clay Sci. 2018, 166, 146–158. [Google Scholar] [CrossRef]
  21. Wu, J.; Feng, M.; Xu, J.; Qiu, P.; Wang, Y.; Han, G. Particle size distribution of cemented rockfill effects on strata stability in filling mining. Minerals 2018, 8, 407. [Google Scholar] [CrossRef] [Green Version]
  22. Wu, D.; Luo, F.; Li, M.; Diao, Y.; Guo, Y.; Xu, P. Macroscopic and microscopic study on the compression bearing characteristics and deformation failure mechanism of gangue with different particle sizes. Powder Technol. 2021, 383, 198–211. [Google Scholar] [CrossRef]
  23. Li, J.; Huang, Y.; Chen, Z.; Zhang, J.; Jiang, H.; Zhang, Y. Characterizations of macroscopic deformation and particle crushing of crushed gangue particle material under cyclic loading: In solid backfilling coal mining. Powder Technol. 2019, 343, 159–169. [Google Scholar] [CrossRef]
  24. Li, J.; Huang, Y.; Chen, Z.; Li, M.; Qiao, M.; Kizil, M. Particle-crushing characteristics and acoustic-emission patterns of crushing gangue backfilling material under cyclic loading. Minerals 2018, 8, 244. [Google Scholar] [CrossRef] [Green Version]
  25. Chang, Q.L.; Zhou, H.Q.; Hou, C.J. Using particle swarm optimization algorithm in an artificial neural network to forecast the strength of paste filling material. J. China Univ. Min. Technol. 2008, 18, 551–555. [Google Scholar] [CrossRef]
  26. Kong, D.; Pu, S.; Cheng, Z.; Wu, G.; Liu, Y. Coordinated deformation mechanism of the top coal and filling body of gob-side entry retaining in a fully mechanized caving face. Int. J. Geomech. 2021, 21, 04021030. [Google Scholar] [CrossRef]
  27. You, X.; Ren, F.Y.; He, R.X.; Ding, H.X. Research on compressive strength of cemented filling body in subsequent filling at the stage of open stope. J. Min. Saf. Eng 2017, 34, 163–169. [Google Scholar]
  28. Petlovanyi, M.; Malashkevych, D.; Sai, K.; Bulat, I.; Popovych, V. Granulometric composition research of mine rocks as a material for backfilling the mined-out area in coal mines. Min. Miner. Depos. 2021, 15, 122–129. [Google Scholar] [CrossRef]
  29. Pomykała, R.; Kępys, W. The properties of the backfill mixtures based on own fine-grained waste. In Minefill 2020–2021; CRC Press: Boca Raton, FL, USA, 2021; pp. 102–107. [Google Scholar] [CrossRef]
  30. Petlovanyi, M.; Malashkevych, D.; Sai, K.; Zubko, S. Research into balance of rocks and underground cavities formation in the coal mine flowsheet when mining thin seams. Min. Miner. Depos. 2020, 14, 66–81. [Google Scholar] [CrossRef]
  31. Cheng, Y.P.; Nakata, Y.; Bolton, M.D. Discrete element simulation of crushable soil. Geotechnique 2003, 53, 633–641. [Google Scholar] [CrossRef]
  32. Ng, T.T. Input parameters of discrete element methods. J. Eng. Mech. 2006, 132, 723–729. [Google Scholar] [CrossRef]
  33. Williams, J.R.; O’Connor, R. Discrete element simulation and the contact problem. Arch. Comput. Methods Eng. 1999, 6, 279–304. [Google Scholar] [CrossRef]
  34. Nannen, V.; Eiben, A.E. A method for parameter calibration and relevance estimation in evolutionary algorithms. In Proceedings of the 8th Annual Conference on Genetic and Evolutionary Computation, Seattle, WA, USA, 8–12 July 2006; pp. 183–190. [Google Scholar]
  35. Zhijia, L.; Penglei, X.; Jiahui, T. Study of the Xinanjiang model parameter calibration. J. Hydrol. Eng. 2013, 18, 1513–1521. [Google Scholar] [CrossRef]
  36. Hofmann, M. On the complexity of parameter calibration in simulation models. J. Def. Model. Simul. 2005, 2, 217–226. [Google Scholar] [CrossRef]
  37. Zhao, Y.; Zhang, Y.; Yang, H.; Liu, Q.; Tian, G. Experimental study on relationship between fracture propagation and pumping parameters under constant pressure injection conditions. Fuel 2021, 307, 121789. [Google Scholar] [CrossRef]
  38. Zhao, Y.; Zhang, Y.; Wang, C.; Liu, Q. Hydraulic fracturing characteristics and evaluation of fracturing effectiveness under different anisotropic angles and injection rates: An experimental investigation in absence of confining pressure. J. Nat. Gas Sci. Eng. 2022, 97, 104343. [Google Scholar] [CrossRef]
  39. Yu, Z.; Yongfa, Z.; Guodong, T.; Chaolin, W.; Jing, B. A new model for predicting hydraulic fracture penetration or termination at an orthogonal interface between dissimilar formations. Pet. Sci. 2022; in press. [Google Scholar] [CrossRef]
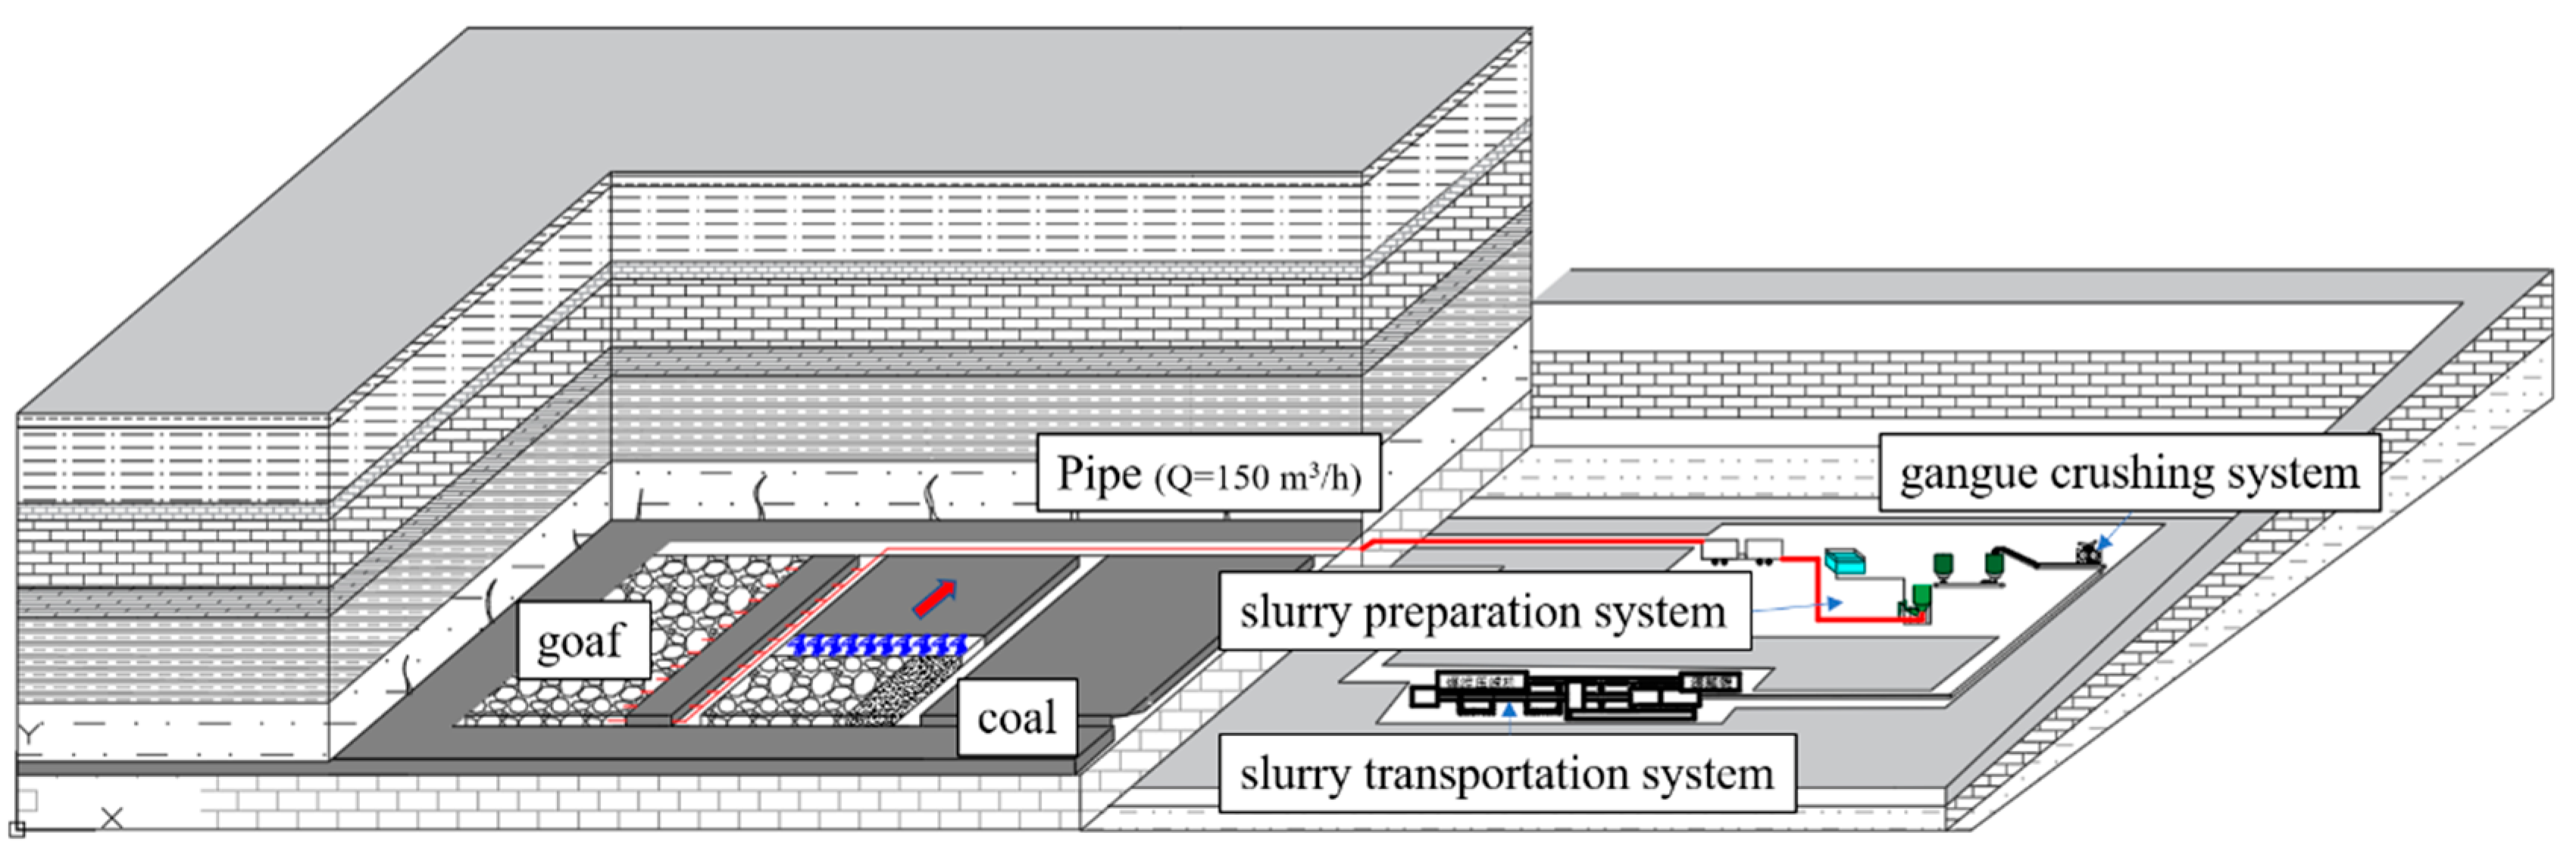
Figure 1. Fluidized gangue filling method.
Sustainability 14 12838 g001
Figure 2. Preparation, transportation, and filling process of fluidized gangue.
Sustainability 14 12838 g002
Figure 3. Simplified model of fluidized gangue.
Sustainability 14 12838 g003
Figure 4. Stacking test model.
Sustainability 14 12838 g004
Figure 5. L-box test model.
Sustainability 14 12838 g005
Figure 6. Partial stacking test results: (a) Test 1; (b) Test 3; (c) Test 5; (d) Test 7; (e) Test 9; (f) Correction test.
Sustainability 14 12838 g006
Figure 7. L box test results: (a) Test 1; (b) Test 3; (c) Test 5; (d) Test 7; (e) Test 9; (f) Correction test.
Sustainability 14 12838 g007
Figure 8. Overall construction of goaf.
Sustainability 14 12838 g008
Figure 9. Particle morphology of gangue.
Sustainability 14 12838 g009
Figure 10. Partial results of the slurry diffusion test: (a) Test3; (b) Test 5; (c) Test 9; (d) Test 13.
Sustainability 14 12838 g010
Figure 11. Partial results of influence range of rock movement: (a) Test 3; (b) Test 5; (c) Test 9; (d) Test 13.
Sustainability 14 12838 g011
Figure 12. Slurry diffusion and rock displacement in goaf: (a) Slurry diffusion; (b) Influence range of rock movement in goaf.
Sustainability 14 12838 g012
Table 1. General test scheme.
Serial NumberInfluence FactorGrouting Speed m/sVoid RatioParticle Size /m
1Grouting speed100.350.005
230
3
(Basic experiment)
50
470
590
6Void ratio500.150.005
70.25
80.45
90.55
10Particle size500.350.001
110.003
120.007
130.009
Table 2. Parameter calibration scheme.
FactorFricRfricF0/ND0/m
Test 10000
Test 200.12.2 × 10−31.5 × 10⁻⁴
Test 300.51.1 × 10−27.5 × 10⁻⁴
Test 40.1502.2 × 10−37.5 × 10⁻⁴
Test 50.150.11.1 × 10−20
Test 60.150.501.5 × 10−4
Test 70.7501.1 × 10−21.5 × 10⁻⁴
Test 80.750.107.5 × 10−4
Test 90.750.52.2 × 10−30
Correction test0.750.12.2 × 10−37.5 × 10⁻⁴
Table 3. Test results.
TestSlump/mmTestSlump/mm
Test 1292Test 6250
Test 2292Test 7120
Test 3232Test 8180
Test 4223Test 9150
Test 5168Correction test172
Table 4. Slurry diffusion range.
NumberFactorSlurry Diffusion Range
(Width × Deep × High = m × m × m)
1Grouting
speed
7.627.632.85
27.958.212.90
38.188.543.52
48.229.863.63
58.2910.494.84
6Void ratio7.656.823.18
78.167.783.50
89.508.813.54
911.828.903.86
10Particle size8.819.053.86
118.748.583.77
127.418.503.48
137.028.383.20
Table 5. Influence range of rock movement in goaf.
NumberFactorInfluence Range of Rock Movement
(Width × Deep × High)
The Maximum Displacement of Rock
1Grouting
speed
7.453.384.541.086
27.603.504.681.206
37.815.527.261.210
47.849.347.291.231
59.509.357.351.307
6Void ratio6.053.351.490.988
77.725.263.011.237
88.627.4410.101.728
916.858.2915.02.182
10Particle size7.344.345.341.205
117.424.566.421.208
128.918.969.731.243
139.029.4410.721.364
Table 6. Range analysis.
FactorsRange of Slurry DiffusionRange of Influence of Rock MovementRange Value of Maximum Displacement of Rock
WidthDepthHeightRange SumWidthDepthHeightRange Sum
Grouting
speed
0.672.861.995.522.055.972.8110.830.221
Void ratio4.172.080.686.9310.804.9413.5129.251.194
Particle size1.790.670.663.121.685.105.3812.160.159
Publisher’s Note: MDPI stays neutral with regard to jurisdictional claims in published maps and institutional affiliations.