Article

Spatial and Temporal Variation in Alpine Vegetation Phenology and Its Response to Climatic and Topographic Factors on the Qinghai–Tibet Plateau

1
College of Geomatics and Geoinformation, Guilin University of Technology, Guilin 541004, China
2
Guangxi Key Laboratory of Spatial Information and Mapping, Guilin University of Technology, Guilin 541004, China
*
Author to whom correspondence should be addressed.
Sustainability 2022, 14(19), 12802; https://doi.org/10.3390/su141912802
Submission received: 2 July 2022 / Revised: 15 September 2022 / Accepted: 28 September 2022 / Published: 7 October 2022

Abstract

:
Vegetation phenology changes are able to reveal climate-change-associated ecosystem feedback mechanisms. In this study, Qinghai–Tibet Plateau (QTP) alpine vegetation phenological information was extracted from the normalised difference vegetation index of the MOD13Q1 product collected from 2001 to 2020 using TIMESAT3.3 and S-G filtering and threshold dynamics methods. An analysis of data from the start of growth (SOG) and end of growth (EOG) seasons using a Theil–Sen median slope trend and partial correlation analyses revealed spatial and temporal variations in vegetation phenology related to climate change and topography, including: (1) significant spatial variation, gradually increasing southeast-to-northwest SOG delays and northeast-to-southwest EOG delays, with significant variations across vegetation types; (2) significant altitude-associated variations in the meadow, steppe, and shrub alpine vegetation types with high-altitude boundaries of 2400 m, 2800 m, and 2600 m, respectively, with delayed and earlier SOG and EOG below and above each boundary, respectively; and (3) spatial variations in relationships between vegetation phenology changes and climatic factors, where SOG negatively and EOG positively correlated with temperature and precipitation. The mean temperature in the 30 days before SOG and mean total precipitation in the 30 days before EOG were significantly correlated with SOG and EOG timing both negatively and positively, respectively. These results provide guidance for the monitoring of the alpine vegetation phenology on the QTP.

1. Introduction

Vegetation phenology, the scientific study of periodic changes in the life cycles of plants in response to environmental factors (e.g., precipitation, temperature, soil temperature, soil humidity, etc.) [1,2,3], can reveal indicators associated with ecosystem responses to environmental changes. Significantly, vegetation phenology can enhance our understanding of relationships between vegetation and climatic responses to formulate appropriate interventions to mitigate the effects of climate change on local environments, such as the Qinghai–Tibet Plateau (QTP). As a particular natural geographical unit, the cold and drought-tolerant alpine vegetation on the QTP plays a crucial role in balancing greenhouse gases and regulating the current climate and climate change [4,5]. During the past 50 years, the region’s climate warming rate has far exceeded the average global warming rate over the same period [6,7], posing an unprecedented environmental challenge within the greater context of accelerating global climate change. Therefore, it is crucial to investigate the effects of various environmental factors on phenological changes in the alpine vegetation by recording growth cycle patterns and trends related to different vegetation types to understand the impact of environmental factors on the QTP ecological environment.
Remote sensing technology, the main technical means used to study regional-scale phenology, has been widely used by scholars in phenological research to answer important questions related to climate change. For example, Tucker et al. [8] observed a significantly earlier start to the growth season (SOG) on the QTP from 1982 to 1990 based on advanced low-resolution radiometer-normalised difference vegetation index data (AVHRR 8 km NDVI dataset compatible with MODIS and SPOT vegetation NDVI data). In a later study, Cong et al. [9] used remote sensing data to investigate vegetation SOG changes in temperate regions of China from 1982 to 2010 and found that the vegetation SOG occurred significantly earlier (0.7–1.9 days) in 2010 compared to 1982. Notably, similar results were obtained by Huang Wenjie [10] and An Chunchun [11] for the alpine vegetation SOG on the QTP, which occurred slightly earlier each year, although significantly different end-of-growth season (EOG) results were obtained between these studies. Meanwhile, Yu et al. [12] and Li et al. [13] found that altitude influenced QTP alpine vegetation phenology. Although some progress has been made towards a better understanding of QTP vegetation phenology, a wide range of regions, altitude differences, climate, and vegetation types [10,13,14] have hindered these efforts. Therefore, in order to better understand the spatial and temporal variability in the alpine vegetation phenology of the QTP and the impacts of climate change on local-level ecological environments, the monitoring of different vegetation types and altitude gradient effects on phenological variability are urgently required to clarify the phenological response mechanisms associated with climate change.
The primary objectives of the study were: (1) to analyse the spatial and temporal distribution of phenological information of the alpine vegetation on the QTP and compare the differences of phenological information among different alpine vegetation types; (2) to analyse the spatiotemporal and inter-specific variations of the responses to alpine vegetation phenology to changes in temperature and precipitation; and (3) to investigate the differences in the alpine vegetation phenology information across altitude gradients.

2. Materials and Methods

2.1. Study Area Overview

The QTP, a region located in south–central Asia, has become a hotspot for global climate change research due to its unique geographical location and climate. This region extends southwards from the mountains on the northern edge of the Pamir Plateau, which lies to the north, to the Himalayas and extends eastward from the Kunlun and Qilian Mountains in the west to the Qinling and Loess Plateau [15]. Due to the fact that the average altitude of the QTP is greater than 4000 m, the characteristics of the terrain in this region markedly differ from the characteristics of surrounding areas. Moreover, the QTP is the birthplace of many significant rivers of international importance. Therefore, it is nicknamed the “Water Tower of Asia” [16], highlighting its crucial role as a water source for vast areas of the continent [17]. Overall, the QTP climate is characterised by low precipitation that decreases from the southeast to northwest, as well as low annual temperatures and high daily temperature fluctuations. However, due to its unique physical features, spatial distribution differences in climate are found in the region, as reflected by distinct dry and wet areas that support rich natural diversity, as reflected by numerous vegetation types. QTP vegetation types mainly include alpine meadow, alpine steppe, alpine grass and alpine shrub plant species, with alpine grasslands accounting for more than 50% of the total QTP area (Figure 1).

2.2. Data Sources and Data Pre-Processing

The data used in this study mainly included NDVI time series data, climate data, data related to vegetation types, and DEM data. NDVI time series data obtained from the MODIS data product (MOD13Q1) NDVI subset had a spatial resolution of 250 m and a temporal resolution of 16 days, covering the period from 2001 to 2020. The 2001–2020 QTP NDVI time series data were pre-processed from the MOD13Q1 image data, followed by batch stitching, projection conversion, resampling and cropping, and other pre-processing. Thereafter, the QTP NDVI data set was processed using the SG filtering of TIMESAT3.3 software to obtain new time series data.
Climatic data were downloaded from the China Meteorological Data Network (https://data.cma.cn/en (accessed on 20 January 2022)) in order to obtain the China Daily Terrestrial Meteorological Values Dataset (V3.0), which had a temporal resolution of 1 day. Shen et al. [18] found that the temperature in the 5 weeks before SOG and the total precipitation in the 30 days before SOG have a greater impact on vegetation phenology in most parts of the central and eastern QTP. Therefore, we choose the mean temperature and mean total precipitation in the 30 days before SOG and EOG to evaluate the response of vegetation phenology to climate change. Mean temperature and mean total precipitation in the 30 days before SOG and EOG, as well as the mean annual temperature and mean annual cumulative precipitation of the alpine vegetation were obtained across 20 years through interpolating Thin Plate Spline using AUNSPLIN software, and data were obtained from 181 meteorological stations on the QTP and surrounding areas (Figure 1).
The 1:100 million vegetation type map and DEM data were obtained from the Institute of Geographical Sciences and Resource Resources of the Chinese Academy of Sciences (https://www.resdc.cn/en (accessed on 20 January 2022)). The vegetation type map, which was officially released in 2001, has a spatial resolution of 1 km, and the DEM data have a spatial resolution of 250 m. In order to better analyse phenological changes of main vegetation types, the vegetation type map was resampled using the ArcGIS 10.7 platform to classify alpine vegetation into the alpine meadow, alpine steppe, and alpine shrub vegetation types.

2.3. Research Methods

2.3.1. Phenological Metrics

There were mainly two critical techniques used to identify vegetation phenology using remote sensing technology: One technique is the fitting and denoising of vegetation index time series data [19], and the other is phenology identification. This study adopted a combination of an S-G filter [20] and a dynamic threshold method [21] to identify phenology information. S-G filtering is a moving-window weighted averaging algorithm that reduces noise while maintaining the range and shape of the original NDVI curve without shifting, which can more realistically reflect the periodic changes in NDVI data. The dynamic threshold method was used to obtain the start of growth (SOG) and the end of growth (EOG) of each image element by setting different NDVI thresholds at the image element scale. Finally, the extraction threshold is set to 0.2 for SOG and 0.6 for EOG based on repeated experiments combined with previousstudies’s results. The SOG threshold point (EOG threshold point) is the point in time when 20% (60%) of the distance between the maximum and minimum values of the rising phase (falling phase) of the NDVI curve. The formula used for data extraction is as follows:
Y j = i = m m C i Y j + 1 N
NDVI ( t ) = ( NDVI max NDVI min ) × C i
Equation (1) is the main formula for S-G filtering. In (1), Yj is the fitted denoised time series data, Yj+1 is the original time series data, j is the value of the time series year, Ci is the filtering coefficient, N is the length of the filtering window, m is half of the length of N, i is the positive or negative value of m, and in this study, n = 4. In (2), NDVImax is the maximum value of vegetation NDVI in a year, NDVImin is the minimum value in the rising phase of NDVI, t is the time of vegetation SOG start in a year, and Ci is the distance between the above two. In the same way, the NDVI falling phase was used to determine the end time of vegetation EOG.

2.3.2. Theil–Sen Median Slope Estimation and Mann–Kendall (MK) Non-Parametric Test

Spatial and temporal variation trends of the alpine vegetation phenology were interpreted using the Theil–Sen median slope estimation and Mann–Kendall non-parametric test. The Theil–Sen median, also referred to as the Sen slope estimation, is a robust non-parametric method used to calculate trends that avoid the effects of errors and outliers [22,23]. This method is commonly used to conduct a trend analysis of long time series data collected over a long time period. The formula is as follows:
β = mean x b x a b a 2001 a b 2020
Mann–Kendall is a non-parametric statistical test with several advantages over similar methods: it does not require normally distributed time series data or a linear trend, and it is not affected by vacancies and outliers [24]. The formula is as follows:
Z = S 1 s ( S ) , S > 0 0 , S = 0 S + 1 s ( S ) , S < 0 , S = b = 1 n 1 a = b + 1 n sgn ( X b X a ) sgn ( X b X a ) = 1 , X b X a > 0 0 , X b X a = 0 1 , X b X a < 0 , s ( S ) = n ( n 1 ) ( 2 n + 5 ) 18
In (3), a, b are year a and year b, respectively; Xa and Xb are the alpine vegetation phenology values in year a and year b, respectively; β > 0 denotes a delayed trend of the alpine vegetation phenology; and β < 0 denotes an early trend of the alpine vegetation phenology. In (4), n is the length of time from a to b; sgn is a sign function; z is a statistic when |Z| > p at a specific significance level, and p denotes a significant change in the time series. Our paper judged that the change in the alpine vegetation phenology Sen trend at a 90% confidence level was significant.

2.3.3. Partial Correlation Analysis

The relationship between QTP alpine vegetation SOG and EOG and their responses to temperature and precipitation changes were investigated using partial correlation analysis based on the following equations:
(1)
Calculate the correlation coefficient:
r x y = i = 1 n x i x ¯ y i y ¯ i = 1 n x i x ¯ 2 i = 1 n y i y ¯ 2
(2)
Calculate the partial correlation coefficient:
r x y , z = r x y r x z r y z 1 r x z 2 1 r y z 2
In (5) and (6), x, y, and z represent alpine vegetation phenological information, temperature, and precipitation, respectively; rxy, rxz, and rxy,z, respectively, represent correlation coefficients between x and y, between x and z, and between x and y (after excluding the influence of z).

3. Results

3.1. Spatial and Temporal Distribution of Alpine Vegetation Phenology on QTP during 2001–2020

3.1.1. Spatial Distribution of the Mean Values of Alpine Vegetation Phenology on the QTP

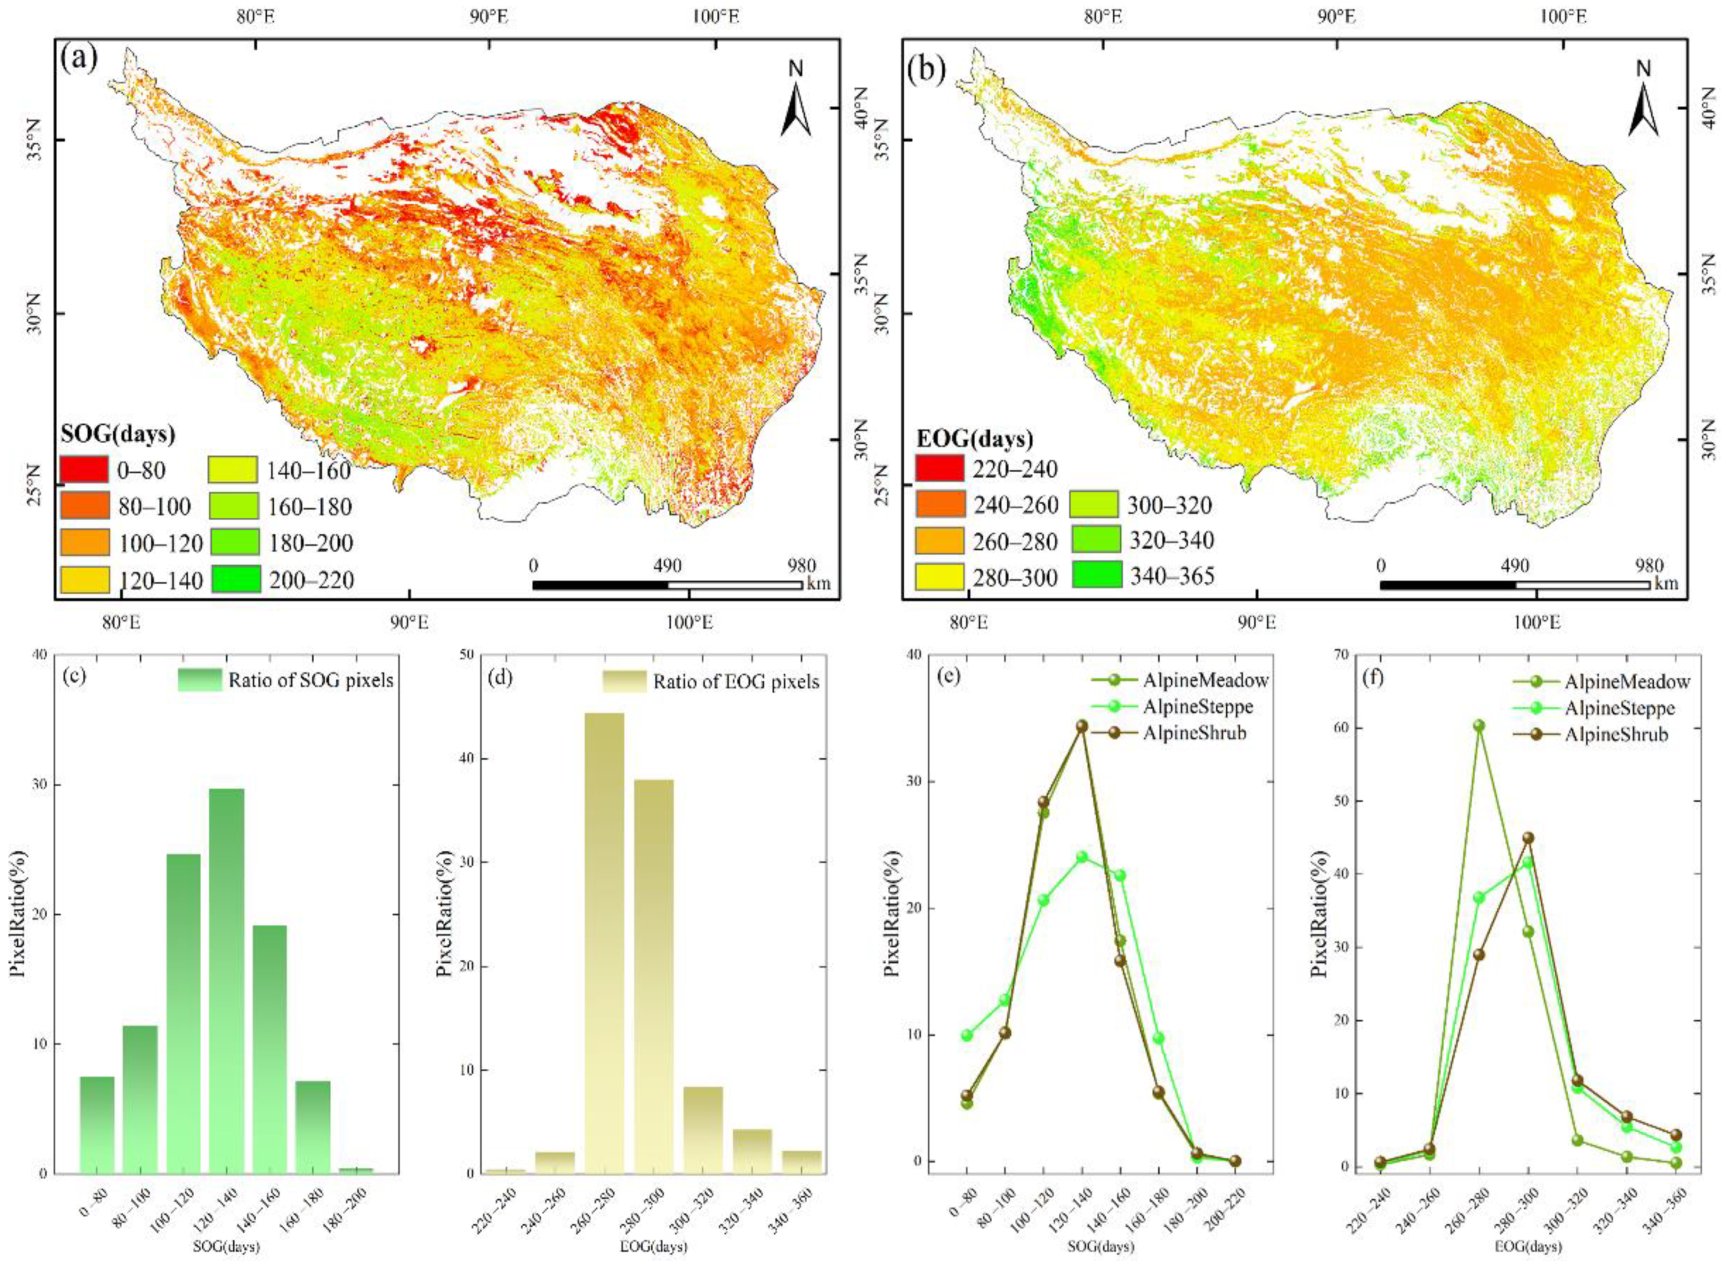
Significant spatial variations of mean values of key alpine vegetation phenology indicators on the QTP were observed from 2001 to 2020 (Figure 2). The SOG in eastern and central low-altitude areas of the QTP occurred between days 100 and 140 of each year; in the southern Xinjiang Uygur Autonomous Region, central Qinghai Province and northeast Gansu Province QTP regions, the SOG occurred between days 0 and 80 of each year. In the high-altitude areas of the Tibet Autonomous Region, the SOG occurred between days 140 and 160 of each year (Figure 2a). Ultimately, the SOG pixels of the alpine vegetation data from days 120 to 140 accounted for the largest percentage of pixels (29.68% of total pixels), followed by SOG pixels (24.62% of total pixels) from days 100 to 120 and SOG pixels from days 0 to 80 (7.51% of total pixels) (Figure 2c). Most of the SOG pixels in different time periods in the alpine meadow and alpine shrub were concentrated between days 120 and 140, and the percentage of the alpine steppe SOG pixels in 0–80 days was higher compared with the former (Figure 2e).
The EOG in QTP central and northeastern areas occurred between days 260 and 280 of each year; the EOG in high-altitude areas of the Tibet Autonomous Region, the Xinjiang Uygur Autonomous Region, and southeastern Sichuan Province occurred within days 280–300 of each year; the EOG in the western part of the QTP occurred between days 320 and 340 of each year (Figure 2b). Ultimately, EOG pixels of the alpine vegetation data from days 260 to 280 accounted for the largest percentage of pixels, followed by EOG pixels from days 260 to 280 (44.4% of total pixels), pixels from days 280 to 300 (38.01% of the total pixels), and pixels from days 220 to 240 (0.5% of the total pixels). Most of the percentage of EOG pixels in different time periods in the alpine steppe and alpine shrub were concentrated between days 280 and 300, while the percentage of the alpine meadow EOG pixels was most concentrated from days 260 to 280, a difference of about 20–30% compared to the former (Figure 2f).

3.1.2. Inter-Annual Variation of Alpine Vegetation Phenology on the QTP

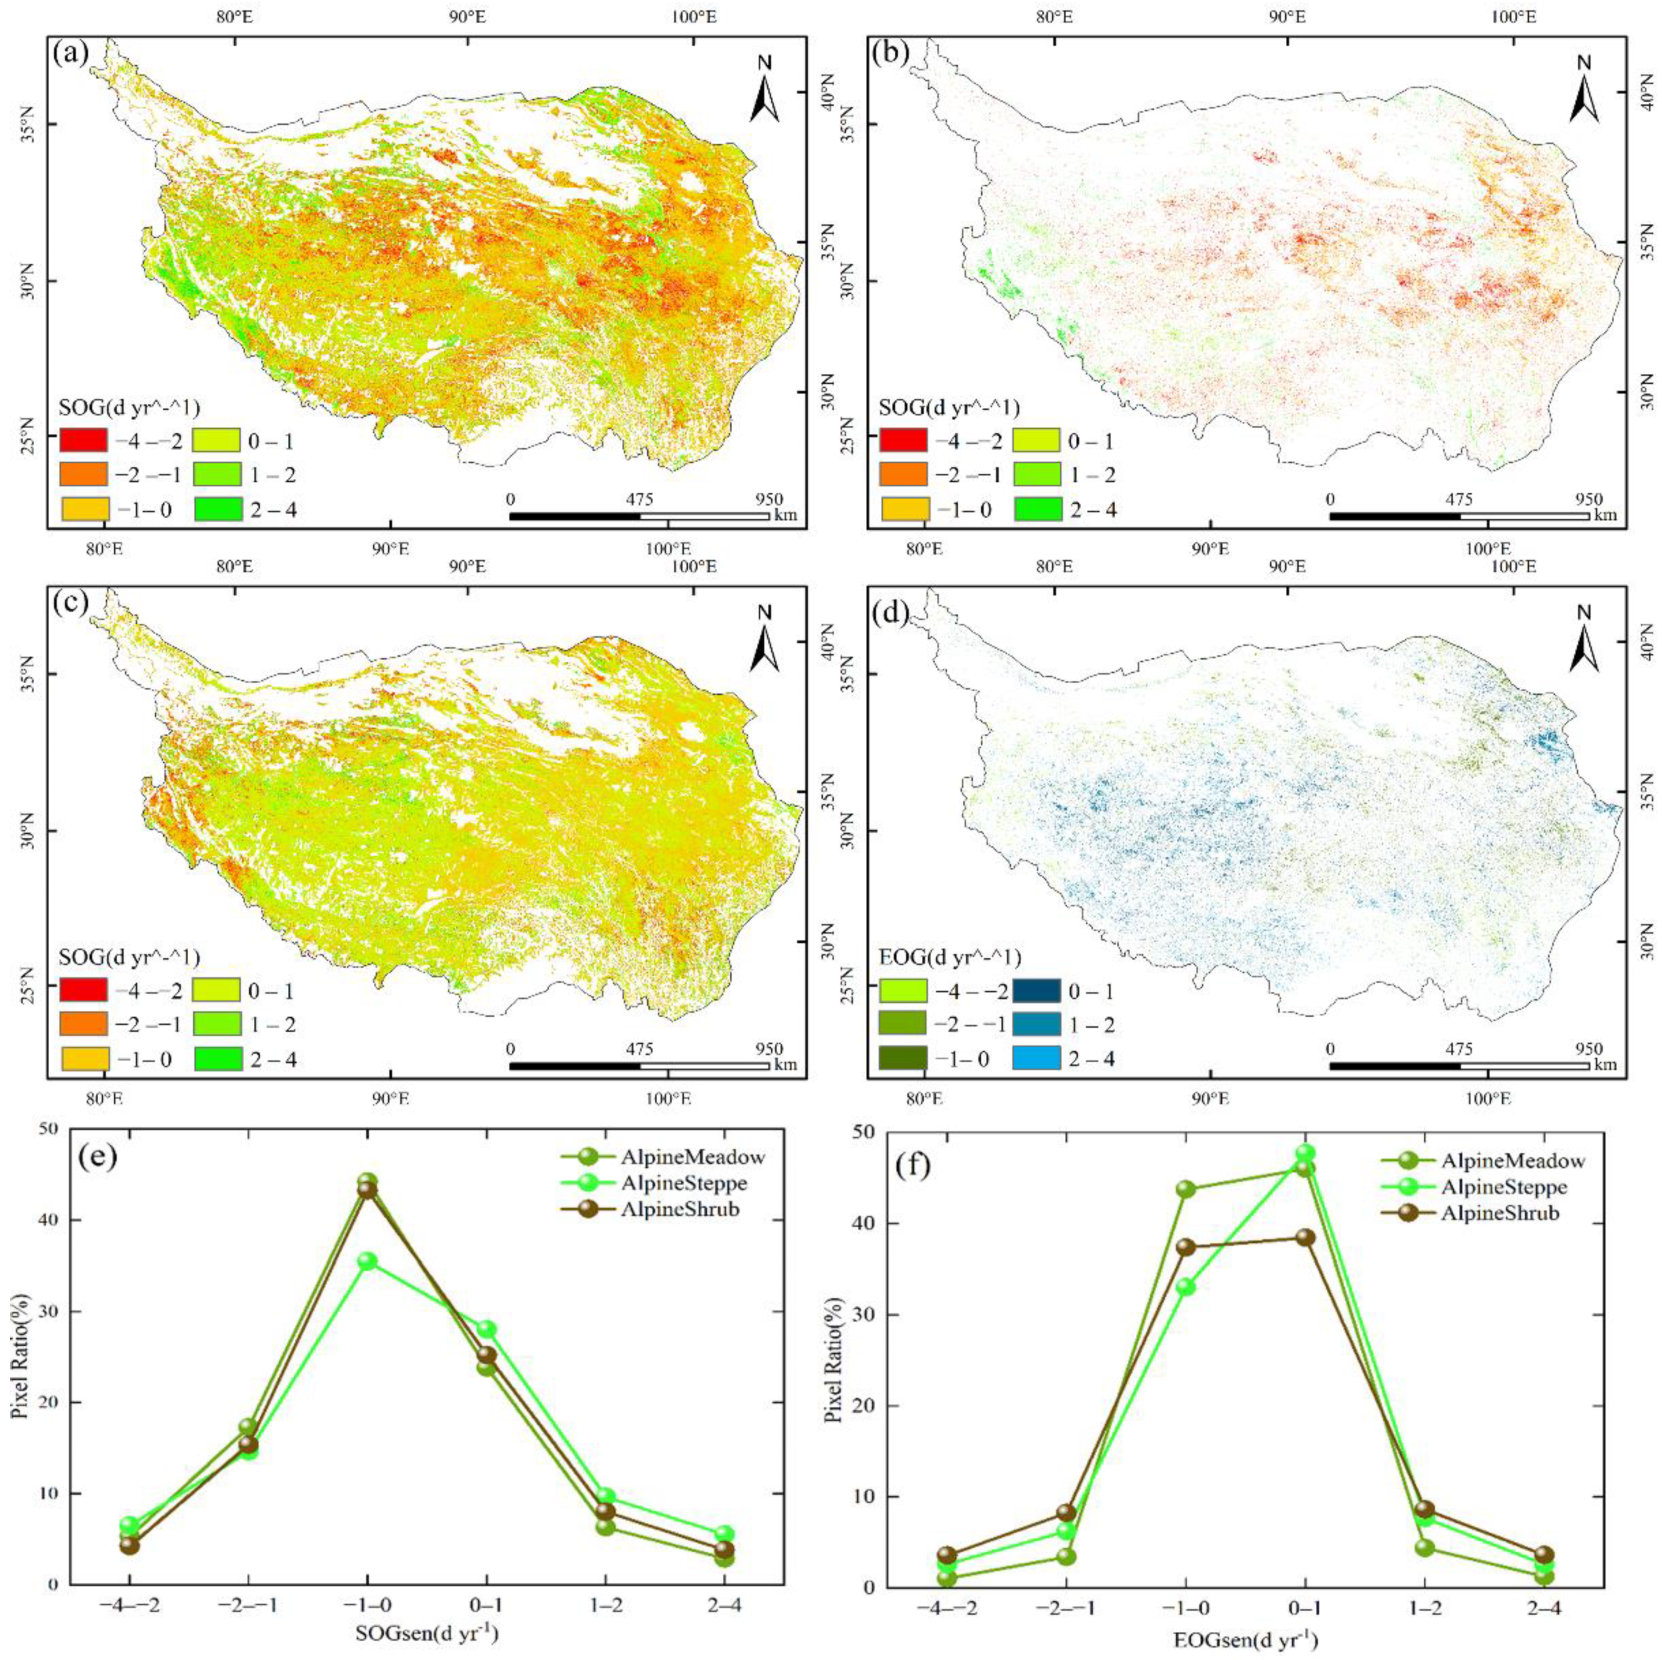
Inter-annual trends and spatial distribution of QTP vegetation phenology over the 20-year period (Figure 3) indicated that the SOG occurred earlier each year in most areas of Qinghai and Gansu Provinces (by 0–2 d year−1), while the SOG in the northernmost areas of Gansu Province and high-altitude areas at the edge of the Tibet Autonomous Region occurred later each year (by 1–2 d year−1) (Figure 3a). Regions that passed the MK nonparametric test (p > 90%) were mainly concentrated in high-altitude marginal areas in central, eastern, and southwestern QTP areas (Figure 3b). The trend interval with the largest percentage of pixels that passed the MK nonparametric test (p > 90%) was concentrated in (−2, −1) (39.07% of total pixels). In comparison, the smallest percentage that passed the Mk nonparametric test (p > 90%) was concentrated in (0, 1) (about 2.5% of total pixel).
The EOG generally occurred later each year (by 0–1 d year−1), with the EOG in the southwestern Tibet Autonomous Region showing a trend of earlier occurrence (by 1–2 d year−1) (Figure 3c). Regions that passed the MK nonparametric test (p > 90%) were mainly concentrated in the northeast and central QTP regions. The trend interval of the largest percentage of pixels that passed the MK nonparametric test (p > 90%) was concentrated in (0, 1) (28.02% of total pixels). In comparison, the trend interval of the smallest percentage of pixels that passed the Mk nonparametric test (p > 90%) was concentrated in (−2, −1) (7.37% of total pixels) (Figure 4d).
There are slight differences in the percentage of pixels in the inter-annual trends of the alpine vegetation phenology. The percentage of SOG pixels with an advanced trend of the alpine steppe in (−1, 0) was about 10% lower than that of the alpine meadow and alpine shrub; on the contrary, the percentage of the pixels with a delayed trend was higher than theirs (Figure 3e). The highest percentage of EOG pixels with a delayed trend of the alpine steppe was in the (0, 1), followed by the alpine meadow and alpine shrub, while the highest to lowest percentage of pixels in the (−1, 0) were alpine meadow, alpine shrub, and alpine steppe (Figure 3f).

3.1.3. Inter-Annual Phenological Variation of Different QTP Alpine Vegetation Types

During the 20-year period, trends analysis revealed that the SOG of three main vegetation types (alpine meadow, alpine steppe, and alpine shrub) were earlier each year, while the EOG were later each year (Figure 4). The SOG of the three vegetation types varied greatly, with alpine shrub consistently occurring more steadily each year than the other two vegetation types. The mean values of SOG for the alpine meadow, alpine steppe, and alpine shrub over the 20-year period were 122 days, 121 days, and 120 days, respectively. The SOG of the three vegetation types fluctuated the most, from 2009 to 2010, with SOG dates of the alpine meadow, alpine steppe, and alpine shrub varying by 41 days, 29 days, and 21 days, respectively. By contrast, the EOG of the three vegetation types varied steadily, where the mean values of EOG of the alpine meadow, alpine steppe and alpine shrub in the last 20 years were 276, 285 and 287 days, respectively. From 2008 to 2011, the EOG of the alpine steppe was delayed (4.7 d year−1); meanwhile, the EOG of the alpine meadow and alpine shrub had fluctuating changes.
The statistical results of the rate of change of the maximum, mean and minimum values of the alpine vegetation types in the last 20 years (Table 1) revealed significant changes in the mean values of SOG for the three types of alpine vegetation that indicated a significant trend of earlier SOG dates each year, with SOG and EOG trends behaving basically as linear trends (Figure 4). The SOG of the alpine meadow was earlier each year and was the most apparent trend (about −0.4 d year−1), while that of the alpine steppe was least clear (−0.19 d year−1). EOG delays for the three vegetation types were similar (0.1–0.12 d year−1), while the maximum EOG delay trend for the alpine shrub was 2.05 d year−1, and the minimum EOG early trend was −1.97 d year−1.

3.2. Response of Alpine Vegetation Phenology to Climate Change and Altitude Gradient

3.2.1. Inter-Annual Variation of Temperature and Precipitation in QTP

In the last 20 years, the mean annual cumulative precipitation of the alpine vegetation on the QTP was 384.00 mm with an increasing trend, and the mean annual temperature was 0.4 °C with a slightly decreasing trend. During the periods of 2003–2004 and 2008–2009, there were slight inter-annual differences in mean annual cumulative precipitation and a significant increasing trend in mean annual temperature (Figure 5a). The mean total precipitation in the 30 days before SOG was 30.18 mm, and the mean temperature was −6.03 °C, which showed an increasing and decreasing trend, respectively (Figure 5b). The mean total precipitation in the 30 days before EOG was 142.67 mm, and the mean temperature was 14.41 °C, both of which showed an increasing trend between years (Figure 5c).

3.2.2. Response of Alpine Vegetation Phenology to Annual Climate Change

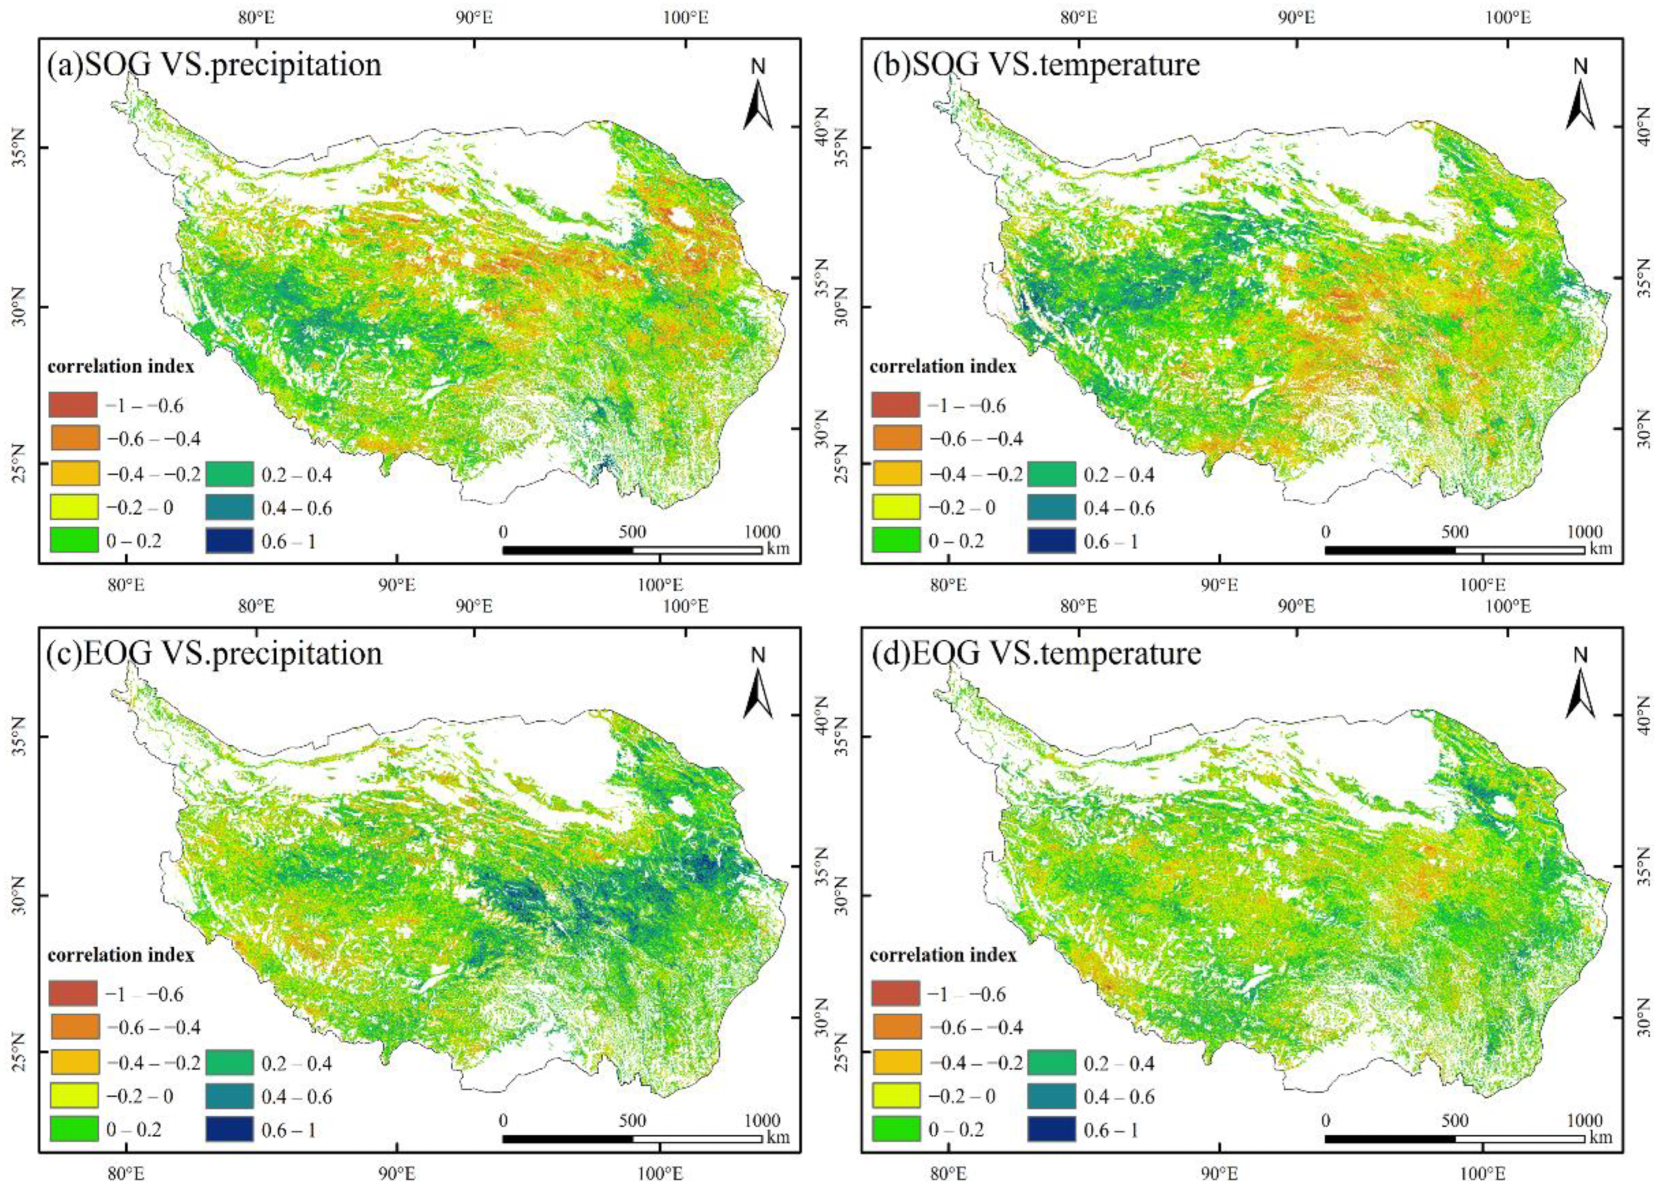
The response degree of QTP alpine vegetation phenology to climate factors of mean annual cumulative precipitation and mean annual temperature over the 20-year period (Figure 6) revealed apparent spatial differences in precipitation and temperature influences on alpine vegetation phenology. Precipitation effects of the alpine vegetation on SOG mainly indicated that increased precipitation from east to west is associated with earlier SOG (Figure 6a). More specifically, increased precipitation in the high-altitude Tibet autonomous region led to a significant delay of the alpine vegetation SOG, with the opposite effect observed in the low-altitude area of the eastern Qinghai Province. Meanwhile, the effect of temperature on alpine vegetation SOG mainly appeared as a gradually increasing delay of the SOG from southeast to northwest (Figure 6b). For example, the influence of temperature on alpine vegetation SOG in high-altitude areas of the Tibet Autonomous Region was greater than that of precipitation.
The effect of precipitation on the alpine vegetation EOG was more significant than that of temperature, with the spatial distribution showing later EOG followed by earlier EOG from the southeast to northwest (Figure 6c). More specifically, increased precipitation in the southern Qinghai Province and northeastern Tibet Autonomous Region led to a significant delay effect of the alpine vegetation EOG, with the opposite effect observed in the southwest of the Tibet Autonomous Region. The effect of temperature on the alpine vegetation EOG on the QTP of increased temperature spatially distributed with a delayed and then advanced effect from northeast to southwest (Figure 6d); notably, the early effect of temperature on alpine vegetation EOG at high altitude in Tibet Autonomous Region was more significant, with the opposite effect observed in the low-altitude areas in the eastern part of the QTP.

3.2.3. Response of Alpine Vegetation Phenology to Climate Change in the 30 Days before SOG and EOG

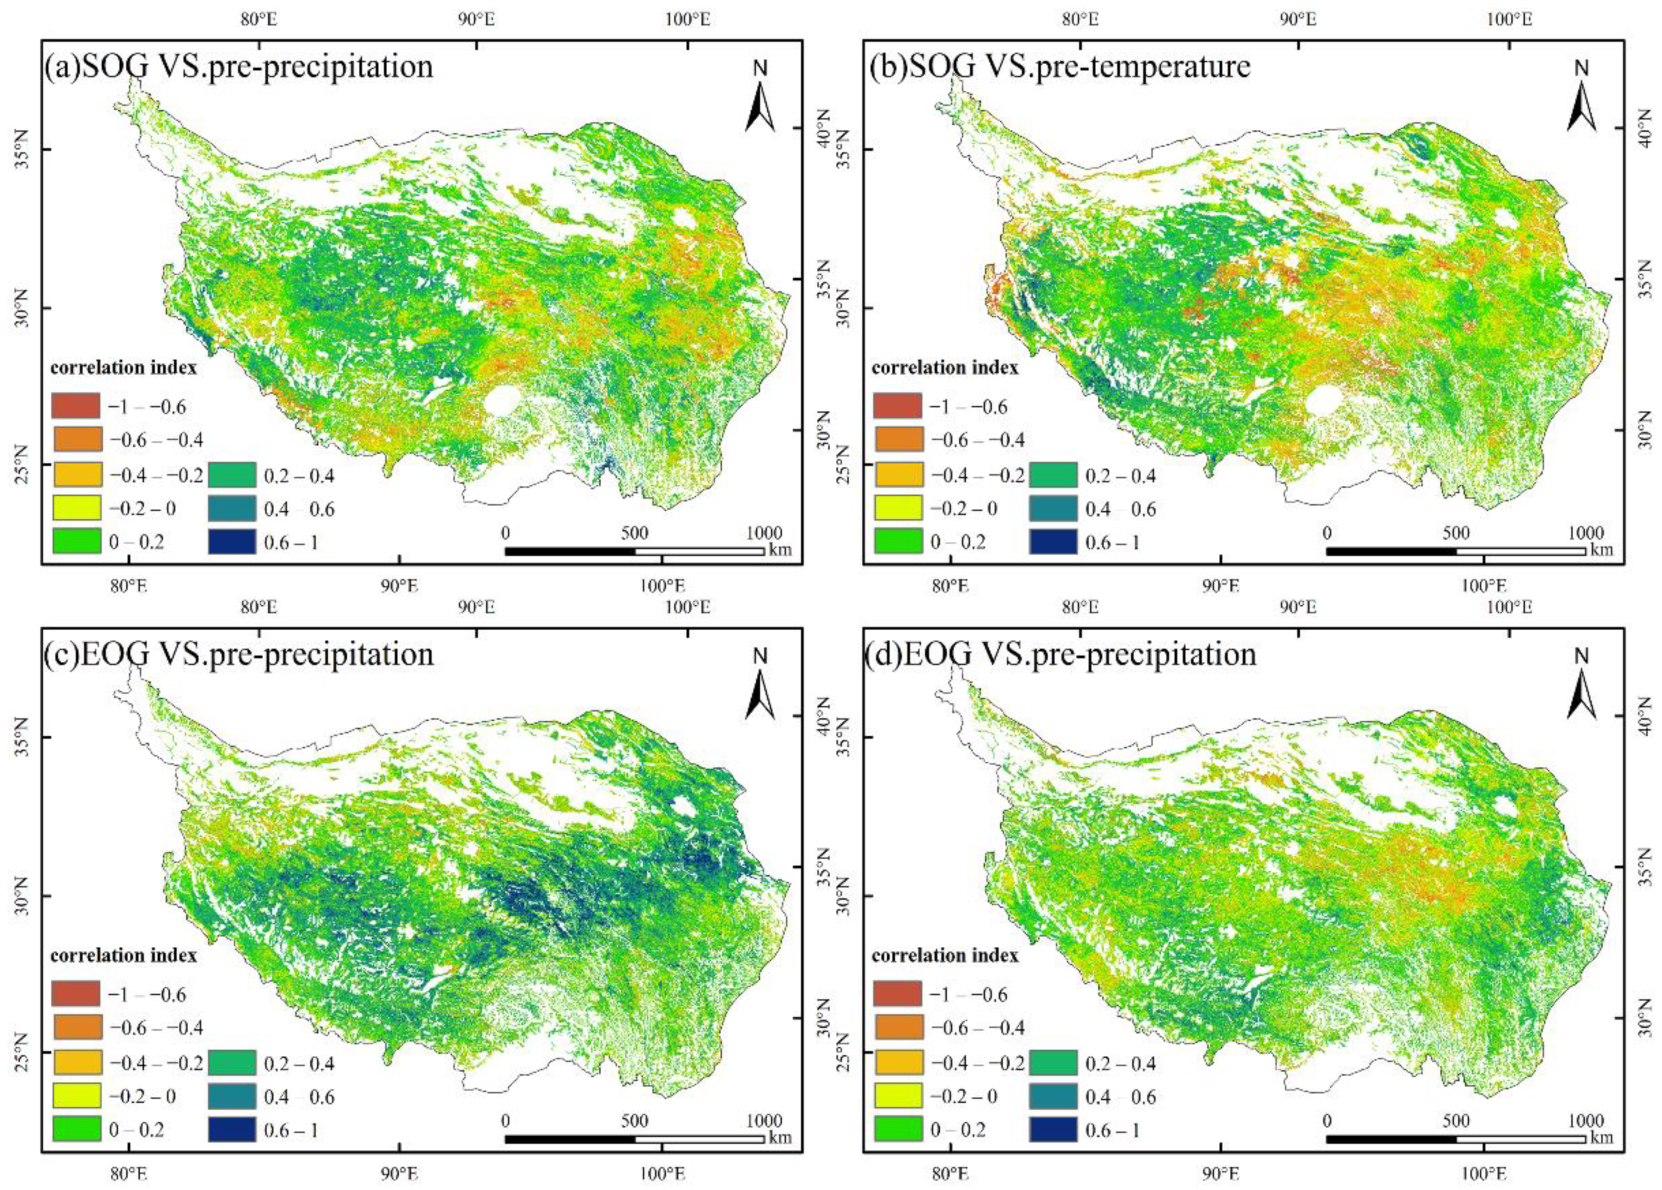
The mean temperature and mean total precipitation in the 30 days before SOG and EOG had more significant impacts on alpine vegetation phenological change than the effects of the mean annual temperature and mean annual cumulative precipitation (Figure 7). An increase in the mean temperature in the 30 days before SOG led to significantly earlier SOG (Figure 7b), thus indicating that SOG occurs earlier as the temperature increases, although this effect differed among different regions at the same latitude. Furthermore, alpine vegetation SOG was delayed in the high-altitude area west of the Tanggula Mountains, while it occurred earlier in the low-altitude area east of the Tanggula Mountains. Meanwhile, the influence of mean total precipitation in the 30 days before SOG mainly manifested as a gradual strengthening of the trend toward an earlier SOG from north to south (Figure 7a), thus indicating that alpine vegetation SOG was observed earlier as precipitation increased, with earlier SOG mainly observed in the eastern and southwestern QTP regions. However, there were areas where the effect was delayed between the above two, concentrated in the western high-altitude regions of the QTP.
The effect of mean total precipitation in the 30 days before EOG led to significant delays in the EOG in the southern part of Qinghai Province, thus indicating that increased precipitation led to delayed EOG in that region, while weaker effects were observed in the south of the Xinjiang Uygur Autonomous Region and west of the Tibet Autonomous Region. The influence of mean temperature on the alpine vegetation EOG in the 30 days before EOG differed among QTP regions, with earlier EOG predominantly observed in the central QTP region and delayed EOG mainly observed in eastern and western QTP regions, with regions of early EOG mainly distributed in south Qinghai Province and regions with delayed EOG mainly distributed in northeastern Qinghai Province and the eastern area of Sichuan Province.

3.2.4. Differences in the Ratio of Pixel Response to Precipitation and Temperature in Different Alpine Vegetation Phenology

Differences in A and B exist in the alpine vegetation, most prominently in the alpine steppe (Table 2). Alpine steppe had a larger A at (0.2–0.4), indicating an increase in the ratio of pixels, with a positive correlation between the response of the SOG to the mean total precipitation in the 30 days before SOG compared to the response to the mean annual cumulative precipitation, where A was as high as −8.03%. B was equally high in the alpine steppe at (0.2–0.4) and (0.4–0.6). The values of A and B in the alpine meadow and alpine shrub were close.
The C and D values for the alpine vegetation were smaller than A and B (Table 3). The larger C in (0–0.2) for the alpine shrub indicates an increase in the ratio of pixels with a positive correlation between the response of SOG to the mean temperature in the 30 days before SOG compared to the response to mean annual temperature with −4.53% for C. C and D in the alpine shrub were equally high at (−0.4–−0.2). The C variation was higher in the alpine steppe, and the C and D variation in the alpine meadow was similar to that in the alpine shrub.

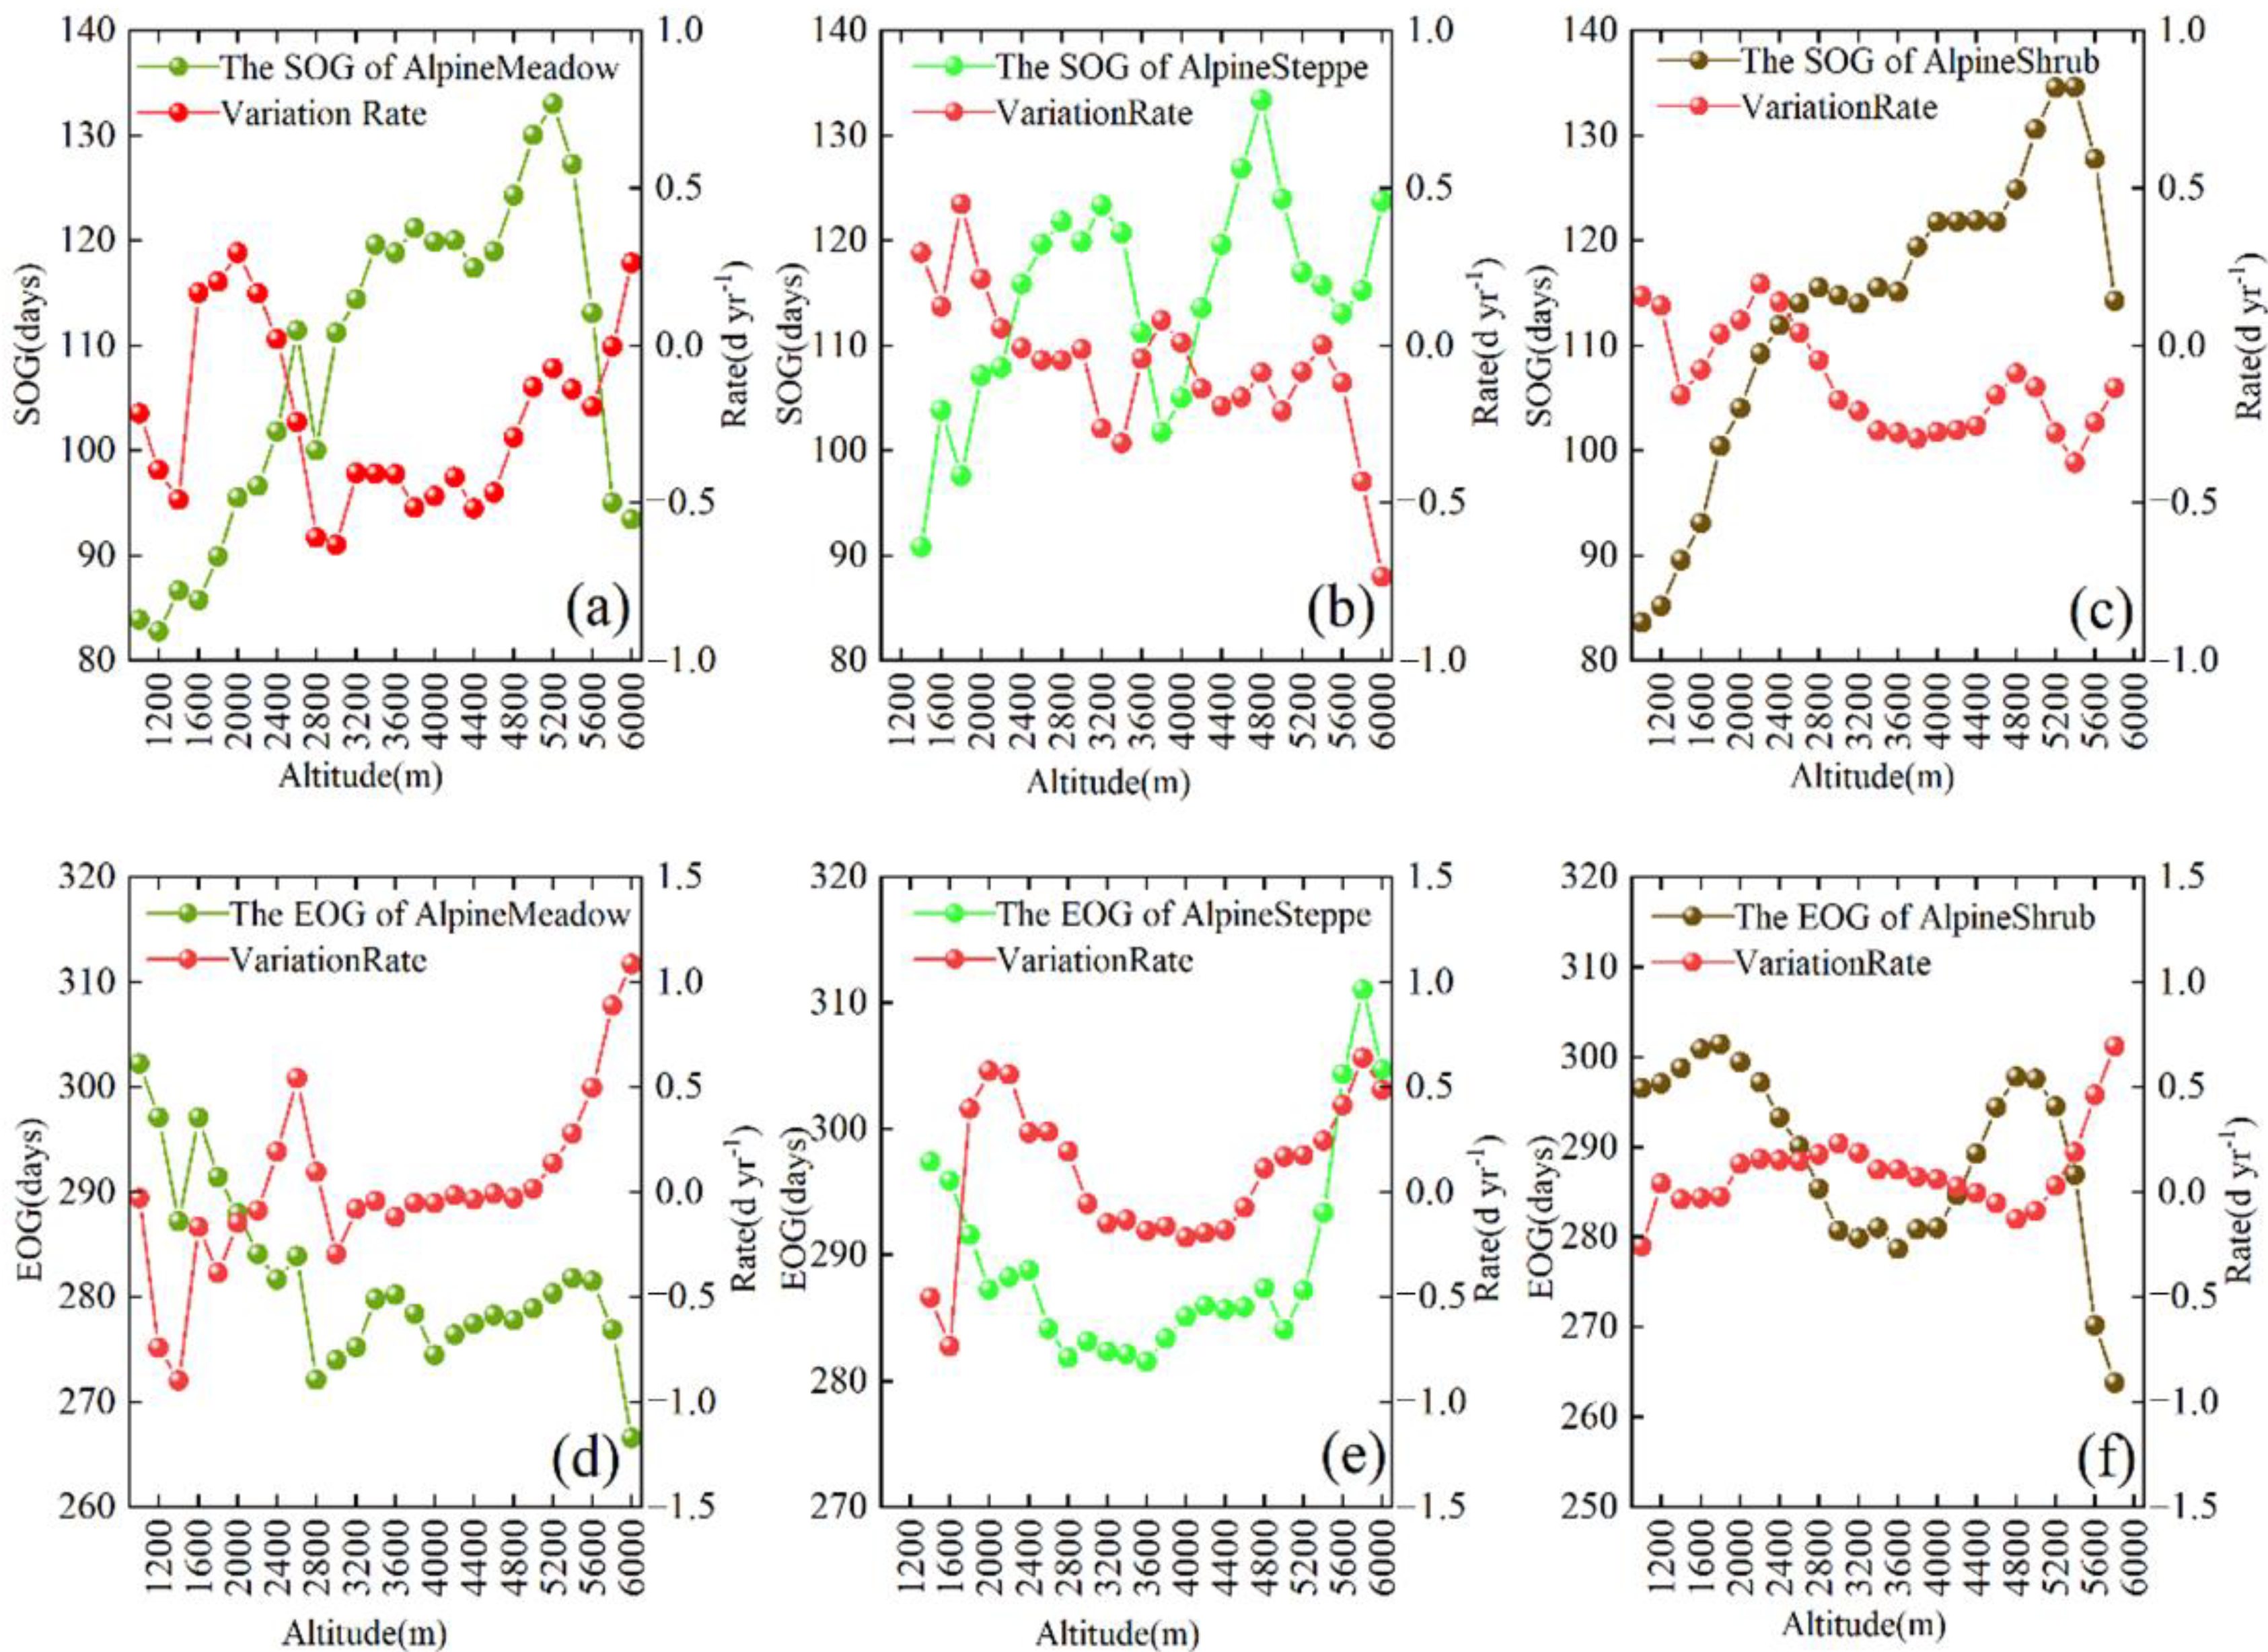
3.2.5. Response of Different Types of Alpine Vegetation Phenology to Altitude Gradient

The three types of the alpine vegetation phenology showed marked changes along the altitude gradient (Figure 8), with SOG of different alpine vegetation types greatly fluctuating at different altitude gradients. When the altitude was less than 2400 m, the inter-annual SOG variation rate of the alpine meadow showed an earlier, followed by a later, trend as the altitude increased; when the altitude was greater than 2400 m, the inter-annual SOG variation rate mainly showed a trend of delayed SOG. For the alpine steppe, where 2800 m was the boundary, the inter-annual SOG variation rate indicated the SOG below the boundary was mainly delayed and that the SOG above the boundary mainly occurred early. For the alpine shrub, where 2600 m was the boundary, the inter-annual SOG variation rate indicated that the SOG below the boundary was mainly delayed, and that the SOG above the boundary mainly occurred earlier.
The EOG of different alpine vegetation steadily fluctuated with altitude gradients, where EOG showed an advanced trend in the altitude range of 800–5000 m, while it had more variation when the altitude was >5000 m. For the alpine meadow, where 2600 m was the boundary, the inter-annual EOG variation rate below the boundary had an earlier EOG trend, while the inter-annual EOG variation rate above the boundary mainly had a delayed EOG trend. For the alpine steppe, where 2800 m was the boundary, the inter-annual EOG variation rate below the boundary was mainly delayed, but within the altitude range of 2800–4800 m, the inter-annual EOG variation rate indicated that the EOG was early. For alpine shrub, where 2000 m was the boundary, the inter-annual EOG variation rate below the boundary indicated that EOG was mainly early, while within the altitude range of 2000 m–4000 m, the inter-annual EOG variation rate indicated the EOG was delayed. However, as the altitude increased above 4000 m, the inter-annual EOG variation rate showed a trend of early EOG and then delayed EOG.

4. Discussion

A spatial and temporal variation analysis of QTP alpine vegetation phenology from 2001 to 2020 showed gradually increasing alpine vegetation SOG delays from southeast to northwest and gradually increasing EOG delays from northeast to southwest. Meanwhile, earlier inter-annual SOG trends and delayed EOG trends that were observed indicated a significant alpine vegetation phenological spatial variation that may have been caused by the effects of vegetation type differences, climate diversity, topography, and other factors [25,26,27].
Ren et al. [28,29] and Deng et al. [30] identified differences in phenological information changes in different vegetation types within the context of climate warming by studying phenological changes over a long time period. Climate change can lead to differences in phenological information by regulating the intensity of physiological response mechanisms (leaf development, respiration, photosynthesis and transpiration, etc.) of different vegetation types [31,32]. Thus, vegetation type difference is the critical factor affecting phenological information spatial distribution differences. At the same time, studies on the phenological changes in QTP alpine vegetation have also shown that SOG and EOG differ amongst different alpine vegetation types [10,12,33,34]. Although the abovementioned research areas and methods differ from those used in this study (Table 4), our statistical analyses of phenological changes in the alpine meadow, alpine steppe, and alpine shrub revealed that the SOG of the alpine shrub was the earliest, SOG of the alpine steppe was the latest, EOG of the alpine meadow was the earliest, and EOG of the alpine shrub was the latest, findings that are consistent with the abovementioned results of previous studies.
Temperature and precipitation are the main factors affecting vegetation phenology that greatly influence various vegetation phenological events (pre-SOG and pre-EOG). Han et al. [37] found that in most areas of the Sanjiangyuan region, the SOG of grassland vegetation was significantly positively correlated with temperature and precipitation in the 30 days before SOG. Moreover, Shen et al. [18] showed that precipitation occurring before the vegetation SOG on the QTP led to an earlier SOG, with a stronger effect of pre-seasonal increases in temperature observed in relatively more humid areas. Furthermore, an analysis conducted by Piao et al. [38] revealed that the vegetation SOG on the QTP was about 4.1 days earlier when the spring temperature increased by 1 °C. The results of this study show that temperature and alpine vegetation SOG were negatively correlated from east to west and then positively correlated, whereas precipitation and alpine vegetation EOG were negatively correlated from east to west and then positively correlated, showing a similar spatial distribution pattern of altitude (gradually increasing from east to west) on the QTP, further indicating the influence of altitude gradient on the change in the alpine vegetation phenology. Subsequently, the correlations of phenological changes with temperature and precipitation also varied in different alpine vegetation; therefore, the numerous vegetation types on the QTP may be one of the main reasons for the significant differences in the spatial variation of phenological distribution characteristics [39]. Importantly, the influences of temperature and precipitation on vegetation growth and developmental processes were in states of continual, dynamic change that lagged behind their effects on different phenological events. Moreover, the alpine vegetation SOG showed a more significant negative correlation with the mean temperature in the 30 days before SOG compared to the mean annual temperature in this works. Taken together, these results indicated that the temperature increase in the spring may induce the melting of snow and frozen soil, promoting good soil hydrothermal conditions for vegetative growth, while also activating plant enzyme activities and improving vegetation greening. The correlation between alpine vegetation EOG and mean total precipitation in the 30 days before alpine vegetation EOG was more significantly positive than the correlation between alpine vegetation EOG and mean annual cumulative precipitation, indicating that sufficient precipitation replenishes the water supply needed for the growing season, delaying the alpine vegetation EOG.
In addition to vegetation type and climate factors, the effects of altitude gradient differences greatly impact the phenological characteristics of vegetation. As the altitude gradient increases, temperature decreases consistently [13,39,40] and is one of the important factors affecting alpine vegetation phenological changes [27]. Temperature indirectly influences QTP alpine vegetation phenological changes, due to the altitude gradient distribution that promotes alpine vegetation spatial distribution differences. Li et al. [13] in their study of QTP alpine grassland phenological changes along the altitude gradient from 2000 to 2013 found that, based on the SOG inter-annual variation rate, an altitude at 3200 m was the boundary line, such that the SOG below the boundary was significantly earlier with increasing altitude and the SOG above the boundary was increasingly delayed with the increasing altitude. Furthermore, inter-annual EOG variation trends indicated that the EOG delay increased with increasing altitude, which is consistent with the results of this study. In addition, we found that, when the altitude was less than 1600 m, inter-annual variation rates of the alpine vegetation SOG and EOG varied greatly, which may have been caused by the effects of human activities [18,41]. However, when the altitude was >5400 m, a decrease in snow coverage may have led to an increase in NDVI response that affected the accuracy of phenological information extraction [42,43], while vegetation growing under these conditions had a short growing season that made it challenging to extract phenological vegetation information.

5. Conclusions

In this paper, we used the dynamic threshold method to extract information from alpine vegetation phenology collected between 2001 and 2020 based on MODIS13Q1 product collected, analysed the spatial and temporal variation of the alpine vegetation phenology on the QTP, and explained the response of the alpine vegetation phenology to climate and topographic factors. The results show that:
(1)
Alpine vegetation SOG on the QTP was increasingly delayed from southeast to northwest, with an early inter-annual variation rate of 0–1 d year−1 and SOG ranging from days 120 to 140. EOG gradually increased from northeast to southwest, with inter-annual variation increasingly delayed by 0–1 d year−1, and EOG ranging from days 260 to 280. The SOG of the alpine meadow, alpine steppe and alpine shrub were concentrated between days 120 and 140, and their inter-annual variation rate was 0–1 d year−1. The EOG of the alpine shrub and alpine steppe were concentrated between days 280 and 300, the alpine meadow was concentrated between days 260 and 280, and their inter-annual variation rate was 0–1 d year−1 for all three.
(2)
Temperature and precipitation both affected alpine vegetation growth. Alpine vegetation SOG was negatively correlated with temperature and precipitation and gradually decreased from east to west, while the alpine vegetation EOG was positively correlated with temperature and precipitation and gradually increased from east to west. Moreover, there was a significant negative correlation between the mean temperature in the 30 days before SOG and the alpine vegetation SOG and a positive correlation between mean total precipitation in the 30 days before SOG and the alpine vegetation SOG, with the negative correlation covering a wider area than that covered by the positive correlation. A significant positive correlation was observed between mean total precipitation in the 30 days before EOG (similar to the results for the mean temperature in the 30 days before EOG and the alpine vegetation EOG), as well as between the mean annual temperature and the alpine vegetation EOG. The responses of the different types of alpine vegetation phenology to precipitation and temperature (mean annual cumulative precipitation, mean annual temperature, mean total precipitation and mean temperature in the 30 days before SOG(EOG)) at different periods were different. In particular, the response of the alpine vegetation phenology to the mean total precipitation in the 30 days before SOG (EOG) was more significantly positively correlated with the mean annual cumulative precipitation, and the change was most apparent in the alpine steppe. The response of the alpine vegetation phenology was positively correlated with the mean temperature in the 30 days before SOG (EOG) compared to the mean annual temperature, which was more significant, showing the greatest significance in the alpine meadow.
(3)
The alpine vegetation phenology is closely related to the altitude gradient. Based on the maximum altitude boundaries for an alpine meadow of 2400 m, for the alpine steppe of 2800 m, and for the alpine shrub of 2600 m, inter-annual SOG change rates below the boundaries were mainly delayed, while inter-annual SOG change rates above the boundaries tended to be early. Based on maximum altitude boundaries for the alpine meadow of 2600 m, for the alpine steppe of 2800 m, and for the alpine shrub of 2000 m, inter-annual EOG change rates below the boundaries were mainly early, while inter-annual EOG changes rates above the boundaries tended to be delayed.

Author Contributions

Conceptualization, Z.F. and J.C.; methodology, Z.F.; software, Z.F.; validation, Z.F., R.H. and J.C.; formal analysis, Z.F.; investigation, Y.Y.; resources, Z.F. and J.C.; writing—original draft preparation, Z.F.; writing—review and editing, Z.F., J.C. and Y.Y.; visualization, Z.F.; supervision, H.Y., X.H. and J.C. All authors have read and agreed to the published version of the manuscript.

Funding

This study was supported by the National Natural Science Youth Foundation of China (41801030), Guangxi Science and Technology Plan Project (AD19245032), Guangxi Natural Science Foundation (2018GXNSFBA281054).

Institutional Review Board Statement

Not applicable.

Informed Consent Statement

Not applicable.

Data Availability Statement

No new data were created or analysed in this study. Data sharing is not applicable to this article.

Acknowledgments

We are very grateful to the reviewers who substantially contributed to the improvement of this paper.

Conflicts of Interest

The authors declare no conflict of interest.

References

  1. Zhang, B.; Cao, J.; Bai, Y.; Zhou, X.; Ning, Z.; Yang, S.; Liu, L. Effects of rainfall amount and frequency on vegetation growth in a Tibetan alpine meadow. Clim. Changes 2013, 118, 197–212. [Google Scholar]
  2. Jin, Z.; Zhuang, Q.; He, J.; Luo, T.; Shi, Y. Phenology shift from 1989 to 2008 on the Tibetan Plateau: An analysis with a process-based soil physical model and remote sensing data. Clim. Changes 2013, 119, 435–449. [Google Scholar]
  3. Xue, T.; Zhao, Y.; Chen, X.; Jiang, M.; Liang, B. Effects of air temperature and soil moisture on common brown-down date of Taraxacum mongolicum in Eastern China’s temperate zone. Acta Sci. Nat. Univ. Pekin. 2020, 56, 173–183. [Google Scholar]
  4. Loveland, T.R.; Reed, B.; Brown, J.; Ohlen, D.; Zhu, Z.; Yang, L.; Merchant, J.W. Development of a global land cover characteristics database and IGBP DIS-Cover from 1 km AVHRR data. Int. J. Remote Sens. 2010, 21, 1303–1330. [Google Scholar]
  5. Wang, W.; Fang, J. Soil respiration and human effects on global grasslands. Glob. Planet. Change 2009, 67, 20–28. [Google Scholar]
  6. Yao, T.; Thompson, L.; Mosbrugger, V.; Zhang, F.; Ma, Y.; Luo, T.; Xu, B.; Yang, X.; Joswiak, D.; Wang, W.; et al. Third Pole Environment (TPE). Environ. Dev. 2012, 3, 52–64. [Google Scholar]
  7. Pepin, N.; Bradley, R.; Diaz, H.; Baraer, M.; Caceres, E.; Forsythe, N.; Fowler, H.; Greenwood, G.; Hashmi, M.; Liu, X.; et al. Elevation-dependent warming in mountain regions of the world. Nat. Clim. Change 2015, 5, 424–430. [Google Scholar]
  8. Tucher, C.; Pinzon, J.; Brown, M.; Slayback, D.; Pak, E.; Mahoney, R.; Saleous, E. An extended AVHRR 8-km NDVI dataset compatible with MODIS and SPOT vegetation NDVI data. Int. J. Remote Sens. 2005, 26, 4485–4498. [Google Scholar]
  9. Cong, N.; Wang, T.; Nan, H.; Ma, Y.; Wang, X.; Myneni, R.; Piao, S. Changes in satellite-derived spring vegetation green-up date and its linkage to climate in China from 1982 to 2010: A multimethod analysis. Glob. Change Biol. 2013, 19, 881–891. [Google Scholar]
  10. Huang, W. Apline Grassland Phenology Response to Climate Change over Tibetan Plateau; Lanzhou University: Lanzhou, China, 2019. [Google Scholar]
  11. An, C. Monitoring of Vegetation Phenology Based on MODIS Data and Its Response to Climate Change in Tibetan Plateau, China; University of Chinese Academy of Sciences: Beijing, China, 2019. [Google Scholar]
  12. Yu, H.; Luedeling, E.; Xu, J. Winter and spring warming result in delayed spring phenology on the Tibetan Plateau. Proc. Natl. Acad. Sci. USA 2010, 107, 22151–22156. [Google Scholar] [PubMed] [Green Version]
  13. Li, L.; Liu, L.; Zhang, Y.; Ding, M.; Li, S.; Chen, Q. Elevation-dependent alpine grassland phenology on the Tibetan Plateau. Geogr. Res. 2017, 36, 26–36. [Google Scholar]
  14. Zhang, G.; Zhang, Y.; Dong, J.; Xiao, X. Green-up dates in the Tibetan Plateau have continuously advanced from 1982 to 2011. Proc. Natl. Acad. Sci. USA 2013, 110, 4309–4314. [Google Scholar]
  15. Zhang, Y.; Li, B.; Liu, L.; Zheng, D. Redetermine the region and boundaries of Tibetan Plateau. Geogr. Res. 2021, 40, 1543–1553. [Google Scholar]
  16. Rodriguez, E.R.; Becu, O.; Coppola, D.; Duquerroy, L.; Rinaldo, R.; Schoenenberg, A.; Ginati, A. Integrated applications demonstration projects. In Proceedings of the 2012 IEEE 1st AESS European Conference on Satellite Telecommunications, ESTEL 2012, Rome, Italy, 2–5 October 2012. [Google Scholar]
  17. Yao, T.; Xue, Y.; Chen, D.; Chen, F.; Thompsom, L.; Cui, P.; Koike, T.; Lau, W.K.; Lerrenmaier, D.; Mosbrugger, V.; et al. Recent third pole’s rapid warming accompanies cryospheric melt and water cycle intensification and interactions between monsoon and environment: Multidisciplinary approach with observations, modeling, and analysis. Bull. Am. Meteorol. Soc. 2019, 100, 423–444. [Google Scholar]
  18. Shen, M.; Tang, Y.; Chen, J.; Zhu, X.; Zheng, Y. Influences of temperature and precipitation before the growing season on spring phenology in grasslands of the central and eastern Qinghai-Tibetan Plateau. Agric. For. Meteorol. 2011, 151, 1711–1722. [Google Scholar]
  19. Xia, C.; Li, J.; Liu, Q. Vegetation phenology monitoring method using time-series MODSI LAI data. Trans. Chin. Soc. Agric. Eng. 2012, 28, 103–109. [Google Scholar]
  20. Chen, J.; Jonsson, P.; Tamura, M.; Gu, Z.; Matsushita, B.; Eklunch, L. A simple method for reconstructing a high-quality NDVI time-series data set based on the Savitzky-Golay filter. Remote Sens. Environ. 2004, 91, 332–344. [Google Scholar]
  21. Richardson, A.D.; Bailey, A.S.; Denny, E.G.; Martin, C.W.; O’keefes, J. Phenology of a northern hardwood forest canopy. Glob. Change Biol. 2006, 12, 1174–1188. [Google Scholar]
  22. Sen, P. Estimates of the regression coefficient based on kendall’s tau. J. Am. Stat. Assoc. 1968, 63, 1379–1389. [Google Scholar]
  23. Hoaglin, D.; Mosteller, F.; Tukey, J.W. Understanding Robust and Exploratory Data Analysis; Wiley: New York, NY, USA, 2000; pp. 169–181. [Google Scholar] [CrossRef]
  24. Kendall, M. Rank correlation methods. Br. J. Psychol. 1990, 25, 86–91. [Google Scholar]
  25. Lenoir, J.; Gegout, J.C.; Marquet, P.A.; Ruffray, P.D.; Brisse, H. A significant upward shift in plant species optimum elevation during the 20th century. Science 2008, 320, 1768–1771. [Google Scholar] [PubMed]
  26. Meng, F.; Huang, L.; Chen, A.; Zhang, Y.; Piao, S. Spring and autumn phenology across the Tibetan Plateau inferred from normalized difference vegetation index and solar-induced chlorophyll fluorescence. Big Earth Data 2021, 5, 182–200. [Google Scholar]
  27. Shen, M.; Zhang, G.; Cong, N.; Wang, S.; Kong, W.; Piao, S. Increasing altitudinal gradient of spring vegetation phenology during the last decade on the Qinghai-Tibetan Plateau. Agric. For. Meteorol. 2014, 189–190, 71–80. [Google Scholar]
  28. Ren, S.; Yi, S.; Peichl, M.; Wang, X. Diverse responses of vegetation phenology to climate change in different Grasslands in Inner Mongolia during 2000–2016. Remote Sens. 2018, 10, 17. [Google Scholar]
  29. Ren, S.; Chen, X.; Lang, W.; Schwartz, M.D. Climatic controls of the spatial patterns of vegetation phenology in midlatitude grasslands of the Northern Hemisphere. J. Geophys. Res. Biogeosci. 2018, 123, 2323–2336. [Google Scholar]
  30. Deng, C.; Bai, H.; Zhai, D.; Huang, S.; Meng, Q.; He, Y. Variation in plant phenology in the Qinling Mountains from 1964–2015 in the context of climate change. Acta Ecol. Sin. 2017, 37, 7882–7893. [Google Scholar]
  31. Jin, J.; Wang, Y.; Zhang, Z.; Magliulo, V.; Jiang, H.; Cheng, M. Phenology plays an important role in the regulation of terrestrial ecosystem water-use efficiency in the Northern Hemisphere. Remote Sens. 2017, 9, 664. [Google Scholar]
  32. Cheng, M.; Jin, J.; Jiang, H. Strong impacts of autumn phenology on grassland ecosystem water use efficiency on the Tibetan Plateau. Ecol. Indic. 2021, 126, 107682. [Google Scholar]
  33. Huang, B. Tibetan Plateau’s Phenological Changes and the Analysis of Its Driving Factors; China University of Geosciences: Beijing, China, 2020. [Google Scholar]
  34. Huang, W.; Zeng, T.; Huang, X. Spatiotemporal dynamics of alpine grassland phenology on the Tibetan Plateau. Pratacultural Sci. 2019, 36, 1032–1043. [Google Scholar]
  35. Chang, Q.; Wang, S.; Sun, Y.; Yin, H.; Yin, H. The remote sensing monitoring model of the typical vegetation phenology in the Qinghai-Tibetan Plateau. J. Geo-Inf. Sci. 2014, 16, 816–823. [Google Scholar]
  36. Yuan, Q.; Yang, J. Phenological changes of grassland vegetation and its response to climate change in Qinghai-Tibet Plateau. Chin. J. Grassl. 2021, 43, 32–42. [Google Scholar]
  37. Han, B.; Zhou, B.; Zhao, H.; Shi, M.; Sun, Y.; Niu, D.; Fu, H. Relationships between grassland vegetation turngreen and climate factors in the Three-River Resource Region. Acta Ecol. Sin. 2019, 39, 5635–5641. [Google Scholar]
  38. Piao, S.; Cui, M.; Chen, A.; Wang, X.; Ciais, P.; Liu, J.; Tang, Y. Altitude and temperature dependence of change in the spring vegetation green-up date from 1982 to 2006 in the Qinghai-Xizang Plateau. Agric. For. Meteorol. 2011, 151, 1599–1608. [Google Scholar]
  39. Yao, Y.; XU, M.; Zhang, B. The implication of mass elevation effect of the Tibetan Plateau for altitudinal belts. J. Geogr. Sci. 2015, 25, 1411–1422. [Google Scholar]
  40. Ding, M.; Li, L.; Zhang, Y.; Liu, L.; Wang, Z. Temperature change and its elevetion dependency on the Tibetan Plateau and its vicinity from 1971 to 2012. Resour. Sci. 2014, 36, 1509–1518. [Google Scholar]
  41. Luo, C.; Xu, G.; Chao, Z.; Wang, S.; Lin, X.; Hu, Y.; Zhang, Z.; Duan, J.; Chang, X.; Su, A.; et al. Effect of warming and grazing on litter mass loss and temperature sensitivity of litter and dung mass loss on the Tibetan plateau. Glob. Change Biol. 2010, 16, 1606–1617. [Google Scholar]
  42. Wang, T.; Peng, S.; Lin, X.; Chang, J. Declining snow cover may affect spring phenological trend on the Tibetan Plateau. Proc. Natl. Acad. Sci. USA 2013, 110, 2854–2855. [Google Scholar]
  43. Dong, J.; Zhang, G.; Zhang, Y.; Xiao, X. Reply to Wang et al.: Snow cover and air temperature affect the rate of changes in spring phenology in the Tibetan Plateau. Proc. Natl. Acad. Sci. USA 2013, 110, 2856–2857. [Google Scholar]
Figure 1. Spatial distribution of differences in the alpine vegetation and meteorological stations on the QTP.
Sustainability 14 12802 g001
Figure 2. Spatial distribution of phenology and their pixel ratios. Note: (a,b) are the spatial distribution of the mean of SOG and EOG; (c,d) are the pixel ratio of SOG and EOG; and (e,f) are differences in the percentage of the pixel in the mean of the alpine vegetation phenology.
Sustainability 14 12802 g002
Figure 3. Sen trends in annual changes in phenology. Note: (a,c) are the spatial Sen trend distribution of SOG and EOG; (b,d) are the spatial distribution of Sen values by MK test of the SOG and EOG (p > 90%); and (e,f) are the differences pixel ratio in Sen values of the alpine vegetation.
Sustainability 14 12802 g003
Figure 4. The changing trend mean of difference alpine vegetation phenology. Note: (ac) are the SOG of changing trend mean of alpine meadow, alpine steppe and alpine shrub; (df) are the EOG of changing trend mean of alpine meadow, alpine steppe and alpine shrub.
Sustainability 14 12802 g004
Figure 5. Climate change in the last 20 years. Note: (a) is the inter-annual climate change, (b) is the 30 days climate change before SOG, and (c) is the 30 days climate change before EOG. Pre_Line is the fitting line of precipitation, Tem_Line is the fitting line of temperature.
Sustainability 14 12802 g005
Figure 6. Response of the alpine vegetation phenology to climate change. Note: (a) is SOG response to mean annual cumulative precipitation, (b) is SOG response to mean annual temperature, (c) is EOG response to mean annual cumulative precipitation, and (d) is EOG response to mean annual temperature.
Sustainability 14 12802 g006
Figure 7. Responses of the alpine vegetation phenology to mean temperature and mean total precipitation in the 30 days before SOG (EOG). Note: (a,c) are the responses of mean total precipitation in the 30 days before SOG (EOG); (b,d) are the responses of mean temperature in the 30 days before SOG (EOG).
Sustainability 14 12802 g007
Figure 8. Response of the alpine vegetation phenological changes to altitude gradient. Note: (ac) are response of the SOG of alpine meadow, alpine steppe and alpine shrub to altitude gradient; (df) are response of the EOG of alpine meadow, alpine steppe and alpine shrub to altitude gradient.
Sustainability 14 12802 g008
Table 1. Trends in SOG(EOG) by differences in the alpine vegetation.
Vegetation TypeSOG/EOG Change Trend Maximum
(d year−1)
SOG/EOG Change Trend Mean
(d year−1)
SOG/EOG Change Trend Minimum
(d year−1)
Meadow1.36/1.44−0.40/0.11−3.21/−1.52
Steppe2.19/1.03−0.19/0.10−2.83/−1.16
Shrub1.77/2.05−0.28/0.11−2.32/−1.97
Table 2. Differential values of pixel ratio for the response of the alpine vegetation phenology to precipitation.
Vegetation Type\R(%) (−1–−0.6)(−0.6–−0.4)(−0.4–−0.2)(−0.2–0)(0–0.2)(0.2–0.4)(0.4–0.6)(0.6–1)
Alpine MeadowR(SOG)0.192.64.792.61−3.19−4.95−1.83−0.23
R(EOG)0.11.224.516.12.81−3.38−6.45−4.9
Alpine SteppeR(SOG)0.534.047.514.19−5.21−8.03−2.71−0.33
R(EOG)0.131.516.119.432.71−8.14−8.89−2.86
Alpine ShrubR(SOG)−0.011.252.682.92−0.3−3.9−2.34−0.3
R(EOG)0.030.542.182.410.47−1.29−2.87−1.47
Note: R is the difference between the pixel ratios for the response of the alpine vegetation phenology to the mean annual cumulative precipitation and the pixel ratios for the response of the alpine vegetation phenology to the mean total precipitation in the 30 days before SOG (EOG).
Table 3. Differential values of pixel ratio for the response of the alpine vegetation phenology to Temperature.
Vegetation Type\R(%) (−1–−0.6)(−0.6–−0.4)(−0.4–−0.2)(−0.2–0)(0–0.2)(0.2–0.4)(0.4–0.6)(0.6–1)
Alpine MeadowR(SOG)−0.162.913.770.19−3.60−1.61−1.16−0.35
R(EOG)−0.08−0.220.962.721.29−2.04−2.26−0.38
Alpine SteppeR(SOG)−0.82−1.67−1.774.341.77−4.122.250.01
R(EOG)−0.020.052.563.41−1.42−2.97−1.41−0.21
Alpine ShrubR(SOG)−0.760.844.381.95−4.53−1.52−0.19−0.17
R(EOG)−0.040.813.031.63−2.18−2.13−0.86−0.26
Note: R is the difference between the pixel ratios for the response of the alpine vegetation phenology to the mean annual temperature and the pixel ratios for the response of the alpine vegetation phenology to the mean temperature in the 30 days before SOG (EOG).
Table 4. Comparison of this paper’s alpine vegetation phenological information with that of other scholars.
Study RegionStudy TimeFitteringPhenology Identification MethodSOG Mean (Day)EOG Mean (Day)Data Resource
QTP2001–2018 [33]S-G filteringDynamic Threshold Method129266MOD13A2
2001–2015 [10,34]S-G filtering137286MOD13A1
1982–2006 [12]S-G filtering135273GIMMS NDVI
2003–2013 [35]S-G filtering123289MOD13Q1
2000–2019 [36]Hants128276MOD13Q1
2001–2020 *S-G filtering122282MOD13Q1
Note: * is the study time in this study.
Publisher’s Note: MDPI stays neutral with regard to jurisdictional claims in published maps and institutional affiliations.