Abstract
Shifting from conventional methods of food production to genetic modification methods benefits sustainable agri-food production and environmental preservation. However, one of the main problems genetically modified food manufacturers have ever had to deal with is the public acceptability of GM foods. This study has two major objectives. First, it intends to apply principles from behavioral economics to investigate how consumers’ willingness to pay for GM corn oil can be affected. For this purpose, two different nudges are tested by providing consumers with positive information regarding GMO and changing the wording of the GMO label. Then, a comparison between the effectiveness of each of them is provided. Second, it investigates the impact of trust in GM food institutions, GMO information, and perceived GMO risk on both WTP for GM edible oil and the effectiveness of each nudge. A between-subjects choice experiment with a sample size of 550 Iranian corn oil consumers was conducted in Mashhad from March to April 2021. The results of mixed logit models indicate that both nudges affected consumer valuation of GM corn oil significantly, while their effectiveness differed according to the consumer level of trust in the GM food institutions and the perceived risk of GMO. Increasing consumer trust and information raises the WTP for GM corn oil; however, perceived risk has no effect. This study introduces effortless tools that GM food manufacturers can consider in their marketing strategies to affect consumers in the desired way.
1. Introduction
Producing genetically modified (GM) foods has experienced increasing growth over the past two decades [,]. From 1996 to 2016, the global cultivation of GM food crops increased from 1.7 million hectares to around 185.1 million hectares []. Thanks to genetic engineering methods, it is possible to grow plants with desired characteristics, raise crop yields, and use fewer chemicals []. These characteristics can help the world, particularly developing countries, move toward sustainable development by addressing some of the concerns about food security and health []. There are also environmental benefits associated with GM methods of food production. For example, using lower amounts of pesticides results in a decrease in the amount of emitted gases into the atmosphere [,], and increasing crop yield can also reduce deforestation, decrease water usage, and support wildlife preservation [,,,]. In particular, in developing countries such as Iran, which are faced with water shortages, replacing conventional methods of food production with genetic modification methods can address the water shortage to some extent [,].
Despite the rapid spread and the advantages of genetically modified (GM) crops, there has been debate and concern about them since the first GM food product was certified for human use in 1994. There is a fear among consumers of the harmful effects that GM foods might have on the environment and public health. Although this backlash against GM foods is global, studies show that the backlash is comparatively higher in developing countries [,].
To this end, GM food producers can profit from using effective marketing tools to offset public backlash and raise the willingness to pay (or decrease the willingness to accept) for GM foods. One approach that can be used in this manner is nudging. According to the definition of nudge, this approach stays away from explicit directives or compulsion; instead, it can be simply any method that subtly provides guidance for consumers to make the desired decision and protects consumer autonomy at the same time [,]. There are several other simple strategies that can be implemented to nudge consumers.
This study intends to adopt concepts from behavioral economics to see how it is possible to influence Iranian consumers’ behavior towards GM foods. Two nudges were designed for this study and their impacts on respondent’s willingness to pay (WTP) for GM corn oil were tested. While several studies have investigated consumer purchasing behavior towards GM corn-related products such as GM corn flake cereal, GM canned corn, animal products fed GM corn, and GM corn ingredients [,,,,,], very few have focused on GM corn oil. GM corn oil is one of the most common GM products and is used frequently in Iran. Moreover, since the commitment of the Iranian government to the Cartagena Protocol on Biosafety, GMO labeling of GM cooking oils has become mandatory []. Therefore, compared with other GM products, Iranian consumers have a more vivid understanding of this product, and it is more appropriate for this study to be adopted.
To the best of the authors’ knowledge, the only study that has evaluated the effects of information on WTP for GM corn oil is Terawaki [], who used a contingent valuation (CV) approach; the study is solely focused on the GM attribute and lacks other attributes that play an important role in consumer preference towards corn oil. Since Terawaki’s [] research was conducted, more advanced valuation methods have been suggested, which necessitates a detailed analysis of consumers’ WTP for corn oil. At the moment, the most common method for determining willingness to pay (WTP) for foods is discrete choice experiments (CE) []. It has become an increasingly widespread approach to studying the behavioral responses of consumers, households, or even organizations in various sectors [], and, above all, to analyzing agri-food products or consumption []. Moreover, compared to the CV approach, the choice experiment method provides a deeper understanding of different attributes of a product []. By building different levels of a product into the experimental design, choice experiment avoids the part-whole bias problem []. “Yea-saying” is another problem that is avoided in CE []. Brand, traceability, and price are attributes of corn oil that are considered in the discrete choice experiment in addition to being GM or non-GM.
Following the strategy of LaRiviere et al. [], a between-subjects choice experiment with a sample size of 550 corn oil consumers was conducted to compare the effectiveness of nudges. The sample was split into two treatment groups (one for each nudge) and one control group. Respondents were randomly assigned to one of these groups, and they only had to engage in this survey once (no respondent participated in more than one treatment). In addition to the effect of treatments, other possible variables that may affect the WTP of GM corn oil, including trust in the institutions associated with GM food, information about GMO, and perceived risk of GMO, are considered. Their effects both on the WTP for GM corn oil and on the effectiveness of each nudge are interpreted.
The approach of this study, which is based on research from consumer behavior, experimental and behavioral economics, and food marketing, is novel for three reasons. First of all, to the best of the authors’ knowledge, this is the first study to discover consumers’ WTP for different attributes of corn oil by conducting a choice experiment. Second, this is the first study to test two different nudges as a tool to raise consumers’ WTP for GM foods and compare the effectiveness of each approach. Last, but not least, this study investigates the effects of trust, information, and perceived risk both on consumers’ WTP for GM corn oil and the effectiveness of each nudge.
Section 2 introduces and presents previous research on major variables of this study and formulates the hypotheses and research questions of this study. Section 3 outlines the survey design, the descriptive statistics of the sample, discrete choice experiments, and the econometric method of this study. Then, the results are presented, followed by the conclusion and limitations of the survey.
2. Literature Review
2.1. Nudge
In 2008, Richard Thaler and Cass Sustein [] introduced nudge as “any aspect of the choice architecture that alters people’s behavior in a predictable way without forbidding any options or significantly changing their economic incentives”. To count as a mere nudge, the intervention must be easy and cheap to avoid. Compared with conventional methods, nudges have shown that they can be more effective on a cost-adjusted basis [,]. A growing body of studies on the effectiveness of various nudges proves the effect of this approach on behavior [,]. Maas et al. [] conducted a between-subjects experiment to evaluate the effects of proximity nudge. They discovered that simply increasing the distance from 20 to 70 cm could significantly affect snack consumption. In another study by Privitera [], the results were confirmed for the consumption of apples and carrots. However, the effect of one nudge can sometimes be different across circumstances. Gonçalves et al. [] tested the effect of social nudges to raise the consumption of healthy foods. They found that while it has a positive effect on those with less healthy diets, those with healthy diets were affected negatively. In another study by Wensing et al. [], the social nudge, compared with nature pictures, reflection questions, and information on bio-based plastics, had the most significant effect on increasing consumers’ WTP for bio-based packaging. Therefore, numerous studies should take place to test the effects of nudges across different countries for different purposes.
According to Gonçalves et al. [], nudges can be classified into three main groups based on the way they affect people. The first group includes (i) simplification and framing of information. The simplification method is focused on providing information, while framing is about the way the information is presented. The second group is about (ii) a physical environmental change. In this nudge, the physical environment of the person who engages in behavior is altered by this nudge. Those nudges that change product placement in stores can be placed in this group []. The third type of nudge is (iii) the default option, which is the predetermined actions that are implemented if the decision-maker does not specify anything []. When there is inaction, this method is a straightforward yet effective technique as it does not demand any effort from the decision-maker []. The last group is (iv) social norm nudge, which is performed by letting others know how their actions match the majority []. By capitalizing on people’s desire to fit in with others and social conformity tendencies, this nudge influences behavior []. Both nudges that are tested in this study are included in the first category. In the following parts, the implementations of those are provided.
2.1.1. Informational Nudge
Several studies have found that providing relevant information to consumers can increase their willingness to pay for various products [,,]. By providing information, consumers gain a better understanding of the food product and decrease the uncertainty associated with that product, leading to a wiser purchasing decision []. For instance, Wensing [] found that by using relevant information in the forms of video and text, consumers’ WTP for bio-based packaging was elevated. Providing information about GMO to affect consumers’ purchasing behavior has been frequently studied, even though the approach has not been introduced as a form of nudge [,,,,,,,]. Their results varied, but there was a consensus that positive information affects consumers positively.
The groups that received informational nudge in this study were provided with some information regarding the benefits of GMO. Although GM edible oils have GMO labeling in Iran, these labels do not provide information regarding the characteristics of GM products so that consumers are aware of the advantages and disadvantages of these items. The provided information in this treatment is regarding the features of GMO that ultimately lead to environmental preservation, health improvement, and ensuring food security (see Appendix B). Due to the poor information of Iranian consumers regarding GMO [] and the significant impact of consumer information on their attitudes towards GMO [], increasing the WTP for the GM attribute of corn oil is likely as a result of this treatment. Therefore, the following hypothesis is formulated:
Hypothesis 1 (H1):
The use of informational nudge raises the WTP for corn oil’s GM attribute.
2.1.2. Wording Nudge
The other approach taken in this study to raise consumers’ WTP for GM corn oil is wording nudge. This nudge has been tested by Ouvrard et al. [] to influence people’s choice of wood ash recycling programs. They implemented this nudge in the choice experiment by emphasizing the environmental role of the desired options through better usage of words. The way that this study implements this nudge is exclusive. To explain the implementation, first a common mistake in the Persian translation of the term “genetically modified” has to be explained. Although there is a subtle difference between the words “changed” and “modified” in the English language, “genetically modified” is mistakenly translated as “genetically changed” in Persian. In English, the word “modify” is used when the entire theme of performing things is the same, and just some partial changes need to occur. However, when the word “change” is used, the whole theme may change completely []. As a result, the translation of the term “genetically modified” on the label of the product for the wording group is corrected. It should be noted that there are GM food producers in Iran that use the correct translation on their labels, but it is very uncommon. The mistaken translation can be a cause of Iranians’ negative preference for GM foods to some extent. Therefore, it can be assumed that the wording nudge may positively affect this negative preference.
Hypothesis 2 (H2):
The use of wording nudge raises the WTP for corn oil’s GM attribute.
2.2. Trust, Information, and Perceived Risk
In order to gain a better estimation, three other variables that were claimed to be effective in a consumer’s preference towards GM foods are measured. Prior research suggested that consumers’ intentions to purchase GM food are mainly driven by their trust in the institutions associated with GM food, their information, and their perceived risk of GM foods [,,,,,]. The questions that are used for measuring these factors are provided in Appendix C (Table A1). Their effects are investigated both on consumers’ WTP for GM foods and the effectiveness of nudges.
2.2.1. Trust
Trust is defined as the desire to accept vulnerability based on optimistic assumptions about the motives or actions of another []. Trust in individuals, groups, and institutions is the subject of this definition. This kind of trust is additionally known as social trust [,]. As the majority of consumers have poor knowledge regarding GM foods, relying on others to assess the risk of GM foods is one strategy to deal with this lack of information. The positive effect of trust in GMO institutions on the acceptance of GM foods has been shown by several studies [,,]. As a result, the following hypothesis is proposed:
Hypothesis 3 (H3):
An increase in the level of trust in the institutions associated with GM food positively affects consumers’ WTP for GM attribute of corn oil.
Since no other study has ever investigated the effect of trust on the effectiveness of nudge, instead of hypotheses, the following questions are investigated in this study:
Research Question 1 (RQ1):
How does trust influence the effectiveness of wording nudge?
Research Question 2 (RQ2):
How does trust influence the effectiveness of informational nudge?
2.2.2. Information
The effect of information about GMO on consumer behavior towards GMO has been proven in several studies. To measure the information, two factors are measured, and then an index is created by using them. First, the self-reported level of information of respondents is measured on a scale of 1 to 5. Some evidence indicates that more informed respondents are more positive towards GM food []. However, other studies show that this only happens if the received information was positive [,]. If the received information were negative, the effect on the consumer would be negative too []. Therefore, the second factor that is measured is the information’s positivity, neutrality, or negativity. Then, the combination of these two factors results in the information index. If the respondent has positive information, their self-reported level of information multiplies by two; if the information is neutral, it multiplies by one; and if the information is negative, it multiplies by minus one. For example, in the case of someone who reported a four on the scale of the received amount of information, if the received information were positive, neutral, or negative, the information index would be 8 (4 × 2), 4 (4 × 1), and −4 (4 × −1), respectively. Thus, the index increases as the level of neutral and positive information increases, while the increase for positive information is two times larger. In contrast, the index decreases as the level of negative information increases. This index is what this study means when it refers to information. Eventually, according to the results of other studies, the following hypothesis is proposed:
Hypothesis 4 (H4):
An increase in the level of Information about GMO positively affects consumers’ WTP for GM attributes of corn oil.
The following research questions are also raised to investigate the effect of information on the effectiveness of each nudge.
Research Question 3 (RQ3):
How does information influence the effectiveness of wording nudge?
Research Question 4 (RQ4):
How does information influence the effectiveness of informational nudge?
2.2.3. Perceived Risk
Perceived risk is defined as a person’s evaluation of risks or hazards that could endanger their health or wellbeing []. According to the literature, three aspects of risk associated with GM foods are measured, including (1) health risk, (2) environmental risk, and (3) threat to the natural order of things [,,]. According to the previous literature on the relationship between perceived risks associated with GM foods and WTP [], the following hypothesis is made:
Hypothesis 5 (H5):
An increase in the level of perceived risk associated with GMO positively affects consumers’ WTP for the GM attribute of corn oil.
The research questions regarding the effect of perceived risk on the effectiveness of each nudge are as follows:
Research Question 5 (RQ5):
How does perceived risk influence the effectiveness of wording nudge?
Research Question 6 (RQ6):
How does perceived risk influence the effectiveness of informational nudge?
3. Materials and Methods
3.1. Survey
In this survey, three questionnaires were designed that were similar to each other except for the difference that was made to nudge treatment groups. The questionnaires were structured into three sections: socioeconomic questions (questions about gender, age, education, household size, and monthly income), choice experiment, and questions to measure trust, information, and perceived risk. The first and last sections were the same for all groups, but the second section varied depending on the group. Before the final distribution of the questionnaire, it was investigated by experts (consultants and researchers in the food industry and cognitive sciences). In addition, a pilot experiment was conducted on 30 citizens. The reference population was determined to be Iranian consumers of corn oil residing in Mashhad. Since most of the studies on consumer behavior towards GM foods are focused on developed countries, this study, by investigating a developing country, contributes to this literature. Moreover, due to the availability of GM corn oil in Iran, the answer of Iranians to the questions of the hypothetical choice experiment is close to reality. Before conducting the survey, ethics approval was obtained from the Ferdowsi University of Mashhad. In the process of collecting data, respondents were informed regarding the aim of this study and were asked to answer in an honest manner. They were assured of the anonymity of their response, the scientific purpose of the survey, and their privacy. People younger than 18 years old were not allowed to participate. Finally, the survey was conducted online from March to April 2021 and involved 550 consumers. As indicated by green [], size requirements were determined, taking into account a statistical power of the sample of 80%. The sample size of this study with 550 individuals was closer to small-effect sizes (sample size requirement = 798) than medium-effect sizes (sample size requirement = 110). According to Cohen [], this solution appeared satisfactory for a study in behavioral sciences. Table 1 outlines the distribution of the sample into different groups with different nudge.

Table 1.
Groups in experimental design.
3.2. Descriptive Statistics
The demographics of the study participants are presented in Table 2. Due to the greater willingness of women to participate in online surveys [], the majority of the sample was female (68%). The average respondent was 31 years old. Participants showed a relatively high level of education, with 66% holding a bachelor’s or upper degree. The sample was younger and more educated than the average population. Given that the survey was carried out online, this is not surprising; it is natural to anticipate internet users to be predominantly young and well-educated. Given their young age, most of the respondents were unmarried (58%). The average size of a household in the sample was 3.9, which roughly corresponds to the average size of a household in Iran (3.5) []. Just over half the participants reported a monthly net household income of IRR 70 million or more. The income of an average family in Iran is IRR 75 million [].
Table 2.
Descriptive socioeconomic statistics of the sample.
Table 3 also shows the scores on trust, information, and the perceived risk of GMO. The categorization of each factor is based on the level that consumers attribute to themselves by answering the questions. On a scale of 3 to 15, respondents’ trust in government, scientific research, and production method labeling was measured. Almost half of the respondents were uncertain about institutions associated with GM foods. The average information index in this study was −0.15. This can be attributed to the negativity of received information by the majority of respondents (54.5%). Finally, more than half of the respondents perceived either a high risk or very high risk from GMO.
Table 3.
Scores on trust, information, and perceived risk.
3.3. Choice Experiment Design
In the discrete choice experiment, participants were presented with two bottles of corn oil with different empirically generated attributes and a no-purchase option to imitate a real-world market situation. Then, participants chose their preferred option. The discrete choice experiment included four attributes influencing customer’s corn oil buying behavior. These attributes, which are derived from relevant research, include production method, brand, traceability, and price [,]. The attributes and their levels are shown in Table 4. The production method of corn oil can be genetically modified or non-genetically modified. In terms of brand, since most of the edible oils in Iran are branded, the comparison will be between having a known brand and having an unknown brand. Traceability also refers to whether the product’s origin of manufacture can be tracked across the supply chain []. There are two levels of traceable and nontraceable. The last attribute is price, which is determined based on the market’s real price of corn oil. The price is transformed from IRR into USD, using the exchange rate when the survey was conducted.
Table 4.
Attributes and levels used in the discrete choice experiment design.
Since price has 4 levels and other attributes have 2 levels, 32 combinations of choices (2 × 2 × 2 × 4 = 32) are generated. Because of the problems that may arise from submitting too many scenarios [], by using an orthogonal fractional factorial design, the original 32 combinations were reduced to 8 and divided into 2 groups of 4, with a D-efficiency of 51.925. The design of the discrete choice experiment was obtained by SAS [], following techniques developed by Street et al. []. An example of a choice set is presented in Figure 1. Before answering the choice questions, respondents were also given instructions regarding the DCE. Moreover, to reduce the stated choice hypothetical bias, respondents were asked to imagine they were buying corn oil and to choose exactly the same thing they chose in a real situation (see Appendix A).
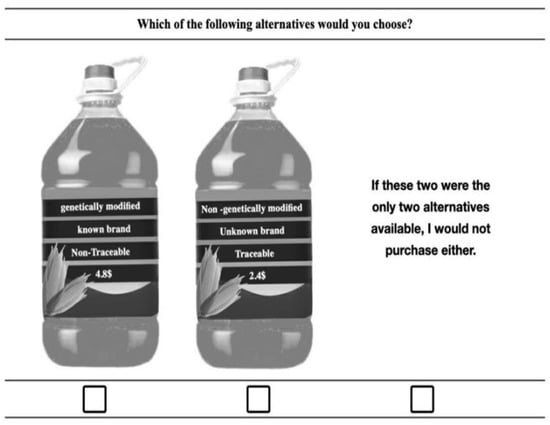
Figure 1.
Example choice question.
3.4. Econometric Modeling
An indirect utility function based on Lancaster’s theory of consumer demand was defined to model the preference for corn oil attributes from the choice experiments []. Unlike the contingent valuation method, which estimates the overall value respondents assign to a product when considered as a whole, the choice experiment method, which was inspired by Lancaster’s theory of consumer demand, states that individuals derive utility from the attributes of the product, not the product itself. A thorough overview of the conceptual framework and underlying assumptions of the choice experiment method is provided by Louviere []. According to the random utility theory [], choice experiments rely on the assumption that the utility derived by individual n choosing alternative j in choice condition t can be represented as follows:
Unjt = Vnjt + εnjt
Vnjt is the systematic portion of the utility function, which is determined by the experimentally designed product attributes of alternative j, while εnjt is the stochastic and unobservable (to researchers) component.
The choice data are analyzed using a mixed logit model (MXL), which accounts for taste heterogeneity both across respondents and across choice situations encountered by the same respondent []. In MXL, latent variables influence consumer preferences. The coefficients of the three non-price product attributes are considered to be random, following normal distributions, because individuals are likely to assign positive or negative values to the attributes. Eventually, the utility from choosing option j in choice task t can be expressed as follows:
Unjt = αPricenjt + βn1GMnjt + βn2Brandnjt + βn3Traceabilitynjt + ASCOpt-out + γ1Trustn × GMnjt + γ2Informationn × GMnjt + γ3Perceived riskn × GMnjt + γ4Treatmentn × GMnjt + γ5Trustn × Treatmentn × GMnjt + γ6Informationn × Treatmentn × GMnjt + γ7Preceived riskn × Treatmentn × GMnjt + εnjt
Pricenjt is a continuous variable that contains the four pricing levels in the design; GMnjt, Brandnjt, and Traceabilitynjt are dummy variables that take 1 if they are genetically modified, have a known brand, and are traceable, respectively; otherwise, they take 0. ASCOpt-out is the alternative specific constant of the no-purchase option, which is invariant in the population; α is price preference; and the β s are the non-price taste coefficients. To estimate the effects of case-specific variables on GM preference, cross-variables are considered as well. For example, in the case of a specific nudge, a dummy variable is created that takes 1 in the presence of that nudge and takes 0 in the absence of it (treatment). By interacting this variable with GM, the effect of that nudge on preferences towards the GM attribute can be evaluated. Other case-specific variables are treated the same way. Information, trust, and perceived risk also interacted with the interaction of GM and treatment, to investigate the impact of those on the effectiveness of treatments. γi denotes the coefficients of the GM attributes’ interaction terms with other variables. The impact of information, trust, and perceived risk on consumers’ preferences for product attributes is measured by these coefficients. Lastly, εnjt is the unobserved error term, which follows a Gumbel (extreme value type I) distribution.
Finally, the willingness to pay (WTP) of respondents for each product attribute can be assessed. WTP is the price change associated with a unit increase in a specific attribute. It can be computed as the ratio between the partial derivative of the utility function with respect to the attribute of interest and the derivative of the utility function with respect to the variable “price” []. By rearranging Equation (3), the respondent’s preferences in the WTP space would be the following:
where θn is a random positive scalar that represents the price/scale parameter; ω indicate the marginal WTP estimates for the different attributes; and δi is the differences in consumers’ WTP for each attribute across case-specific variables. Other elements in (3) are specified as in (2).
Unjt = θn[(−Pricenjt + ω2GMnjt + ω3Brandnjt + ω4Traceabilitynjt + ASCOpt-out) + δ1 (Trust ∗ GMnjt) +δ2 (Information × GMnjt) + δ3 (Perceived risk × GMnjt) + δ4 (Treatment × GMnjt) + δ5 (Trust × Treatment × GMnjt) + δ6 (Information × Treatment × GMnjt) + δ7 (Perceived risk × Treatment × GMnjt) + εnjt
4. Results
4.1. Econometric Results in Preference Space
The results of MXL are provided in Table 5. To investigate the effects of trust, information, and perceived risk on consumers’ preference towards GM corn oil, the data of the control group are used, and to consider each treatment’s effect, the data from each treatment group must be combined with the data of the control group. All the econometric models were analyzed using STATA 14 [].
Table 5.
Estimates of mixed logit model in the preference space.
4.2. Econometric Results in WTP Space
Table 6 provides the results of mixed logit models in WTP space. Unlike preference space, this approach deals with the issue of scale effects that may arise in preference space []; therefore, it is more appropriate for comparisons across treatments. It also prevents the potential overestimation of consumers’ WTP that may arise in the model fit of preference space []. All WTP values are in USD, using the exchange rate when the survey was conducted (USD 1 = IRR 320,000).
Table 6.
Estimates of mixed logit model in the willingness to pay space (in USD).
4.2.1. Brand and Traceability
Brand and traceability both showed a positive, significant effect on consumers’ preference towards corn oil. According to the control group, consumers are willing to pay more than USD 4 per 1.8L corn oil bottle to have a known brand of corn oil. The WTP for traceability was even 50% higher. This is consistent with the results of Zhang et al. [], who found that the traceability attribute of soybean oil has the highest WTP compared with allergen presence and nutrient change labeling. This importance of traceability for consumers can be attributed to their distrust of non-GMO labeling of products, and their need to contact sources to obtain more information to resolve the credibility–adequacy trade-off []. Traceability receives little attention from policymakers in Iran. By providing the required facilities to make products traceable, they can both increase consumer satisfaction and raise producers’ profit. The ASC’s positive and significant coefficient also demonstrates that respondents were hesitant to select one of the corn oil alternatives.
4.2.2. Effect of Trust, Information, and Perceived Risk
The positive willingness to pay for the interaction of trust with GMO and information with GMO supports hypotheses 3 and 4. The effect of trust on WTP for GM corn oil is in line with the results of Rodríguez-Entrena et al. [] and Yue et al. [], who found an indirect positive causal relationship between trust in the government and willingness to buy GM food. The positive effect of information on WTP for the GM attribute of corn oil also corresponds with the results of Zheng [], who found the same result for GM rice. The negative coefficient of perceived risk indicates that by increasing the consumer level of perceived risk, the WTP for the GM attributes of corn oil increases; however, since the effect is not statistically significant, hypothesis 5 cannot be accepted.
The WTP for GM attribute cannot be merely measured by its own coefficient, and the cross-variables should be considered as well. Each cross-variable indicates how multiplied variables affect the WTP of GM. To investigate the effects of trust, information, and perceived risk, the data of the control group are used. In measuring consumers’ WTP for GM attribute, only the significant variables are taken into account. For example, the WTP for GM attribute of corn oil for someone with a medium level of trust (8) and a medium level of neutral information (3), who received no nudge, would be
(−8.87) + 8 × 0.58 + 3 × 0.55 = −2.58
4.2.3. Effect of the Treatments
To investigate the effect of each nudge, pooled data from each treatment group and the control group are considered. The effect of each nudge is then shown by the interaction of the treatment variable and the GM attribute (treatment × GM). Results indicate that both nudges increase consumers’ WTP for the GM attribute significantly (hypotheses 1 and 2 are accepted). Additionally, the interaction of treatment and GM is multiplied by trust (trust × treatment × GMO), information (information × treatment × GMO), and perceived risk (perceived risk × treatment × GMO) to see how these factors affect the effectiveness of each nudge. The results indicate that as the consumer’s level of trust increases, the informational nudge becomes less effective (RQ2). The effect of this factor on the effectiveness of wording nudge is also negative but insignificant (RQ1). Moreover, information affects the effectiveness of both nudges negatively but insignificantly, while the negative effect is more for the informational group. This seems justifiable, as the treatment does not provide those with high levels of information with something new. Again, since the effect is insignificant, the effects are not taken into account (RQ3 and RQ4). Perceived risk affected wording nudge negatively and significantly (RQ5), but the effect on informational nudge is insignificantly negative (RQ6). It seems that those with a higher risk perception of GMO appear to be less discriminating between different forms of GMO wording and they are opposed to these products regardless of their wording.
To assess the WTP of GM, for someone with median level of trust (8), medium neutral information (3), and medium level of perceived risk (8), and received wording nudge, the equation would be
(−8.65) + 8 × 0.55 + 3 × 0.56 + 10 − 8 × 1 × 0.57 = 2.87
If the same person was nudged by informational nudge, the WTP would be
(−10.813) + 8 × 0.6951 + 3 × 0.694 + 1 × 9.27 − 8 × 1 × 0.7862 = −0.19
Table 7 provides the WTP across treatments for different groups of people with different levels of trust, information, and perceived risk. Based on the findings of the WTP space model in Table 6, various computations were carried out, accounting for all the variables with a significant coefficient to compare the WTP for GM attributes in different conditions. The respondents were categorized into four groups: those with a low level of trust, a high level of negative information, and a high level of perceived risk; those with an average level of trust, information, and perceived risk in the sample of this study; those with a median level of trust, the median level of neutral information, and the median level of perceived risk; and those with a high level of trust, a high level of positive information, and a low level of perceived risk.
Table 7.
WTP for GM attribute of corn oil for different consumers.
According to Table 7, the effectiveness of each nudge differs across respondents with different levels of trust, information, and perceived risk. Therefore, it is important to match the nudging strategy with the consumer level of those. For example, for a distrustful person with high levels of negative information and perceived risk about GMO, the informational nudge comparatively has the most substantial effect. It can be justified by the fact that, because this group is constantly bombarded with negative information, providing them with positive information about GMO can provide them with a new perspective and have a significant impact on them. On the other hand, for those with a high level of trust and positive information and a low level of perceived risk, the effect of the informational nudge would be negative. This might be because of the high amount of positive information that this group already has, and, thus, adding more positive information will not affect them positively. In addition, this can be because of the negative impact of trust on the effectiveness of informational nudge. Except for this group of consumers, the informational nudge affects all consumers positively. This contradicts the results of Valente and Chaves [], who found no impact of positive information on consumers’ willingness to accept GM foods. This can be attributed to the sample of their study: young Portuguese college students who were more scientifically informed than the rest of the population. Since this group of consumers was already informed enough regarding GMO, providing additional positive information did not affect them, but if the sample consisted of the normal population, a positive impact would be likely.
Wording nudge appears to have a positive effect across all groups, with a greater impact as trust and information levels rise and perceived risk falls. Except for those with a low level of trust and information and a high level of perceived risk, the wording nudge was more effective than the informational nudge in other groups. This should be taken into account by GM corn oil marketers and producers in Iran so that they can raise the WTP of customers by a large margin by simply correcting the translation of the term “genetically modified” on their products. In general, producers from other countries should pay close attention to the wording of their product attributes, as such a subtle difference can have a significant effect on consumer preference.
5. Conclusions and Implication
The genetic modification method, as a new technique to produce foods with lower carbon emissions, higher crop yields, and fewer chemicals, can address some of the concerns over food security and environmental preservation. However, consumer response toward GM food has been largely negative. By conducting a discrete choice experiment, this study elicits consumers’ WTP for different attributes of corn oil and tests the effectiveness of informational and wording nudges to offset the public’s opposition to GM corn oil. Two treatment groups and one control group were considered, and respondents were randomly assigned to one of them. In each treatment group, respondents received a specific nudge, and in the control group, they received no nudge. The control group was set as the benchmark and then was compared with the treatment groups separately to assess the effect of each nudge. The effects of respondents’ levels of trust, information, and perceived risk on their WTP for the GM attribute of corn oil were estimated as well. A mixed logit model was used to analyze the data, which allows for taste heterogeneity both across individuals and across choice situations encountered by the same individual.
The findings contribute to the fields of behavioral economics, food marketing, and policymaking in several ways. First, this study discovered that while both nudges were effective, the effect of wording nudge in increasing consumers’ WTP for GM corn oil was larger than the effect of informational nudge in most cases. Thus, producers and marketers should be careful about the wording of every attribute of their product on the labels, as such a small change can make a big difference. In addition, in the case of informational nudge, flyers can provide more positive information about GMO to their customers to inform them regarding the upside of these products. Owing to the environmental advantages of GM foods, policymakers can use different nudges to encourage society towards sustainable agri-food production and address some of the environmental challenges.
Furthermore, this study discovered that the effectiveness of each nudge differs depending on a consumer’s levels of trust and perceived risk. This is the second contribution to this study. The results indicate that those with a low level of perceived risk from GMO are more affected by wording nudge, and those with a low level of trust in the institutions associated with GM food are more affected by informational nudge. Therefore, it is of paramount importance, when nudging consumers, to consider the level of trust and perceived risk of the target market to affect them in the desired direction. However, more evidence is still required to formulate a comprehensive hypothesis on how each nudge can be most effective.
Regarding consumer preference towards corn oil, this study discovered that an average consumer in Mashhad with an average level of trust and information has a negative WTP for the GM attribute of corn oil. By considering this, marketers and manufacturers of GM foods and other food producers that want to commercialize their biotechnological products can have a better prediction of public reactions. Policymakers can also use the information to develop better regulations for product labeling and approval of genetically modified products for consumption. According to the positive impact of trust and information on WTP for GM corn oil, policymakers can also help society improve their perception of the advantages and disadvantages of GM foods and their purchasing behavior by conducting mass information policy research on the pros and cons of GM foods. Moreover, due to the WTP heterogeneity for GM corn oil among consumers, market segmentation can be performed based on consumer level of trust, information, and perceived risk. This can be useful for determining potential target markets and effectively nudging. Lastly, the result of the discrete choice experiment indicates that both brand and traceability significantly increase consumers’ WTP for corn oil, while the WTP for traceability is almost 50 percent higher than brand. This is an important finding for marketers and producers to consider in their product development. Policymakers can also benefit society and increase the safety of foods by providing the required facilities for traceable products.
6. Limitation and Future Research
This study has potential limitations. Given that this study used a hypothetical discrete choice experiment, future studies can verify the findings with real market data by conducting real discrete choice experiments. Furthermore, the data collection was limited to Mashhad city, but evidence suggests that preferences for GM foods vary significantly across countries [,]. Therefore, further studies are required to investigate how the effects of these nudges differ across countries. In addition, there are other factors, such as socioeconomic variables, knowledge concerning the application of GM technologies, psychological variables, and religious variables, that affect consumer valuation of GM foods [,,,]. Their effects on the effectiveness of nudges for GM foods can be evaluated as well. Furthermore, there are a variety of other nudges that can be used for similar purposes. We hope that this study will encourage other researchers in the fields of experimental economics and food marketing to explore the new marketing strategies that can be used to affect consumer purchasing behavior.
Author Contributions
H.H., conceptualization, methodology, software, formal analysis, investigation, data curation, writing—original draft, visualization. A.K., supervision. H.M., supervision. A.F., methodology, software, validation, supervision. F.B., writing—review and editing, validation, supervision. All authors have read and agreed to the published version of the manuscript.
Funding
This research received no external funding.
Institutional Review Board Statement
Not applicable.
Informed Consent Statement
All participants consented to the processing of their data in anonymous and confidential form. Informed consent was obtained from all subjects involved in the study.
Data Availability Statement
The data that support the findings of this study are available on request from the corresponding author.
Acknowledgments
The authors acknowledge and appreciate the support provided by our friends for their editing help, designing figures, collecting data, and moral support. We also would like to thank the editor and the anonymous reviewers for assisting us to improve the manuscript.
Conflicts of Interest
The authors declare no conflict of interest.
Appendix A. Choice Experiment Instruction and Required Information
Before answering the choice tasks, please read the information below:
Imagine you are out shopping at your neighborhood supermarket. We will ask you four different choice questions. Each choice question offers two corn oil selections and a “do not purchase” option. Except for the production method, brand, traceability, and price, the two corn oils in both alternatives are identical. Please try to think as you would if you had to pay for the product, implying that you would no longer have that much accessible for purchases, while making your decision.
Appendix B. Information that Informational Group Received
- Agricultural crops can become resistant to diseases and pests by modifying genes.
- The GMFs improve the nutritional value of foods.
- Farmers can use fewer spray pesticides when they plant GMO crops [,].
Appendix C
Table A1.
Questions about Trust, Information, and Perceived Risk.
Table A1.
Questions about Trust, Information, and Perceived Risk.
| Indicator | Variables | Source |
|---|---|---|
| Trust | X1: I trust the supervision of government over the GM food effectively. | [,] |
| X2: I trust the scientific research claiming GM food has no threats for health. | ||
| X3: I trust information on the product label to distinguish non-GM from GM (answers and scores for X1–X3: 1 = completely disagree; 2 = disagree; 3 = uncertain; 4 = agree; 5 = completely agree). | ||
| Information | X4: How much information do you receive about GM food? (answers and scores for X5: 1 = very limited; 2 = limited; 3 = medium; 4 = some; 5 = very much). | [] |
| X5: Is the propensity of the information on GM food that you receive negative, neutral, or positive? (answers and scores for X6: 1 = positive; 2 = neutral; 3 = negative). | [,] | |
| Perceived risk | X6: Eating genetically modified food will be harmful to my health and my family’s health. | [] |
| X7: Genetically modified food threatens the natural order of things. | ||
| X8: Growing genetically modified crops will be harmful to the environment (answers and scores for X6–X8: 1 = completely disagree; 2 = disagree; 3 = uncertain; 4 = agree; 5 = completely agree). |
References
- Prati, G.; Pietrantoni, L.; Zani, B. The prediction of intention to consume genetically modified food: Test of an integrated psychosocial model. Food Qual. Prefer. 2012, 25, 163–170. [Google Scholar] [CrossRef]
- Nicolia, A.; Manzo, A.; Veronesi, F.; Rosellini, D. An overview of the last 10 years of genetically engineered crop safety research. Crit. Rev. Biotechnol. 2014, 34, 77–88. [Google Scholar] [CrossRef]
- James, C. Global Status of Commercialized Biotech/GM Crops; ISAAA Brif 52-2012; ISAAA: Ithaca, NY, USA, 2016. [Google Scholar]
- Azadi, H.; Taheri, F.; Ghazali, S.; Moghaddam, S.M.; Siamian, N.; Goli, I.; Choobchian, S.; Pour, M.; Özgüven, A.I.; Janečková, K.; et al. Genetically modified crops in developing countries: Savior or traitor? J. Clean. Prod. 2022, 371, 133296. [Google Scholar] [CrossRef]
- Boccia, F.; Sarnacchiaro, P. Chi-squared automatic interaction detector analysis on a choice experiment: An evaluation of responsible initiatives on consumers’ purchasing behavior. Corp. Soc. Responsib. Environ. Manag. 2020, 27, 1143–1151. [Google Scholar] [CrossRef]
- Brookes, G.; Barfoot, P. Farm income and production impacts of using GM crop technology 1996–2016. GM Crops Food 2018, 9, 59–89. [Google Scholar] [CrossRef]
- Eriksson, M.; Ghosh, R.; Hansson, E.; Basnet, S.; Lagerkvist, C.J. Environmental consequences of introducing genetically modified soy feed in Sweden. J. Clean. Prod. 2018, 176, 46–53. [Google Scholar] [CrossRef]
- Huang, J.; Hu, R.; Rozelle, S.; Pray, C. Insect-resistant GM rise in farmers’ fields: Assessing productivity and health effects in China. Science 2005, 308, 688–690. [Google Scholar] [CrossRef]
- Qaim, M.; Kouser, S. Genetically modified crops and food security. PLoS ONE 2013, 8, 1–7. [Google Scholar] [CrossRef]
- Sutherland, C.; Gleim, S.; Smyth, S.J. Correlating genetically modified crops, glyphosate use and increased carbon sequestration. Sustainability 2021, 13, 11679. [Google Scholar] [CrossRef]
- Lin, W.; Ortega, D.L.; Caputo, V.; Lusk, J.L. Personality traits and consumer acceptance of controversial food technology: A cross-country investigation of genetically modified animal products. Food Qual. Prefer. 2019, 76, 10–19. [Google Scholar] [CrossRef]
- Thaler, R.H.; Sunstein, C.R. Nudge: Improving Decisions about Health, Wealth, and Happiness; Penguin: London, UK, 2009. [Google Scholar]
- Grebitus, C.; Roscoe, R.D.; Van Loo, E.J.; Kula, I. Sustainable bottled water: How nudging and Internet Search affect consumers’ choices. J. Clean. Prod. 2020, 267, 121930. [Google Scholar] [CrossRef]
- Moon, W.; Balasubramanian, S.K. Public Perceptions and Willingness to Pay a Premium for Non-GM foods in the US and UK. AgBioforum 2001, 4, 221–231. [Google Scholar]
- Baker, G.A.; Burnham, T.A. Consumer response to genetically modified foods: Market segment analysis and implications for producers and policy makers. J. Agric. Resour. Econ. 2001, 26, 387–403. [Google Scholar]
- Lusk, J.L.; Sullivan, P. Consumer acceptance of genetically modified foods. Food Technol. 2002, 56, 32. [Google Scholar] [CrossRef]
- Lusk, J.L.; Roosen, J.; Fox, J.A. Demand for beef from cattle administered growth hormones or fed genetically modified corn: A comparison of consumers in France, Germany, the United Kingdom, and the United States. Am. J. Agric. Econ. 2003, 81, 16–29. [Google Scholar] [CrossRef]
- Li, Q.; McCluskey, J.J.; Wahl, T.I. Effects of information on consumers’ willingness to pay for GM-corn-fed beef. J. Agric. Food Ind. Organ. 2004, 2, 141–158. [Google Scholar] [CrossRef]
- Boccia, F.; Punzo, G. A choice experiment on consumer perceptions of three generations of genetically modified foods. Appetite 2021, 161, 105158. [Google Scholar] [CrossRef]
- Kazemi Najaf Abadi, A.; Skandarian, H. Legislative obligations of member states under Cartagena protocol and the extent to which the Islamic Republic of Iran has adhered to such commitments. Public Law Res. 2015, 16, 129–148. [Google Scholar]
- Terawaki, T. Effects of Information on Consumer Risk Perception and Willingness to Pay for Non-Genetically Modified Corn Oil. Res. Agric. Appl. Econ. 2005, 32. [Google Scholar] [CrossRef]
- Lizin, S.; Rousseau, S.; Kessels, R.; Meulders, M.; Pepermans, G.; Speelman, S.; Vandebroek, M.; Van Den Broeck, G.; Van Loo, E.J.; Verbeke, W. The State of the Art of Discrete Choice Experiments in Food Research. Food Qual. Prefer. 2022, 102, 104678. [Google Scholar] [CrossRef]
- Louviere, J.J.; Hensher, D.A.; Swait, J.D. Stated Choice Methods: Analysis and Applications; Cambridge University Press: Cambridge, UK, 2000. [Google Scholar]
- Costa Rozan Fortunato, V.; de Moura Engracia Giraldi, J.; Caldeira de Oliveira, J.H. A review of studies on neuromarketing: Practical results, techniques, contributions and limitations. J. Manag. Res. 2014, 6, 201–220. [Google Scholar] [CrossRef]
- Jin, J.; Wang, Z.; Ran, S. Comparison of contingent valuation and choice experiment in solid waste management programs in Macao. Ecol. Econ. 2006, 57, 430–441. [Google Scholar] [CrossRef]
- Hanley, N.; MacMillan, D.; Wright, R.E.; Bullock, C.; Simpson, I.; Parsisson, D.; Crabtree, B. Contingent valuation versus choice experiments: Estimating the benefits of environmentally sensitive areas in Scotland. J. Agric. Econ. 1998, 49, 1–15. [Google Scholar] [CrossRef]
- Adamowicz, V. Alternative Valuation Techniques: A Comparison and Movement to a Synthesis. Environmental Valuation: New Persectives; CAB International: Wallingford, UK, 1995; pp. 144–159. [Google Scholar]
- LaRiviere, J.; Czajkowski, M.; Hanley, N.; Aanesen, M.; Falk-Petersen, J.; Tinch, D. The value of familiarity: Effects of knowledge and objective signals on willingness to pay for a public good. J. Environ. Econ. Manag. 2014, 68, 376–389. [Google Scholar] [CrossRef]
- Mertens, S.; Herberz, M.; Hahnel, U.J.; Brosch, T. The effectiveness of nudging: A meta-analysis of choice architecture interventions across behavioral domains. Proc. Natl. Acad. Sci. USA 2022, 119, 6118. [Google Scholar] [CrossRef]
- Hummel, D.; Maedche, A. How effective is nudging? A quantitative review on the effect sizes and limits of empirical nudging studies. J. Behav. Exp. Econ. 2019, 80, 47–58. [Google Scholar] [CrossRef]
- DellaVigna, S.; Linos, E. RCTs to scale: Comprehensive evidence from two nudge units. Econometrica 2022, 90, 81–116. [Google Scholar] [CrossRef]
- Maas, J.; de Ridder, D.T.; de Vet, E.; De Wit, J.B. Do distant foods decrease intake? The effect of food accessibility on consumption. Psychol. Health 2012, 27, 59–73. [Google Scholar] [CrossRef] [PubMed]
- Covino, D.; Boccia, F. Environmental management and global trade’s effects. Qual. Access Success 2014, 15, 79–83. [Google Scholar]
- Gonçalves, D.; Coelho, P.; Martinez, L.F.; Monteiro, P. Nudging consumers toward healthier food choices: A field study on the effect of social norms. Sustainability 2021, 13, 660. [Google Scholar] [CrossRef]
- Wensing, J.; Caputo, V.; Carraresi, L.; Bröring, S. The effects of green nudges on consumer valuation of bio-based plastic packaging. Ecol. Econ. 2020, 178, 106783. [Google Scholar] [CrossRef]
- Jørgensen, F.A. A Pocket History of Bottle Recycling; The Atlantic: Washington, DC, USA, 2013. [Google Scholar]
- Samson, A.; Ramani, P. Finding the Right Nudge for Your Clients. Investment News. 2018. Available online: https://www.investmentnews.com/article/20180827/BLOG09/180829939/finding-the-right-nudge-for-your-clients (accessed on 2 September 2022).
- Dur, R.; Fleming, D.; van Garderen, M.; van Lent, M. A social norm nudge to save more: A field experiment at a retail bank. J. Public Econ. 2021, 200, 104443. [Google Scholar] [CrossRef]
- Nahmias, Y.; Perez, O.; Shlomo, Y.; Stemmer, U. Privacy Preserving Social Norm Nudges. Mich. Tech. L. Rev. 2019, 26, 43. [Google Scholar] [CrossRef]
- Francisco, A.J.; Bruce, A.S.; Crespi, J.M.; Lusk, J.L.; McFadden, B.; Bruce, J.M.; Aupperle, R.L.; Lim, S.-L. Are consumers as constrained as hens are confined? Brain activations and Behavioral choices after informational influence. J. Agric. Food Ind. Organ. 2015, 13, 22. [Google Scholar] [CrossRef]
- Lusk, J.L. Consumer preferences for and beliefs about slow growth chicken. Poult. Sci. 2018, 97, 4159–4166. [Google Scholar] [CrossRef] [PubMed]
- Klaiman, K.; Ortega, D.L.; Garnache, C. Perceived barriers to food packaging recycling: Evidence from a choice experiment of US consumers. Food Control 2017, 73, 291–299. [Google Scholar] [CrossRef]
- Motoshita, M.; Sakagami, M.; Kudoh, Y.; Tahara, K.; Inaba, A. Potential impacts of information disclosure designed to motivate Japanese consumers to reduce carbon dioxide emissions on choice of shopping method for daily foods and drinks. J. Clean. Prod. 2015, 101, 205–214. [Google Scholar] [CrossRef]
- Lusk, J.L.; House, L.O.; Valli, C.; Jaeger, S.R.; Moore, M.; Morrow, J.L.; Traill, W.B. Effect of information about benefits of biotechnology on consumer acceptance of genetically modified food: Evidence from experimental auctions in the United States, England, and France. Eur. Rev. Agric. Econ. 2004, 31, 179–204. [Google Scholar] [CrossRef]
- Delwaide, A.C.; Nalley, L.L.; Dixon, B.L.; Danforth, D.M.; Nayga Jr, R.M.; Van Loo, E.J.; Verbeke, W. Revisiting GMOs: Are there differences in European consumers’ acceptance and valuation for cisgenically vs transgenically bred rice? PLoS ONE 2015, 10, e0126060. [Google Scholar] [CrossRef]
- Chen, Q.; Liu, G.; Liu, Y. Can product-information disclosure increase Chinese consumer’s willingness to pay for GM foods? The case of Fad-3 GM lamb. China Agric. Econ. Rev. 2017, 9, 415–437. [Google Scholar] [CrossRef]
- Kilders, V.; Caputo, V. Is Animal Welfare Promoting Hornless Cattle? Assessing Consumer’s Valuation for Milk from Gene-edited Cows under Different Information Regimes. J. Agric. Econ. 2021, 72, 735–759. [Google Scholar] [CrossRef]
- Kato-Nitta, N.; Inagaki, Y.; Maeda, T.; Tachikawa, M. Effects of information on consumer attitudes towards gene-edited foods: A comparison between livestock and vegetables. CABI Agric. Biosci. 2021, 2, 1–12. [Google Scholar] [CrossRef]
- Magnier, A.; Kalaitzandonakes, N.; Lusk, J. Changes in Consumer Preferences toward Non-GM Foods within an Information-Rich Environment: The Case of the Washington State Ballot Initiative. Appl. Econ. Perspect. Policy 2022, 44, 489–510. [Google Scholar] [CrossRef]
- Akbari, M.; Ardekani, Z.F.; Pino, G.; Maleksaeidi, H. An extended model of Theory of Planned Behavior to investigate highly-educated Iranian consumers’ intentions towards consuming genetically modified foods. J. Clean. Prod. 2019, 227, 784–793. [Google Scholar] [CrossRef]
- Xu, R.; Wu, Y.; Luan, J. Consumer-perceived risks of genetically modified food in China. Appetite 2020, 147, 104520. [Google Scholar] [CrossRef]
- Ouvrard, B.; Abildtrup, J.; Stenger, A. Nudging Acceptability for Wood Ash Recycling in Forests: A Choice Experiment. Ecol. Econ. 2020, 177, 106748. [Google Scholar] [CrossRef]
- Cambridge International Dictionary of English; Cambridge University Press: London, UK, 2022.
- Yue, C.; Zhao, S.; Cummings, C.; Kuzma, J. Investigating factors influencing consumer willingness to buy GM food and nano-food. J. Nanopart. Res. 2015, 17, 1–19. [Google Scholar] [CrossRef]
- Zhang, Y.; Jing, L.; Bai, Q.; Shao, W.; Feng, Y.; Yin, S.; Zhang, M. Application of an integrated framework to examine Chinese consumers’ purchase intention toward genetically modified food. Food Qual. Prefer. 2018, 65, 118–128. [Google Scholar] [CrossRef]
- Hakim, M.P.; Zanetta, L.D.A.; de Oliveira, J.M.; da Cunha, D.T. The mandatory labeling of genetically modified foods in Brazil: Consumer’s knowledge, trust, and risk perception. Food Res. Int. 2020, 132, 109053. [Google Scholar] [CrossRef]
- Hu, L.; Liu, R.; Zhang, W.; Zhang, T. The effects of epistemic trust and social trust on public acceptance of genetically modified food: An empirical study from China. Int. J. Environ. Res. Public Health 2020, 17, 7700. [Google Scholar] [CrossRef]
- Guo, Q.; Yao, N.; Zhu, W. How consumers’ perception and information processing affect their acceptance of genetically modified foods in China: A risk communication perspective. Food Res. Int. 2020, 137, 109518. [Google Scholar] [CrossRef] [PubMed]
- Rousseau, D.M.; Sitkin, S.B.; Burt, R.S.; Camerer, C. Not So Di_erent After All–A Cross-Discipline View of Trust. Acad. Manag. Rev. 1998, 23, 393–404. [Google Scholar] [CrossRef]
- Eiser, J.R.; Donovan, A.; Sparks, R.S.J. Risk Perceptions and Trust Following the 2010 and 2011 Icelandic Volcanic Ash Crises. Risk Anal. 2015, 35, 332–343. [Google Scholar] [CrossRef]
- Traill, W.B.; Jaeger, S.R.; Yee, W.M.S.; Valli, C.; House, L.O.; Lusk, J.L.; Moore, M.; Morrow Jr, J.L. Categories of GM risk-benefit perceptions and their antecedents. AgBioForum 2004, 7, 176–186. [Google Scholar]
- Hossain, F.; Onyango, B.; Schilling, B.; Hallman, W.; Adelaja, A. Product attributes, consumer benefits and public approval of genetically modified foods. Int. J. Consum. Stud. 2003, 27, 353–365. [Google Scholar] [CrossRef]
- Hossain, F.; Onyango, B. Product attributes and consumer acceptance of nutritionally enhanced genetically modified foods. Int. J. Consum. Stud. 2004, 28, 255–267. [Google Scholar] [CrossRef]
- Huffman, W.E.; Rousu, M.; Shogren, J.F.; Tegene, A. The effects of prior beliefs and learning on consumers’ acceptance of genetically modified foods. J. Econ. Behav. Organ. 2007, 63, 193–206. [Google Scholar] [CrossRef]
- Rousu, M.C.; Huffman, W.E.; Shogren, J.F.; Tegene, A. Estimating the public value of conflicting information: The case of genetically modified foods. Land Econ. 2004, 80, 125–135. [Google Scholar] [CrossRef]
- Lusk, J.L.; Jamal, M.; Kurlander, L.; Roucan, M.; Taulman, L. A meta-analysis of genetically modified food valuation studies. J. Agric. Resour. Econ. 2005, 30, 28–44. [Google Scholar]
- Adeola, F.O. Nativity and environmental risk perception: An empirical study of native-born and foreign-born residents of the USA. Hum. Ecol. Rev. 2007, 14, 13–25. [Google Scholar]
- Steinbrecher, R.A. From green to gene evolution: The environmental risks of genetically engineered crops. Ecologist 1996, 26, 273–281. [Google Scholar]
- Jia, S.R. Safety of environment and food of transgenic plants. China Biotechnol. 1997, 17, 37–42. [Google Scholar]
- Qian, Y.Q. Analysis of advantages and disadvantages on transgenic crops. Biotechnol. Inf. 1999, 15, 7–11. [Google Scholar]
- Moon, W.; Balasubramanian, S.K.; Rimal, A. Willingness to pay (WTP) a premium for non-GM foods versus willingness to accept (WTA) a discount for GM foods. J. Agric. Resour. Econ. 2007, 32, 363–382. [Google Scholar]
- Green, S.B. How many subjects does it take to do a regression analysis? Multivar. Behav. Res. 1991, 26, 499–510. [Google Scholar] [CrossRef] [PubMed]
- Cohen, J. Statistical Power Analysis for the Behavioral Sciences, 2nd ed.; Academic Press: New York, NY, USA, 1988. [Google Scholar] [CrossRef]
- Smith, G. Does Gender Influence Online Survey Participation? A Record-Linkage Analysis of University Faculty Online Survey Response Behavior; ERIC Document Reproduction Service No. ED 501717; San Jose State University: San Jose, CA, USA, 2008. [Google Scholar]
- CEOWORLD Magazine. These Are the Countries with the Largest Household Size. Stats Gate; CEOWORLD Magazine: New York, NY, USA, 2020. [Google Scholar]
- Statistical Center of Iran. The Results of Estimating the Cost of Income of Urban Households. Available online: https://amar.org.ir/Portals/0/Files/fulltext/1400/NE_HazineDaramad_Shahri_1400.xlsx?ver=zqQ-kIijyzYMGO7lJtouBg%3d%3d (accessed on 2 September 2022).
- Sarwade, W.K.; Ambedkar, B. Brand preferences and consumption pattern of edible oils in Maharashtra state. Int. Conf. Econ. Financ. Res. 2011, 4, 330–334. [Google Scholar]
- Zhou, Q.; Dou, X.; Zhang, L.; Fan, W.; Guo, S.; Wu, W.; Tang, Z. Research progress on the origin traceability of edible oils. Oil Crop Sci. 2020, 5, 194–197. [Google Scholar] [CrossRef]
- Zhang, C.; Bai, J.; Wahl, T.I. Consumers’ willingness to pay for traceable pork, milk, and cooking oil in Nanjing, China. Food Control 2012, 27, 21–28. [Google Scholar] [CrossRef]
- Train, K.E. Recreation demand models with taste differences over people. Land Econ. 1998, 74, 230–239. [Google Scholar] [CrossRef]
- SAS Institute Inc. SAS® 9.4; SAS Institute Inc.: Cary, NC, USA, 2013. [Google Scholar]
- Street, D.J.; Burgess, L.; Louviere, J.J. Quick and easy choice sets: Constructing optimal and nearly optimal stated choice experiments. Int. J. Res. Mark. 2005, 22, 459–470. [Google Scholar] [CrossRef]
- Lancaster, K.J. A new approach to consumer theory. J. Political Econ. 1966, 74, 132–157. [Google Scholar] [CrossRef]
- McFadden, D. Conditional logit Anaysis of qualitative choice behavior. In Frontiers in Econometrics; Zarembka, P., Ed.; Academic Press: New York, NY, USA, 1974; pp. 105–142. [Google Scholar]
- Train, K.E. Discrete Choice Methods with Simulation, 2nd ed.; Cambridge University Press: Cambridge, UK, 2009. [Google Scholar]
- De-Magistris, T.; Gracia, A.; Nayga, R.M., Jr. On the use of honesty priming tasks to mitigate hypothetical bias in choice experiments. Am. J. Agric. Econ. 2013, 95, 1136–1154. [Google Scholar] [CrossRef]
- StataCorp. Stata Statistical Software: Release 14; StataCorp LP: College Station, TX, USA, 2015. [Google Scholar]
- Caputo, V.; Scarpa, R.; Nayga, R.M. Cue versus independent food attributes: The effect of adding attributes in choice experiments. Eur. Rev. Agric. Econ. 2017, 44, 211–230. [Google Scholar] [CrossRef]
- Hole, A.R.; Kolstad, J.R. Mixed logit estimation of willingness to pay distributions: A comparison of models in preference and WTP space data from a health-related choice experiment. Empir. Econ. 2012, 42, 445–469. [Google Scholar] [CrossRef]
- Zhang, M.; Fan, Y.; Cao, J.; Chen, L.; Chen, C. Willingness to Pay for Enhanced Mandatory Labelling of Genetically Modified Soybean Oil: Evidence from a Choice Experiment in China. Foods 2021, 10, 736. [Google Scholar] [CrossRef]
- Roe, B.; Teisl, M. Genetically modified food labeling: The impacts of message and messenger on consumer perceptions of labels and products. Food Policy 2007, 32, 49–66. [Google Scholar] [CrossRef]
- Rodríguez-Entrena, M.; Salazar-Ordóñez, M.; Sayadi, S. Applying partial least squares to model genetically modified food purchase intentions in southern Spain consumers. Food Policy 2013, 40, 44–53. [Google Scholar] [CrossRef]
- Zheng, Z.H. A study on the city consumers’ need of transgenic rice. Manag. World 2015, 3, 66–75. [Google Scholar]
- Valente, M.; Chaves, C. Perceptions and valuation of GM food: A study on the impact and importance of information provision. J. Clean. Prod. 2018, 172, 4110–4118. [Google Scholar] [CrossRef]
- Costa-Font, M.; Gil, J.M. Structural equation modelling of, consumer acceptance of genetically modified (GM) food in the mediterranean Europe: A cross country study. Food Qual. Prefer. 2009, 20, 399–409. [Google Scholar] [CrossRef]
- DeLong, K.L.; Grebitus, C. Genetically modified labeling: The role of consumers’ trust and personality. Agribusiness 2018, 34, 266–282. [Google Scholar] [CrossRef]
- Ardebili, A.T.; Rickertsen, K. Personality traits, knowledge, and consumer acceptance of genetically modified plant and animal products. Food Qual. Prefer. 2020, 80, 103825. [Google Scholar] [CrossRef]
- Whittingham, N.; Boecker, A.; Grygorczyk, A. Personality traits, basic individual values and GMO risk perception of twitter users. J. Risk Res. 2020, 23, 522–540. [Google Scholar] [CrossRef]
- Siegrist, M. The influence of trust and perceptions of risks and benefits on the acceptance of gene technology. Risk Anal. 2000, 20, 195–203. [Google Scholar] [CrossRef]
- Frewer, L.J.; Howard, C.; Shepherd, R. The influence of initial attitudes on responses to communication about genetic engineering in food production. Agric. Hum. Values 1998, 15, 15–30. [Google Scholar] [CrossRef]
Publisher’s Note: MDPI stays neutral with regard to jurisdictional claims in published maps and institutional affiliations. |
© 2022 by the authors. Licensee MDPI, Basel, Switzerland. This article is an open access article distributed under the terms and conditions of the Creative Commons Attribution (CC BY) license (https://creativecommons.org/licenses/by/4.0/).