Assessment of Weather Research and Forecasting (WRF) Physical Schemes Parameterization to Predict Moderate to Extreme Rainfall in Poorly Gauged Basin
Abstract
1. Introduction
2. Materials and Methods
2.1. Study Area
2.2. Location of Hydrological Stations
2.3. Collection of Data
2.4. Categorization of Rainfall Event
2.5. Configuration of WRF Model Domain
2.6. Selection of Schemes for Model Sensitivity Test
2.7. Evaluation Methods for Model Performance
2.7.1. Root Mean Square Error
2.7.2. Percentage Error
2.7.3. Contingency Table Matrix and Relatives Measures
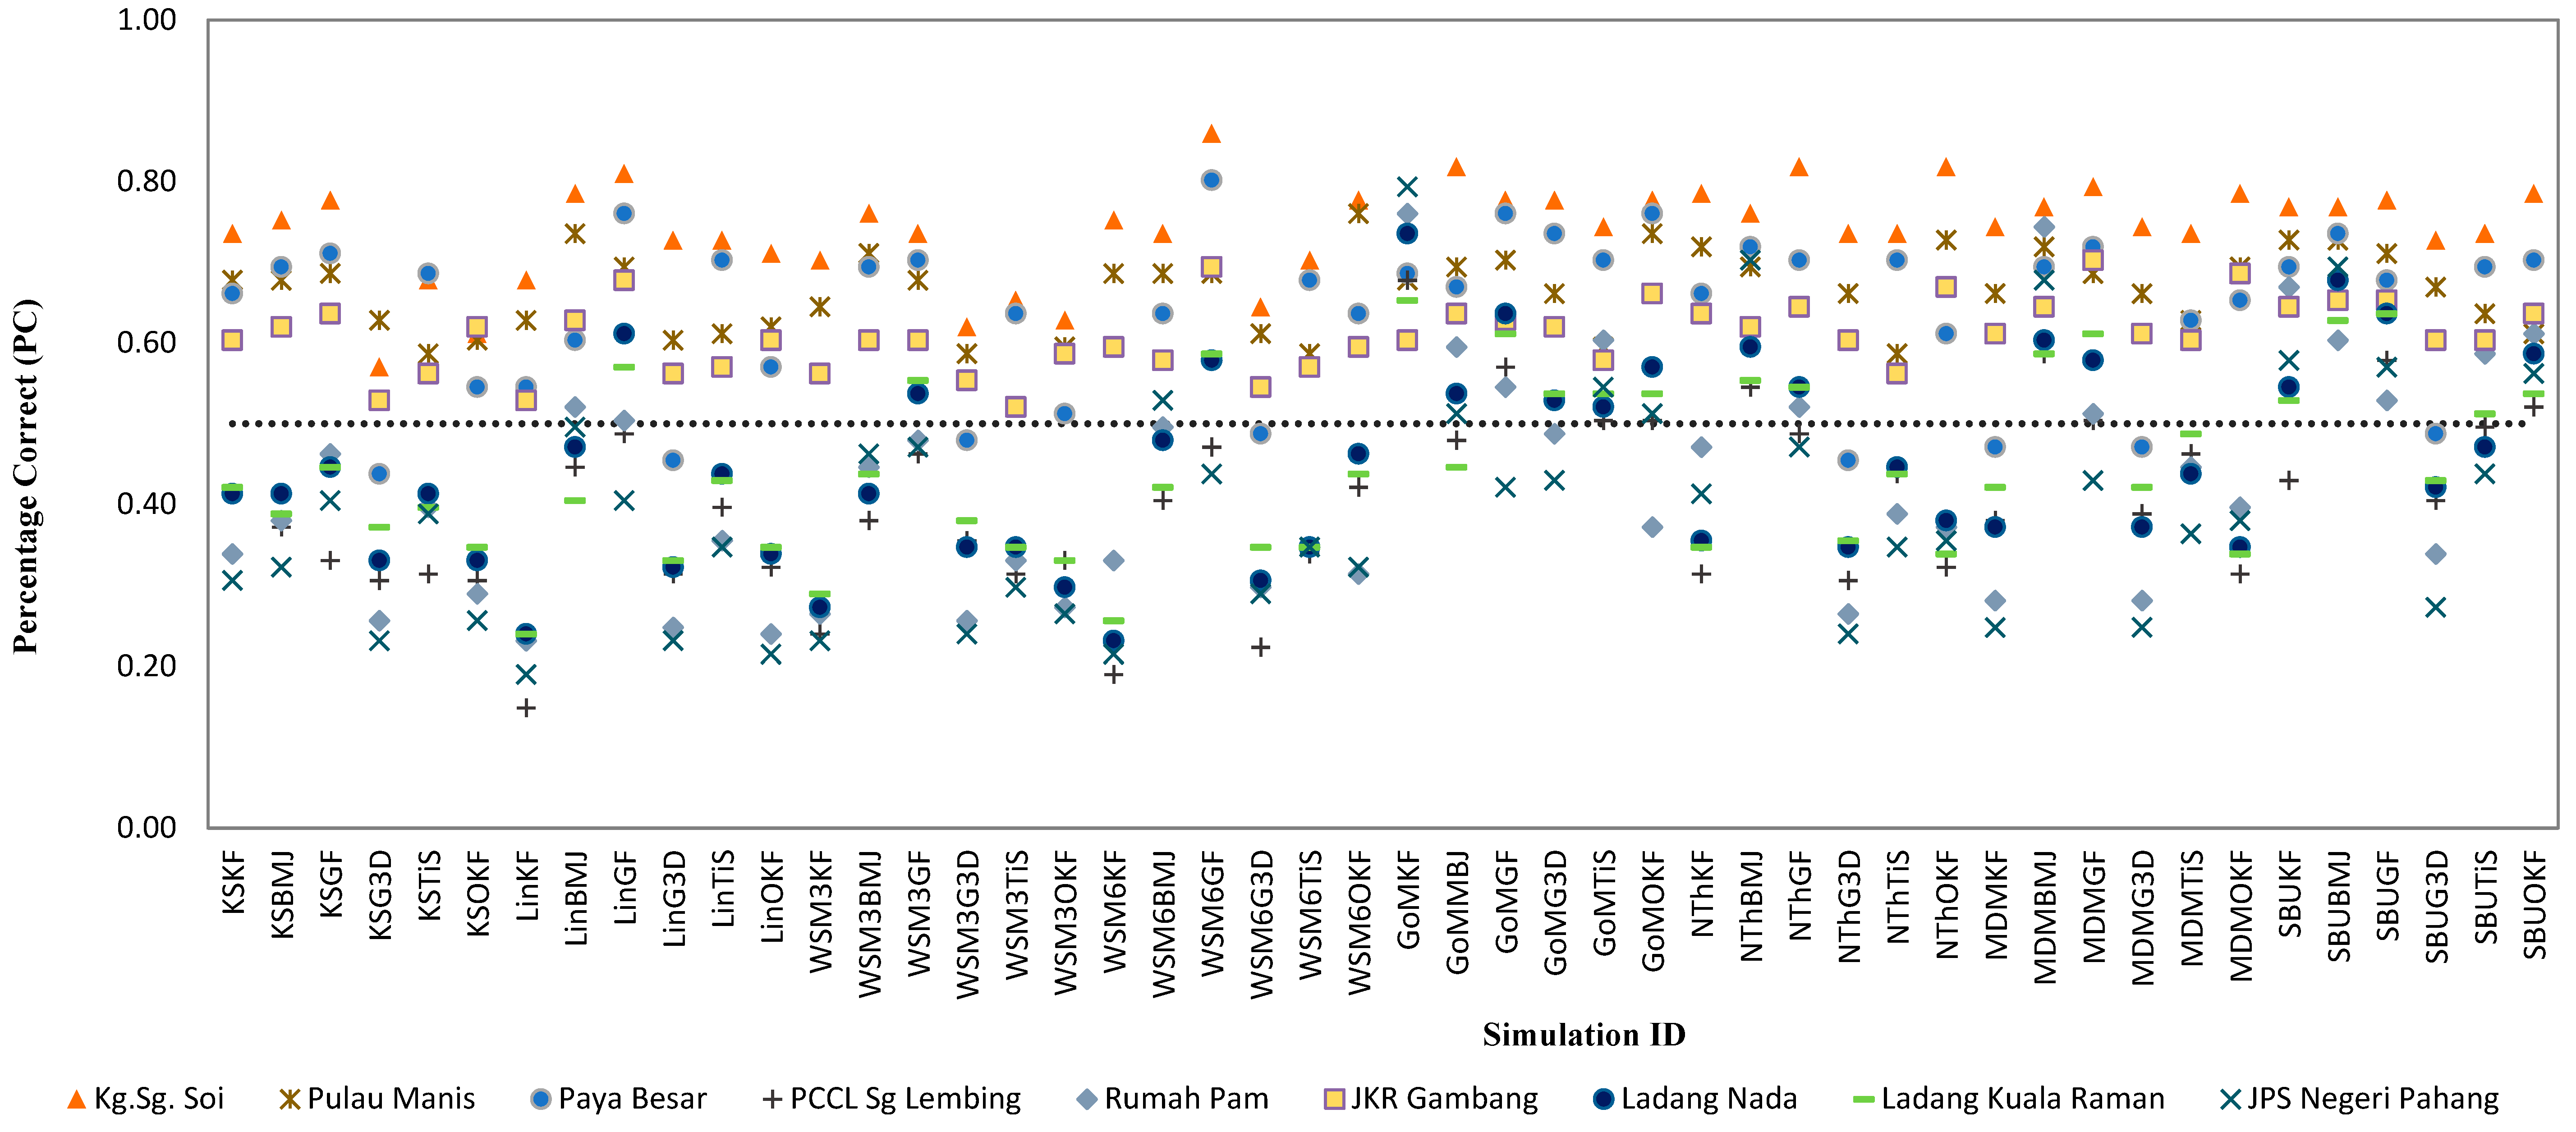
2.7.4. Percentage of Correction
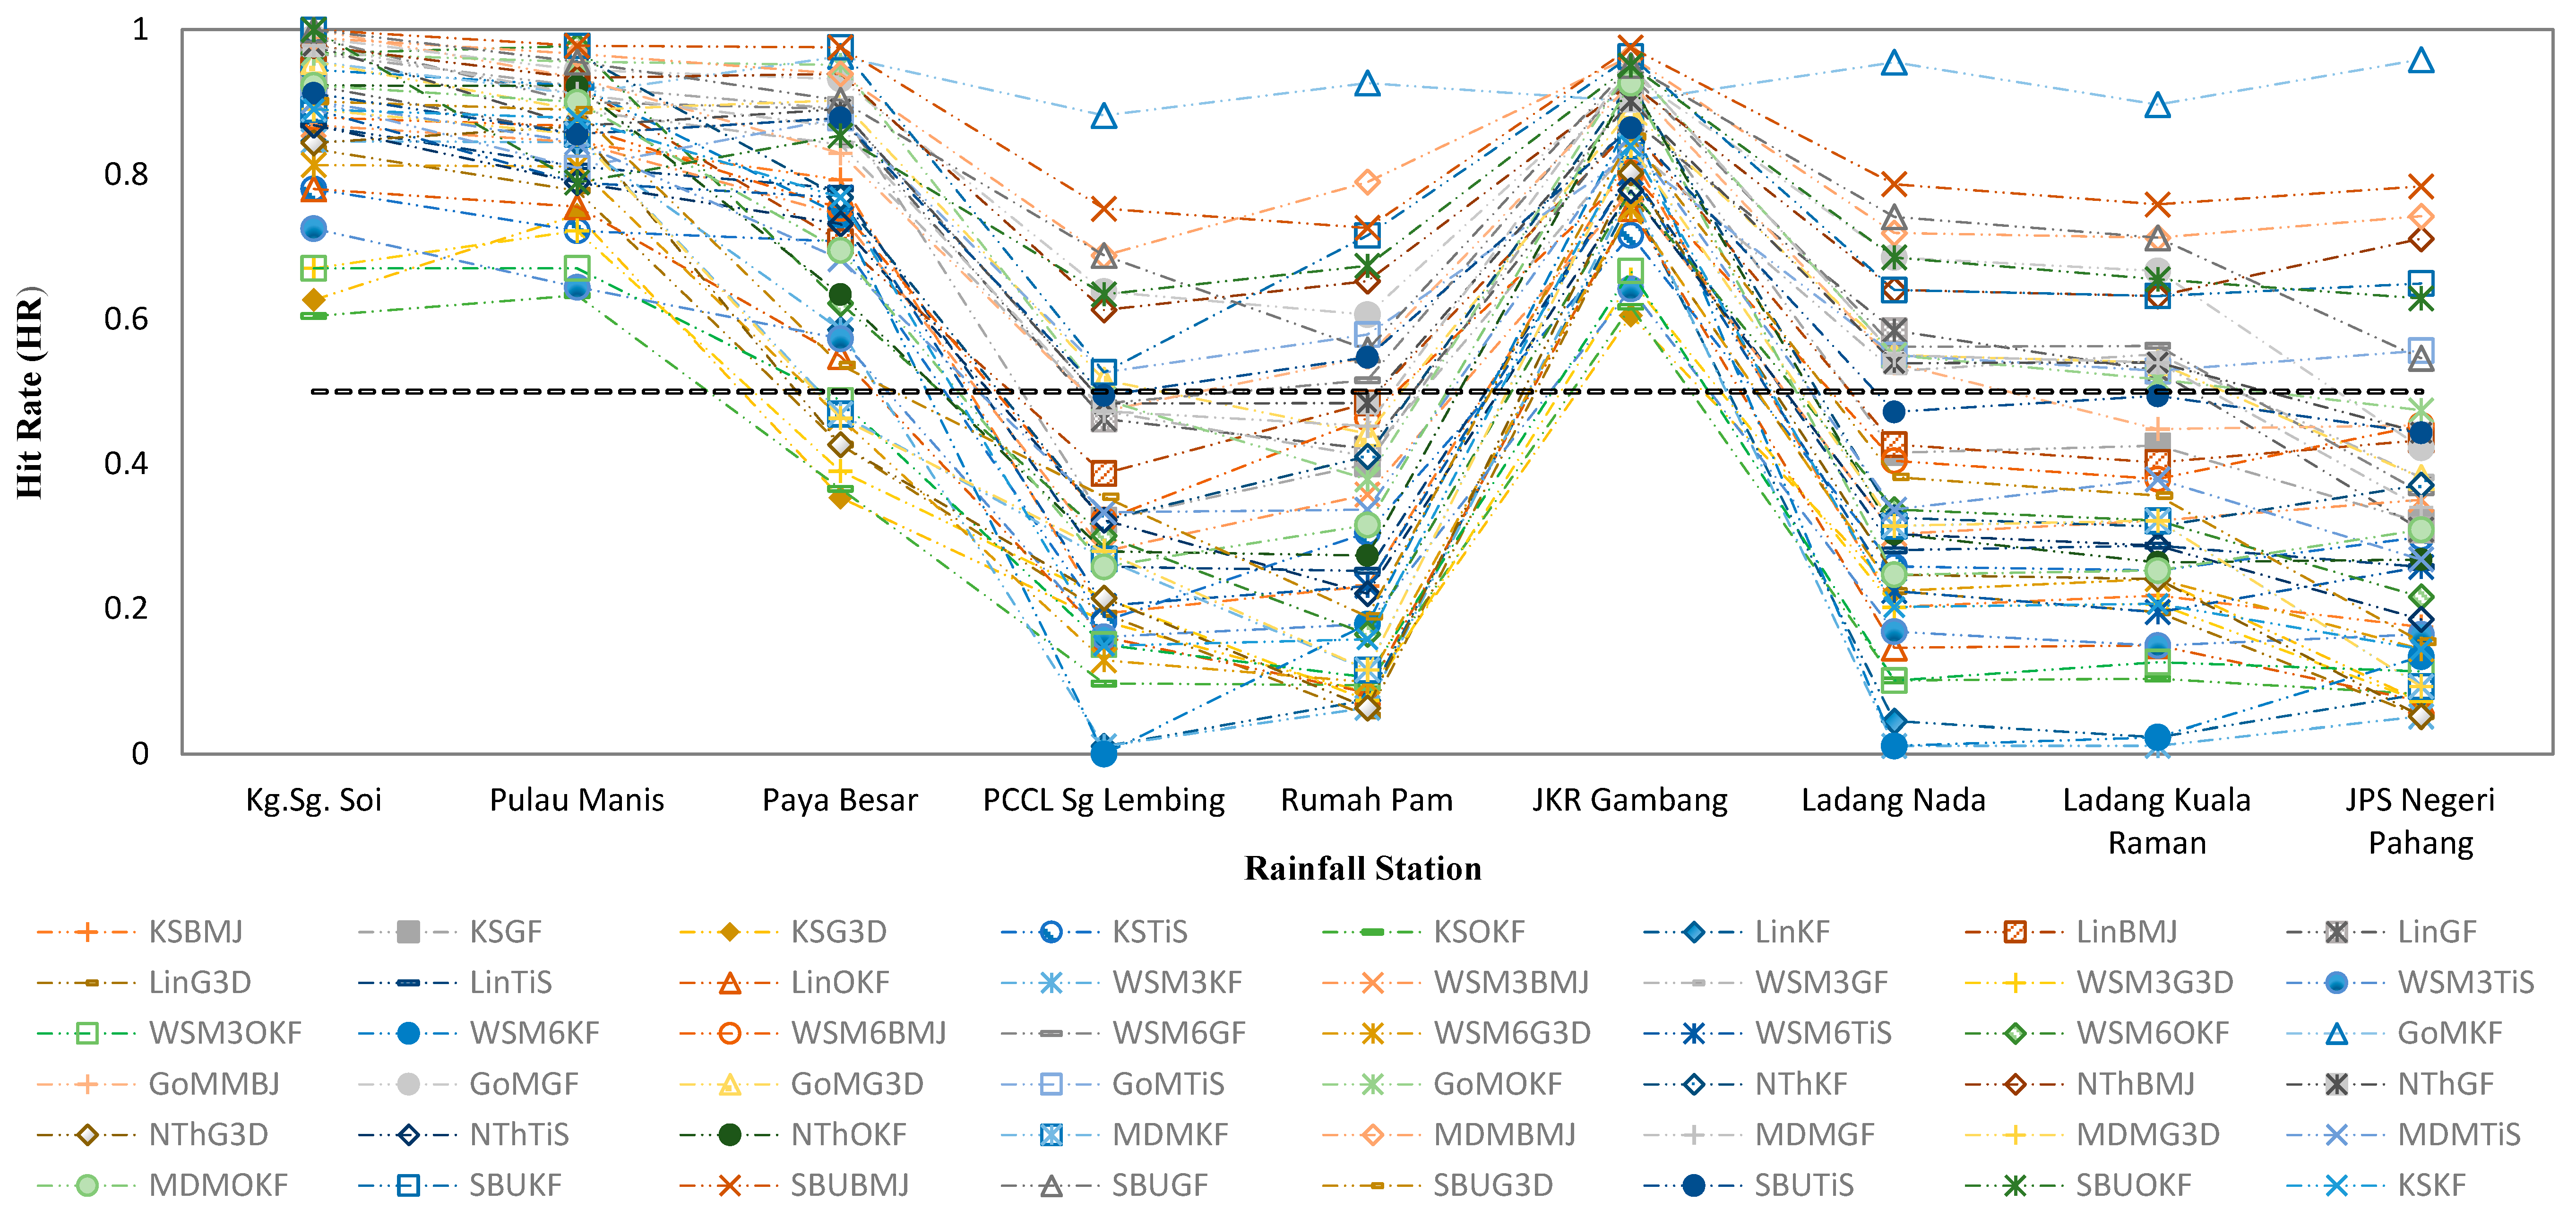
2.7.5. Hit Rate
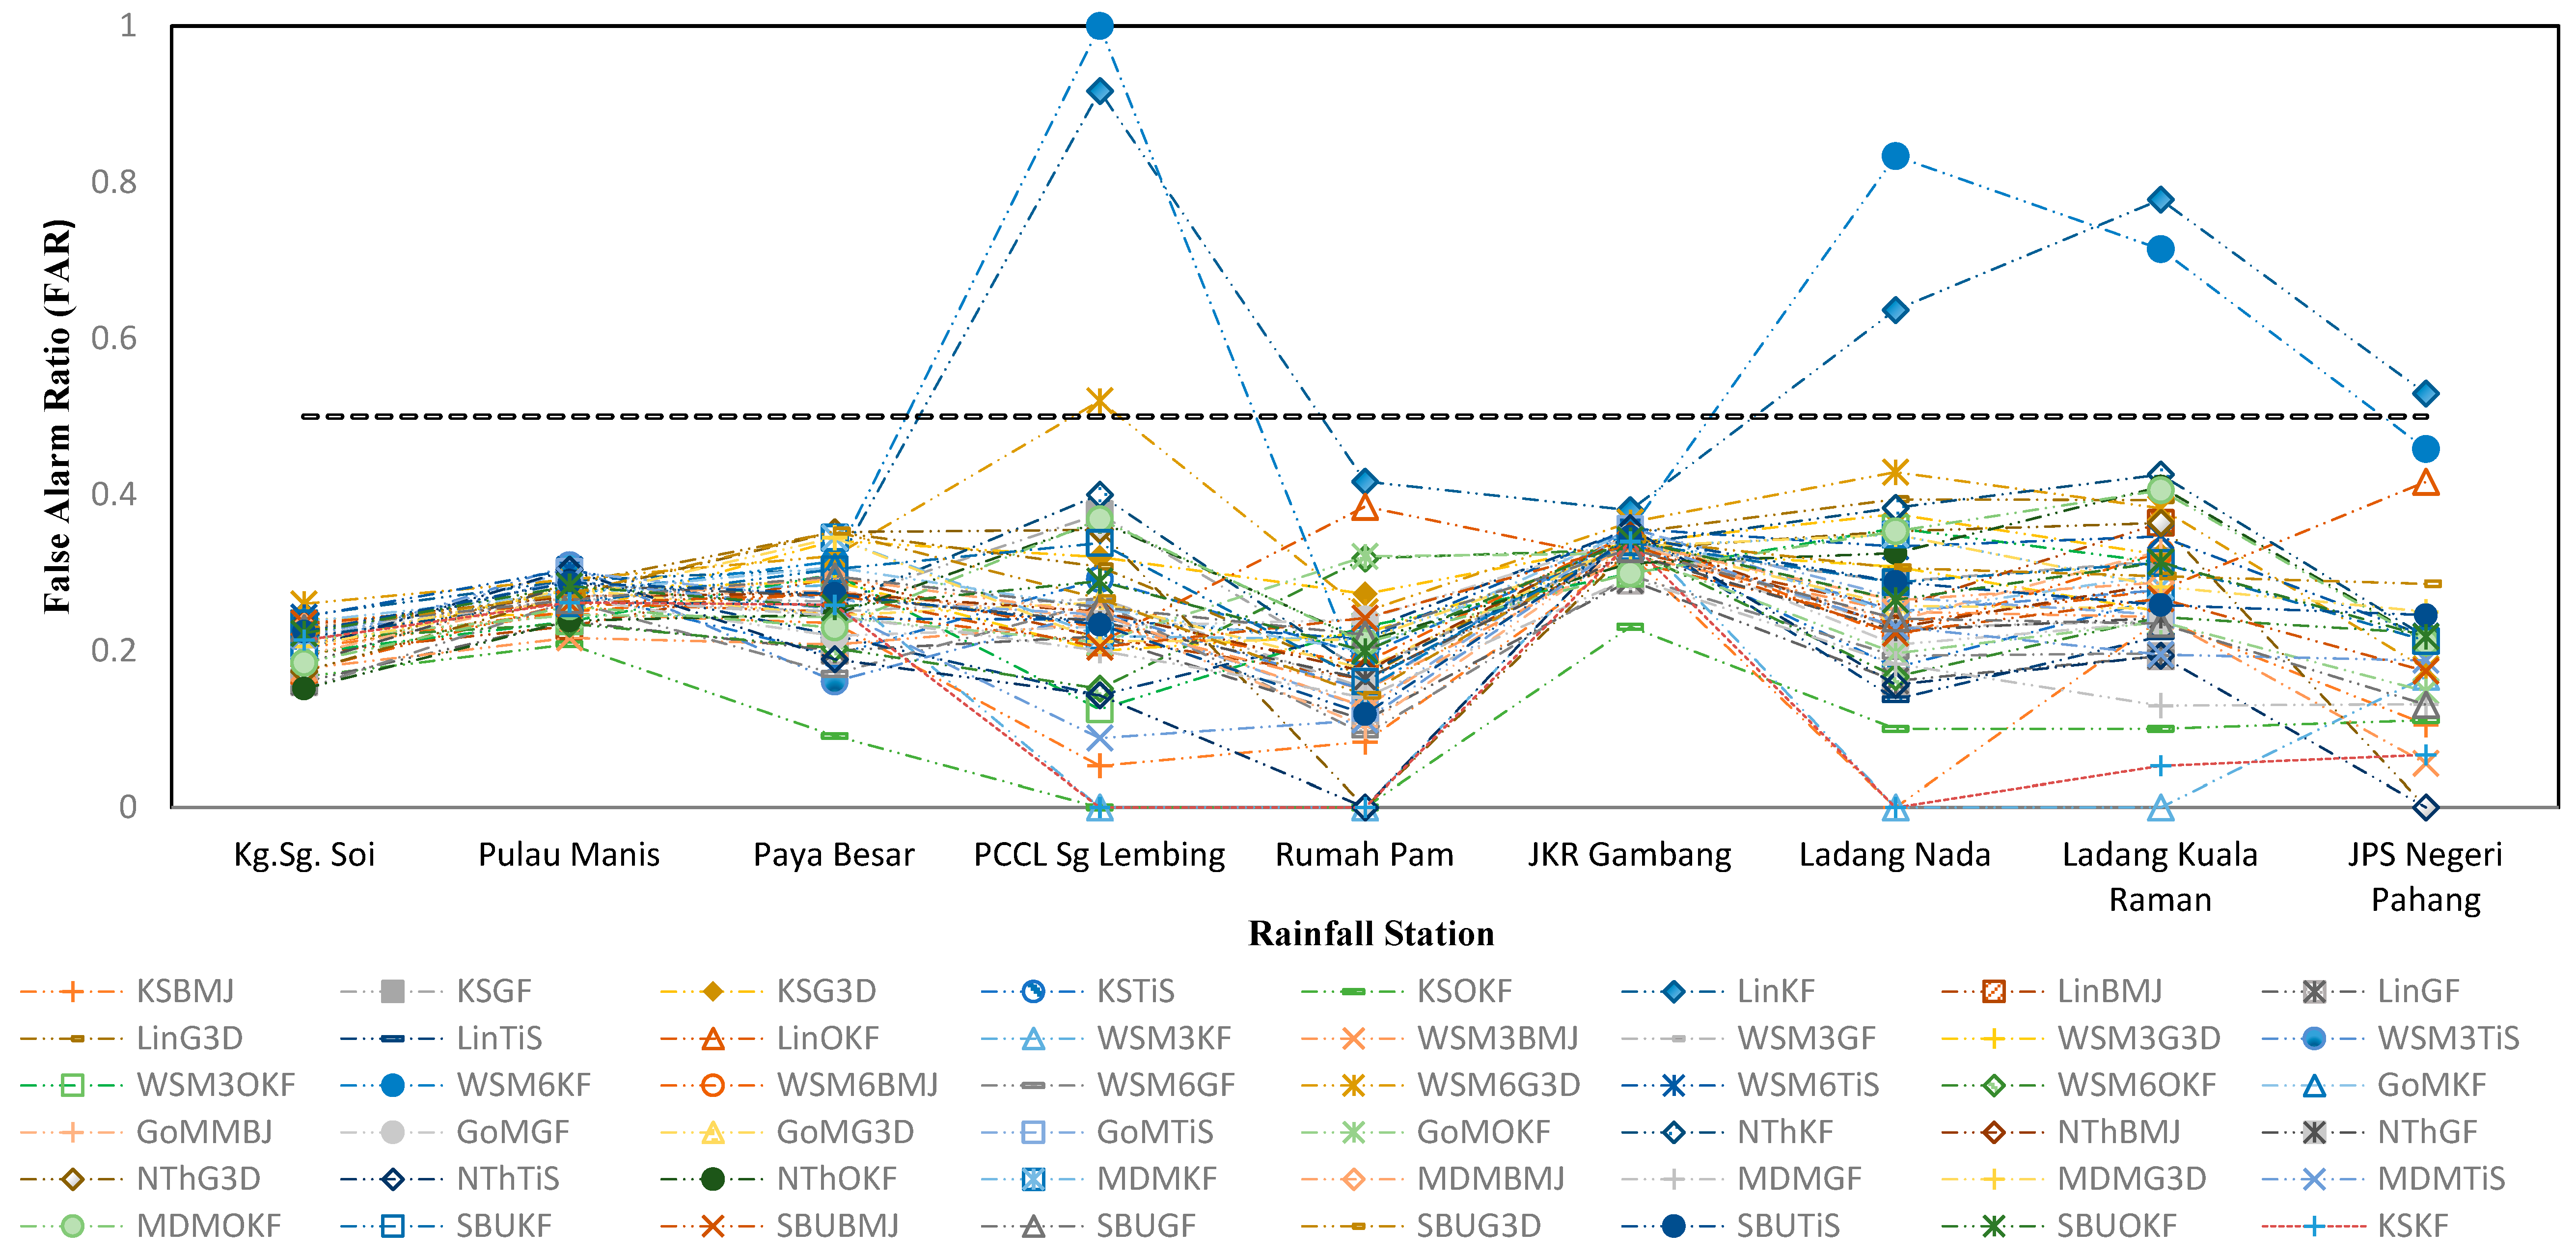
2.7.6. False Alarm Ratio
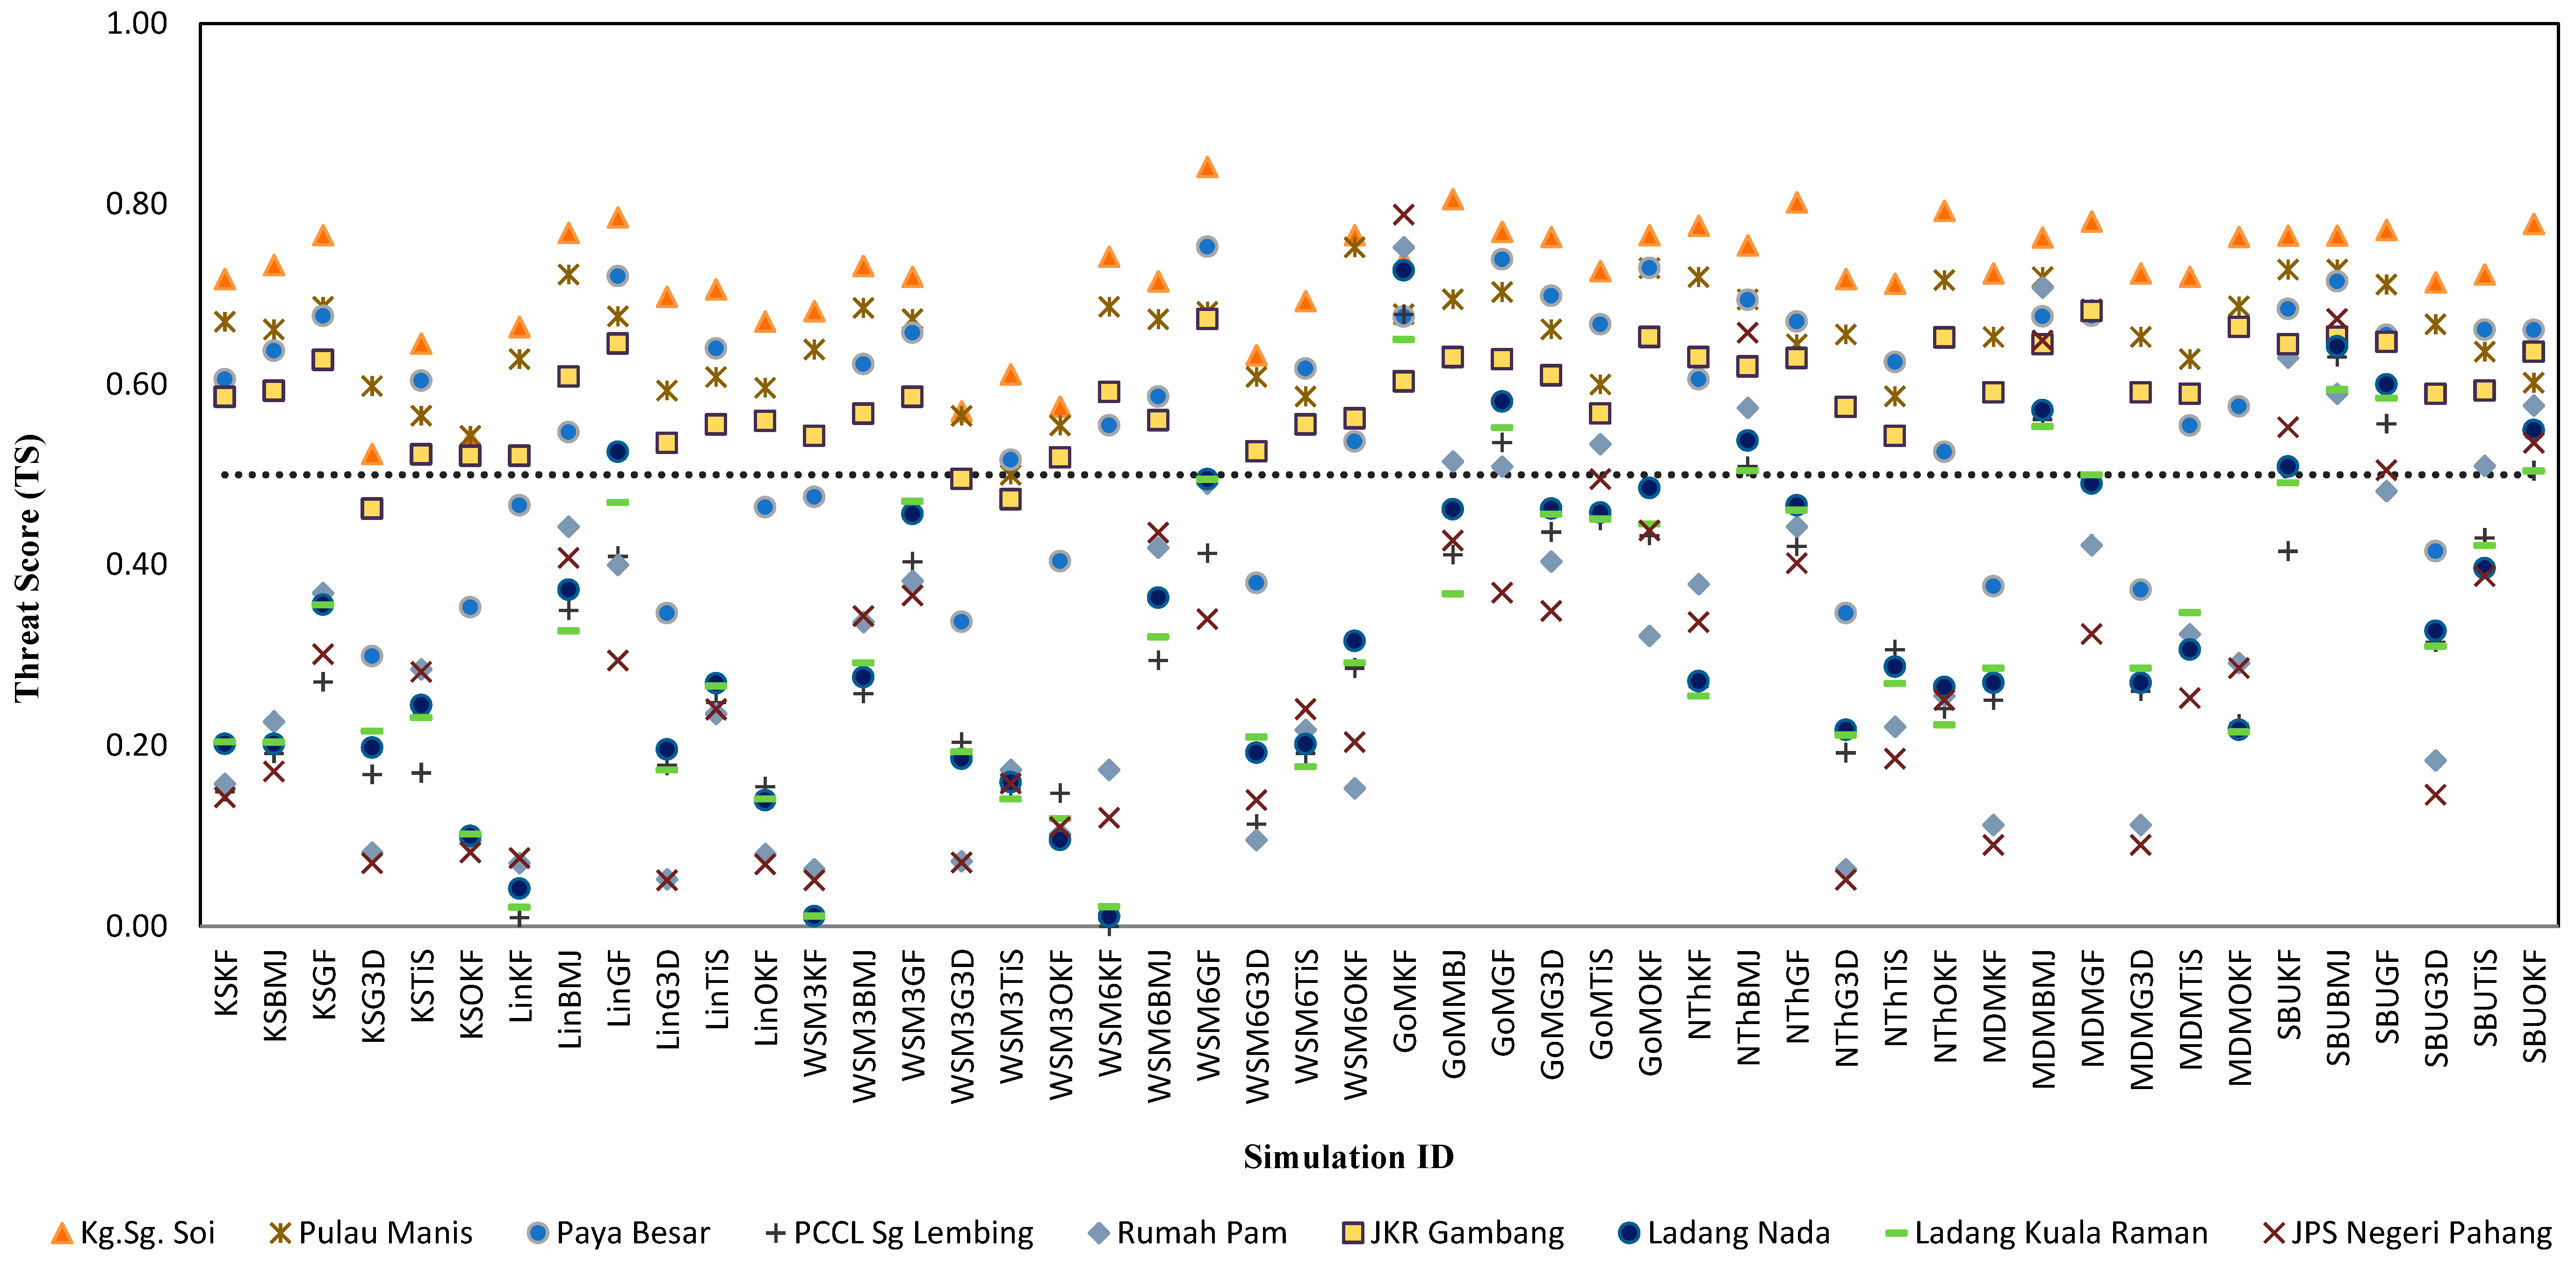
2.7.7. Threat Score
2.7.8. Bias
3. Results
3.1. Model Schemes Evaluation
3.2. Performance of the Schemes Combination in Predicting Rainfall
3.3. The Spatial Rainfall Pattern Distribution
4. Discussion
5. Conclusions
Author Contributions
Funding
Institutional Review Board Statement
Informed Consent Statement
Data Availability Statement
Acknowledgments
Conflicts of Interest
Appendix A
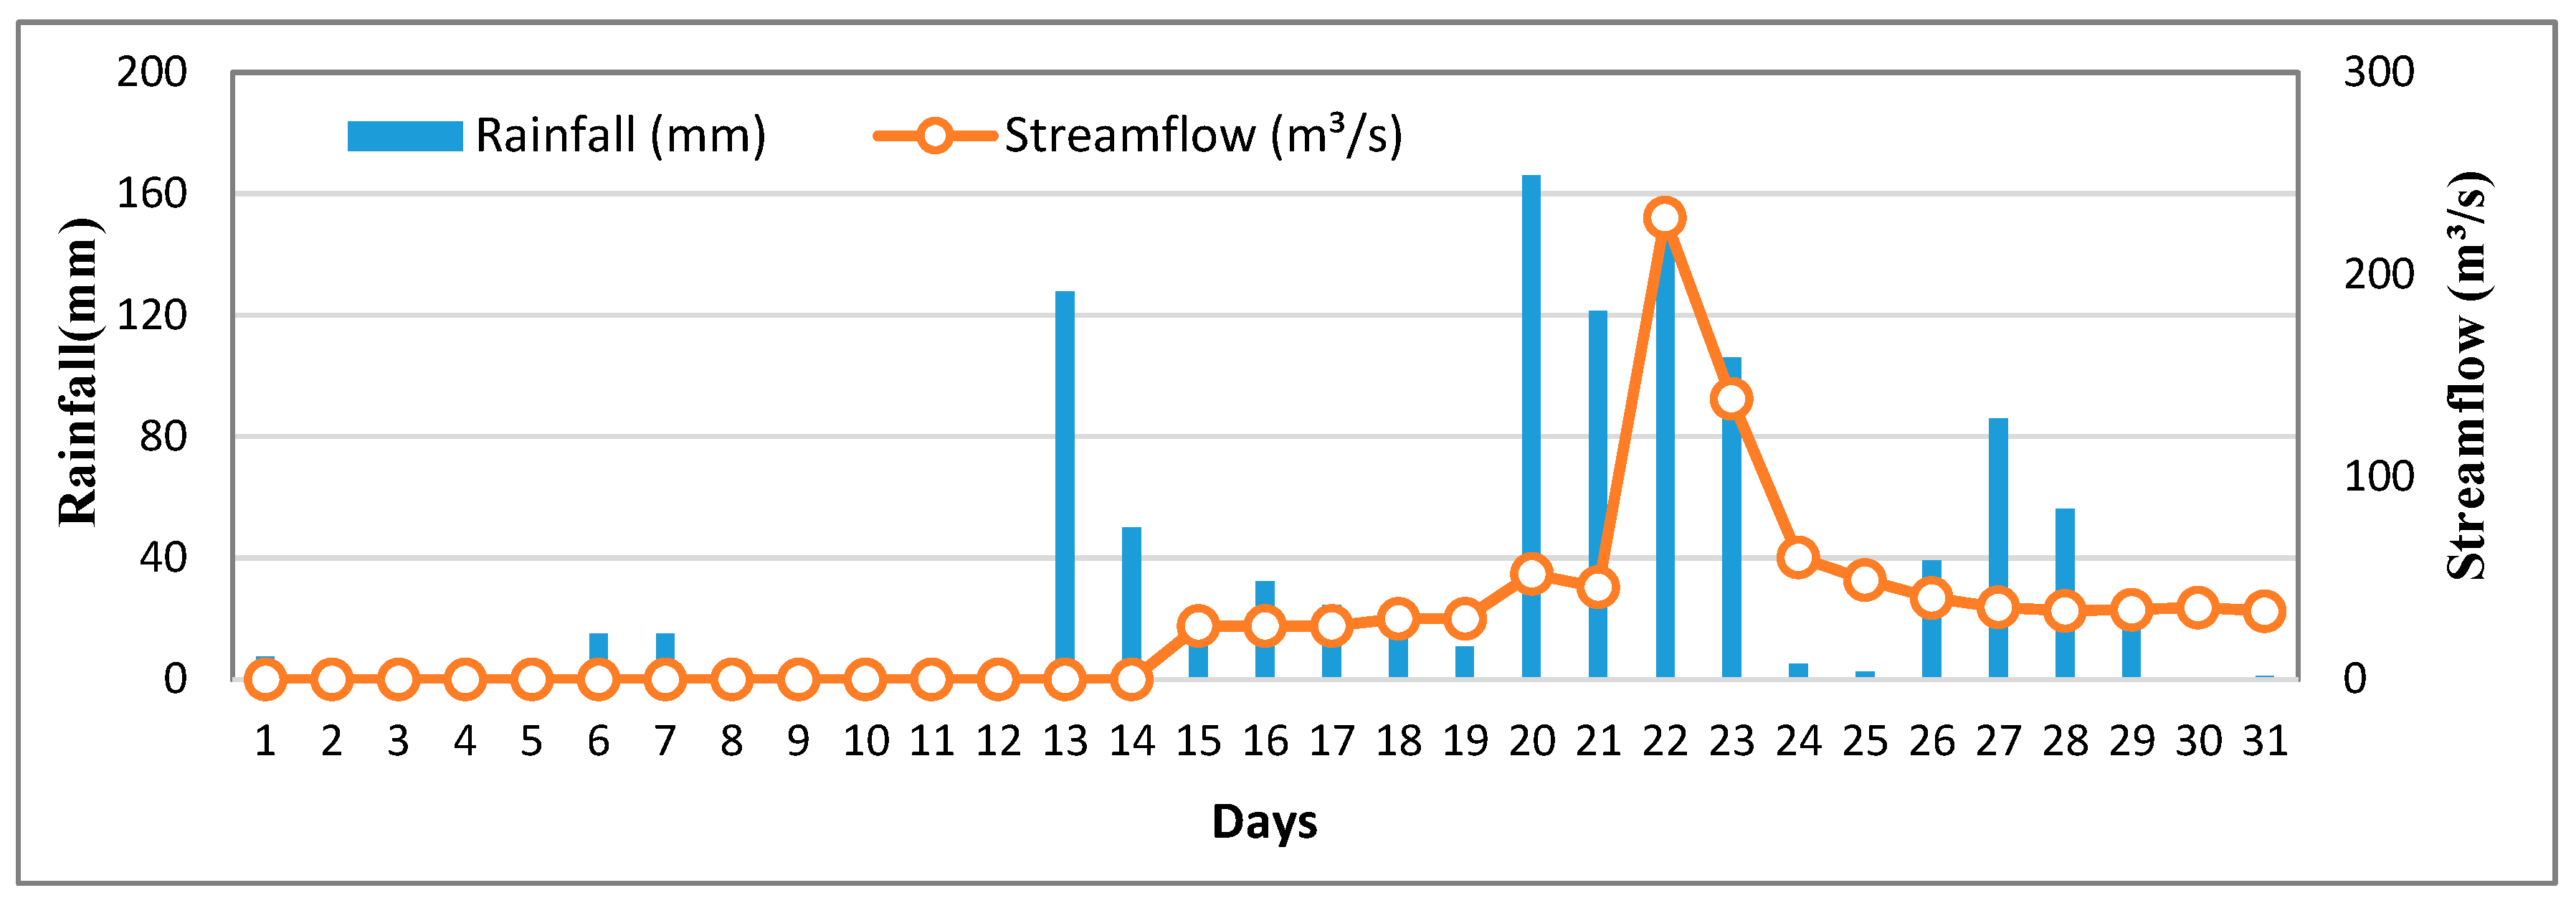

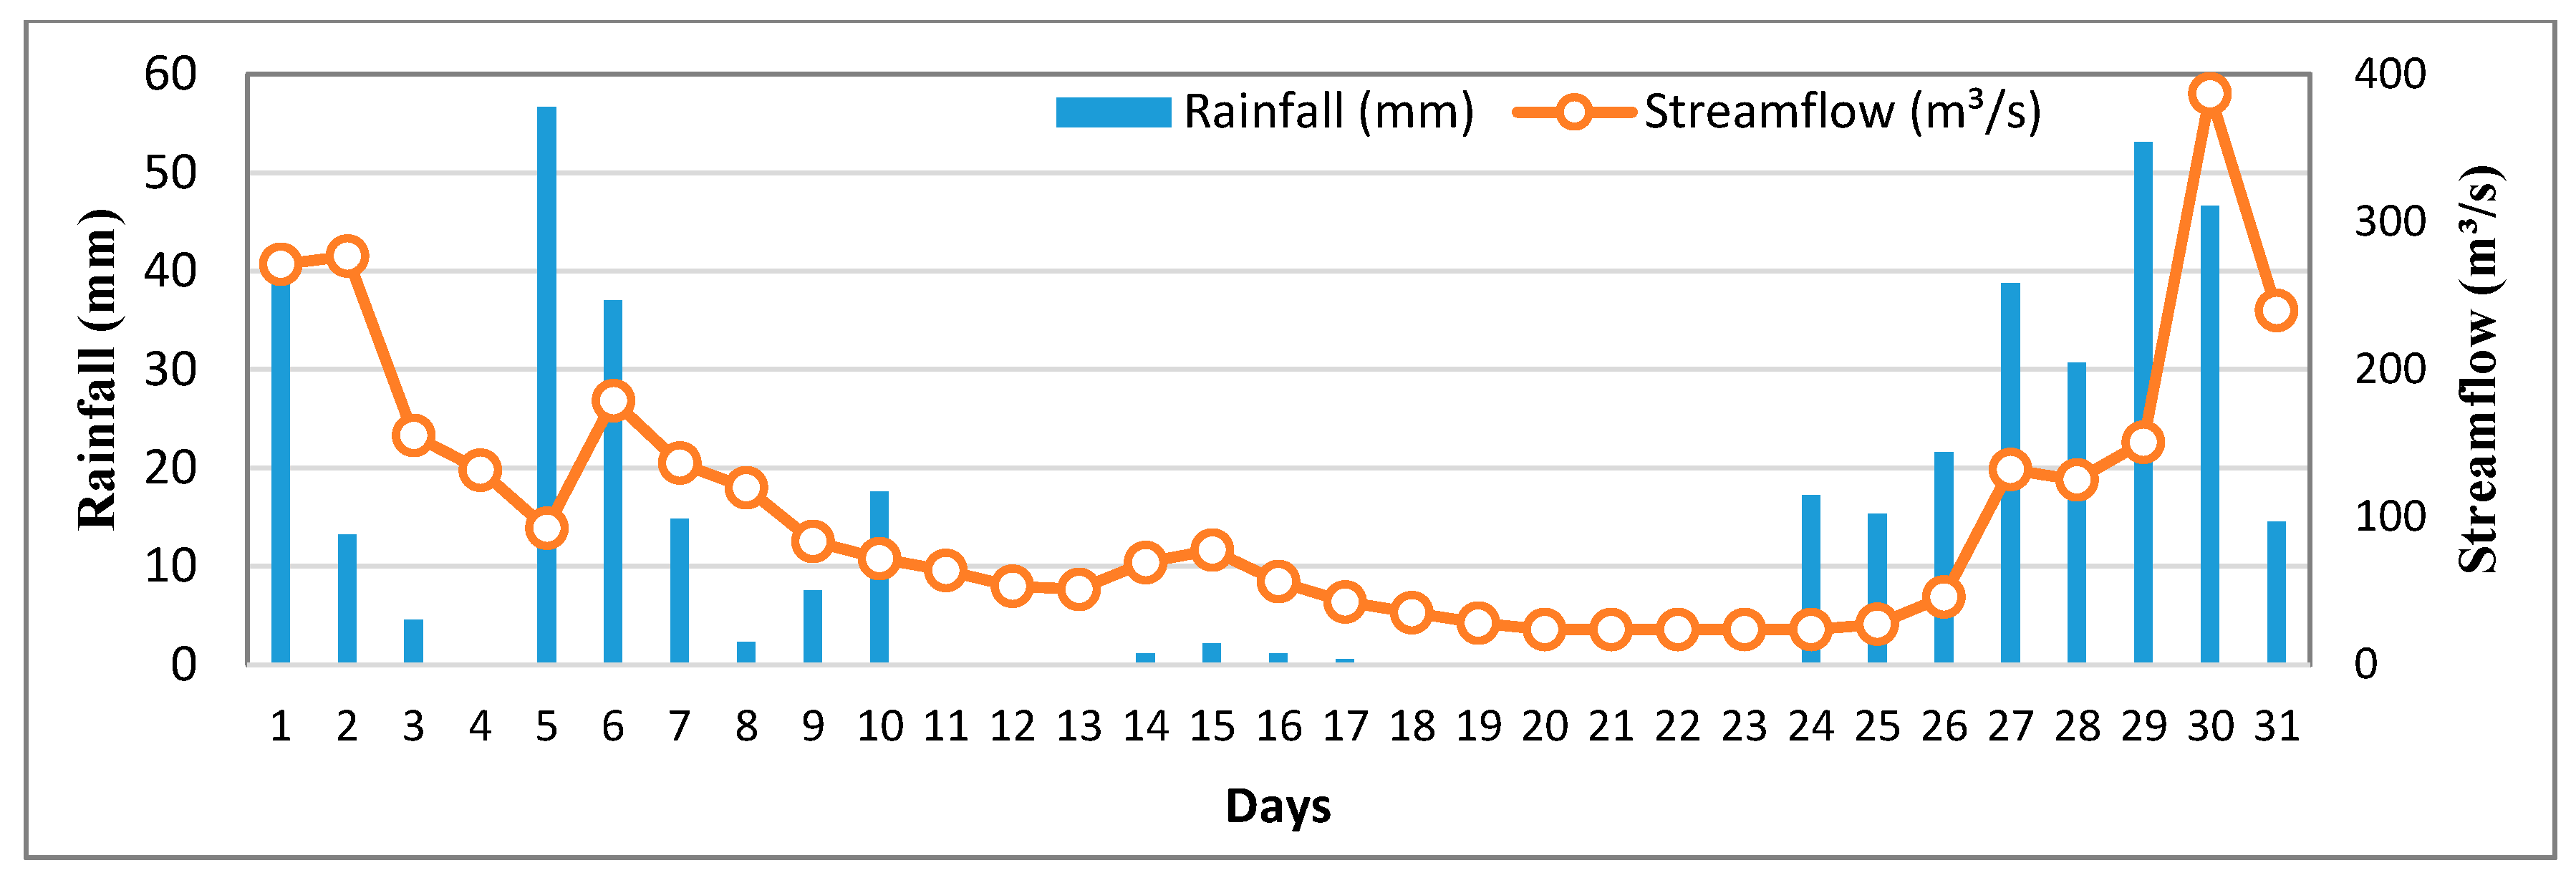


| Schemes name | Kg.Sg. Soi | Pulau Manis | Paya Besar | PCCL Lembing | Rumah Pam | JKR Gamabang | Ladang Nada | Ladang Kuala Raman | JPS Negeri Pahang | R 1 | R 2 | R 3 | R 4 | R 5 | R 6 | R7 | R8 | R 9 | Total | All Ranked |
|---|---|---|---|---|---|---|---|---|---|---|---|---|---|---|---|---|---|---|---|---|
| KSKF | 34 | 34 | 54 | 70 | 49 | 32 | 58 | 47 | 73 | 20 | 21 | 18 | 29 | 11 | 21 | 33 | 20 | 9 | 182 | 19 |
| KSBMJ | 33 | 36 | 55 | 74 | 53 | 34 | 58 | 50 | 80 | 19 | 28 | 23 | 43 | 19 | 25 | 34 | 40 | 24 | 255 | 27 |
| KSGF | 26 | 25 | 52 | 76 | 45 | 25 | 35 | 30 | 76 | 4 | 2 | 10 | 44 | 6 | 2 | 2 | 2 | 17 | 89 | 6 |
| KSG3D | 39 | 38 | 57 | 70 | 55 | 35 | 57 | 47 | 81 | 33 | 38 | 33 | 31 | 24 | 34 | 26 | 21 | 29 | 269 | 31 |
| KSTiS | 33 | 33 | 52 | 69 | 50 | 30 | 54 | 43 | 76 | 16 | 17 | 11 | 22 | 16 | 16 | 15 | 12 | 16 | 141 | 13 |
| KSOKF | 37 | 37 | 55 | 76 | 49 | 34 | 67 | 52 | 73 | 27 | 30 | 22 | 45 | 13 | 30 | 45 | 41 | 10 | 263 | 28 |
| LinKF | 39 | 36 | 58 | 71 | 60 | 34 | 58 | 50 | 84 | 37 | 25 | 37 | 38 | 42 | 29 | 40 | 38 | 42 | 328 | 38 |
| LinBMJ | 31 | 38 | 55 | 77 | 53 | 34 | 73 | 62 | 75 | 11 | 35 | 20 | 46 | 20 | 28 | 46 | 44 | 14 | 264 | 29 |
| LinGF | 32 | 28 | 55 | 60 | 52 | 27 | 31 | 27 | 80 | 13 | 6 | 21 | 3 | 17 | 5 | 1 | 1 | 23 | 90 | 7 |
| LinG3D | 41 | 38 | 58 | 70 | 59 | 36 | 57 | 49 | 83 | 42 | 44 | 42 | 30 | 36 | 43 | 30 | 32 | 34 | 333 | 39 |
| LinTiS | 37 | 35 | 54 | 67 | 56 | 33 | 54 | 45 | 82 | 30 | 23 | 15 | 15 | 28 | 24 | 13 | 15 | 31 | 194 | 20 |
| LinOKF | 39 | 38 | 58 | 70 | 54 | 35 | 58 | 47 | 81 | 34 | 36 | 36 | 35 | 22 | 33 | 35 | 23 | 27 | 281 | 35 |
| WSM3KF | 41 | 39 | 59 | 71 | 61 | 36 | 59 | 50 | 85 | 48 | 45 | 48 | 40 | 45 | 45 | 42 | 39 | 47 | 399 | 48 |
| WSM3BMJ | 36 | 35 | 55 | 67 | 55 | 32 | 54 | 44 | 80 | 23 | 22 | 19 | 16 | 23 | 20 | 16 | 13 | 22 | 174 | 17 |
| WSM3GF | 33 | 29 | 55 | 49 | 56 | 28 | 52 | 41 | 83 | 17 | 8 | 25 | 2 | 26 | 9 | 9 | 4 | 36 | 136 | 12 |
| WSM3G3D | 41 | 39 | 58 | 70 | 59 | 36 | 57 | 48 | 83 | 47 | 46 | 47 | 28 | 34 | 46 | 32 | 29 | 38 | 347 | 44 |
| WSM3TiS | 41 | 38 | 57 | 69 | 58 | 36 | 56 | 48 | 83 | 43 | 43 | 30 | 24 | 32 | 38 | 21 | 27 | 40 | 298 | 36 |
| WSM3OKF | 41 | 39 | 58 | 71 | 57 | 36 | 58 | 49 | 81 | 46 | 47 | 41 | 37 | 29 | 44 | 38 | 30 | 26 | 338 | 41 |
| WSM6KF | 40 | 38 | 58 | 71 | 60 | 35 | 58 | 50 | 84 | 38 | 34 | 40 | 39 | 41 | 36 | 41 | 37 | 44 | 350 | 45 |
| WSM6BMJ | 34 | 37 | 57 | 68 | 60 | 60 | 57 | 48 | 84 | 21 | 29 | 29 | 18 | 38 | 48 | 25 | 25 | 43 | 276 | 32 |
| WSM6GF | 30 | 27 | 53 | 72 | 41 | 27 | 56 | 43 | 73 | 9 | 4 | 13 | 41 | 4 | 6 | 19 | 11 | 11 | 118 | 11 |
| WSM6G3D | 39 | 38 | 57 | 70 | 55 | 35 | 57 | 48 | 80 | 35 | 37 | 35 | 34 | 25 | 37 | 28 | 24 | 21 | 276 | 33 |
| WSM6TiS | 38 | 36 | 55 | 69 | 56 | 34 | 56 | 46 | 81 | 31 | 26 | 26 | 27 | 27 | 26 | 20 | 18 | 28 | 229 | 24 |
| WSM6OKF | 37 | 37 | 58 | 70 | 57 | 35 | 57 | 48 | 81 | 28 | 31 | 38 | 32 | 30 | 32 | 29 | 26 | 30 | 276 | 34 |
| GoMKF | 34 | 32 | 49 | 64 | 52 | 30 | 51 | 43 | 76 | 22 | 16 | 3 | 8 | 18 | 15 | 5 | 10 | 15 | 112 | 10 |
| GoMBMJ | 37 | 44 | 57 | 74 | 67 | 41 | 63 | 58 | 96 | 26 | 48 | 32 | 42 | 48 | 47 | 43 | 43 | 48 | 377 | 47 |
| GoMGF | 27 | 29 | 49 | 168 | 64 | 32 | 164 | 119 | 79 | 6 | 9 | 4 | 48 | 47 | 23 | 48 | 48 | 20 | 253 | 26 |
| GoMG3D | 24 | 28 | 50 | 65 | 39 | 28 | 54 | 44 | 62 | 3 | 5 | 5 | 10 | 3 | 8 | 14 | 14 | 2 | 64 | 3 |
| GoMTiS | 31 | 30 | 51 | 63 | 53 | 30 | 50 | 41 | 77 | 10 | 12 | 6 | 6 | 21 | 14 | 4 | 6 | 18 | 97 | 8 |
| GoMOKF | 37 | 33 | 57 | 64 | 58 | 31 | 53 | 46 | 82 | 29 | 18 | 31 | 7 | 33 | 19 | 11 | 17 | 32 | 197 | 22 |
| NThKF | 39 | 36 | 57 | 69 | 59 | 34 | 56 | 47 | 83 | 32 | 27 | 34 | 26 | 35 | 27 | 22 | 22 | 39 | 264 | 30 |
| NThBMJ | 29 | 29 | 53 | 61 | 48 | 27 | 47 | 37 | 72 | 8 | 11 | 12 | 4 | 8 | 4 | 3 | 3 | 8 | 61 | 2 |
| NThGF | 29 | 25 | 52 | 48 | 43 | 26 | 51 | 58 | 71 | 7 | 3 | 9 | 1 | 5 | 3 | 7 | 42 | 7 | 84 | 5 |
| NThG3D | 40 | 38 | 58 | 69 | 60 | 35 | 57 | 49 | 82 | 39 | 33 | 39 | 23 | 40 | 35 | 27 | 35 | 33 | 304 | 37 |
| NThTiS | 36 | 34 | 55 | 66 | 50 | 31 | 53 | 42 | 77 | 25 | 19 | 24 | 13 | 14 | 18 | 10 | 8 | 19 | 150 | 15 |
| NThOKF | 41 | 38 | 58 | 70 | 59 | 36 | 58 | 49 | 83 | 41 | 42 | 43 | 33 | 37 | 39 | 36 | 31 | 37 | 339 | 42 |
| MDMKF | 41 | 38 | 58 | 68 | 60 | 36 | 57 | 49 | 84 | 44 | 40 | 45 | 20 | 43 | 41 | 23 | 33 | 45 | 334 | 40 |
| MDMBMJ | 27 | 31 | 51 | 64 | 49 | 29 | 51 | 42 | 71 | 5 | 13 | 7 | 9 | 9 | 10 | 6 | 7 | 6 | 72 | 4 |
| MDMGF | 32 | 29 | 54 | 65 | 63 | 30 | 66 | 73 | 80 | 12 | 7 | 14 | 11 | 46 | 13 | 44 | 45 | 25 | 217 | 23 |
| MDMG3D | 41 | 38 | 58 | 68 | 60 | 36 | 57 | 49 | 84 | 45 | 41 | 46 | 21 | 44 | 42 | 24 | 34 | 46 | 343 | 43 |
| MDMTiS | 39 | 38 | 56 | 68 | 57 | 35 | 54 | 45 | 83 | 36 | 32 | 28 | 17 | 31 | 31 | 18 | 16 | 35 | 244 | 25 |
| MDMOKF | 41 | 38 | 58 | 70 | 60 | 36 | 58 | 49 | 83 | 40 | 39 | 44 | 36 | 39 | 40 | 37 | 36 | 41 | 352 | 46 |
| SBUKF | 32 | 31 | 54 | 67 | 49 | 29 | 54 | 74 | 43 | 14 | 14 | 16 | 14 | 10 | 11 | 17 | 46 | 1 | 143 | 14 |
| SBUBMJ | 21 | 29 | 45 | 62 | 36 | 27 | 51 | 41 | 63 | 2 | 10 | 1 | 5 | 1 | 7 | 8 | 5 | 3 | 42 | 1 |
| SBUGF | 20 | 21 | 47 | 125 | 37 | 24 | 127 | 104 | 64 | 1 | 1 | 2 | 47 | 2 | 1 | 47 | 47 | 4 | 152 | 16 |
| SBUG3D | 36 | 34 | 56 | 69 | 50 | 32 | 57 | 47 | 75 | 24 | 20 | 27 | 25 | 15 | 22 | 31 | 19 | 13 | 196 | 21 |
| SBUTiS | 33 | 31 | 52 | 66 | 49 | 30 | 54 | 42 | 74 | 15 | 15 | 8 | 12 | 12 | 12 | 12 | 9 | 12 | 107 | 9 |
| SBUOKF | 33 | 36 | 54 | 68 | 46 | 30 | 58 | 48 | 71 | 18 | 24 | 17 | 19 | 7 | 17 | 39 | 28 | 5 | 174 | 18 |
| Schemes | PC | HR | FAR | TS | RMSE | BIAS | Total | Cumulative Rank |
|---|---|---|---|---|---|---|---|---|
| KSKF | 29 | 33 | 4 | 34 | 19 | 14 | 133 | 21 |
| KSBMJ | 26 | 30 | 3 | 29 | 27 | 13 | 128 | 18 |
| KSGF | 18 | 15 | 34 | 17 | 6 | 31 | 121 | 16 |
| KSG3D | 47 | 45 | 45 | 43 | 31 | 4 | 215 | 45 |
| KSTiS | 34 | 37 | 19 | 36 | 13 | 11 | 150 | 29 |
| KSOKF | 40 | 48 | 1 | 48 | 28 | 1 | 166 | 31 |
| LinKF | 48 | 40 | 48 | 45 | 38 | 9 | 228 | 48 |
| LinBMJ | 16 | 21 | 12 | 16 | 29 | 29 | 123 | 17 |
| LinGF | 5 | 18 | 2 | 13 | 7 | 26 | 71 | 3 |
| LinG3D | 46 | 42 | 42 | 42 | 39 | 8 | 219 | 47 |
| LinTiS | 30 | 29 | 21 | 30 | 20 | 17 | 147 | 28 |
| LinOKF | 39 | 43 | 17 | 40 | 35 | 6 | 180 | 35 |
| WSM3KF | 45 | 44 | 10 | 44 | 48 | 5 | 196 | 38 |
| WSM3BMJ | 20 | 28 | 6 | 25 | 17 | 22 | 118 | 13 |
| WSM3GF | 17 | 20 | 14 | 21 | 12 | 30 | 114 | 12 |
| WSM3G3D | 42 | 46 | 32 | 46 | 44 | 3 | 213 | 43 |
| WSM3TiS | 41 | 41 | 30 | 41 | 36 | 7 | 196 | 39 |
| WSM3OKF | 43 | 47 | 20 | 47 | 41 | 2 | 200 | 41 |
| WSM6KF | 37 | 35 | 46 | 35 | 45 | 20 | 218 | 46 |
| WSM6BMJ | 22 | 22 | 18 | 23 | 32 | 27 | 144 | 26 |
| WSM6GF | 3 | 10 | 5 | 8 | 11 | 32 | 69 | 2 |
| WSM6G3D | 44 | 39 | 47 | 39 | 33 | 12 | 214 | 44 |
| WSM6TiS | 36 | 36 | 44 | 37 | 24 | 19 | 196 | 40 |
| WSM6OKF | 23 | 24 | 11 | 26 | 34 | 21 | 139 | 25 |
| GoMKF | 10 | 5 | 41 | 6 | 10 | 46 | 118 | 14 |
| GoMBMJ | 12 | 11 | 15 | 12 | 47 | 39 | 136 | 23 |
| GoMGF | 6 | 6 | 27 | 4 | 26 | 43 | 112 | 10 |
| GoMG3D | 15 | 12 | 29 | 15 | 3 | 38 | 112 | 11 |
| GoMTiS | 19 | 16 | 33 | 18 | 8 | 35 | 129 | 19 |
| GoMOKF | 9 | 9 | 9 | 9 | 22 | 40 | 98 | 8 |
| NThKF | 25 | 19 | 39 | 20 | 30 | 34 | 167 | 32 |
| NThBMJ | 7 | 7 | 31 | 7 | 2 | 44 | 98 | 9 |
| NThGF | 13 | 14 | 13 | 14 | 5 | 37 | 96 | 6 |
| NThG3D | 38 | 38 | 24 | 38 | 37 | 10 | 185 | 36 |
| NThTiS | 31 | 32 | 8 | 31 | 15 | 15 | 132 | 20 |
| NThOKF | 24 | 23 | 23 | 22 | 42 | 28 | 162 | 30 |
| MDMKF | 33 | 31 | 35 | 32 | 40 | 16 | 187 | 37 |
| MDMBMJ | 2 | 2 | 28 | 2 | 4 | 48 | 86 | 4 |
| MDMGF | 8 | 13 | 7 | 10 | 23 | 33 | 94 | 5 |
| MDMG3D | 35 | 34 | 37 | 33 | 43 | 18 | 200 | 42 |
| MDMTiS | 28 | 26 | 16 | 27 | 25 | 23 | 145 | 27 |
| MDMOKF | 27 | 25 | 26 | 24 | 46 | 25 | 173 | 33 |
| SBUKF | 11 | 3 | 38 | 5 | 14 | 47 | 118 | 15 |
| SBUBMJ | 1 | 1 | 22 | 1 | 1 | 41 | 67 | 1 |
| SBUGF | 4 | 4 | 25 | 3 | 16 | 45 | 97 | 7 |
| SBUG3D | 32 | 27 | 43 | 28 | 21 | 24 | 175 | 34 |
| SBUTiS | 21 | 17 | 36 | 19 | 9 | 36 | 138 | 24 |
| SBUOKF | 14 | 8 | 40 | 11 | 18 | 42 | 133 | 22 |
| Sch-Name | Kg.Sg. Soi | Pulau Manis | Paya Besar | PCCL Sg. Lembing | Rumah Pam | JKR Gambang | Ldn Nada | Ldn Kuala Raman | JPS Negeri Pahang |
|---|---|---|---|---|---|---|---|---|---|
| KSKF | 0.74 | 0.68 | 0.66 | 0.34 | 0.34 | 0.60 | 0.41 | 0.42 | 0.74 |
| KSBMJ | 0.75 | 0.68 | 0.69 | 0.37 | 0.38 | 0.62 | 0.41 | 0.39 | 0.75 |
| KSGF | 0.78 | 0.69 | 0.71 | 0.33 | 0.46 | 0.64 | 0.45 | 0.45 | 0.78 |
| KSG3D | 0.57 | 0.63 | 0.44 | 0.31 | 0.26 | 0.53 | 0.33 | 0.37 | 0.57 |
| KSTiS | 0.68 | 0.59 | 0.69 | 0.31 | 0.40 | 0.56 | 0.41 | 0.40 | 0.68 |
| KSOKF | 0.61 | 0.60 | 0.55 | 0.31 | 0.29 | 0.62 | 0.33 | 0.35 | 0.61 |
| LinKF | 0.68 | 0.63 | 0.55 | 0.15 | 0.23 | 0.53 | 0.24 | 0.24 | 0.68 |
| LinBMJ | 0.79 | 0.74 | 0.60 | 0.45 | 0.52 | 0.63 | 0.47 | 0.40 | 0.79 |
| LinGF | 0.81 | 0.69 | 0.76 | 0.49 | 0.50 | 0.68 | 0.61 | 0.57 | 0.81 |
| LinG3D | 0.73 | 0.60 | 0.45 | 0.31 | 0.25 | 0.56 | 0.32 | 0.33 | 0.73 |
| LinTiS | 0.73 | 0.61 | 0.70 | 0.40 | 0.36 | 0.57 | 0.44 | 0.43 | 0.73 |
| LinOKF | 0.71 | 0.62 | 0.57 | 0.32 | 0.24 | 0.60 | 0.34 | 0.35 | 0.71 |
| WSM3KF | 0.70 | 0.64 | 0.56 | 0.24 | 0.26 | 0.56 | 0.27 | 0.29 | 0.70 |
| WSM3BMJ | 0.76 | 0.71 | 0.69 | 0.38 | 0.45 | 0.60 | 0.41 | 0.44 | 0.76 |
| WSM3GF | 0.74 | 0.68 | 0.70 | 0.46 | 0.48 | 0.60 | 0.54 | 0.55 | 0.74 |
| WSM3G3D | 0.62 | 0.59 | 0.48 | 0.36 | 0.26 | 0.55 | 0.35 | 0.38 | 0.62 |
| WSM3TiS | 0.65 | 0.52 | 0.64 | 0.31 | 0.33 | 0.52 | 0.35 | 0.35 | 0.65 |
| WSM3OKF | 0.63 | 0.60 | 0.51 | 0.33 | 0.27 | 0.59 | 0.30 | 0.33 | 0.63 |
| WSM6KF | 0.75 | 0.69 | 0.60 | 0.19 | 0.33 | 0.60 | 0.23 | 0.26 | 0.75 |
| WSM6BMJ | 0.74 | 0.69 | 0.64 | 0.40 | 0.50 | 0.58 | 0.48 | 0.42 | 0.74 |
| WSM6GF | 0.86 | 0.69 | 0.80 | 0.47 | 0.58 | 0.69 | 0.58 | 0.59 | 0.86 |
| WSM6G3D | 0.64 | 0.61 | 0.49 | 0.22 | 0.30 | 0.55 | 0.31 | 0.35 | 0.64 |
| WSM6TiS | 0.70 | 0.59 | 0.68 | 0.34 | 0.35 | 0.57 | 0.35 | 0.35 | 0.70 |
| WSM6OKF | 0.78 | 0.76 | 0.64 | 0.42 | 0.31 | 0.60 | 0.46 | 0.44 | 0.78 |
| GoMKF | 0.74 | 0.68 | 0.69 | 0.68 | 0.76 | 0.60 | 0.74 | 0.65 | 0.74 |
| GoMMBJ | 0.82 | 0.69 | 0.67 | 0.48 | 0.60 | 0.64 | 0.54 | 0.45 | 0.82 |
| GoMGF | 0.78 | 0.70 | 0.76 | 0.57 | 0.55 | 0.63 | 0.64 | 0.61 | 0.78 |
| GoMG3D | 0.78 | 0.66 | 0.74 | 0.49 | 0.49 | 0.62 | 0.53 | 0.54 | 0.78 |
| GoMTiS | 0.74 | 0.60 | 0.70 | 0.50 | 0.60 | 0.58 | 0.52 | 0.54 | 0.74 |
| GoMOKF | 0.78 | 0.74 | 0.76 | 0.50 | 0.37 | 0.66 | 0.57 | 0.54 | 0.78 |
| NThKF | 0.79 | 0.72 | 0.66 | 0.31 | 0.47 | 0.64 | 0.36 | 0.35 | 0.79 |
| NThBMJ | 0.76 | 0.69 | 0.72 | 0.55 | 0.62 | 0.62 | 0.60 | 0.55 | 0.76 |
| NThGF | 0.82 | 0.64 | 0.70 | 0.49 | 0.52 | 0.64 | 0.55 | 0.55 | 0.82 |
| NThG3D | 0.74 | 0.66 | 0.45 | 0.31 | 0.26 | 0.60 | 0.35 | 0.36 | 0.74 |
| NThTiS | 0.74 | 0.59 | 0.70 | 0.44 | 0.39 | 0.56 | 0.45 | 0.44 | 0.74 |
| NThOKF | 0.82 | 0.73 | 0.61 | 0.32 | 0.37 | 0.67 | 0.38 | 0.34 | 0.82 |
| MDMKF | 0.74 | 0.66 | 0.47 | 0.38 | 0.28 | 0.61 | 0.37 | 0.42 | 0.74 |
| MDMBMJ | 0.77 | 0.72 | 0.69 | 0.59 | 0.74 | 0.64 | 0.60 | 0.59 | 0.77 |
| MDMGF | 0.79 | 0.69 | 0.72 | 0.50 | 0.51 | 0.70 | 0.58 | 0.61 | 0.79 |
| MDMG3D | 0.74 | 0.66 | 0.47 | 0.39 | 0.28 | 0.61 | 0.37 | 0.42 | 0.74 |
| MDMTiS | 0.74 | 0.63 | 0.63 | 0.46 | 0.45 | 0.60 | 0.44 | 0.49 | 0.74 |
| MDMOKF | 0.79 | 0.69 | 0.65 | 0.31 | 0.40 | 0.69 | 0.35 | 0.34 | 0.79 |
| SBUKF | 0.77 | 0.73 | 0.69 | 0.43 | 0.67 | 0.64 | 0.55 | 0.53 | 0.77 |
| SBUBMJ | 0.77 | 0.73 | 0.74 | 0.66 | 0.60 | 0.65 | 0.68 | 0.63 | 0.77 |
| SBUGF | 0.78 | 0.71 | 0.68 | 0.58 | 0.53 | 0.65 | 0.64 | 0.64 | 0.78 |
| SBUG3D | 0.73 | 0.67 | 0.49 | 0.40 | 0.34 | 0.60 | 0.42 | 0.43 | 0.73 |
| SBUTiS | 0.74 | 0.64 | 0.69 | 0.50 | 0.59 | 0.60 | 0.47 | 0.51 | 0.74 |
| SBUOKF | 0.79 | 0.61 | 0.70 | 0.52 | 0.61 | 0.64 | 0.59 | 0.54 | 0.79 |
| Sch-Name | Kg.Sg. Soi | Pulau Manis | Paya Basar | PCCL Sg Lembing | Rumah Pam | JKR Gamabng | Ldn Nada | Ldn Kuala Raman | JPS Negeri Pahang |
|---|---|---|---|---|---|---|---|---|---|
| KSKF | 0.72 | 0.67 | 0.61 | 0.15 | 0.16 | 0.59 | 0.20 | 0.20 | 0.14 |
| KSBMJ | 0.73 | 0.66 | 0.64 | 0.19 | 0.23 | 0.59 | 0.20 | 0.20 | 0.17 |
| KSGF | 0.77 | 0.69 | 0.68 | 0.27 | 0.37 | 0.63 | 0.36 | 0.36 | 0.30 |
| KSG3D | 0.52 | 0.60 | 0.30 | 0.17 | 0.08 | 0.46 | 0.20 | 0.22 | 0.07 |
| KSTiS | 0.65 | 0.57 | 0.60 | 0.17 | 0.28 | 0.52 | 0.24 | 0.23 | 0.28 |
| KSOKF | 0.54 | 0.54 | 0.35 | 0.10 | 0.09 | 0.52 | 0.10 | 0.10 | 0.08 |
| LinKF | 0.66 | 0.63 | 0.47 | 0.01 | 0.07 | 0.52 | 0.04 | 0.02 | 0.08 |
| LinBMJ | 0.77 | 0.72 | 0.55 | 0.35 | 0.44 | 0.61 | 0.37 | 0.33 | 0.41 |
| LinGF | 0.79 | 0.68 | 0.72 | 0.41 | 0.40 | 0.65 | 0.53 | 0.47 | 0.29 |
| LinG3D | 0.70 | 0.59 | 0.35 | 0.18 | 0.05 | 0.54 | 0.20 | 0.17 | 0.05 |
| LinTiS | 0.71 | 0.61 | 0.64 | 0.25 | 0.24 | 0.56 | 0.27 | 0.27 | 0.24 |
| LinOKF | 0.67 | 0.60 | 0.46 | 0.15 | 0.08 | 0.56 | 0.14 | 0.14 | 0.07 |
| WSM3KF | 0.68 | 0.64 | 0.48 | 0.01 | 0.06 | 0.54 | 0.01 | 0.01 | 0.05 |
| WSM3BMJ | 0.73 | 0.68 | 0.62 | 0.26 | 0.34 | 0.57 | 0.28 | 0.29 | 0.34 |
| WSM3GF | 0.72 | 0.67 | 0.66 | 0.40 | 0.38 | 0.59 | 0.46 | 0.47 | 0.37 |
| WSM3G3D | 0.57 | 0.57 | 0.34 | 0.20 | 0.07 | 0.50 | 0.19 | 0.19 | 0.07 |
| WSM3TiS | 0.61 | 0.50 | 0.52 | 0.15 | 0.17 | 0.47 | 0.16 | 0.14 | 0.16 |
| WSM3OKF | 0.58 | 0.55 | 0.40 | 0.15 | 0.10 | 0.52 | 0.10 | 0.12 | 0.11 |
| WSM6KF | 0.74 | 0.69 | 0.55 | 0.00 | 0.17 | 0.59 | 0.01 | 0.02 | 0.12 |
| WSM6BMJ | 0.71 | 0.67 | 0.59 | 0.29 | 0.42 | 0.56 | 0.36 | 0.32 | 0.44 |
| WSM6GF | 0.84 | 0.68 | 0.75 | 0.41 | 0.49 | 0.67 | 0.50 | 0.49 | 0.34 |
| WSM6G3D | 0.63 | 0.61 | 0.38 | 0.11 | 0.10 | 0.53 | 0.19 | 0.21 | 0.14 |
| WSM6TiS | 0.69 | 0.59 | 0.62 | 0.19 | 0.22 | 0.56 | 0.20 | 0.18 | 0.24 |
| WSM6OKF | 0.77 | 0.75 | 0.54 | 0.29 | 0.15 | 0.56 | 0.32 | 0.29 | 0.20 |
| GoMKF | 0.74 | 0.68 | 0.68 | 0.68 | 0.75 | 0.60 | 0.73 | 0.65 | 0.79 |
| GoMMBJ | 0.81 | 0.69 | 0.63 | 0.41 | 0.51 | 0.63 | 0.46 | 0.37 | 0.43 |
| GoMGF | 0.77 | 0.70 | 0.74 | 0.54 | 0.51 | 0.63 | 0.58 | 0.55 | 0.37 |
| GoMG3D | 0.76 | 0.66 | 0.70 | 0.44 | 0.40 | 0.61 | 0.46 | 0.46 | 0.35 |
| GoMTiS | 0.73 | 0.60 | 0.67 | 0.45 | 0.53 | 0.57 | 0.46 | 0.45 | 0.50 |
| GoMOKF | 0.77 | 0.73 | 0.73 | 0.43 | 0.32 | 0.65 | 0.49 | 0.45 | 0.44 |
| NThKF | 0.78 | 0.72 | 0.61 | 0.27 | 0.38 | 0.63 | 0.27 | 0.25 | 0.34 |
| NThBMJ | 0.75 | 0.69 | 0.69 | 0.51 | 0.57 | 0.62 | 0.54 | 0.50 | 0.66 |
| NThGF | 0.80 | 0.64 | 0.67 | 0.42 | 0.44 | 0.63 | 0.47 | 0.46 | 0.40 |
| NThG3D | 0.72 | 0.66 | 0.35 | 0.19 | 0.06 | 0.58 | 0.22 | 0.21 | 0.05 |
| NThTiS | 0.71 | 0.59 | 0.63 | 0.31 | 0.22 | 0.54 | 0.29 | 0.27 | 0.19 |
| NThOKF | 0.79 | 0.72 | 0.53 | 0.24 | 0.25 | 0.65 | 0.26 | 0.22 | 0.25 |
| MDMKF | 0.72 | 0.65 | 0.38 | 0.25 | 0.11 | 0.59 | 0.27 | 0.29 | 0.09 |
| MDMBMJ | 0.76 | 0.72 | 0.68 | 0.56 | 0.71 | 0.64 | 0.57 | 0.55 | 0.65 |
| MDMGF | 0.78 | 0.68 | 0.68 | 0.42 | 0.42 | 0.68 | 0.49 | 0.50 | 0.32 |
| MDMG3D | 0.72 | 0.65 | 0.37 | 0.26 | 0.11 | 0.59 | 0.27 | 0.29 | 0.09 |
| MDMTiS | 0.72 | 0.63 | 0.55 | 0.32 | 0.32 | 0.59 | 0.31 | 0.35 | 0.25 |
| MDMOKF | 0.76 | 0.69 | 0.58 | 0.22 | 0.29 | 0.66 | 0.22 | 0.22 | 0.29 |
| SBUKF | 0.76 | 0.73 | 0.68 | 0.42 | 0.63 | 0.64 | 0.51 | 0.49 | 0.55 |
| SBUBMJ | 0.76 | 0.73 | 0.71 | 0.63 | 0.59 | 0.65 | 0.64 | 0.59 | 0.67 |
| SBUGF | 0.77 | 0.71 | 0.65 | 0.56 | 0.48 | 0.65 | 0.60 | 0.58 | 0.50 |
| SBUG3D | 0.71 | 0.67 | 0.42 | 0.31 | 0.18 | 0.59 | 0.33 | 0.31 | 0.15 |
| SBUTiS | 0.72 | 0.64 | 0.66 | 0.43 | 0.51 | 0.59 | 0.40 | 0.42 | 0.39 |
| SBUOKF | 0.78 | 0.60 | 0.66 | 0.50 | 0.58 | 0.64 | 0.55 | 0.50 | 0.54 |
| Sch-Name | Kg.Sg. Soi | Pulau Manis | Paya Basar | PCCL Sg. Lembing | Rumah Pam | JKR Gamabng | Ldn Nada | Ldn Kuala Raman | JPS Negeri Pahang |
|---|---|---|---|---|---|---|---|---|---|
| KSKF | 0.89 | 0.88 | 0.77 | 0.15 | 0.16 | 0.84 | 0.20 | 0.21 | 0.14 |
| KSBMJ | 0.90 | 0.84 | 0.79 | 0.19 | 0.23 | 0.83 | 0.20 | 0.22 | 0.18 |
| KSGF | 0.97 | 0.92 | 0.89 | 0.32 | 0.40 | 0.91 | 0.42 | 0.43 | 0.32 |
| KSG3D | 0.63 | 0.74 | 0.35 | 0.18 | 0.08 | 0.60 | 0.22 | 0.24 | 0.07 |
| KSTiS | 0.78 | 0.72 | 0.71 | 0.18 | 0.31 | 0.72 | 0.26 | 0.25 | 0.30 |
| KSOKF | 0.60 | 0.63 | 0.37 | 0.10 | 0.09 | 0.62 | 0.10 | 0.10 | 0.08 |
| LinKF | 0.85 | 0.84 | 0.59 | 0.01 | 0.07 | 0.77 | 0.04 | 0.02 | 0.08 |
| LinBMJ | 0.95 | 0.92 | 0.71 | 0.39 | 0.48 | 0.86 | 0.43 | 0.40 | 0.43 |
| LinGF | 0.92 | 0.86 | 0.88 | 0.46 | 0.42 | 0.88 | 0.58 | 0.53 | 0.31 |
| LinG3D | 0.84 | 0.78 | 0.43 | 0.19 | 0.05 | 0.75 | 0.22 | 0.20 | 0.05 |
| LinTiS | 0.87 | 0.81 | 0.78 | 0.26 | 0.25 | 0.80 | 0.28 | 0.29 | 0.26 |
| LinOKF | 0.78 | 0.76 | 0.55 | 0.16 | 0.08 | 0.75 | 0.15 | 0.15 | 0.07 |
| WSM3KF | 0.85 | 0.84 | 0.59 | 0.01 | 0.06 | 0.78 | 0.01 | 0.01 | 0.05 |
| WSM3BMJ | 0.87 | 0.84 | 0.74 | 0.28 | 0.36 | 0.78 | 0.30 | 0.32 | 0.35 |
| WSM3GF | 0.90 | 0.89 | 0.84 | 0.47 | 0.41 | 0.84 | 0.53 | 0.55 | 0.38 |
| WSM3G3D | 0.67 | 0.72 | 0.39 | 0.22 | 0.07 | 0.65 | 0.20 | 0.21 | 0.07 |
| WSM3TiS | 0.73 | 0.64 | 0.57 | 0.16 | 0.18 | 0.64 | 0.17 | 0.15 | 0.16 |
| WSM3OKF | 0.67 | 0.67 | 0.49 | 0.15 | 0.11 | 0.67 | 0.10 | 0.13 | 0.11 |
| WSM6KF | 0.95 | 0.92 | 0.74 | 0.00 | 0.18 | 0.88 | 0.01 | 0.02 | 0.13 |
| WSM6BMJ | 0.88 | 0.87 | 0.75 | 0.32 | 0.46 | 0.80 | 0.40 | 0.38 | 0.45 |
| WSM6GF | 0.99 | 0.90 | 0.89 | 0.48 | 0.52 | 0.94 | 0.56 | 0.56 | 0.36 |
| WSM6G3D | 0.81 | 0.81 | 0.46 | 0.13 | 0.10 | 0.75 | 0.22 | 0.24 | 0.14 |
| WSM6TiS | 0.89 | 0.79 | 0.77 | 0.20 | 0.23 | 0.80 | 0.22 | 0.20 | 0.26 |
| WSM6OKF | 0.97 | 0.98 | 0.62 | 0.30 | 0.16 | 0.78 | 0.34 | 0.32 | 0.22 |
| GoMKF | 0.96 | 0.91 | 0.96 | 0.88 | 0.93 | 0.90 | 0.96 | 0.90 | 0.96 |
| GoMMBJ | 1.00 | 0.93 | 0.83 | 0.47 | 0.55 | 0.93 | 0.54 | 0.45 | 0.45 |
| GoMGF | 0.99 | 0.94 | 0.93 | 0.64 | 0.61 | 0.94 | 0.69 | 0.67 | 0.42 |
| GoMG3D | 0.96 | 0.89 | 0.90 | 0.52 | 0.44 | 0.89 | 0.55 | 0.54 | 0.38 |
| GoMTiS | 0.90 | 0.81 | 0.88 | 0.53 | 0.58 | 0.83 | 0.55 | 0.53 | 0.56 |
| GoMOKF | 0.97 | 0.96 | 0.95 | 0.49 | 0.38 | 0.95 | 0.55 | 0.52 | 0.47 |
| NThKF | 0.99 | 0.97 | 0.77 | 0.32 | 0.41 | 0.93 | 0.33 | 0.31 | 0.37 |
| NThBMJ | 0.98 | 0.93 | 0.94 | 0.61 | 0.65 | 0.93 | 0.64 | 0.63 | 0.71 |
| NThGF | 0.98 | 0.87 | 0.89 | 0.48 | 0.48 | 0.90 | 0.54 | 0.54 | 0.44 |
| NThG3D | 0.84 | 0.87 | 0.43 | 0.22 | 0.06 | 0.80 | 0.25 | 0.24 | 0.05 |
| NThTiS | 0.87 | 0.79 | 0.73 | 0.32 | 0.22 | 0.78 | 0.30 | 0.29 | 0.19 |
| NThOKF | 0.92 | 0.92 | 0.63 | 0.28 | 0.27 | 0.93 | 0.30 | 0.26 | 0.27 |
| MDMKF | 0.89 | 0.86 | 0.47 | 0.27 | 0.12 | 0.84 | 0.31 | 0.32 | 0.09 |
| MDMBMJ | 0.99 | 0.97 | 0.94 | 0.69 | 0.79 | 0.96 | 0.72 | 0.71 | 0.74 |
| MDMGF | 0.98 | 0.91 | 0.87 | 0.47 | 0.45 | 0.95 | 0.55 | 0.54 | 0.34 |
| MDMG3D | 0.89 | 0.86 | 0.46 | 0.28 | 0.12 | 0.84 | 0.31 | 0.32 | 0.09 |
| MDMTiS | 0.90 | 0.84 | 0.68 | 0.33 | 0.34 | 0.85 | 0.34 | 0.38 | 0.27 |
| MDMOKF | 0.92 | 0.90 | 0.70 | 0.26 | 0.32 | 0.93 | 0.25 | 0.25 | 0.31 |
| SBUKF | 1.00 | 0.98 | 0.98 | 0.53 | 0.72 | 0.96 | 0.64 | 0.63 | 0.65 |
| SBUBMJ | 1.00 | 0.98 | 0.98 | 0.75 | 0.73 | 0.98 | 0.79 | 0.76 | 0.78 |
| SBUGF | 1.00 | 0.96 | 0.90 | 0.69 | 0.56 | 0.95 | 0.74 | 0.71 | 0.55 |
| SBUG3D | 0.90 | 0.89 | 0.54 | 0.35 | 0.19 | 0.85 | 0.38 | 0.36 | 0.15 |
| SBUTiS | 0.91 | 0.86 | 0.88 | 0.49 | 0.55 | 0.86 | 0.47 | 0.49 | 0.44 |
| SBUOKF | 1.00 | 0.79 | 0.85 | 0.63 | 0.67 | 0.95 | 0.69 | 0.66 | 0.63 |
| Sch-Name | Kg.Sg. Soi | Pulau Manis | Paya Basar | PCCL Sg. Lembing | Rumah Pam | JKR Gamabng | Ldn Nada | Ldn Kuala Raman | JPS Negeri Pahang |
|---|---|---|---|---|---|---|---|---|---|
| KSKF | 0.21 | 0.26 | 0.26 | 0.00 | 0.00 | 0.34 | 0.00 | 0.05 | 0.07 |
| KSBMJ | 0.20 | 0.25 | 0.24 | 0.05 | 0.08 | 0.32 | 0.00 | 0.24 | 0.11 |
| KSGF | 0.21 | 0.27 | 0.26 | 0.38 | 0.17 | 0.33 | 0.29 | 0.31 | 0.16 |
| KSG3D | 0.24 | 0.25 | 0.34 | 0.32 | 0.27 | 0.34 | 0.38 | 0.32 | 0.30 |
| KSTiS | 0.21 | 0.28 | 0.19 | 0.29 | 0.19 | 0.34 | 0.18 | 0.27 | 0.17 |
| KSOKF | 0.17 | 0.21 | 0.09 | 0.00 | 0.00 | 0.23 | 0.10 | 0.10 | 0.11 |
| LinKF | 0.25 | 0.29 | 0.30 | 0.92 | 0.42 | 0.38 | 0.64 | 0.78 | 0.53 |
| LinBMJ | 0.20 | 0.23 | 0.29 | 0.22 | 0.16 | 0.33 | 0.25 | 0.36 | 0.13 |
| LinGF | 0.16 | 0.24 | 0.20 | 0.22 | 0.11 | 0.29 | 0.16 | 0.19 | 0.14 |
| LinG3D | 0.19 | 0.29 | 0.35 | 0.31 | 0.17 | 0.35 | 0.39 | 0.39 | 0.17 |
| LinTiS | 0.21 | 0.29 | 0.22 | 0.14 | 0.23 | 0.36 | 0.14 | 0.22 | 0.22 |
| LinOKF | 0.17 | 0.26 | 0.25 | 0.21 | 0.38 | 0.31 | 0.24 | 0.28 | 0.42 |
| WSM3KF | 0.22 | 0.28 | 0.28 | 0.00 | 0.00 | 0.36 | 0.00 | 0.00 | 0.17 |
| WSM3BMJ | 0.18 | 0.22 | 0.21 | 0.24 | 0.15 | 0.32 | 0.25 | 0.24 | 0.06 |
| WSM3GF | 0.22 | 0.27 | 0.25 | 0.27 | 0.15 | 0.34 | 0.23 | 0.24 | 0.10 |
| WSM3G3D | 0.21 | 0.28 | 0.29 | 0.20 | 0.22 | 0.33 | 0.31 | 0.25 | 0.22 |
| WSM3TiS | 0.20 | 0.31 | 0.16 | 0.25 | 0.15 | 0.36 | 0.25 | 0.28 | 0.20 |
| WSM3OKF | 0.20 | 0.24 | 0.30 | 0.13 | 0.23 | 0.30 | 0.36 | 0.31 | 0.21 |
| WSM6KF | 0.23 | 0.27 | 0.31 | 1.00 | 0.15 | 0.35 | 0.83 | 0.71 | 0.46 |
| WSM6BMJ | 0.21 | 0.25 | 0.27 | 0.23 | 0.19 | 0.35 | 0.22 | 0.33 | 0.08 |
| WSM6GF | 0.15 | 0.26 | 0.17 | 0.26 | 0.09 | 0.30 | 0.19 | 0.20 | 0.15 |
| WSM6G3D | 0.26 | 0.29 | 0.32 | 0.52 | 0.25 | 0.36 | 0.43 | 0.38 | 0.18 |
| WSM6TiS | 0.24 | 0.30 | 0.24 | 0.24 | 0.21 | 0.36 | 0.33 | 0.35 | 0.22 |
| WSM6OKF | 0.21 | 0.23 | 0.20 | 0.15 | 0.32 | 0.33 | 0.17 | 0.24 | 0.22 |
| GoMKF | 0.24 | 0.27 | 0.31 | 0.25 | 0.20 | 0.35 | 0.25 | 0.30 | 0.18 |
| GoMMBJ | 0.19 | 0.27 | 0.28 | 0.24 | 0.10 | 0.34 | 0.24 | 0.33 | 0.12 |
| GoMGF | 0.22 | 0.27 | 0.22 | 0.23 | 0.24 | 0.34 | 0.21 | 0.24 | 0.25 |
| GoMG3D | 0.21 | 0.28 | 0.24 | 0.26 | 0.18 | 0.34 | 0.26 | 0.25 | 0.20 |
| GoMTiS | 0.21 | 0.30 | 0.27 | 0.25 | 0.13 | 0.36 | 0.27 | 0.25 | 0.18 |
| GoMOKF | 0.21 | 0.25 | 0.24 | 0.21 | 0.32 | 0.32 | 0.20 | 0.24 | 0.15 |
| NThKF | 0.22 | 0.26 | 0.26 | 0.40 | 0.17 | 0.34 | 0.38 | 0.43 | 0.22 |
| NThBMJ | 0.23 | 0.27 | 0.27 | 0.25 | 0.17 | 0.35 | 0.23 | 0.29 | 0.10 |
| NThGF | 0.18 | 0.28 | 0.27 | 0.24 | 0.16 | 0.32 | 0.23 | 0.24 | 0.19 |
| NThG3D | 0.17 | 0.27 | 0.35 | 0.35 | 0.00 | 0.33 | 0.35 | 0.36 | 0.00 |
| NThTiS | 0.20 | 0.30 | 0.19 | 0.14 | 0.00 | 0.36 | 0.16 | 0.19 | 0.00 |
| NThOKF | 0.15 | 0.24 | 0.25 | 0.37 | 0.21 | 0.31 | 0.33 | 0.41 | 0.21 |
| MDMKF | 0.21 | 0.27 | 0.34 | 0.22 | 0.21 | 0.33 | 0.35 | 0.28 | 0.25 |
| MDMBMJ | 0.23 | 0.26 | 0.29 | 0.25 | 0.13 | 0.34 | 0.26 | 0.29 | 0.16 |
| MDMGF | 0.21 | 0.27 | 0.24 | 0.20 | 0.14 | 0.29 | 0.18 | 0.13 | 0.13 |
| MDMG3D | 0.21 | 0.27 | 0.34 | 0.21 | 0.21 | 0.33 | 0.35 | 0.28 | 0.25 |
| MDMTiS | 0.22 | 0.29 | 0.25 | 0.09 | 0.11 | 0.34 | 0.23 | 0.20 | 0.19 |
| MDMOKF | 0.18 | 0.26 | 0.23 | 0.37 | 0.21 | 0.30 | 0.35 | 0.41 | 0.21 |
| SBUKF | 0.24 | 0.26 | 0.30 | 0.34 | 0.16 | 0.34 | 0.29 | 0.31 | 0.21 |
| SBUBMJ | 0.24 | 0.26 | 0.27 | 0.20 | 0.24 | 0.34 | 0.22 | 0.27 | 0.17 |
| SBUGF | 0.23 | 0.26 | 0.30 | 0.26 | 0.22 | 0.33 | 0.24 | 0.23 | 0.13 |
| SBUG3D | 0.23 | 0.27 | 0.35 | 0.27 | 0.14 | 0.34 | 0.31 | 0.30 | 0.29 |
| SBUTiS | 0.22 | 0.29 | 0.27 | 0.23 | 0.12 | 0.35 | 0.29 | 0.26 | 0.25 |
| SBUOKF | 0.22 | 0.28 | 0.26 | 0.29 | 0.20 | 0.34 | 0.27 | 0.31 | 0.22 |
| Scheme Name | Kg.Sg. Soi | Pulau Manis | Paya Besar | PCCL Sg Lembing | Rumah Pam | JKR Gambang | Ladang Nada | Ladang Kuala Raman | JPS Negeri Pahang |
|---|---|---|---|---|---|---|---|---|---|
| KSKF | 1.1 | 1.2 | 1.0 | 0.1 | 0.2 | 1.3 | 0.2 | 0.2 | 0.2 |
| KSBMJ | 1.1 | 1.1 | 1.0 | 0.2 | 0.3 | 1.2 | 0.2 | 0.3 | 0.2 |
| KSGF | 1.2 | 1.3 | 1.2 | 0.5 | 0.5 | 1.4 | 0.6 | 0.6 | 0.4 |
| KSG3D | 0.8 | 1.0 | 0.5 | 0.3 | 0.1 | 0.9 | 0.4 | 0.4 | 0.1 |
| KSTiS | 1.0 | 1.0 | 0.9 | 0.3 | 0.4 | 1.1 | 0.3 | 0.3 | 0.4 |
| KSOKF | 0.7 | 0.8 | 0.4 | 0.1 | 0.1 | 0.8 | 0.1 | 0.1 | 0.1 |
| LinKF | 1.1 | 1.2 | 0.8 | 0.1 | 0.1 | 1.2 | 0.1 | 0.1 | 0.2 |
| LinBMJ | 1.2 | 1.2 | 1.0 | 0.5 | 0.6 | 1.3 | 0.6 | 0.6 | 0.5 |
| LinGF | 1.1 | 1.1 | 1.1 | 0.6 | 0.5 | 1.2 | 0.7 | 0.7 | 0.4 |
| LinG3D | 1.0 | 1.1 | 0.7 | 0.3 | 0.1 | 1.2 | 0.4 | 0.3 | 0.1 |
| LinTiS | 1.1 | 1.1 | 1.0 | 0.3 | 0.3 | 1.2 | 0.3 | 0.4 | 0.3 |
| LinOKF | 0.9 | 1.0 | 0.7 | 0.2 | 0.1 | 1.1 | 0.2 | 0.2 | 0.1 |
| WSM3KF | 1.1 | 1.2 | 0.8 | 0.0 | 0.1 | 1.2 | 0.0 | 0.0 | 0.1 |
| WSM3BMJ | 1.1 | 1.1 | 0.9 | 0.4 | 0.4 | 1.1 | 0.4 | 0.4 | 0.4 |
| WSM3GF | 1.2 | 1.2 | 1.1 | 0.6 | 0.5 | 1.3 | 0.7 | 0.7 | 0.4 |
| WSM3G3D | 0.8 | 1.0 | 0.5 | 0.3 | 0.1 | 1.0 | 0.3 | 0.3 | 0.1 |
| WSM3TiS | 0.9 | 0.9 | 0.7 | 0.2 | 0.2 | 1.0 | 0.2 | 0.2 | 0.2 |
| WSM3OKF | 0.8 | 0.9 | 0.7 | 0.2 | 0.1 | 1.0 | 0.2 | 0.2 | 0.1 |
| WSM6KF | 1.2 | 1.3 | 1.1 | 0.1 | 0.2 | 1.4 | 0.1 | 0.1 | 0.2 |
| WSM6BMJ | 1.1 | 1.2 | 1.0 | 0.4 | 0.6 | 1.2 | 0.5 | 0.6 | 0.5 |
| WSM6GF | 1.2 | 1.2 | 1.1 | 0.7 | 0.6 | 1.3 | 0.7 | 0.7 | 0.4 |
| WSM6G3D | 1.1 | 1.1 | 0.7 | 0.3 | 0.1 | 1.2 | 0.4 | 0.4 | 0.2 |
| WSM6TiS | 1.2 | 1.1 | 1.0 | 0.3 | 0.3 | 1.2 | 0.3 | 0.3 | 0.3 |
| WSM6OKF | 1.2 | 1.3 | 0.8 | 0.4 | 0.2 | 1.2 | 0.4 | 0.4 | 0.3 |
| GoMKF | 1.3 | 1.3 | 1.4 | 1.2 | 1.2 | 1.4 | 1.3 | 1.3 | 1.2 |
| GoMMBJ | 1.2 | 1.3 | 1.1 | 0.6 | 0.6 | 1.4 | 0.7 | 0.7 | 0.5 |
| GoMGF | 1.3 | 1.3 | 1.2 | 0.8 | 0.8 | 1.4 | 0.9 | 0.9 | 0.6 |
| GoMG3D | 1.2 | 1.2 | 1.2 | 0.7 | 0.5 | 1.3 | 0.7 | 0.7 | 0.5 |
| GoMTiS | 1.1 | 1.2 | 1.2 | 0.7 | 0.7 | 1.3 | 0.8 | 0.7 | 0.7 |
| GoMOKF | 1.2 | 1.3 | 1.3 | 0.6 | 0.6 | 1.4 | 0.7 | 0.7 | 0.6 |
| NThKF | 1.3 | 1.3 | 1.0 | 0.5 | 0.5 | 1.4 | 0.5 | 0.5 | 0.5 |
| NThBMJ | 1.3 | 1.3 | 1.3 | 0.8 | 0.8 | 1.4 | 0.8 | 0.9 | 0.8 |
| NThGF | 1.2 | 1.2 | 1.2 | 0.6 | 0.6 | 1.3 | 0.7 | 0.7 | 0.5 |
| NThG3D | 1.0 | 1.2 | 0.7 | 0.3 | 0.1 | 1.2 | 0.4 | 0.4 | 0.1 |
| NThTiS | 1.1 | 1.1 | 0.9 | 0.4 | 0.2 | 1.2 | 0.4 | 0.4 | 0.2 |
| NThOKF | 1.1 | 1.2 | 0.8 | 0.4 | 0.3 | 1.3 | 0.4 | 0.4 | 0.3 |
| MDMKF | 1.1 | 1.2 | 0.7 | 0.3 | 0.1 | 1.3 | 0.5 | 0.4 | 0.1 |
| MDMBMJ | 1.3 | 1.3 | 1.3 | 0.9 | 0.9 | 1.5 | 1.0 | 1.0 | 0.9 |
| MDMGF | 1.2 | 1.2 | 1.1 | 0.6 | 0.5 | 1.3 | 0.7 | 0.6 | 0.4 |
| MDMG3D | 1.1 | 1.2 | 0.7 | 0.4 | 0.1 | 1.3 | 0.5 | 0.4 | 0.1 |
| MDMTiS | 1.2 | 1.2 | 0.9 | 0.4 | 0.4 | 1.3 | 0.4 | 0.5 | 0.3 |
| MDMOKF | 1.1 | 1.2 | 0.9 | 0.4 | 0.4 | 1.3 | 0.4 | 0.4 | 0.4 |
| SBUKF | 1.3 | 1.3 | 1.4 | 0.8 | 0.9 | 1.5 | 0.9 | 0.9 | 0.8 |
| SBUBMJ | 1.2 | 1.1 | 1.3 | 1.0 | 1.0 | 1.3 | 1.0 | 1.0 | 0.9 |
| SBUGF | 1.3 | 1.3 | 1.3 | 0.9 | 0.7 | 1.4 | 1.0 | 0.9 | 0.6 |
| SBUG3D | 1.2 | 1.2 | 0.8 | 0.5 | 0.2 | 1.3 | 0.6 | 0.5 | 0.2 |
| SBUTiS | 1.2 | 1.2 | 1.2 | 0.6 | 0.6 | 1.3 | 0.7 | 0.7 | 0.6 |
| SBUOKF | 1.3 | 1.1 | 1.1 | 0.9 | 0.8 | 1.4 | 0.9 | 1.0 | 0.8 |
| RF Stations | Observed | SBUBMJ | WSM6GF | LinGF | MDMBMJ | MDMGF |
|---|---|---|---|---|---|---|
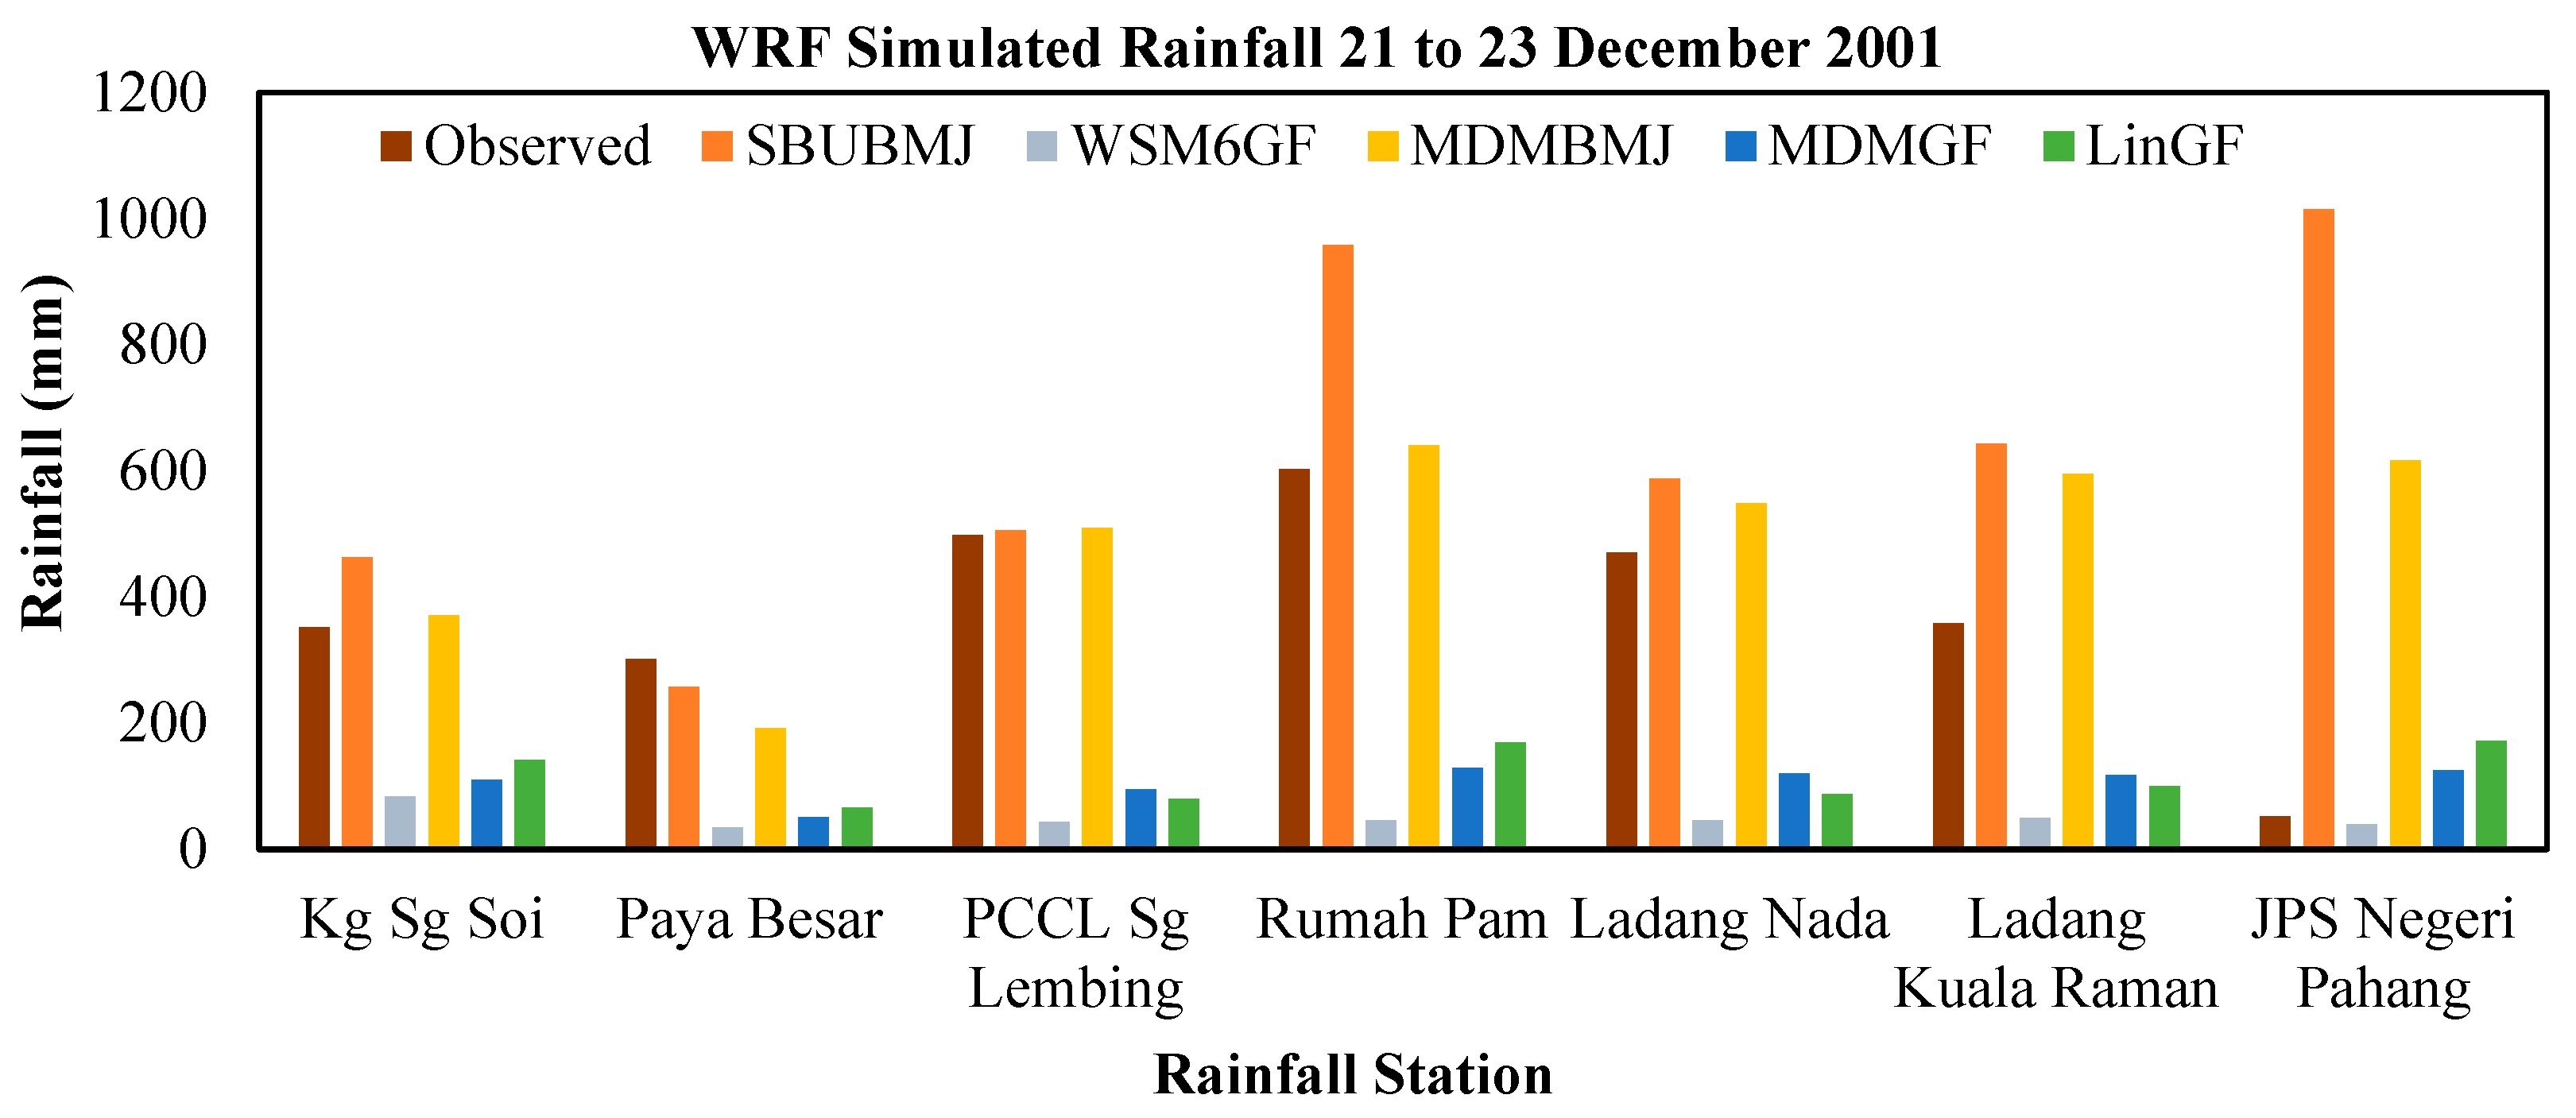
| Kg Sg. Soi | 351.9 | 462.9 | 82.7 | 140.5 | 371.1 | 109.8 |
| Paya Besar | 300.6 | 256.8 | 33.6 | 65.3 | 191.3 | 49.8 |
| PCCL Sg. Lembing | 498.0 | 504.9 | 42.2 | 79.6 | 509.8 | 94.4 |
| Rumah Pam | 601.9 | 958.4 | 45.0 | 169.3 | 640.6 | 128.7 |
| Ladang Nada | 470.7 | 587.4 | 44.8 | 86.5 | 548.2 | 120.3 |
| Landan Kuala Raman | 358.5 | 642.8 | 49.0 | 98.9 | 594.3 | 117.4 |
| JPS Negeri Pahang | 51.4 | 1014.4 | 39.1 | 171.1 | 616.3 | 124.5 |
| RF Stations | Observed | SBUBMJ | WSM6GF | LinGF | MDMBMJ | MDMGF |
|---|---|---|---|---|---|---|
| Kg Sg.Soi | 223.8 | 186.9 | 90.9 | 77.5 | 114.9 | 93.4 |
| Paya Besar | 270.9 | 145.4 | 40.0 | 32.4 | 66.3 | 39.4 |
| PCCL Sg. Lembing | 248.6 | 168.6 | 189.9 | 159.7 | 98.7 | 110.2 |
| Rumah Pam | 268.1 | 215.1 | 137.7 | 66.3 | 112.2 | 105.5 |
| JKR Gambang | 177.5 | 213.2 | 71.5 | 87.9 | 101.5 | 104.6 |
| Ladang Nada | 208.1 | 198.6 | 163.0 | 181.0 | 92.1 | 147.1 |
| Ladang Kuala Raman | 192.2 | 233.4 | 186.8 | 209.0 | 88.3 | 188.7 |
| JPS Negeri Pahang | 363.4 | 249.6 | 70.5 | 42.9 | 139.7 | 51.3 |
| RF Stations | Observed | SBUBMJ | WSM6GF | LinGF | MDMBMJ | MDMGF |
|---|---|---|---|---|---|---|
| Kg Sg.Soi | 121.3 | 118.4 | 69.532 | 74.883 | 101.117 | 66.762 |
| Paya Besar | 172.3 | 65.2 | 27.842 | 29.308 | 60.052 | 27.885 |
| PCCL Sg. Lembing | 185.9 | 140.7 | 188.121 | 228.847 | 139.354 | 240.554 |
| Rumah Pam | 161.7 | 143.8 | 52.979 | 40.589 | 110.148 | 71.243 |
| Ladang Nada | 159.3 | 141.0 | 117.419 | 204.061 | 148.404 | 219.386 |
| Ladang Kuala Raman | 151.4 | 133.0 | 101.591 | 168.675 | 144.688 | 128.793 |
| JPS Negeri Pahang | 177 | 147.7 | 37.689 | 23.598 | 103.042 | 42.075 |
| RF Stations | Observed | SBUBMJ | WSM6GF | LinGF | MDMBMJ | MDMGF |
|---|---|---|---|---|---|---|
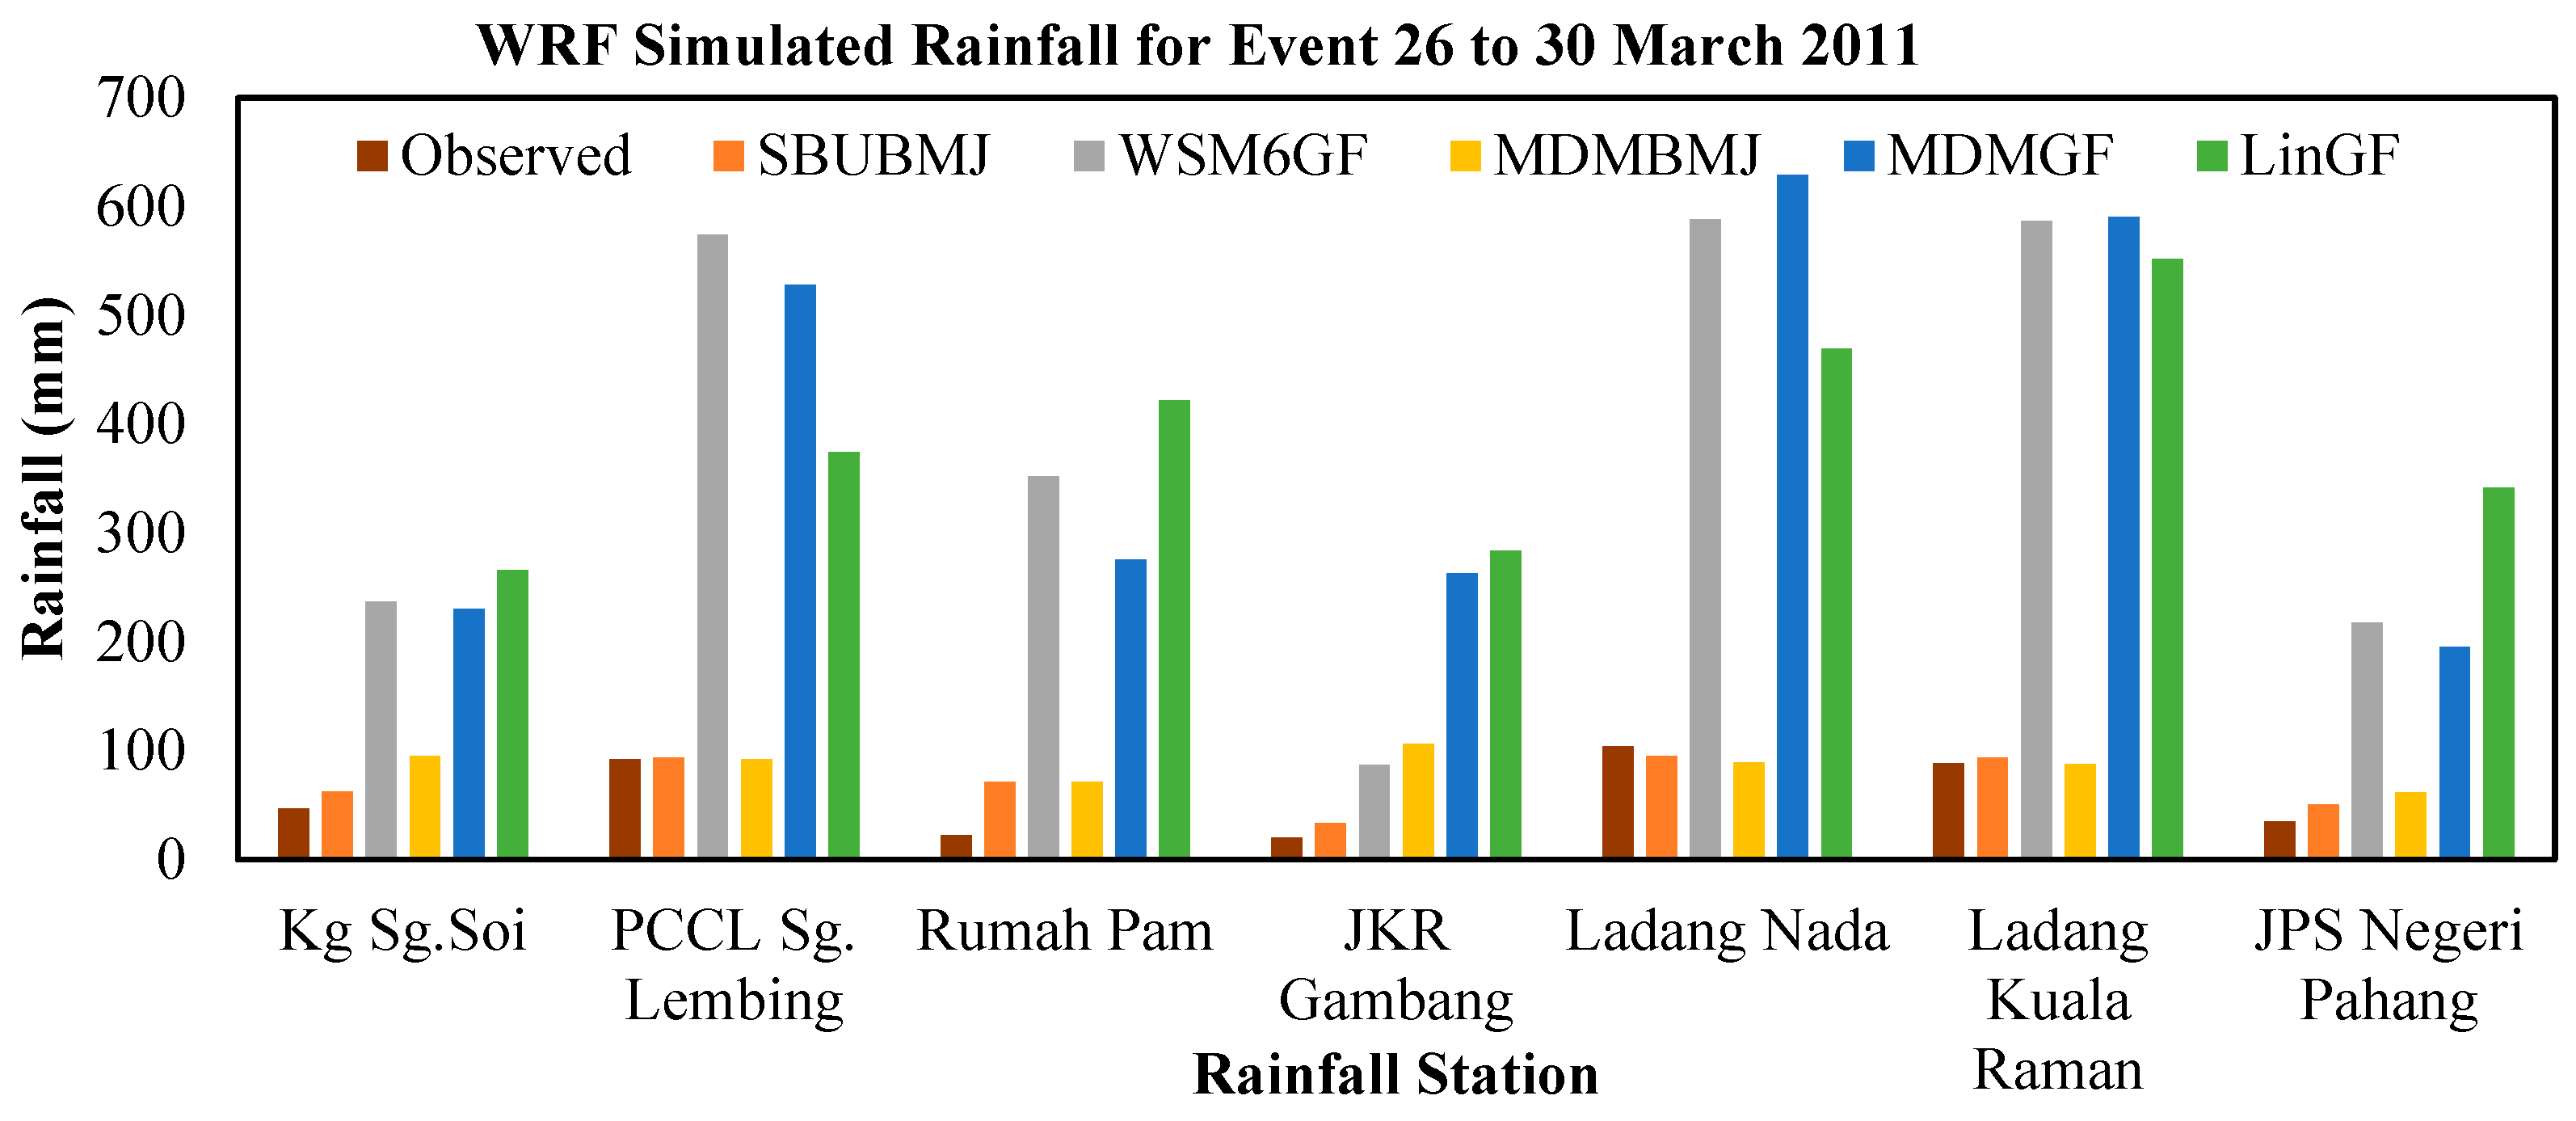
| Kg Sg.Soi | 46.9 | 62.2 | 237.147 | 266.113 | 94.69 | 230.476 |
| PCCL Sg. Lembing | 91.9 | 93.5 | 574.294 | 374.582 | 92.012 | 528.157 |
| Rumah Pam | 22.1 | 71.1 | 352.291 | 421.498 | 71.28 | 275.796 |
| JKR Gambang | 20.1 | 33.2 | 86.583 | 283.663 | 105.85 | 263.08 |
| Ladang Nada | 104.2 | 95.4 | 587.981 | 469.327 | 89.112 | 629.164 |
| Ladang Kuala Raman | 88.6 | 93.3 | 586.971 | 552.005 | 87.876 | 590.573 |
| JPS Negeri Pahang | 34.7 | 50.3 | 217.738 | 341.265 | 61.715 | 195.28 |
| RF Stations | Observed | SBUBMJ | WSM6GF | LinGF | MDMBMJ | MDMGF |
|---|---|---|---|---|---|---|
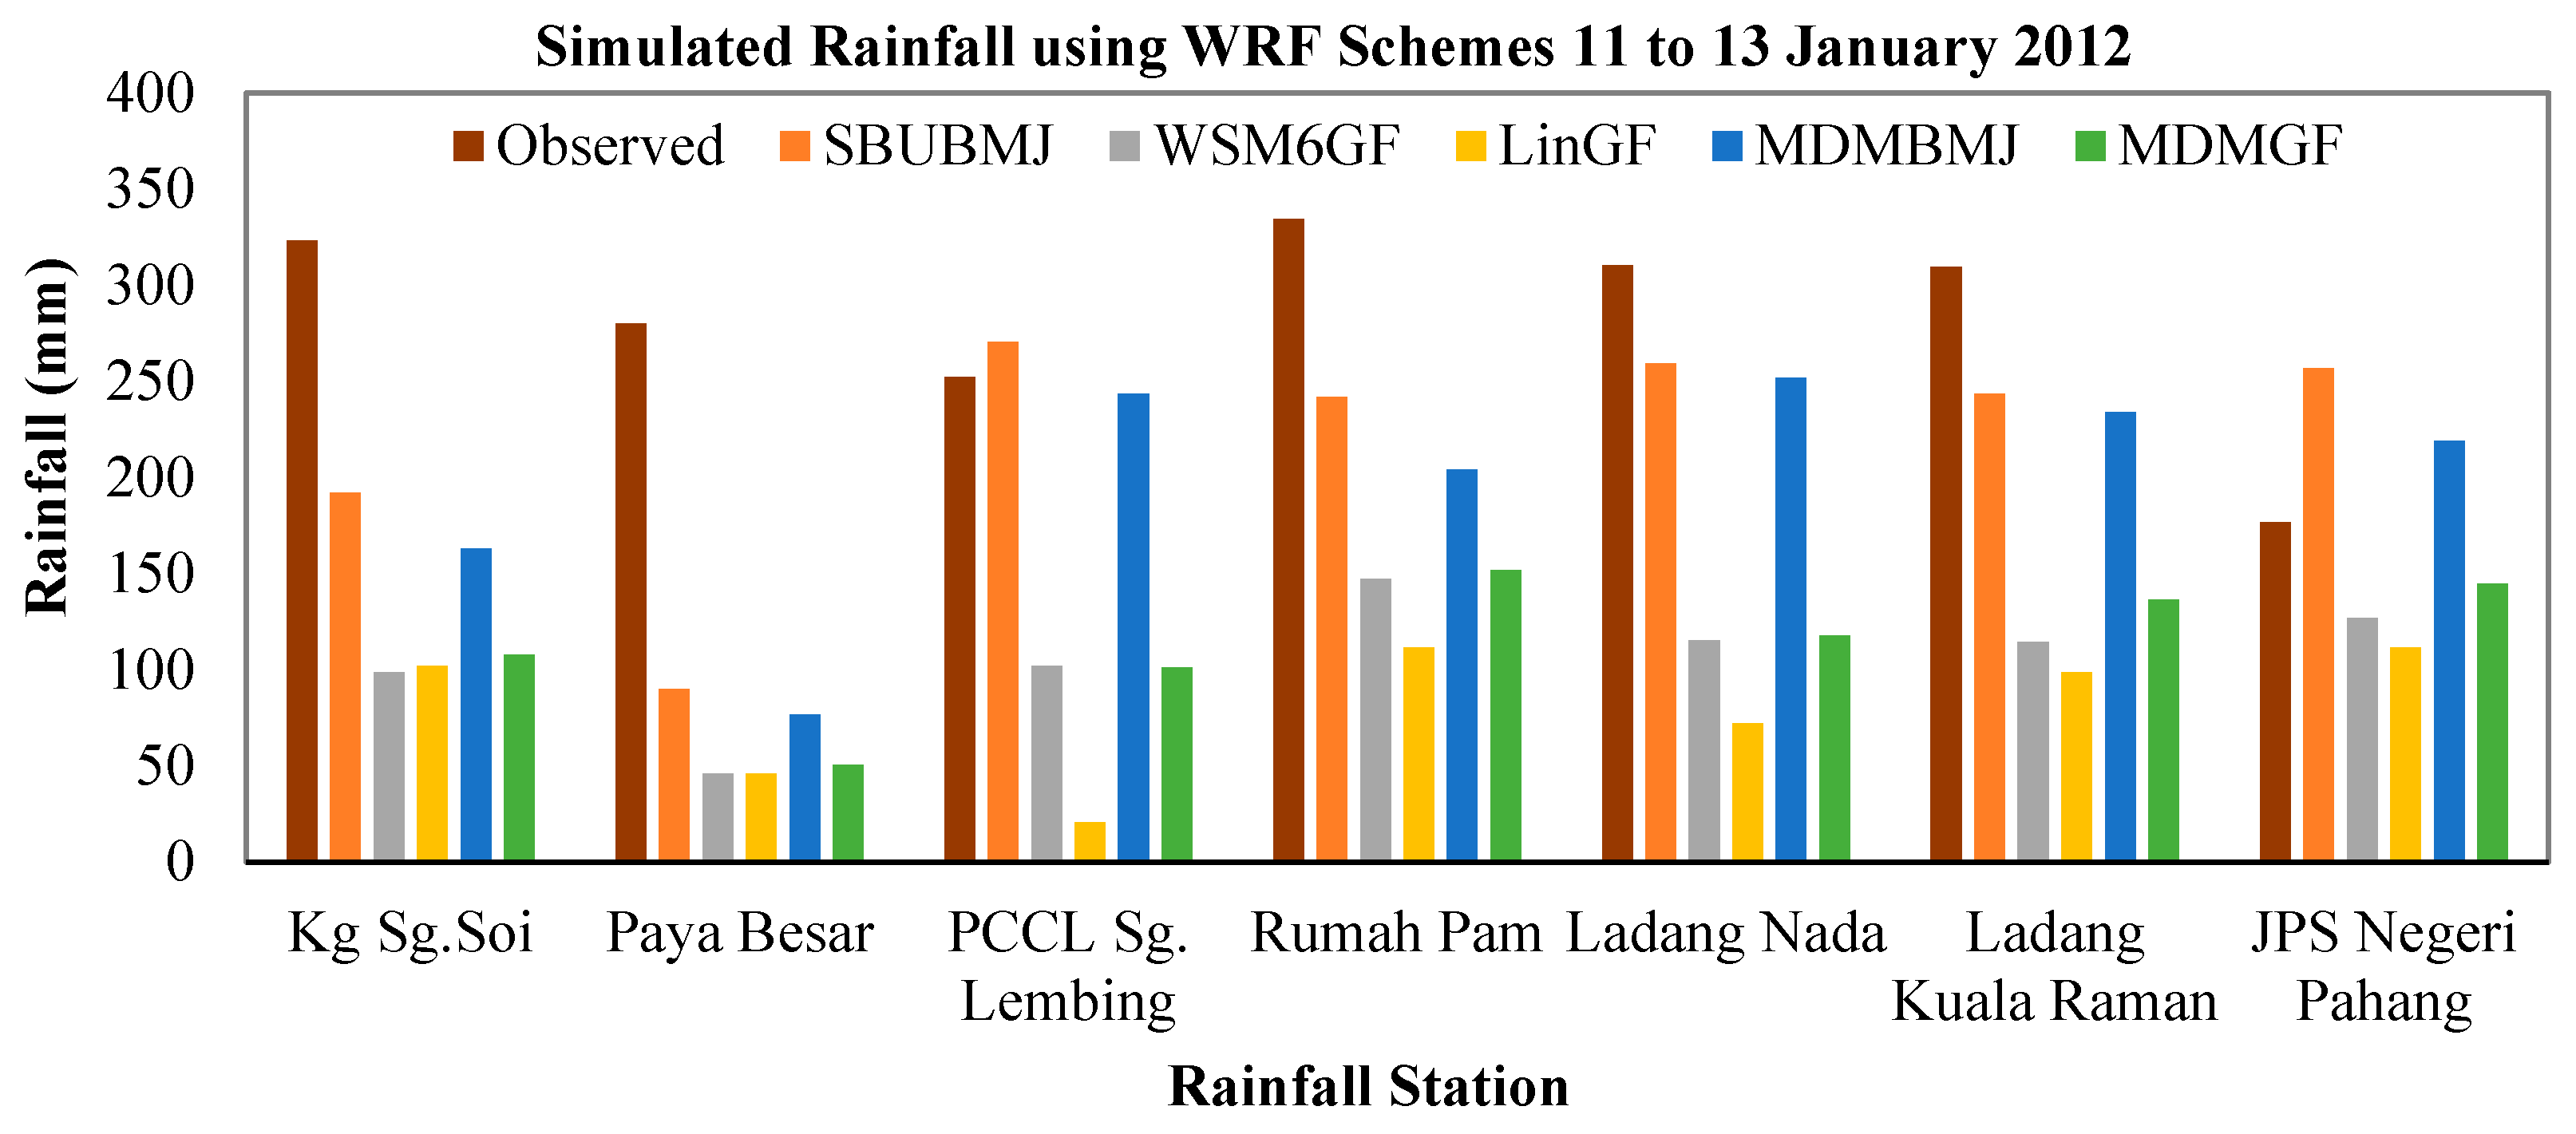
| Kg Sg.Soi | 323.3 | 191.9 | 98.5 | 101.7 | 162.9 | 107.8 |
| Paya Besar | 280 | 90.0 | 45.7 | 46.0 | 76.6 | 50.4 |
| PCCL Sg. Lembing | 252.1 | 270.4 | 102.0 | 20.5 | 243.5 | 100.9 |
| Rumah Pam | 334.3 | 241.7 | 147.2 | 111.3 | 203.9 | 151.7 |
| Ladang Nada | 310.4 | 259.2 | 115.3 | 72.0 | 251.6 | 117.5 |
| Ladang Kuala Raman | 309.6 | 243.4 | 114.4 | 98.8 | 234.0 | 136.2 |
| JPS Negeri Pahang | 176.7 | 256.5 | 126.9 | 111.4 | 219.0 | 144.5 |
| RF Stations | Observed | SBUBMJ | WSM6GF | LinGF | MDMBMJ | MDMGF |
|---|---|---|---|---|---|---|
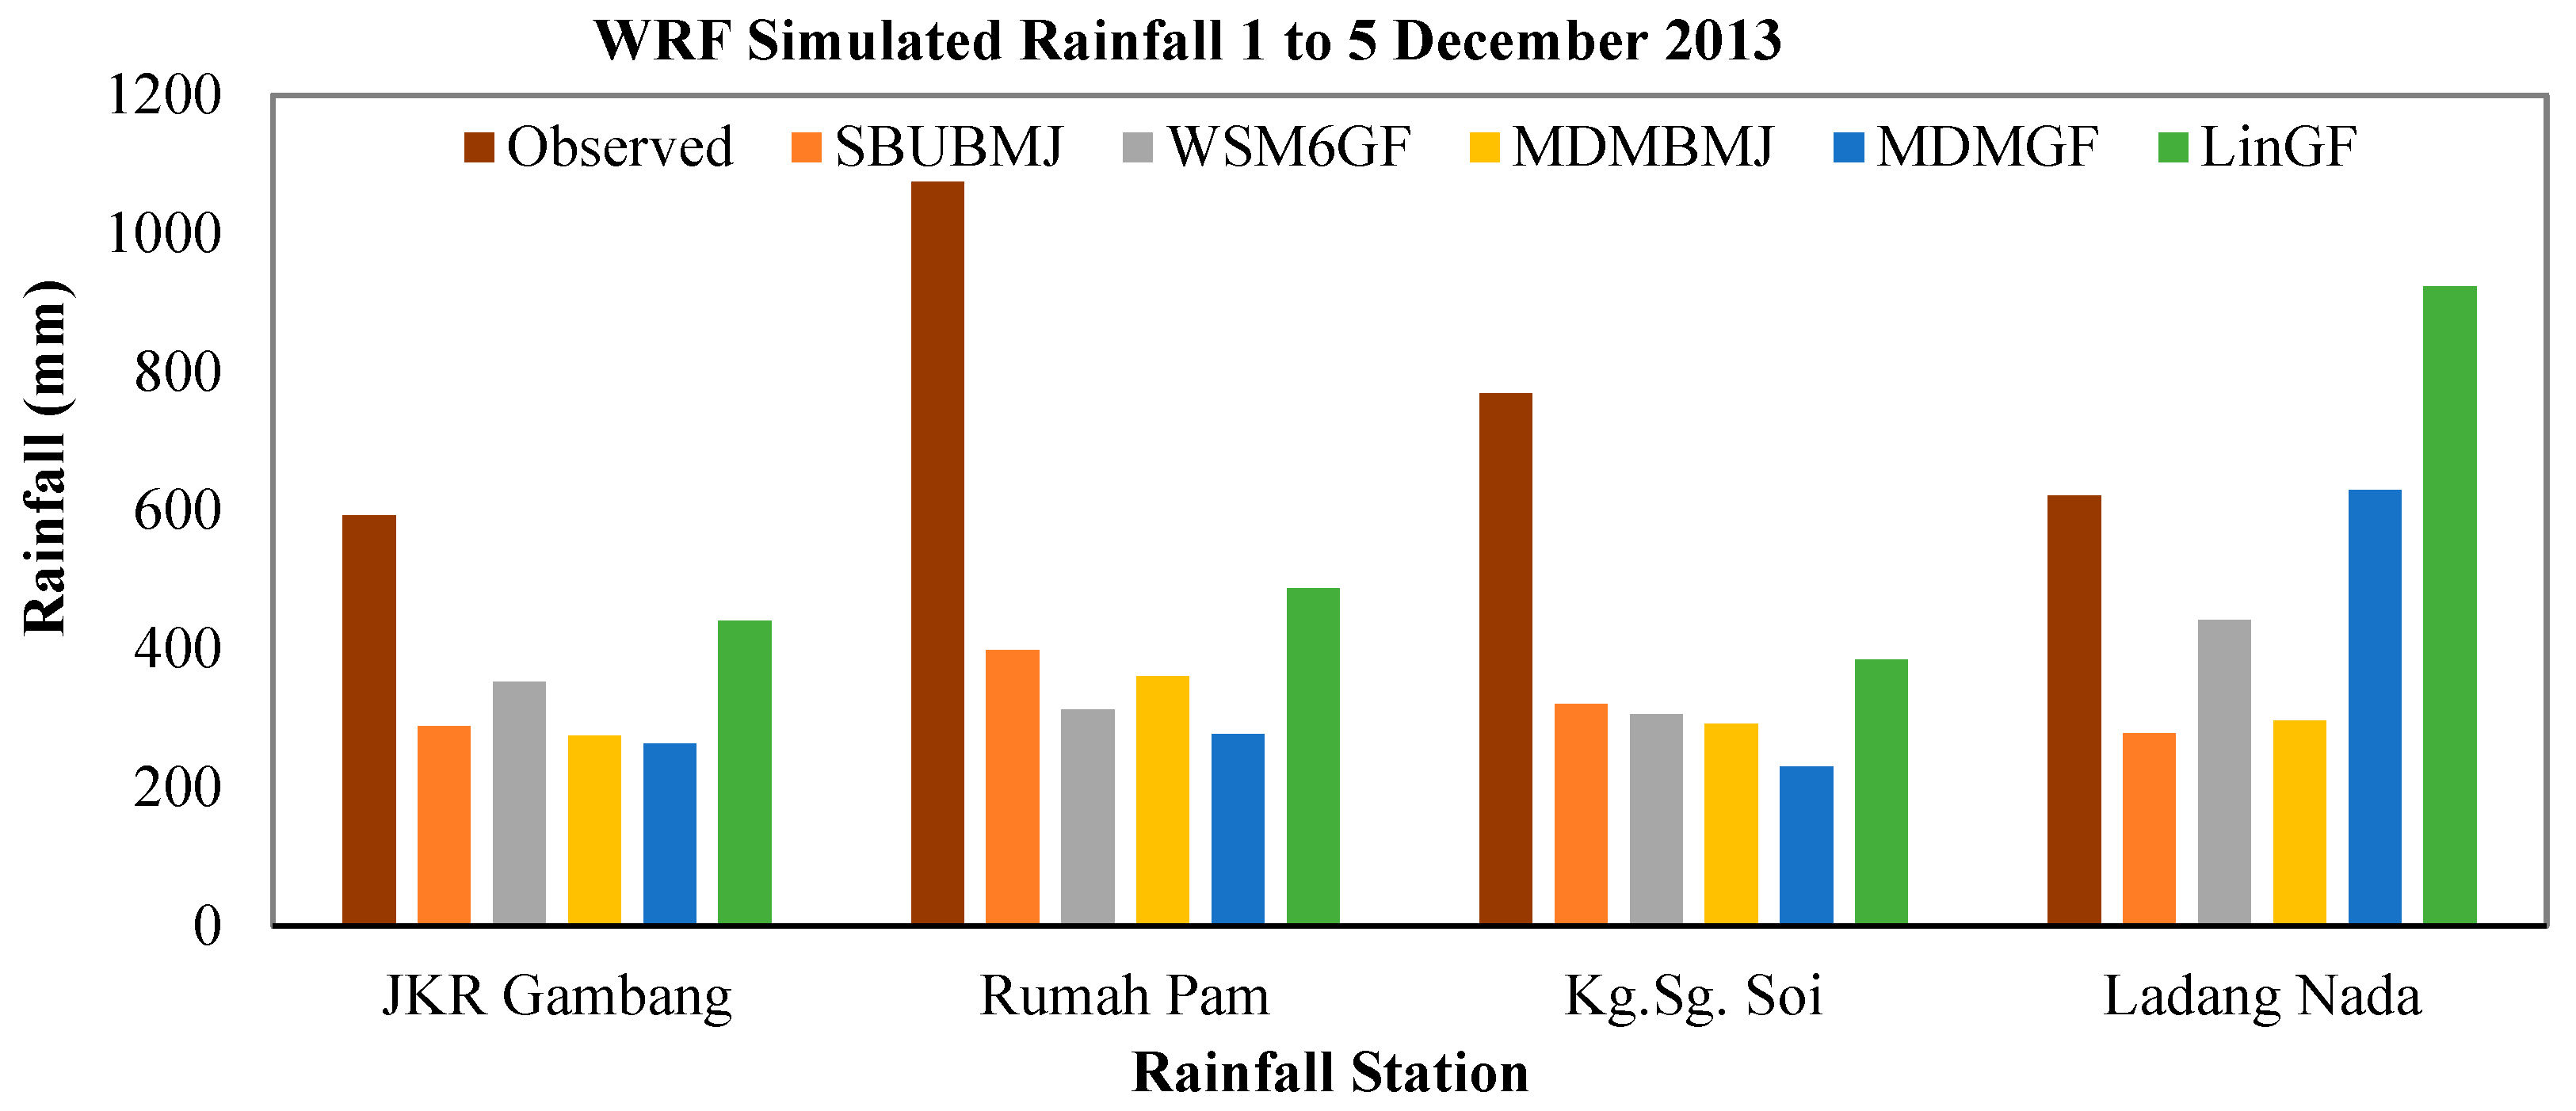
| JKR Gambang | 592.8 | 287.3 | 351.9 | 439.6 | 274.2 | 263.1 |
| Rumah Pam | 1074.4 | 397.5 | 312.3 | 487.1 | 360.4 | 275.8 |
| Kg. Sg. Soi | 768.5 | 320.1 | 305.1 | 384.5 | 290.8 | 230.5 |
| Ladng Nada | 621.5 | 277.5 | 440.7 | 923.5 | 296.0 | 629.2 |
| RF Station | Observed | SBUBMJ | WSM6GF | LinGF | MDMBMJ | MDMGF |
|---|---|---|---|---|---|---|
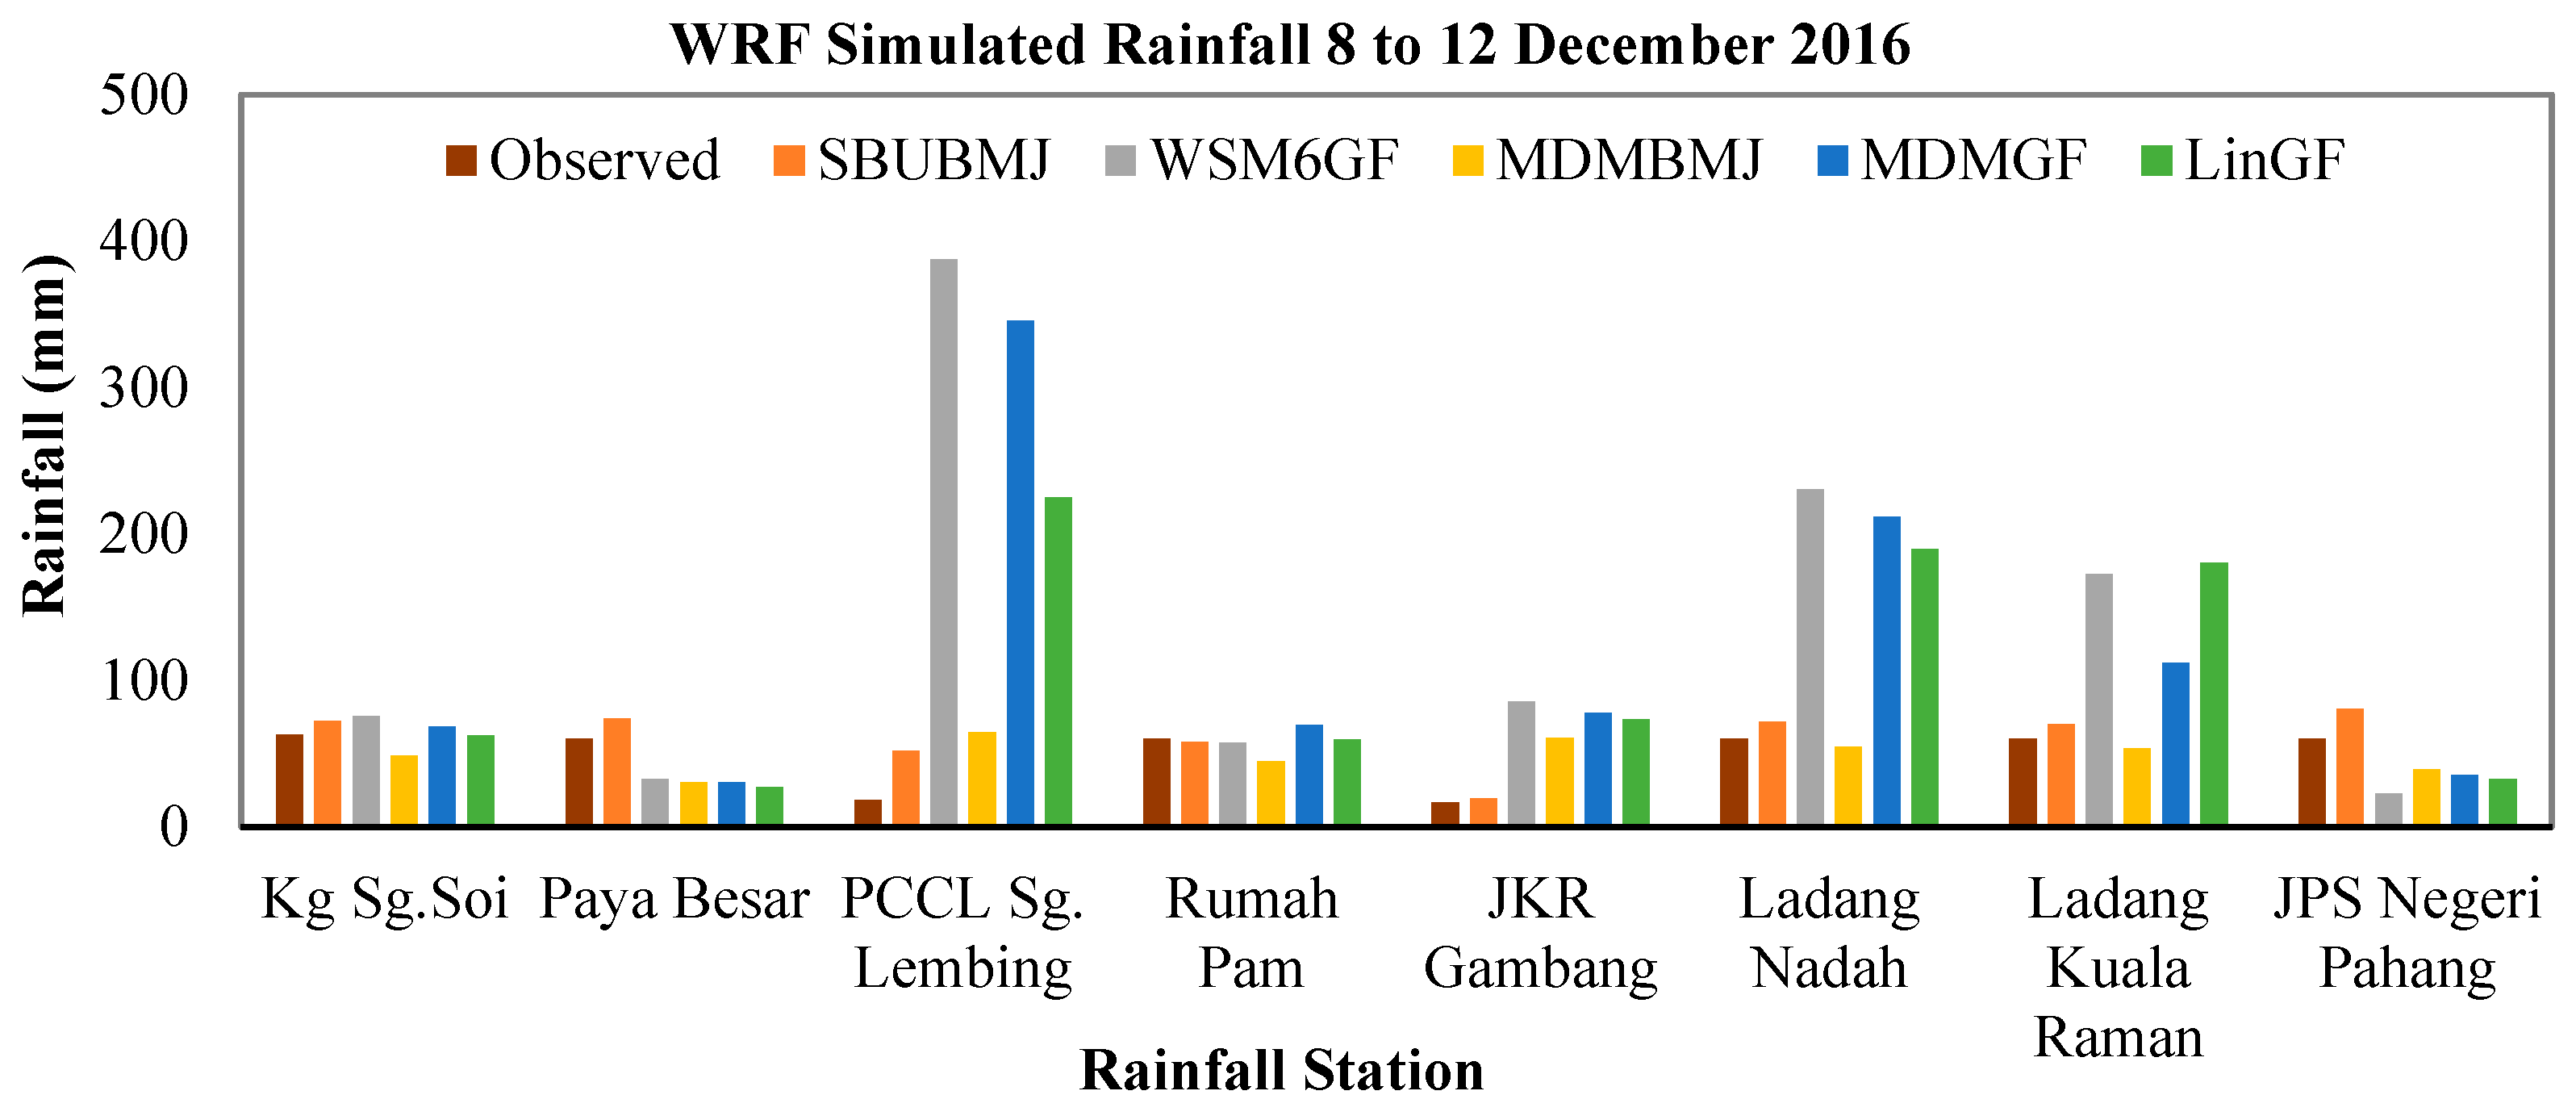
| Kg. Sg.Soi | 62.8 | 72.3 | 75.5 | 62.4 | 48.5 | 68.5 |
| Paya Besar | 60 | 74.1 | 32.8 | 27.1 | 30.1 | 30.2 |
| PCCL Sg. Lembing | 18.3 | 52.0 | 387.1 | 224.8 | 64.5 | 345.5 |
| Rumah Pam | 60.1 | 58.1 | 57.4 | 59.6 | 44.4 | 69.5 |
| JKR Gambang | 16.5 | 19.4 | 85.6 | 73.2 | 60.6 | 77.9 |
| Ladang Nada | 60.1 | 71.6 | 230.4 | 189.9 | 54.4 | 211.9 |
| Ladang Kuala Raman | 60.1 | 70.1 | 172.7 | 180.1 | 53.4 | 112.2 |
| JPS Negeri Pahang | 60 | 80.4 | 22.4 | 32.7 | 39.4 | 35.5 |
References
- Bližňák, V.; Pokorná, L.; Rulfová, Z. Assessment of the Capability of Modern Reanalyses to Simulate Precipitation in Warm Months Using Adjusted Radar Precipitation. J. Hydrol. Reg. Stud. 2022, 42, 101121. [Google Scholar] [CrossRef]
- Michaelides, S. Editorial for Special Issue “Remote Sensing of Precipitation”. Remote Sens. 2019, 11, 389. [Google Scholar] [CrossRef]
- Leta, O.T.; El-Kadi, A.I.; Dulai, H. Impact of Climate Change on Daily Streamflow and Its Extreme Values in Pacific Island Watersheds. Sustainability 2018, 10, 2057. [Google Scholar] [CrossRef]
- Goncalves, M.L.R.; Zischg, J.; Rau, S.; Sitzmann, M.; Rauch, W.; Kleidorfer, M. Modeling the Effects of Introducing Low Impact Development in a Tropical City: A Case Study from Joinville, Brazil. Sustainability 2018, 10, 728. [Google Scholar] [CrossRef]
- Coppola, E.; Giorgi, F. An Assessment of Temperature and Precipitation Change Projections over Italy from Recent Global and Regional Climate Model Simulations. Int. J. Climatol. A J. R. Meteorol. Soc. 2010, 30, 11–32. [Google Scholar] [CrossRef]
- Figueroa, S.N.; Bonatti, J.P.; Kubota, P.Y.; Grell, G.A.; Morrison, H.; Barros, S.R.M.; Fernandez, J.P.R.; Ramirez, E.; Siqueira, L.; Luzia, G.; et al. The Brazilian Global Atmospheric Model (BAM): Performance for Tropical Rainfall Forecasting and Sensitivity to Convective Scheme and Horizontal Resolution. Weather Forecast. 2016, 31, 1547–1572. [Google Scholar] [CrossRef]
- Lehtonen, I.; Ruosteenoja, K.; Jylhä, K. Projected Changes in European Extreme Precipitation Indices on the Basis of Global and Regional Climate Model Ensembles. Int. J. Climatol. 2014, 34, 1208–1222. [Google Scholar] [CrossRef]
- Li, L.; Gochis, D.J.; Sobolowski, S.; Mesquita, M.D. Evaluating the Present Annual Water Budget of a Himalayan Headwater River Basin Using a High-resolution Atmosphere-hydrology Model. J. Geophys. Res. Atmos. 2017, 122, 4786–4807. [Google Scholar] [CrossRef]
- Ratna, S.B.; Sikka, D.R.; Dalvi, M.; Ratnam, V.J. Dynamical Simulation of Indian Summer Monsoon Circulation, Rainfall and Its Interannual Variability Using a High Resolution Atmospheric General Circulation Model. Int. J. Climatol. 2011, 31, 1927–1942. [Google Scholar] [CrossRef]
- Khansalari, S.; Ranjbar-Saadatabadi, A.; Fazel-Rastgar, F.; Raziei, T. Synoptic and Dynamic Analysis of a Flash Flood-Inducing Heavy Rainfall Event in Arid and Semi-Arid Central-Northern Iran and Its Simulation Using the WRF Model. Dyn. Atmos. Oceans 2021, 93, 101198. [Google Scholar] [CrossRef]
- Prathipati, V.K.; Viswanadhapalli, Y.; Chennu, V.N.; Dasari, H.P. Evaluation of Weather Research and Forecasting Model Downscaled Rainfall and Its Variability over India. Int. J. Climatol. 2022, 42, 1418–1444. [Google Scholar] [CrossRef]
- Srinivas, C.; Hariprasad, D.; Bhaskar Rao, D.; Anjaneyulu, Y.; Baskaran, R.; Venkatraman, B. Simulation of the Indian Summer Monsoon Regional Climate Using Advanced Research WRF Model. Int. J. Climatol. 2013, 33, 1195–1210. [Google Scholar] [CrossRef]
- Liu, L.; Ma, Y.; Menenti, M.; Zhang, X.; Ma, W. Evaluation of WRF Modeling in Relation to Different Land Surface Schemes and Initial and Boundary Conditions: A Snow Event Simulation over the Tibetan Plateau. J. Geophys. Res. Atmos. 2019, 124, 209–226. [Google Scholar] [CrossRef]
- Pegahfar, N.; Gharaylou, M.; Shoushtari, M.H. Assessing the Performance of the WRF Model Cumulus Parameterization Schemes for the Simulation of Five Heavy Rainfall Events over the Pol-Dokhtar, Iran during 1999–2019. Nat. Hazards 2022, 112, 253–279. [Google Scholar] [CrossRef]
- Dasari, H.P.; Salgado, R.; Perdigao, J.; Challa, V.S. A Regional Climate Simulation Study Using WRF-ARW Model over Europe and Evaluation for Extreme Temperature Weather Events. Int. J. Atmos. Sci. 2014, 2014. [Google Scholar] [CrossRef]
- Huang, D.; Gao, S. Impact of Different Reanalysis Data on WRF Dynamical Downscaling over China. Atmos. Res. 2018, 200, 25–35. [Google Scholar] [CrossRef]
- Comin, A.N.; Justino, F.; Pezzi, L.; de Sousa Gurjão, C.D.; Shumacher, V.; Fernández, A.; Sutil, U.A. Extreme Rainfall Event in the Northeast Coast of Brazil: A Numerical Sensitivity Study. Meteorol. Atmos. Phys. 2021, 133, 141–162. [Google Scholar] [CrossRef]
- Yang, Q.; Yu, Z.; Wei, J.; Yang, C.; Gu, H.; Xiao, M.; Shang, S.; Dong, N.; Gao, L.; Arnault, J.; et al. Performance of the WRF Model in Simulating Intense Precipitation Events over the Hanjiang River Basin, China—A Multi-Physics Ensemble Approach. Atmos. Res. 2021, 248, 105206. [Google Scholar] [CrossRef]
- Grabowski, W.W.; Morrison, H.; Shima, S.-I.; Abade, G.C.; Dziekan, P.; Pawlowska, H. Modeling of Cloud Microphysics: Can We Do Better? Bull. Am. Meteorol. Soc. 2019, 100, 655–672. [Google Scholar] [CrossRef]
- Wang, W. Forecasting Convection with a “Scale-Aware” Tiedtke Cumulus Parameterization Scheme at Kilometer Scales. Weather Forecast. 2022, 37, 1491–1507. [Google Scholar] [CrossRef]
- Madhulatha, A.; Dudhia, J.; Park, R.; Rajeevan, M. Simulation of Latent Heating Rate From the Microphysical Process Associated With Mesoscale Convective System Over Korean Peninsula. Earth Space Sci. 2022, 9, e2022EA002419. [Google Scholar] [CrossRef]
- Das, S.; Ashrit, R.; Iyengar, G.R.; Mohandas, S.; Das Gupta, M.; George, J.P.; Rajagopal, E.N.; Dutta, S.K. Skills of Different Mesoscale Models over Indian Region during Monsoon Season: Forecast Errors. J. Earth Syst. Sci. 2008, 117, 603–620. [Google Scholar] [CrossRef]
- Pithani, P.; Ghude, S.D.; Prabhakaran, T.; Karipot, A.; Hazra, A.; Kulkarni, R.; Chowdhuri, S.; Resmi, E.; Konwar, M.; Murugavel, P.; et al. WRF Model Sensitivity to Choice of PBL and Microphysics Parameterization for an Advection Fog Event at Barkachha, Rural Site in the Indo-Gangetic Basin, India. Theor. Appl. Climatol. 2019, 136, 1099–1113. [Google Scholar] [CrossRef]
- Song, H.-J.; Sohn, B.-J. An Evaluation of WRF Microphysics Schemes for Simulating the Warm-Type Heavy Rain over the Korean Peninsula. Asia-Pac. J. Atmos. Sci. 2018, 54, 225–236. [Google Scholar] [CrossRef]
- Verma, S.; Panda, J.; Rath, S.S. Role of PBL and Microphysical Parameterizations during WRF Simulated Monsoonal Heavy Rainfall Episodes over Mumbai. Pure Appl. Geophys. 2021, 178, 3673–3702. [Google Scholar] [CrossRef]
- Attada, R.; Dasari, H.P.; Kunchala, R.K.; Langodan, S.; Niranjan Kumar, K.; Knio, O.; Hoteit, I. Evaluating Cumulus Parameterization Schemes for the Simulation of Arabian Peninsula Winter Rainfall. J. Hydrometeorol. 2020, 21, 1089–1114. [Google Scholar] [CrossRef]
- Musa, A.I.; Tsubo, M.; Ma, S.; Kurosaki, Y.; Ibaraki, Y.; Ali-Babiker, I.-E.A. Evaluation of WRF Cumulus Parameterization Schemes for the Hot Climate of Sudan Emphasizing Crop Growing Seasons. Atmosphere 2022, 13, 572. [Google Scholar] [CrossRef]
- Constantinidou, K.; Hadjinicolaou, P.; Zittis, G.; Lelieveld, J. Performance of Land Surface Schemes in the WRF Model for Climate Simulations over the MENA-CORDEX Domain. Earth Syst. Environ. 2020, 4, 647–665. [Google Scholar] [CrossRef]
- Srivastava, P.K.; Han, D.; Rico-Ramirez, M.A.; O’Neill, P.; Islam, T.; Gupta, M.; Dai, Q. Performance Evaluation of WRF-Noah Land Surface Model Estimated Soil Moisture for Hydrological Application: Synergistic Evaluation Using SMOS Retrieved Soil Moisture. J. Hydrol. 2015, 529, 200–212. [Google Scholar] [CrossRef]
- Gómez, I.; Molina, S.; Galiana-Merino, J.J.; Estrela, M.J.; Caselles, V. Impact of Noah-LSM Parameterizations on WRF Mesoscale Simulations: Case Study of Prevailing Summer Atmospheric Conditions over a Typical Semi-Arid Region in Eastern Spain. Sustainability 2021, 13, 11399. [Google Scholar] [CrossRef]
- Rai, D.; Pattnaik, S. Evaluation of WRF Planetary Boundary Layer Parameterization Schemes for Simulation of Monsoon Depressions over India. Meteorol. Atmos. Phys. 2019, 131, 1529–1548. [Google Scholar] [CrossRef]
- Zeyaeyan, S.; Fattahi, E.; Ranjbar, A.; Azadi, M.; Vazifedoust, M. Evaluating the Effect of Physics Schemes in WRF Simulations of Summer Rainfall in North West Iran. Climate 2017, 5, 48. [Google Scholar] [CrossRef]
- Lekhadiya, H.S.; Jana, R.K. Sensitivity of the WRF Model to the Parameterized Physical Process. In Recent Advances in Intelligent Information Systems and Applied Mathematics; Castillo, O., Jana, D.K., Giri, D., Ahmed, A., Eds.; Studies in Computational Intelligence; Springer International Publishing: Cham, Switzerland, 2020; Volume 863, pp. 170–181. ISBN 978-3-030-34151-0. [Google Scholar]
- Ardie, W.A.; Sow, K.S.; Tangang, F.T.; Hussin, A.G.; Mahmud, M.; Juneng, L. The Performance of Different Cumulus Parameterization Schemes in Simulating the 2006/2007 Southern Peninsular Malaysia Heavy Rainfall Episodes. J. Earth Syst. Sci. 2012, 121, 317–327. [Google Scholar] [CrossRef][Green Version]
- Umer, Y.; Ettema, J.; Jetten, V.; Steeneveld, G.-J.; Ronda, R. Evaluation of the WRF Model to Simulate a High-Intensity Rainfall Event over Kampala, Uganda. Water 2021, 13, 873. [Google Scholar] [CrossRef]
- Khan, M.M.A.; Shaari, N.A.B.; Bahar, A.M.A.; Baten, M.A.; Nazaruddin, D.B. Flood Impact Assessment in Kota Bharu, Malaysia: A Statistical Analysis. World Appl. Sci. J. 2014, 32, 626–634. [Google Scholar]
- Jamaluddin, A.F.; Kamal, M.I.M.; Abdullah, M.H.; Marodzi, A.N. Comparison between Satellite-Derived Rainfall and Rain Gauge Observation over Peninsular Malaysia. Sains Malays. 2022, 51, 67–81. [Google Scholar] [CrossRef]
- Akasah, Z.A.; Doraisamy, S.V. 2014 Malaysia Flood: Impacts & Factors Contributing towards the Restoration of Damages. J. Sci. Res. Dev. 2015, 2, 53–59. [Google Scholar]
- Romali, N.S.; Sulaiman, M.; Khushren, S.; Yusop, Z.; Ismail, Z. Flood Damage Assessment: A Review of Flood Stage–Damage Function Curve. ISFRAM 2014 2015, 147–159. [Google Scholar] [CrossRef]
- Romali, N.S.; Yusop, Z.; Sulaiman, M.; Ismail, Z. Flood Risk Assessment: A Review of Flood Damage Estimation Model for Malaysia. J. Teknol. 2018, 80. [Google Scholar] [CrossRef]
- Safiah Yusmah, M.Y.; Bracken, L.J.; Sahdan, Z.; Norhaslina, H.; Melasutra, M.D.; Ghaffarianhoseini, A.; Sumiliana, S.; Shereen Farisha, A.S. Understanding Urban Flood Vulnerability and Resilience: A Case Study of Kuantan, Pahang, Malaysia. Nat. Hazards 2020, 101, 551–571. [Google Scholar] [CrossRef]
- Jamaludin, M.H.; Jaafar, S.; Chuah, B.K.; Abdullah, Z. Flood: Kuantan Town Centre Almost Paralysed, 37,100 Evacuated in 4 States; The News Straits Times Press: Kuala Lumpur, Malaysia, 2013. [Google Scholar]
- Shah, S.M.H.; Mustaffa, Z.; Yusof, K.W. Disasters Worldwide and Floods in the Malaysian Region: A Brief Review. Indian J. Sci. Technol. 2017, 10, 1–9. [Google Scholar] [CrossRef]
- Zaidi, S.M.; Gisen, J.I.A. Evaluation of Weather Research and Forecasting (WRF) Microphysics Single Moment Class-3 and Class-6 in Precipitation Forecast. MATEC Web Conf. 2018, 150, 03007. [Google Scholar] [CrossRef][Green Version]
- Chai, T.; Draxler, R.R. Root Mean Square Error (RMSE) or Mean Absolute Error (MAE)?—Arguments against Avoiding RMSE in the Literature. Geosci. Model Dev. 2014, 7, 1247–1250. [Google Scholar] [CrossRef]
- Zelelew, D.; Melesse, A. Applicability of a Spatially Semi-Distributed Hydrological Model for Watershed Scale Runoff Estimation in Northwest Ethiopia. Water 2018, 10, 923. [Google Scholar] [CrossRef]
- Schwartz, C.S. A Comparison of Methods Used to Populate Neighborhood-Based Contingency Tables for High-Resolution Forecast Verification. Weather Forecast. 2017, 32, 733–741. [Google Scholar] [CrossRef]
- Opijah, F.J.; Mutemi, J.N.; Ogallo, L.A. Seasonal Climate Predictability over Kenya Using the Regional Spectral Model. J. Meteorol. Relat. Sci. 2017, 10, 12–24. [Google Scholar] [CrossRef]
- Racoma, B.; Crisologo, I.; David, C. Accumulation-Based Advection Field for Rainfall Nowcasting. J. Philipp. Geosci. Remote Sens. Soc. 2015, 1, 21–26. [Google Scholar]
- Salimun, E.; Tangang, F.; Juneng, L. Simulation of Heavy Precipitation Episode over Eastern Peninsular Malaysia Using MM5: Sensitivity to Cumulus Parameterization Schemes. Meteorol. Atmos. Phys. 2010, 107, 33–49. [Google Scholar] [CrossRef]
- Sikder, S.; Hossain, F. Assessment of the Weather Research and Forecasting Model Generalized Parameterization Schemes for Advancement of Precipitation Forecasting in Monsoon-driven River Basins. J. Adv. Model. Earth Syst. 2016, 8, 1210–1228. [Google Scholar] [CrossRef]
- Madhulatha, A.; Rajeevan, M. Impact of Different Parameterization Schemes on Simulation of Mesoscale Convective System over South-East India. Meteorol. Atmos. Phys. 2018, 130, 49–65. [Google Scholar] [CrossRef]
- Morrison, H.; Milbrandt, J.A.; Bryan, G.H.; Ikeda, K.; Tessendorf, S.A.; Thompson, G. Parameterization of Cloud Microphysics Based on the Prediction of Bulk Ice Particle Properties. Part II: Case Study Comparisons with Observations and Other Schemes. J. Atmos. Sci. 2015, 72, 312–339. [Google Scholar] [CrossRef]
- Kuo, C.-C.; Gan, T.Y. Estimation of Precipitation and Air Temperature over Western Canada Using a Regional Climate Model. Int. J. Climatol. 2018, 38, 5125–5135. [Google Scholar] [CrossRef]
- Reshmi Mohan, P.; Srinivas, C.V.; Yesubabu, V.; Baskaran, R.; Venkatraman, B. Simulation of a Heavy Rainfall Event over Chennai in Southeast India Using WRF: Sensitivity to Microphysics Parameterization. Atmos. Res. 2018, 210, 83–99. [Google Scholar] [CrossRef]
- Toride, K.; Cawthorne, D.L.; Ishida, K.; Kavvas, M.L.; Anderson, M.L. Long-Term Trend Analysis on Total and Extreme Precipitation over Shasta Dam Watershed. Sci. Total Environ. 2018, 626, 244–254. [Google Scholar] [CrossRef]
- Haghroosta, T.; Ismail, W.R.; Ghafarian, P.; Barekati, S.M. The Efficiency of the Weather Research and Forecasting (WRF) Model for Simulating Typhoons. Nat. Hazards Earth Syst. Sci. 2014, 14, 2179–2187. [Google Scholar] [CrossRef]
- Chawla, I.; Osuri, K.K.; Mujumdar, P.P.; Niyogi, D. Assessment of the Weather Research and Forecasting (WRF) Model for Simulation of Extreme Rainfall Events in the Upper Ganga Basin. Hydrol. Earth Syst. Sci. 2018, 22, 1095–1117. [Google Scholar] [CrossRef]
- Remesan, R.; Bellerby, T.; Holman, I.; Frostick, L. WRF Model Sensitivity to Choice of Parameterization: A Study of the ‘York Flood 1999’. Theor. Appl. Climatol. 2015, 122, 229–247. [Google Scholar] [CrossRef]
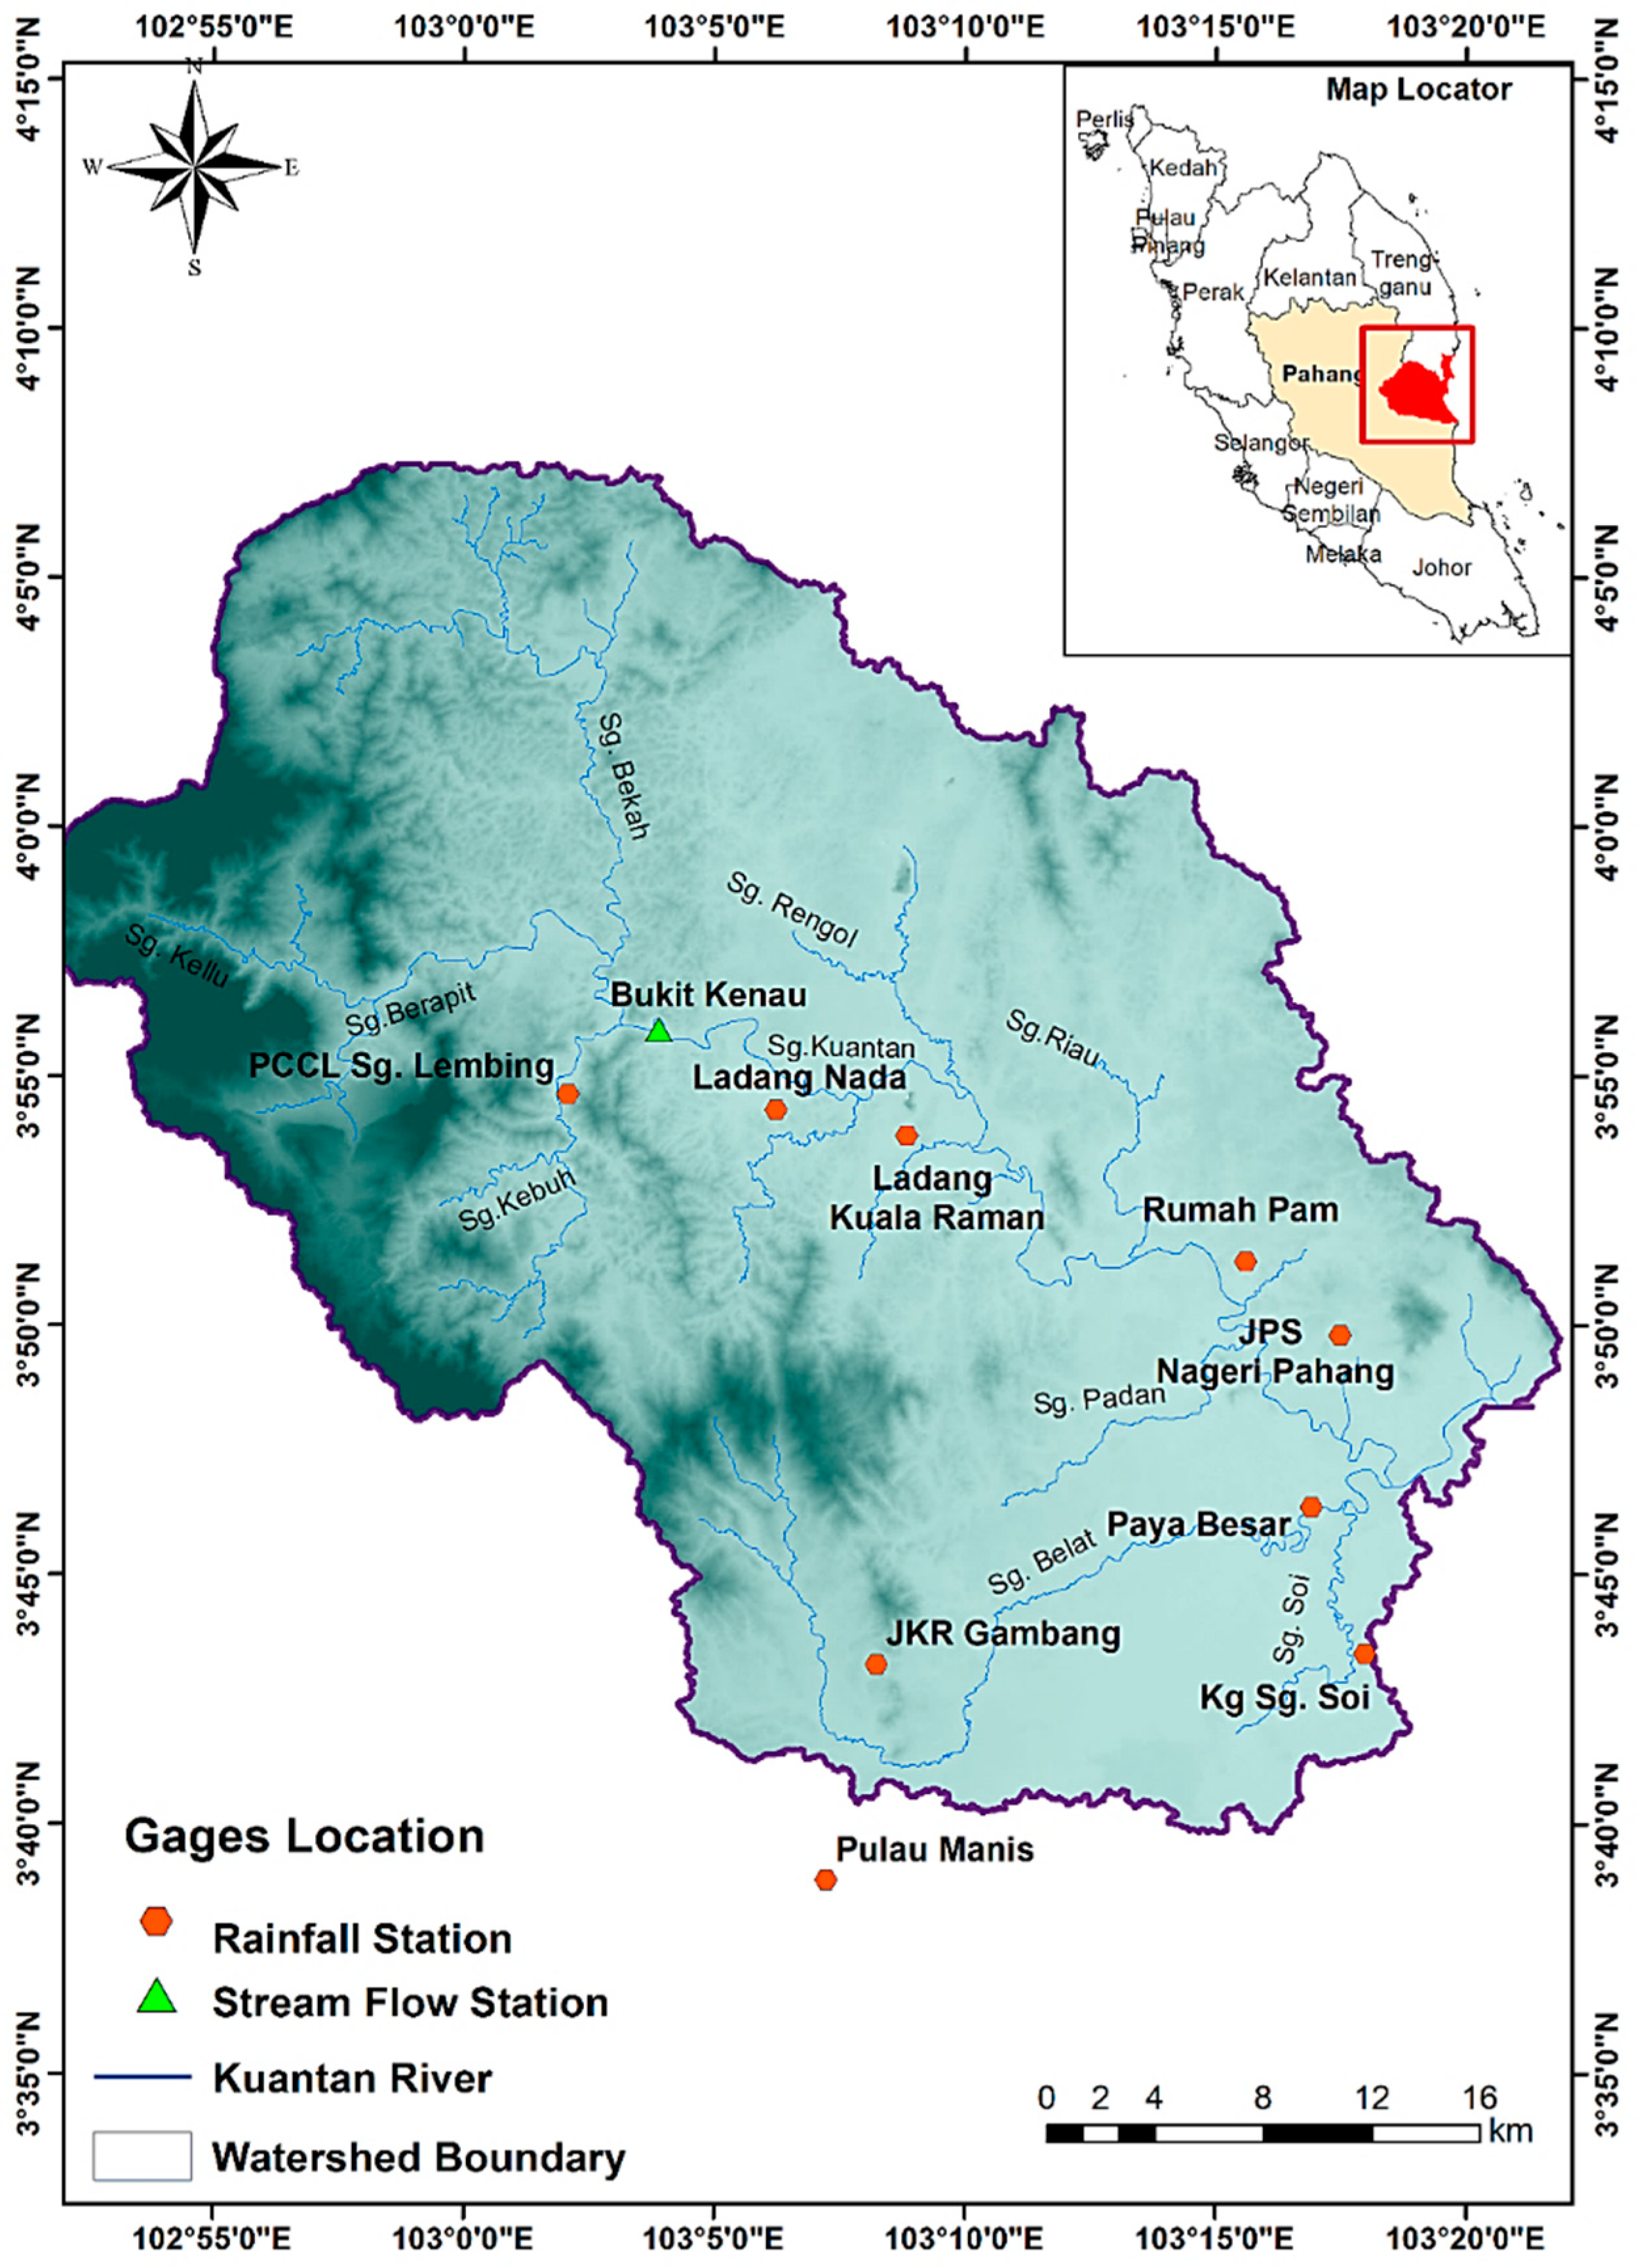
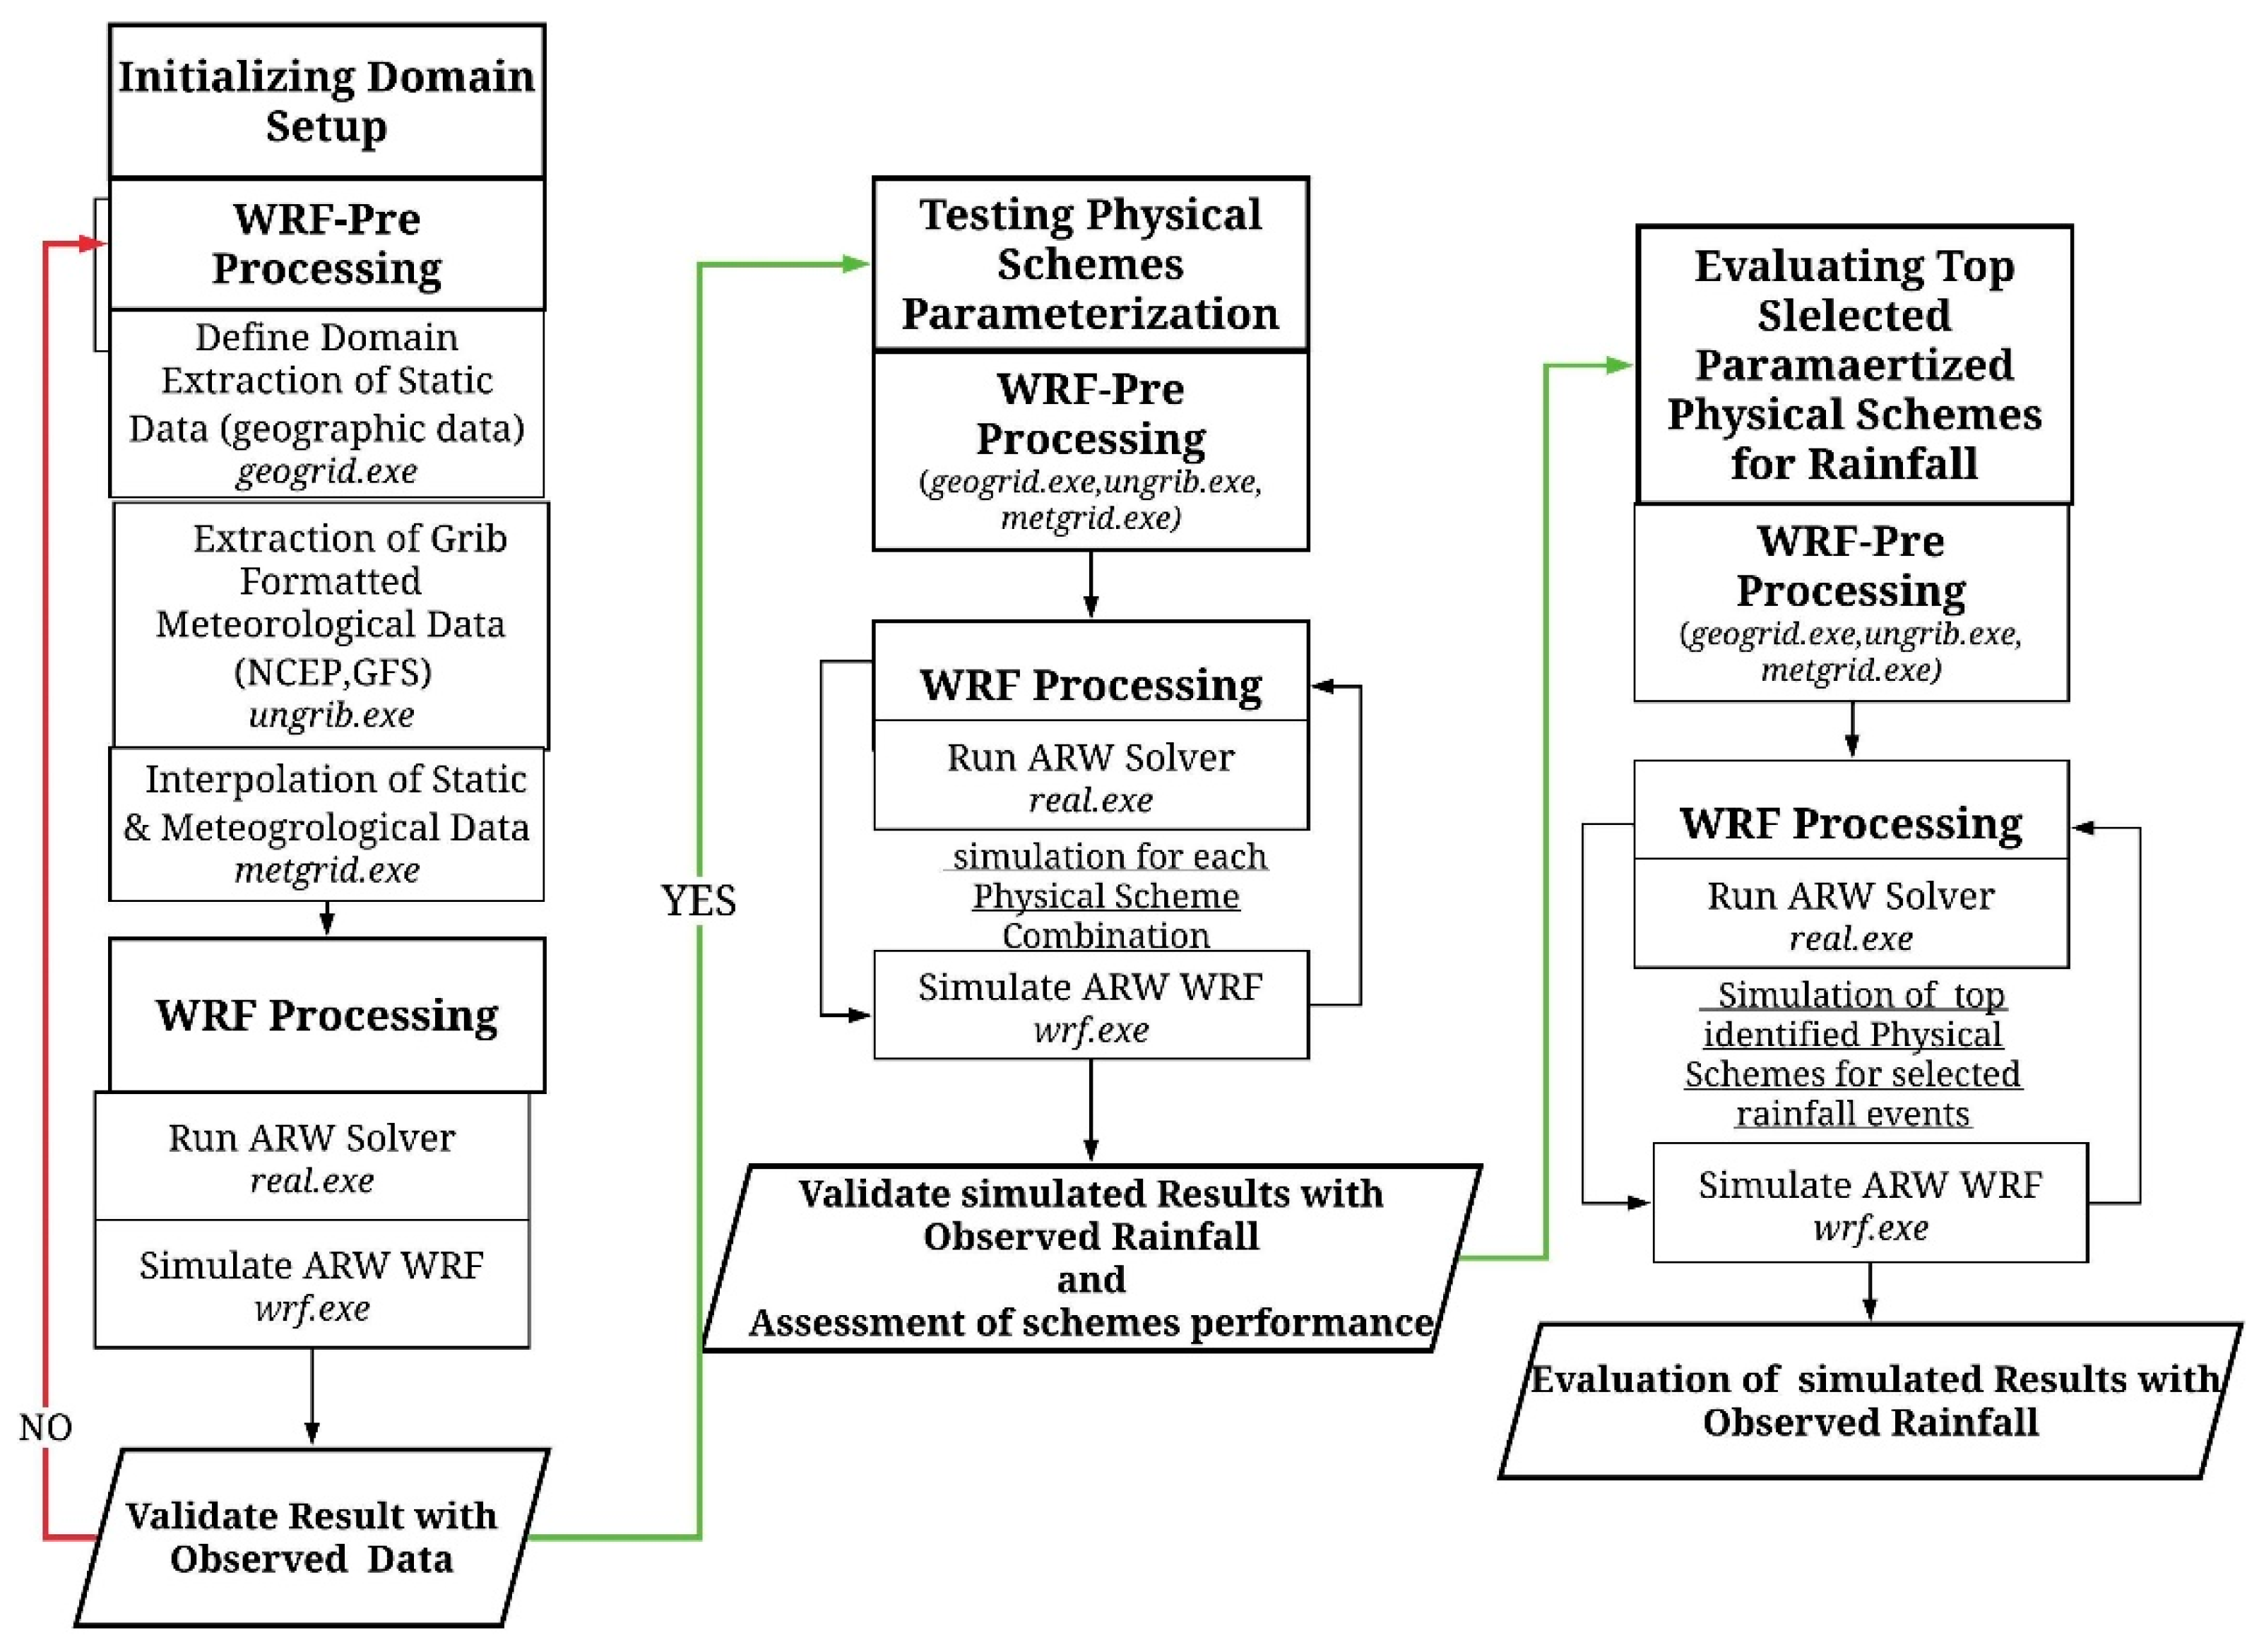




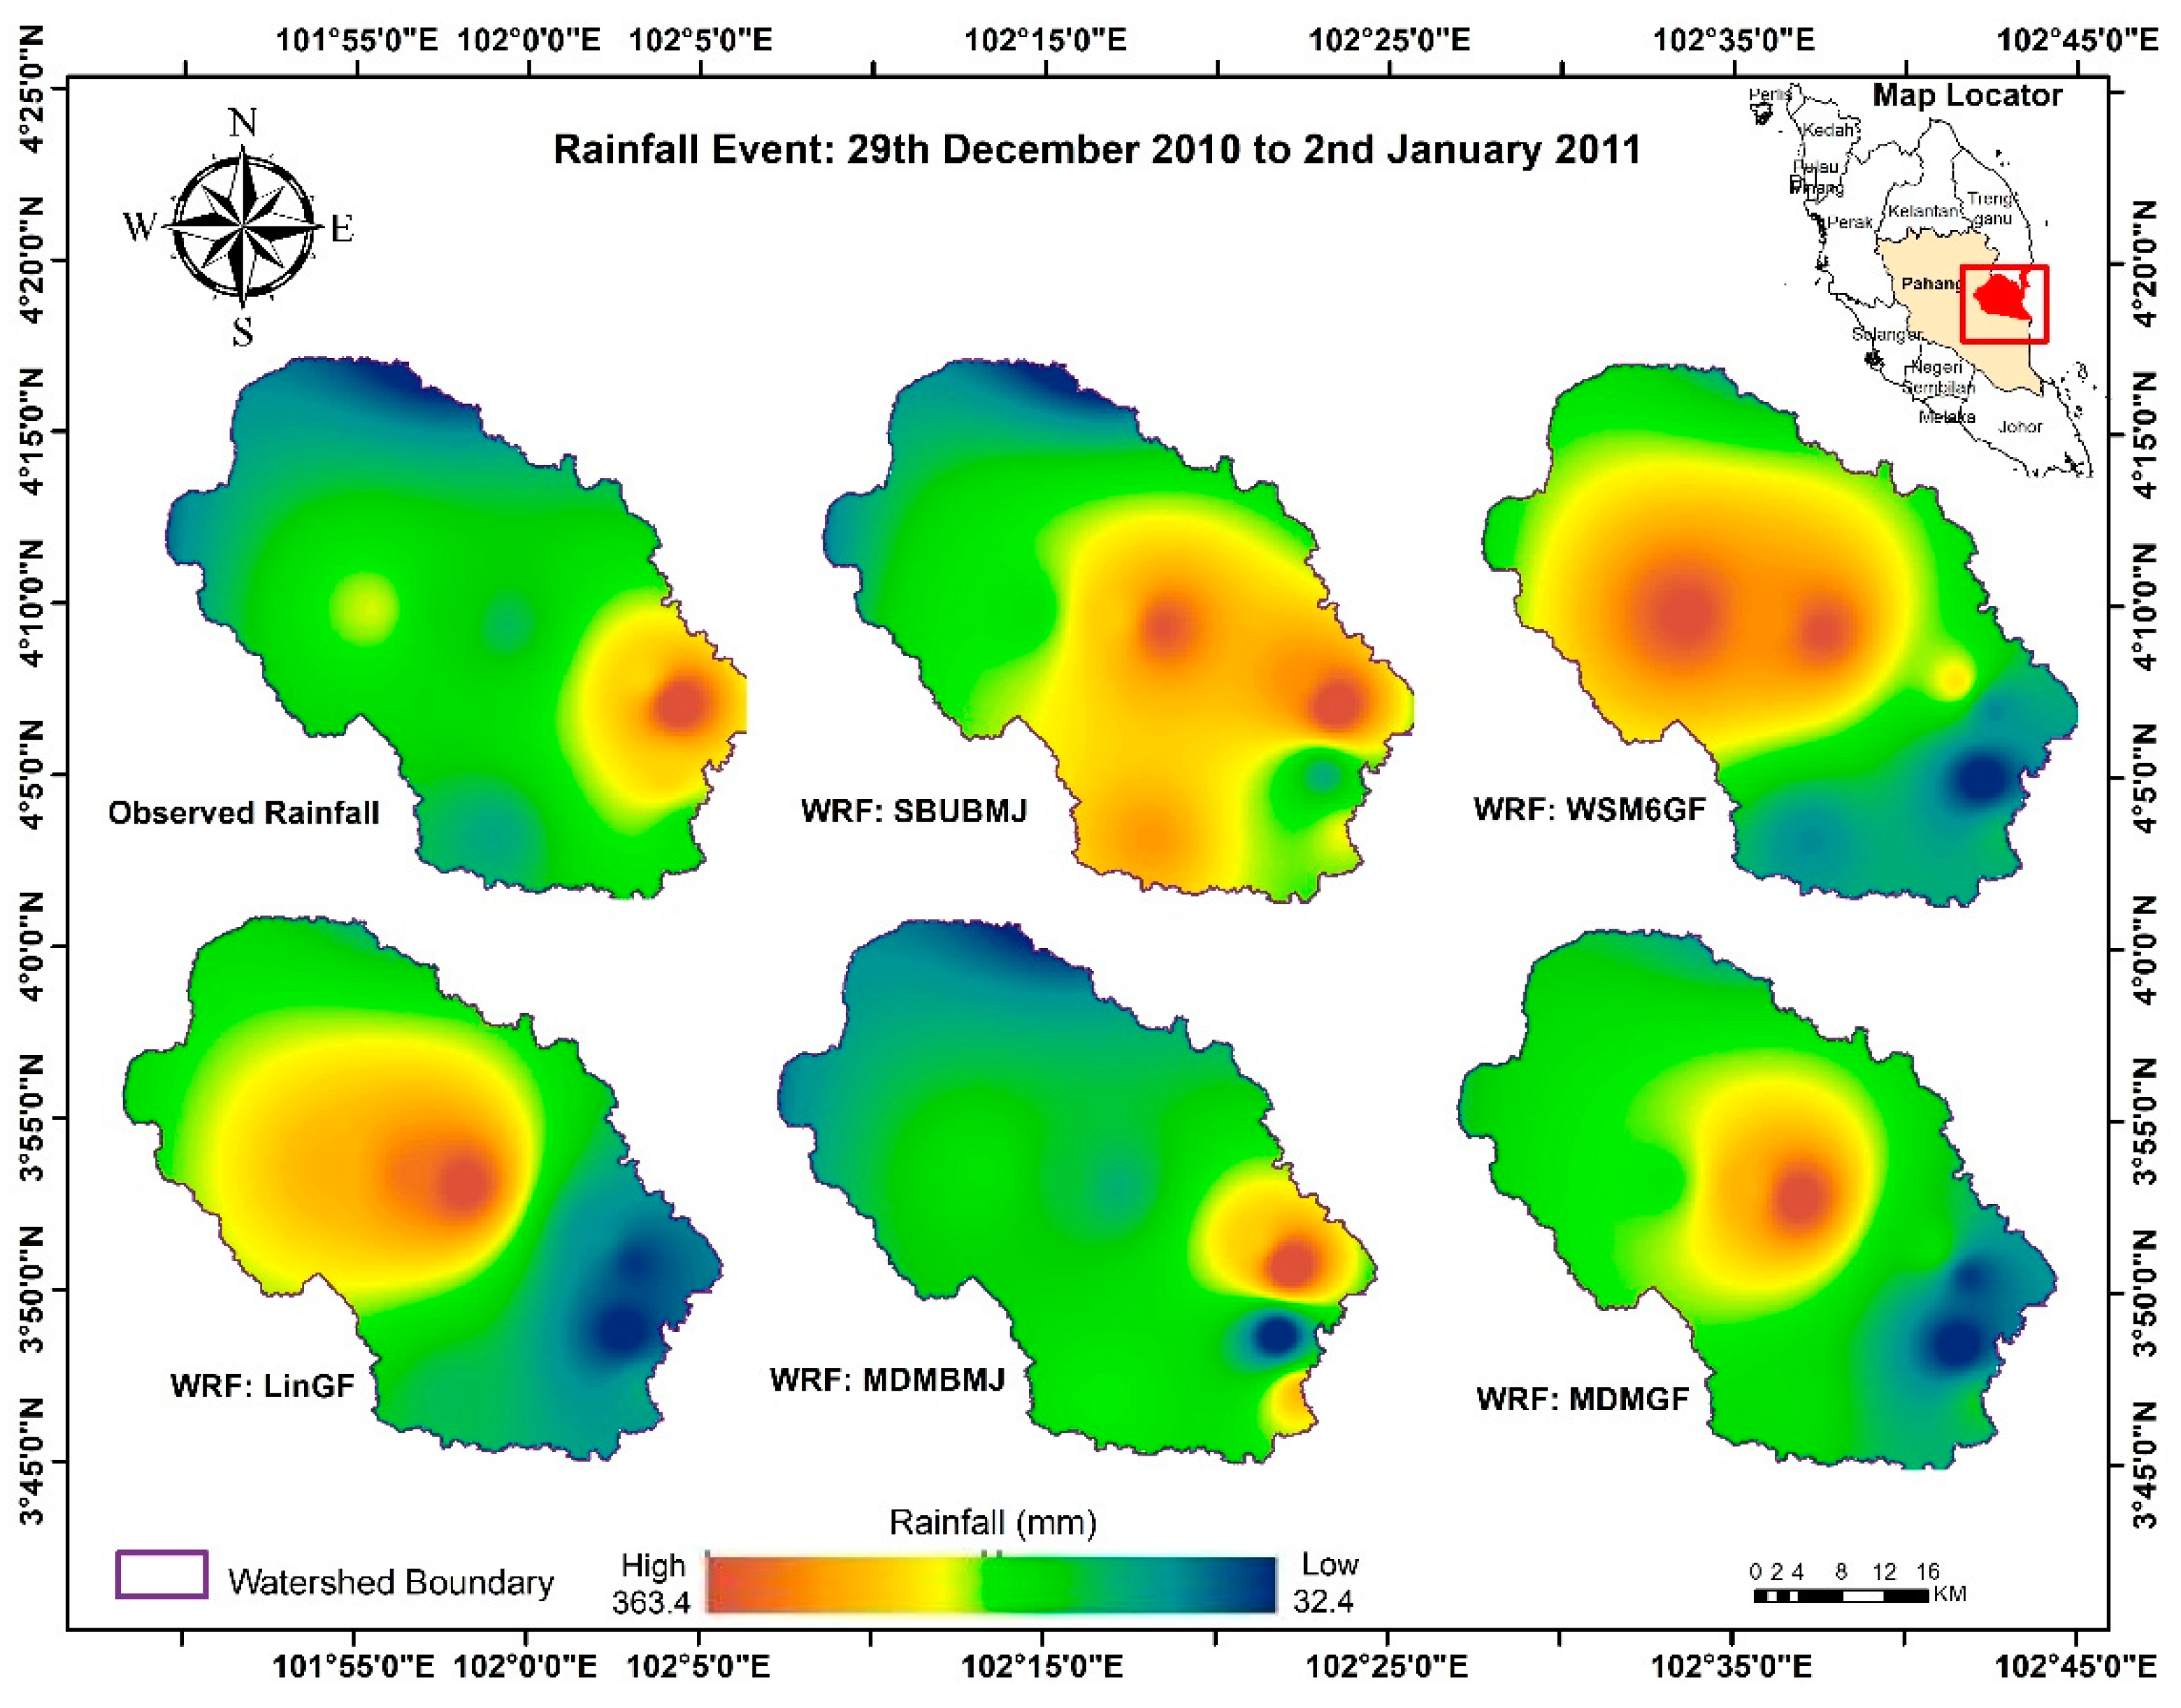
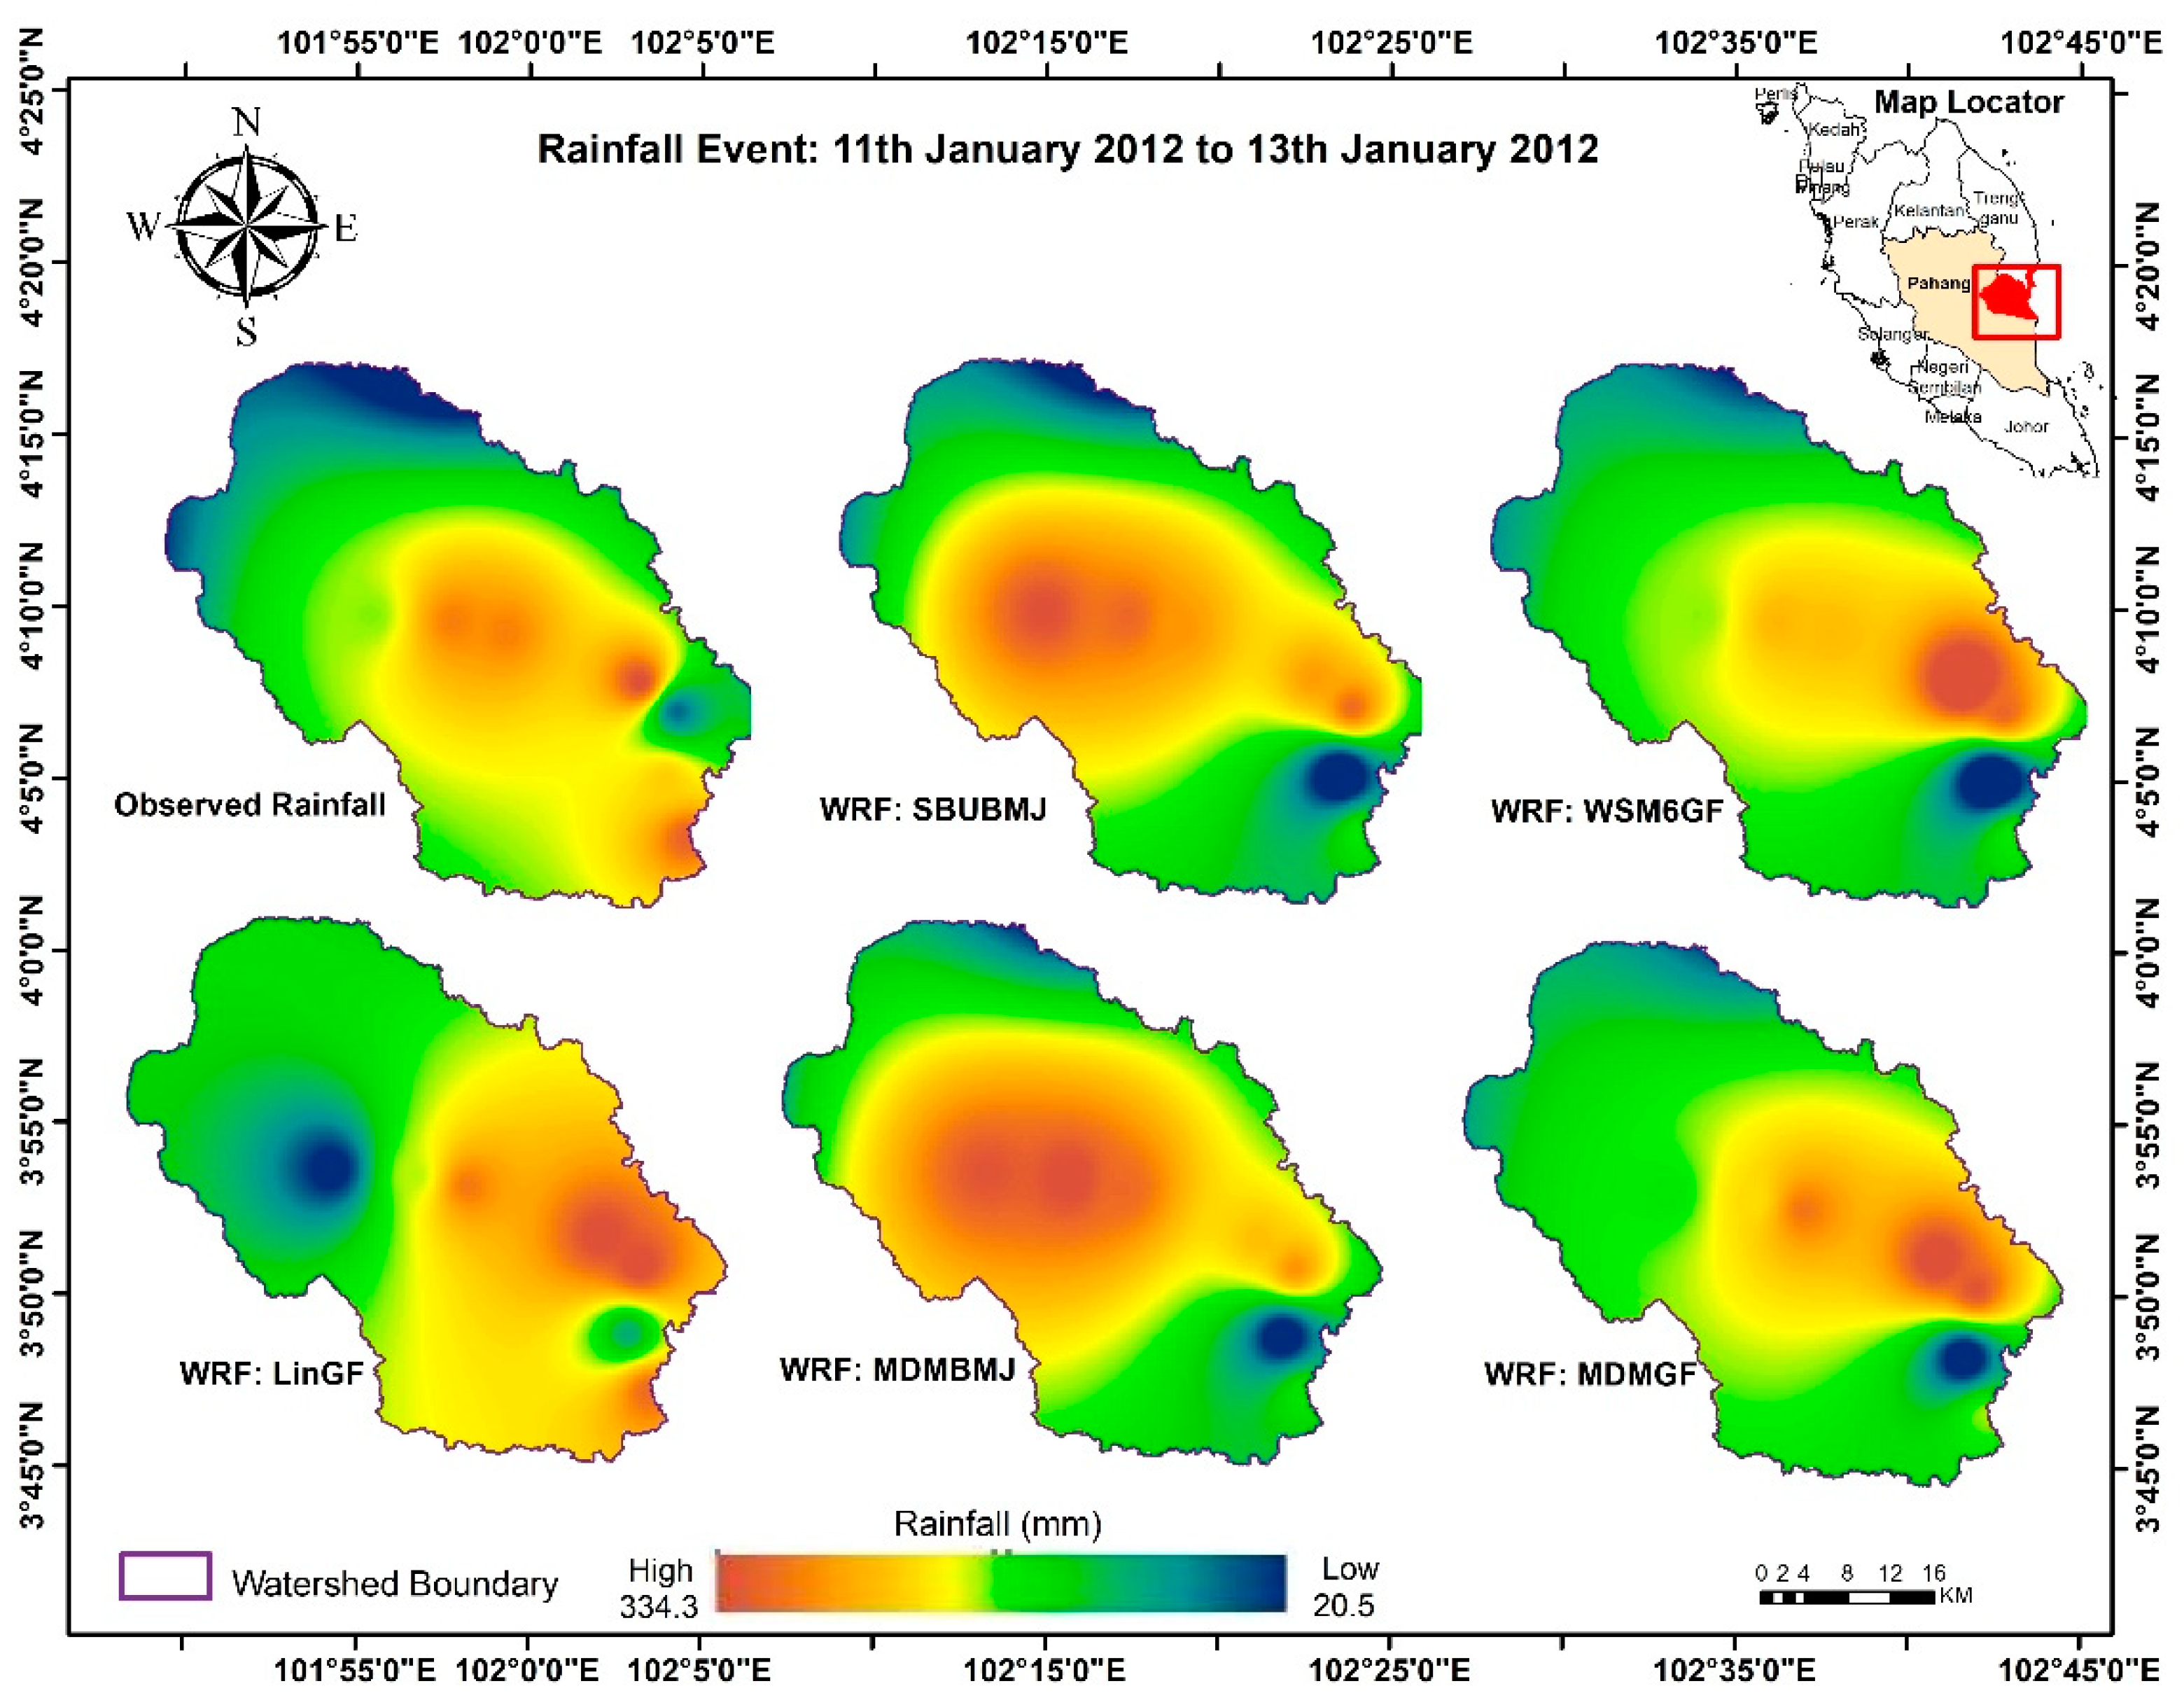
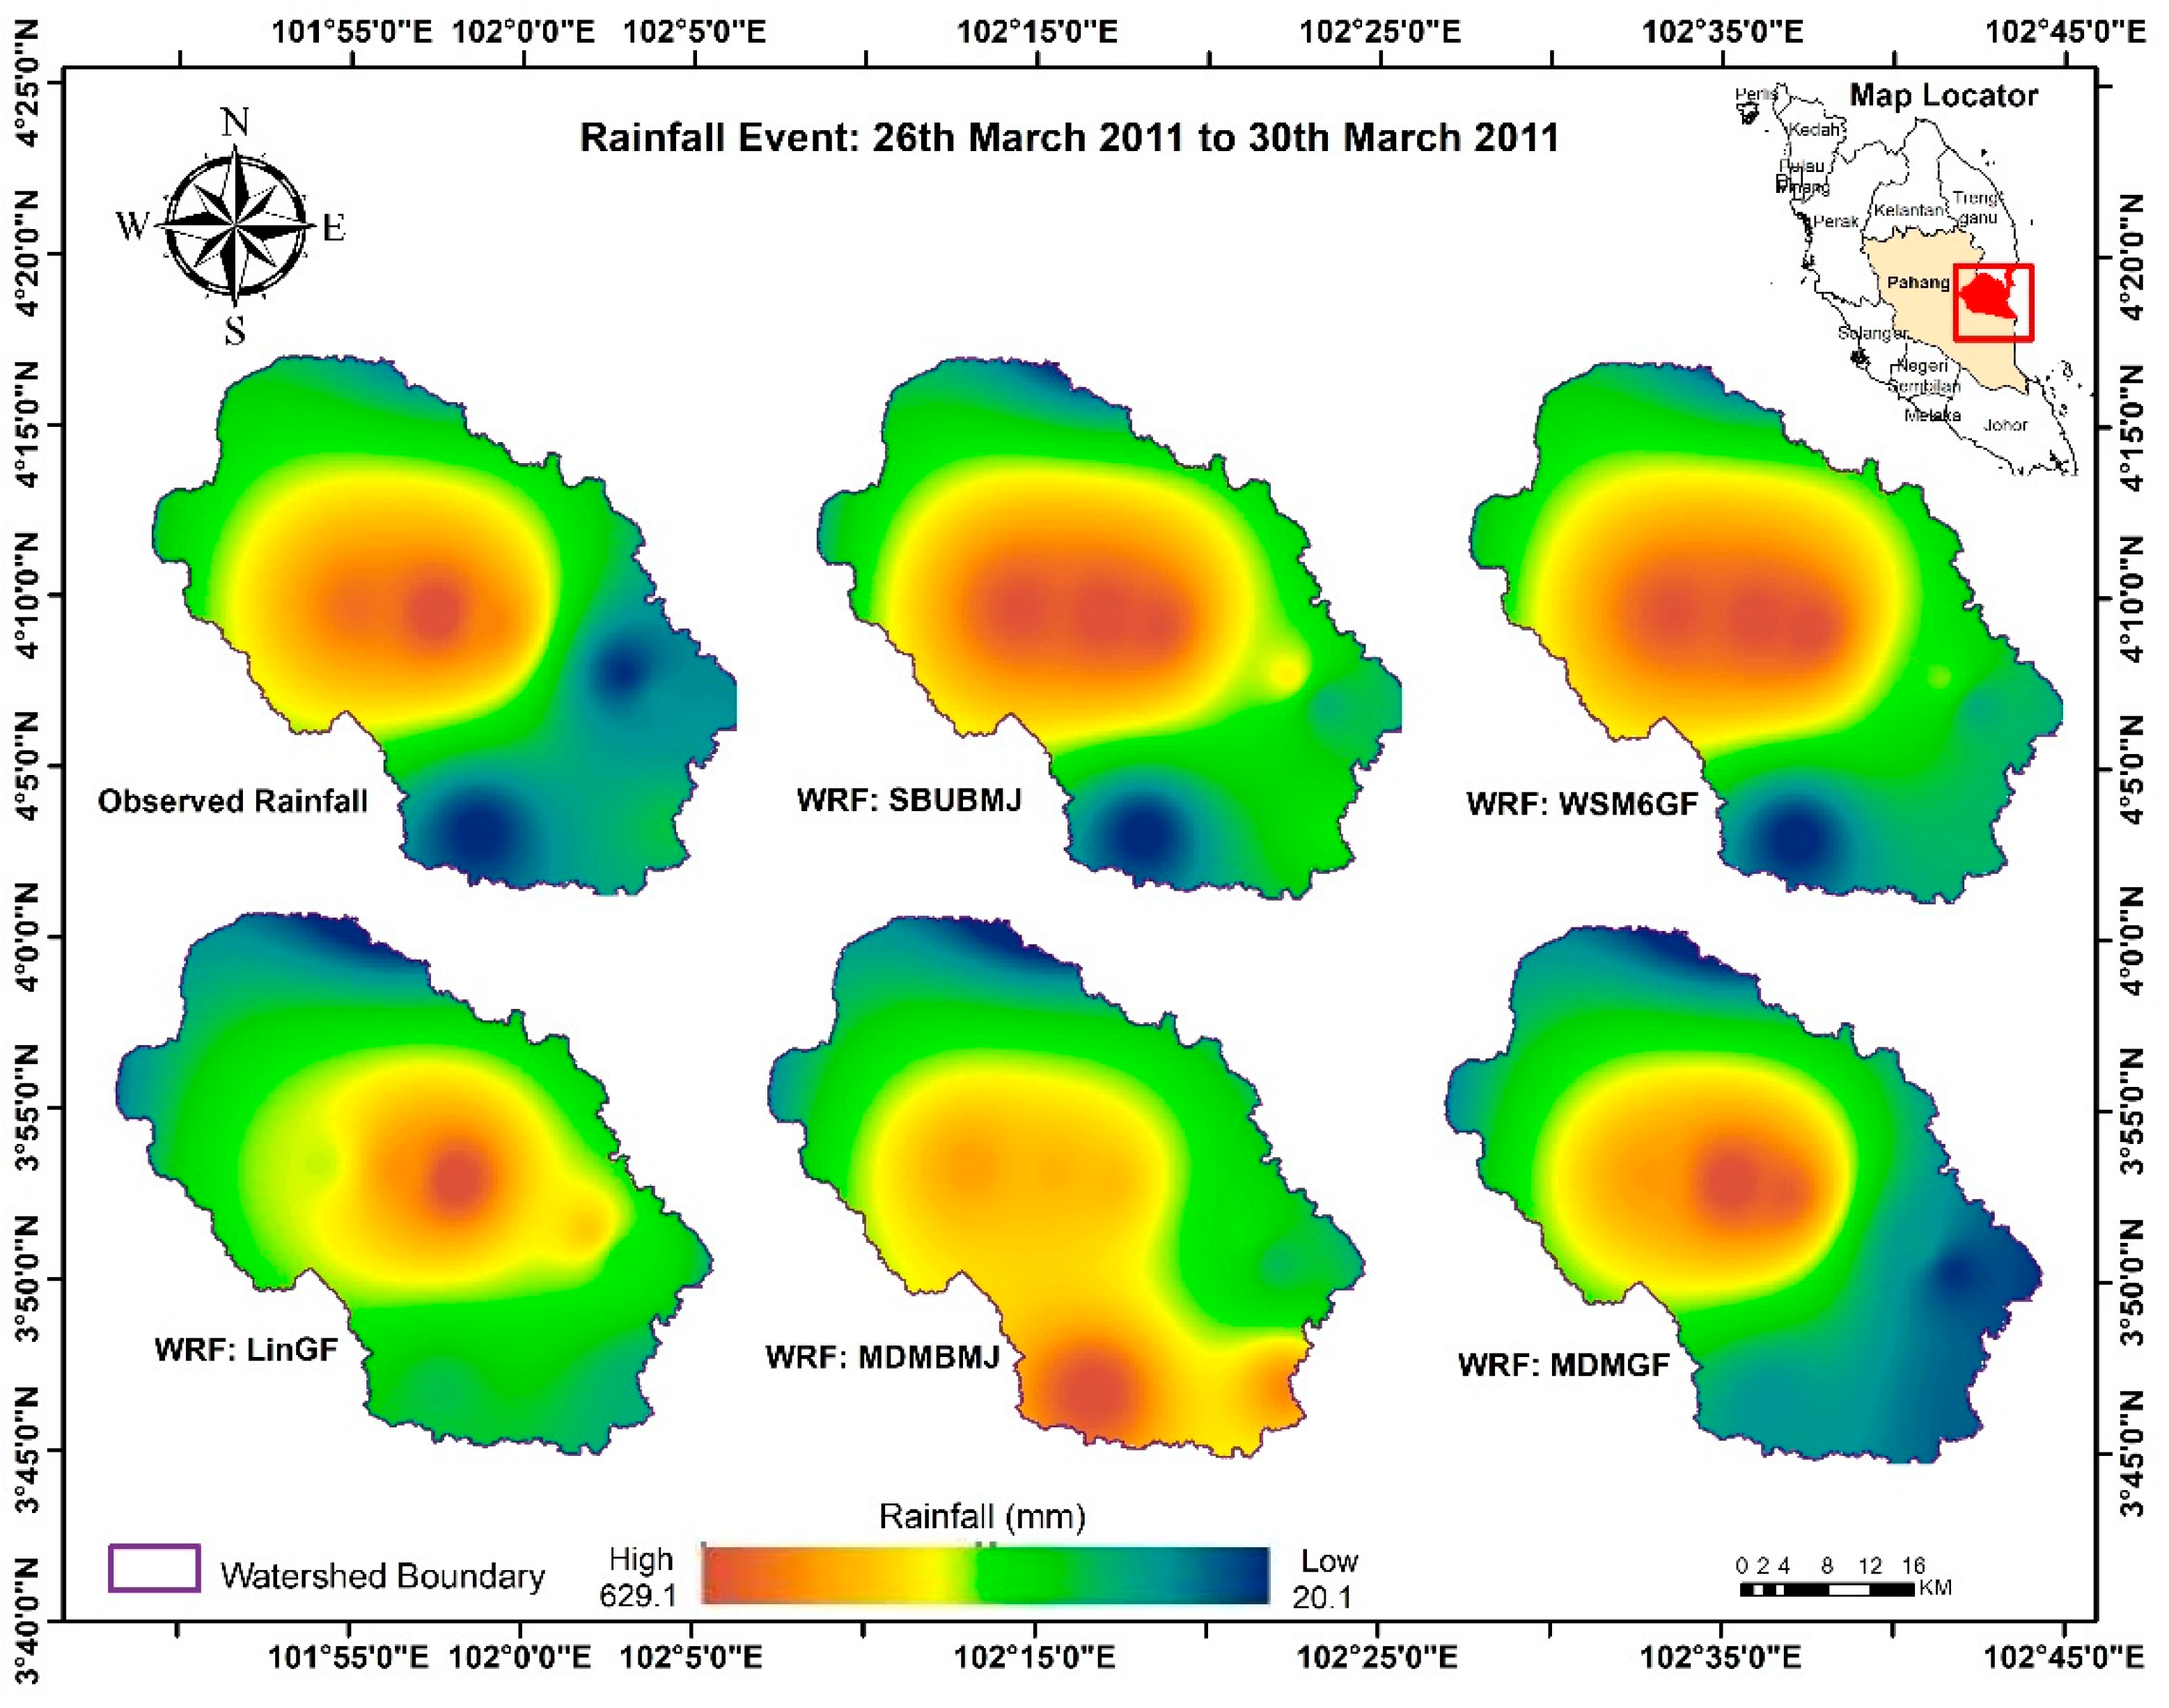
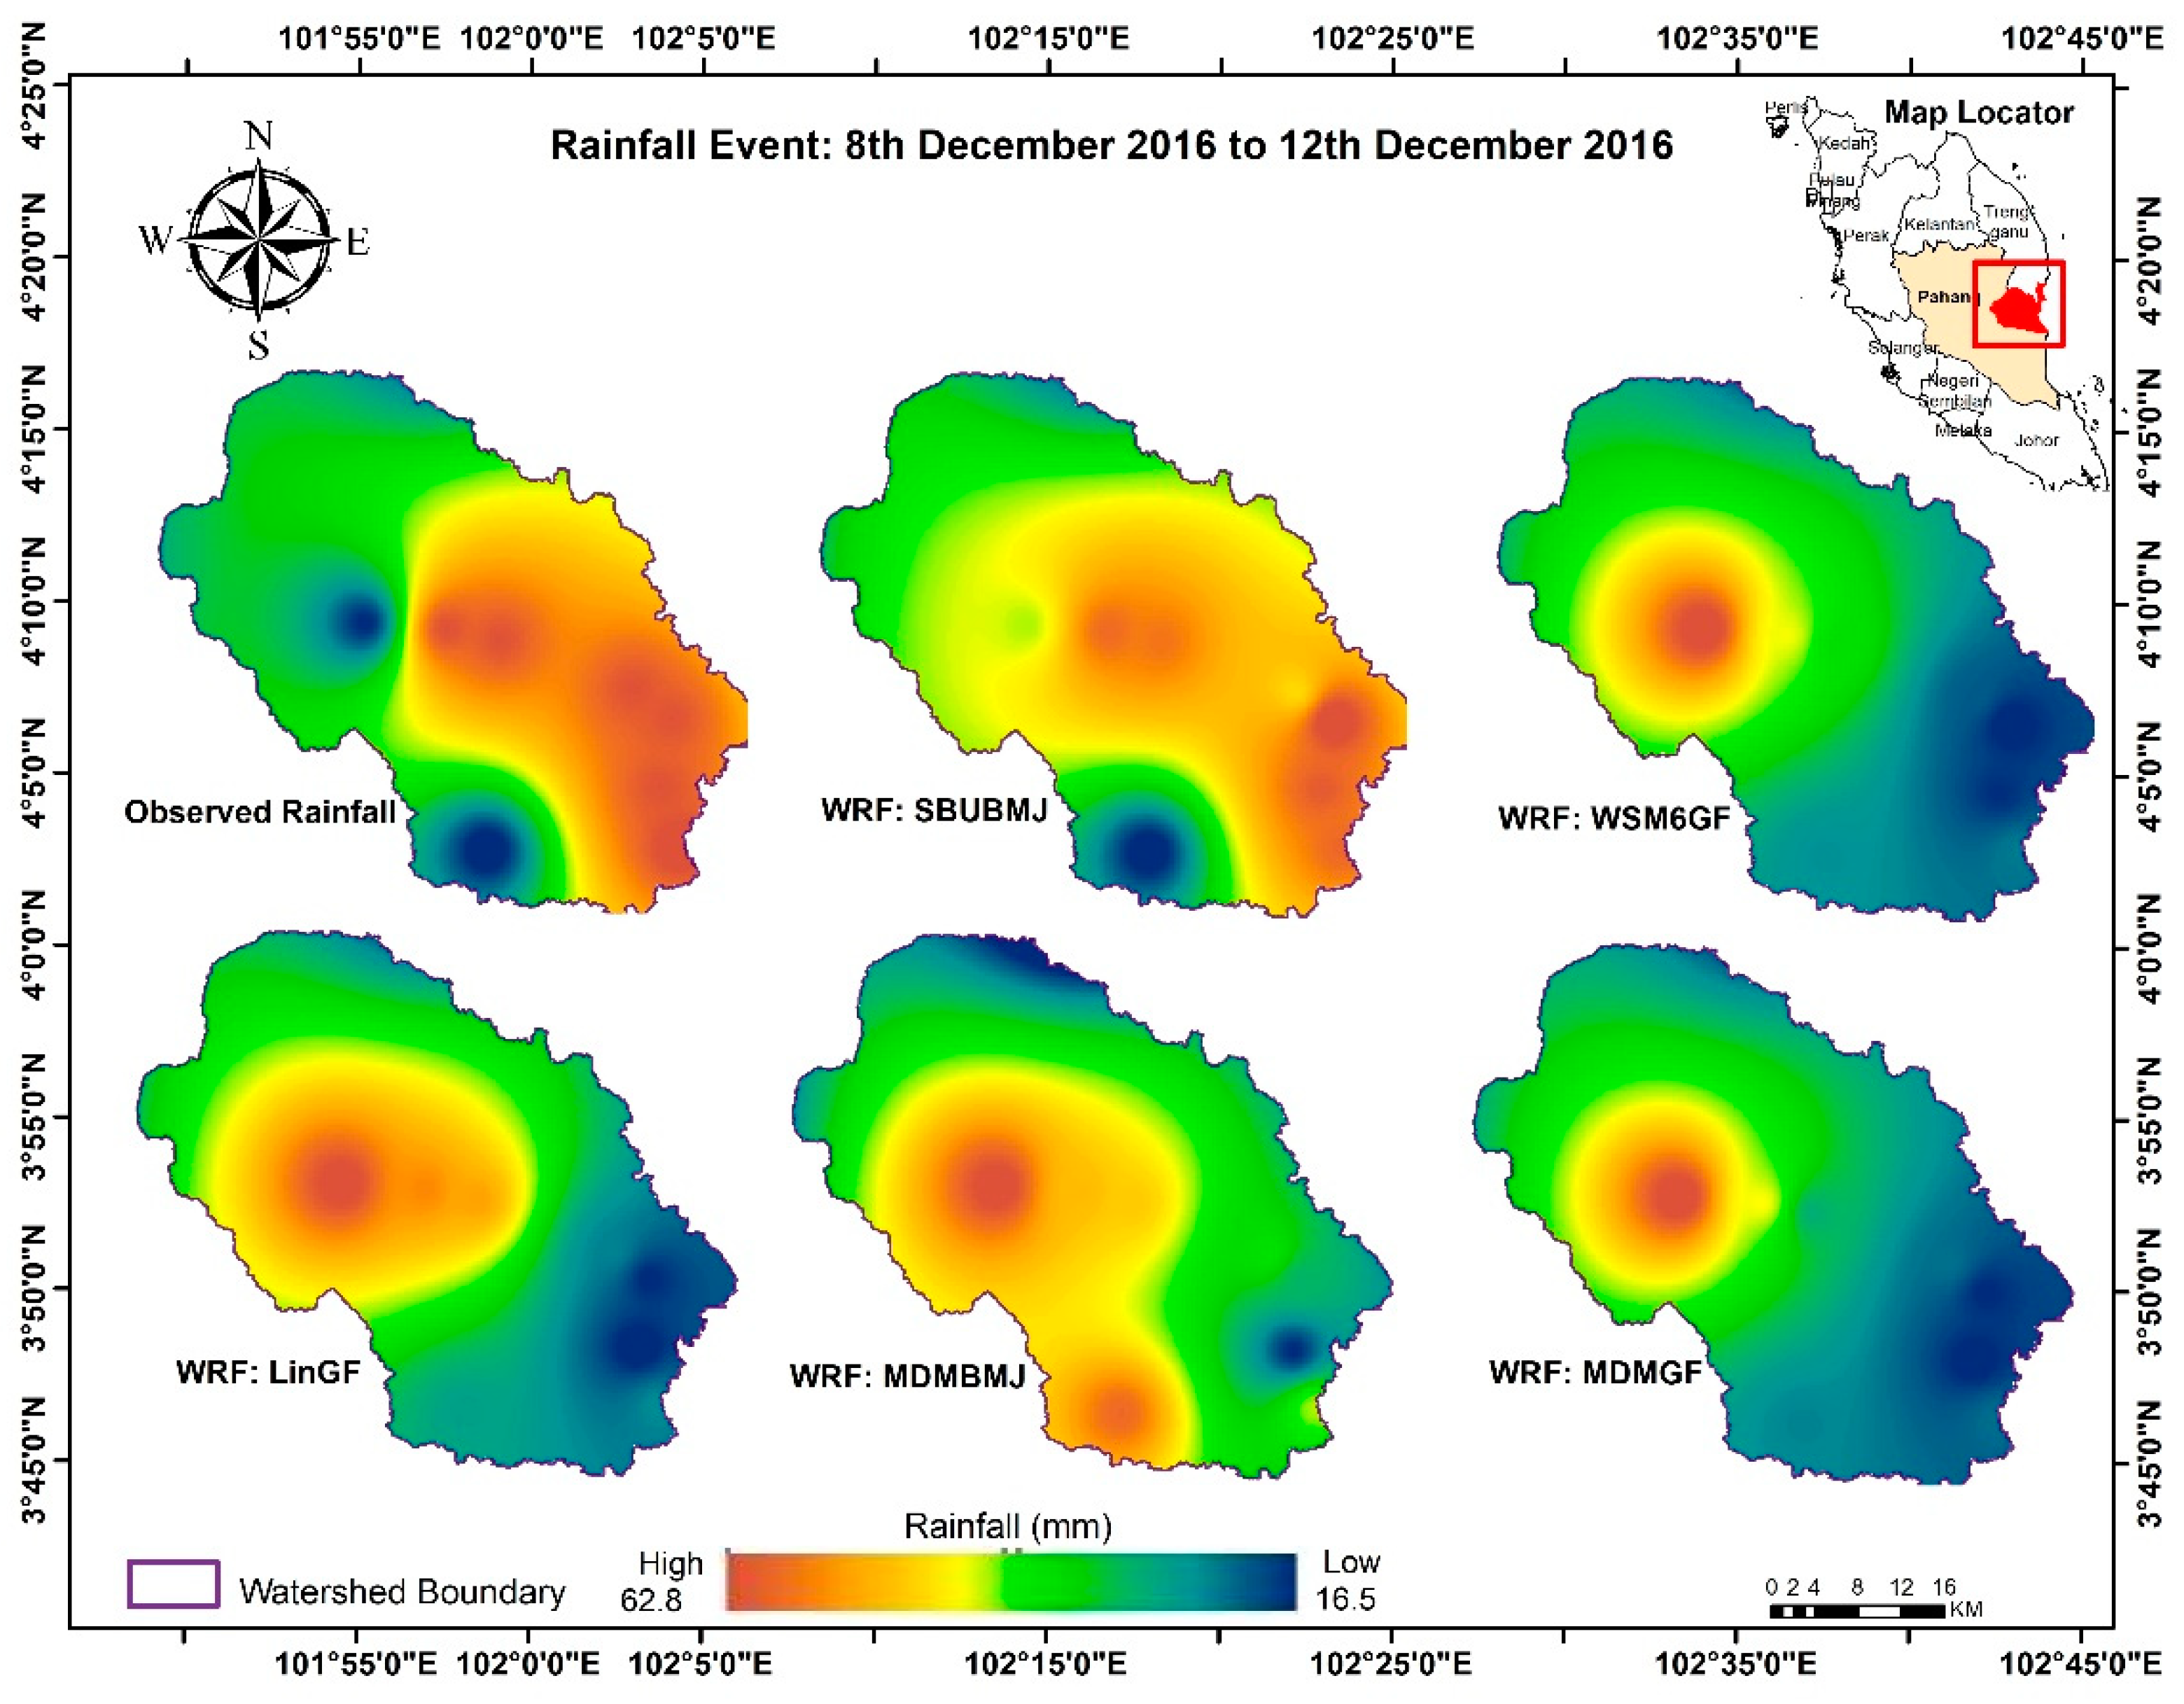
| No | Gauge Type | Station ID | Station Name | Latitude | Longitude |
|---|---|---|---|---|---|
| 1 | Rainfall | 3732021 | Kg. Sg. Soi | 3.72° | 103.29° |
| 2 | Rainfall | 3631001 | Pulau Manis | 3.65° | 103.11° |
| 3 | Rainfall | 3732020 | Paya Besar | 3.77° | 103.28° |
| 4 | Rainfall | 3930012 | PCCL Sg.Lembing | 3.91° | 103.03° |
| 5 | Rainfall | 3832015 | Rumah Pam | 3.85° | 103.25° |
| 6 | Rainfall | 3731018 | JKR.Gambang | 3.71° | 103.13° |
| 7 | Rainfall | 3931013 | Ladang Nada | 3.90° | 103.10° |
| 8 | Rainfall | 3931014 | Ladang Kuala Raman | 3.89° | 103.14° |
| 9 | Rainfall | 3833001 | JPS Negeri Pahang | 3.82° | 103.28° |
| 10 | Streamflow | 3930401 | Bukit Kenau | 3.93° | 103.06° |
| Data Required | Format | Source | Reference |
|---|---|---|---|
| Digital Elevation Model (DEM) from SRTM | 30 (m) raster/Geotiff | Online Public domain source provided by NASA | www.srtm.csi.cgiar.org (accessed on 24 March 2017) |
| Rainfall gauge data | Vector format/Attribute data | DID, Pahang/Field survey | www.water.gov.my (accessed on 19 September 2017) |
| Rainfall Event | Event End Date | Total Rainfall Depth (mm) | Event Category |
|---|---|---|---|
| 21 December 2001 | 23 December 2001 | 376.1 | Extreme |
| 29 December 2010 | 2 January 2011 | 281.0 | Heavy |
| 26 January 2011 | 30 January 2011 | 190.8 | Heavy |
| 26 March 2011 | 30 March 2011 | 58.5 | Moderate |
| 11 January 2012 | 13 January 2012 | 283.7 | Heavy |
| 1 December 2013 | 5 December 2013 | 764.3 | Extreme |
| 8 December 2016 | 12 December 2016 | 49.7 | Moderate |
| Physics Options | WRF Model Configured Scheme |
|---|---|
| Long Wave Radiation | RRTM Rapid radiative transfer model |
| Short Wave Radiation | Dhudiha Scheme MM5 short wave |
| Surface layer | Monin–Obukhov similarity theory |
| Planetary Boundary Layer | Yousei University (YSU) PBL scheme |
| S. No. | Microphysics Scheme | Cumulus Schemes | Schemes Name | Simulation Codes |
|---|---|---|---|---|
| 1 | Kessler | Kain–Fritsch | KSKF | MP1CU1 |
| 2 | Kessler | Betts–Miller–Janjic | KSBMJ | MP1CU2 |
| 3 | Kessler | Grell–Freitas | KSGF | MP1CU3 |
| 4 | Kessler | Grell 3D | KSG3D | MP1CU5 |
| 5 | Kessler | Tiedke | KSTiS | MP1CU6 |
| 6 | Kessler | Old Kain–Fritsh | KSOKF | MP1CU99 |
| 7 | Lin et al. | Kain–Fritsch | LinKF | MP2CU1 |
| 8 | Lin et al. | Betts–Miller–Janjic | LinBMJ | MP2CU2 |
| 9 | Lin et al. | Grell–Freitas | LinGF | MP2CU3 |
| 10 | Lin et al. | Grell 3D | LinG3D | MP2CU5 |
| 11 | Lin et al. | Tiedke | LinTiS | MP2CU6 |
| 12 | Lin et al. | Old Kain–Fritsh | LinOKF | MP2CU99 |
| 13 | WRF Single Moment 3 class | Kain–Fritsch | WSM3KF | MP3CU1 |
| 14 | WRF Single Moment 3 class | Betts–Miller–Janjic | WSM3BMJ | MP3CU2 |
| 15 | WRF Single Moment 3 class | Grell–Freitas | WSM3GF | MP3CU3 |
| 16 | WRF Single Moment 3 class | Grell 3D | WSM3G3D | MP3CU5 |
| 17 | WRF Single Moment 3 class | Tiedke | WSM3TiS | MP3CU6 |
| 18 | WRF Single Moment 3 class | Old Kain–Fritsh | WSM3OKF | MP3CU99 |
| 19 | WRF Single Moment 6 class | Kain–Fritsch | WSM6KF | MP6CU1 |
| 20 | WRF Single Moment 6 class | Betts–Miller–Janjic | WSM6BMJ | MP6CU2 |
| 21 | WRF Single Moment 6 class | Grell–Freitas | WSM6GF | MP6CU3 |
| 22 | WRF Single Moment 6 class | Grell 3D | WSM6G3D | MP6CU5 |
| 23 | WRF Single Moment 6 class | Tiedke | WSM6TiS | MP6CU6 |
| 24 | WRF Single Moment 6 class | Old Kain–Fritsh | WSM6OKF | MP6CU99 |
| 25 | Goddard Microphysics | Kain–Fritsch | GoMKF | MP7CU1 |
| 26 | Goddard Microphysics | Betts–Miller–Janjic | GoMMBJ | MP7CU2 |
| 27 | Goddard Microphysics | Grell–Freitas | GoMGF | MP7CU3 |
| 28 | Goddard Microphysics | Grell 3D | GoMG3D | MP7CU5 |
| 29 | Goddard Microphysics | Tiedke | GoMTiS | MP7CU6 |
| 30 | Goddard Microphysics | Old Kain–Fritsh | GoMOKF | MP7CU99 |
| 31 | New Thompson et al. | Kain–Fritsch | NThKF | MP8CU1 |
| 32 | New Thompson et al. | Betts–Miller–Janjic | NThBMJ | MP8CU2 |
| 33 | New Thompson et al. | Grell–Freitas | NThGF | MP8CU3 |
| 34 | New Thompson et al. | Grell 3D | NThG3D | MP8CU5 |
| 35 | New Thompson et al. | Tiedke | NThTis | MP8CU6 |
| 36 | New Thompson et al. | Old Kain–Fritsh | NThOKF | MP8CU99 |
| 37 | Morrison Double Moment | Kain–Fritsch | MDMKF | MP10CU1 |
| 38 | Morrison Double Moment | Betts–Miller–Janjic | MDMBMJ | MP10CU2 |
| 39 | Morrison Double Moment | Grell–Freitas | MDMGF | MP10CU3 |
| 40 | Morrison Double Moment | Grell 3D | MDMG3D | MP10CU5 |
| 41 | Morrison Double Moment | Tiedke | MDMTiS | MP10CU6 |
| 42 | Morrison Double Moment | Old Kain–Fritsh | MDMOKF | MP10CU99 |
| 43 | Stony Brook University (Y Lin) | Kain–Fritsch | SBUKF | MP13CU1 |
| 44 | Stony Brook University (Y Lin) | Betts–Miller–Janjic | SBUBMJ | MP13CU2 |
| 45 | Stony Brook University (Y Lin) | Grell–Freitas | SBUGF | MP13CU3 |
| 46 | Stony Brook University (Y Lin) | Grell 3D | SBUG3D | MP13CU5 |
| 47 | Stony Brook University (Y Lin) | Tiedke | SBUTiS | MP13CU6 |
| 48 | Stony Brook University (Y Lin) | Old Kain–Fritsh | SBUOKF | MP13CU99 |
| Description | Detail |
|---|---|
| Maximum Domain | 3 |
| Domain Extent | 100° East to 108° East, 0° North to 8° North |
| Domain Spatial Resolution | 36 km (D1), 12 km (D2), 4 km (D3) |
| Static Geographic data Resolution | 10 m, 2 m and 3 s |
| Grid Ratio | 1:3 |
| Grid Size | 27 × 33 (D1), 31 × 34 (D2) and 55 × 64 (D3) |
| Map Projection | Mercator |
| Reference Latitude | 3.76 |
| Reference Longitude | 103.22 |
| True Median Latitude | 3.76 |
| Standard Longitude | 103.22 |
| Observed | ||||
|---|---|---|---|---|
| Yes | No | |||
| Forecast | Yes | a | b | a + b |
| No | c | d | c + d | |
| a + c | b + d | n = a + b + c + d | ||
| Simulation Code | Simulation Names | Microphysics Schemes (MP) | Cumulus Schemes (CU) | Schemes Rank |
|---|---|---|---|---|
| MP13CU2 | SBUBMJ | Stony Brook University | Betts–Miller–Janjic | 1 |
| MP6CU3 | WSM6GF | WRF Single Moment 6 class | Grell–Freitas | 2 |
| MP2CU3 | LinGF | Lin et al. | Grell–Freitas | 3 |
| MP10CU2 | MDMBMJ | Morrison Double Moment | Betts–Miller–Janjic | 4 |
| MP10CU3 | MDMGF | Morrison Double Moment | Grell–Freitas | 5 |
| WRF Schemes | Ranked | Average Total Observed Rainfall Depth (mm) | Average Total WRF Rainfall Depth (mm) | PE (%) |
|---|---|---|---|---|
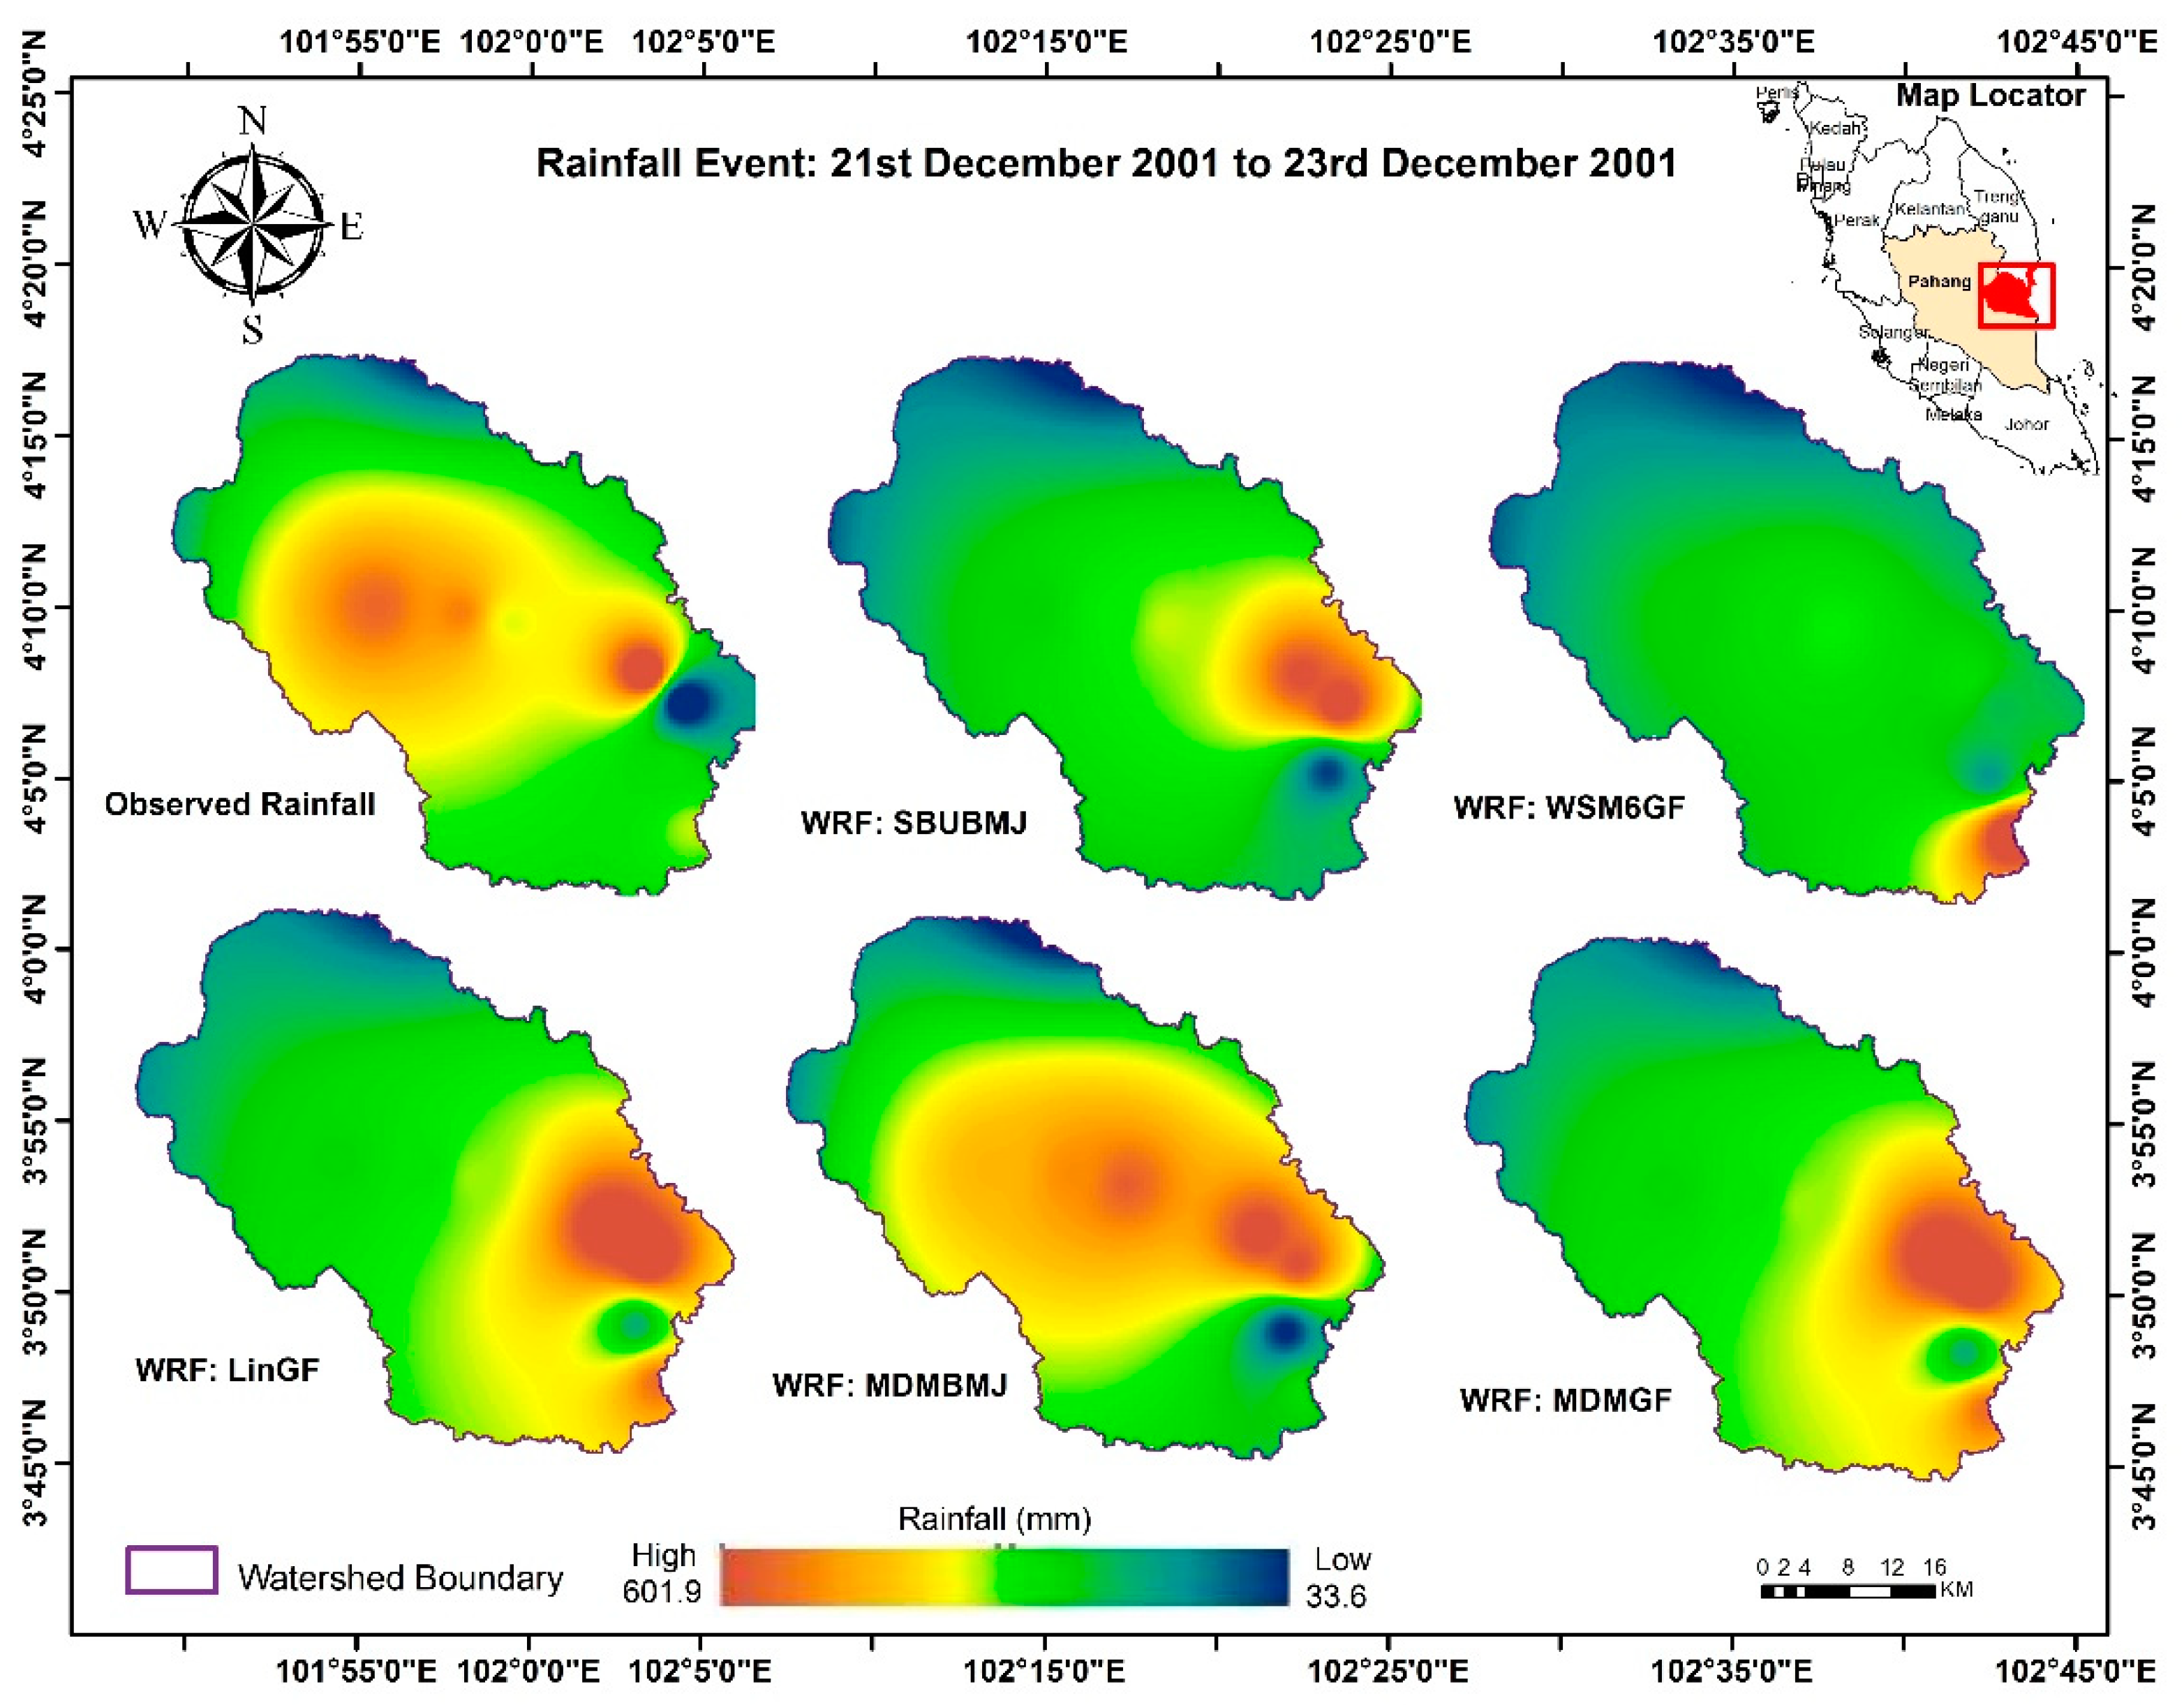
| SBUBMJ | 1 | 632.51 | 68.2 | |
| WSM6GF | 2 | 48.04 | −87.2 | |
| LinGF | 3 | 376.1 | 115.9 | −69.2 |
| MDMBMJ | 4 | 495.9 | 31.8 | |
| MDMGF | 5 | 106.4 | −71.7 |
| WRF Schemes | Ranked | Average Total Observed Rainfall Depth (mm) | Average Total WRF Rainfall Depth (mm) | PE (%) |
|---|---|---|---|---|
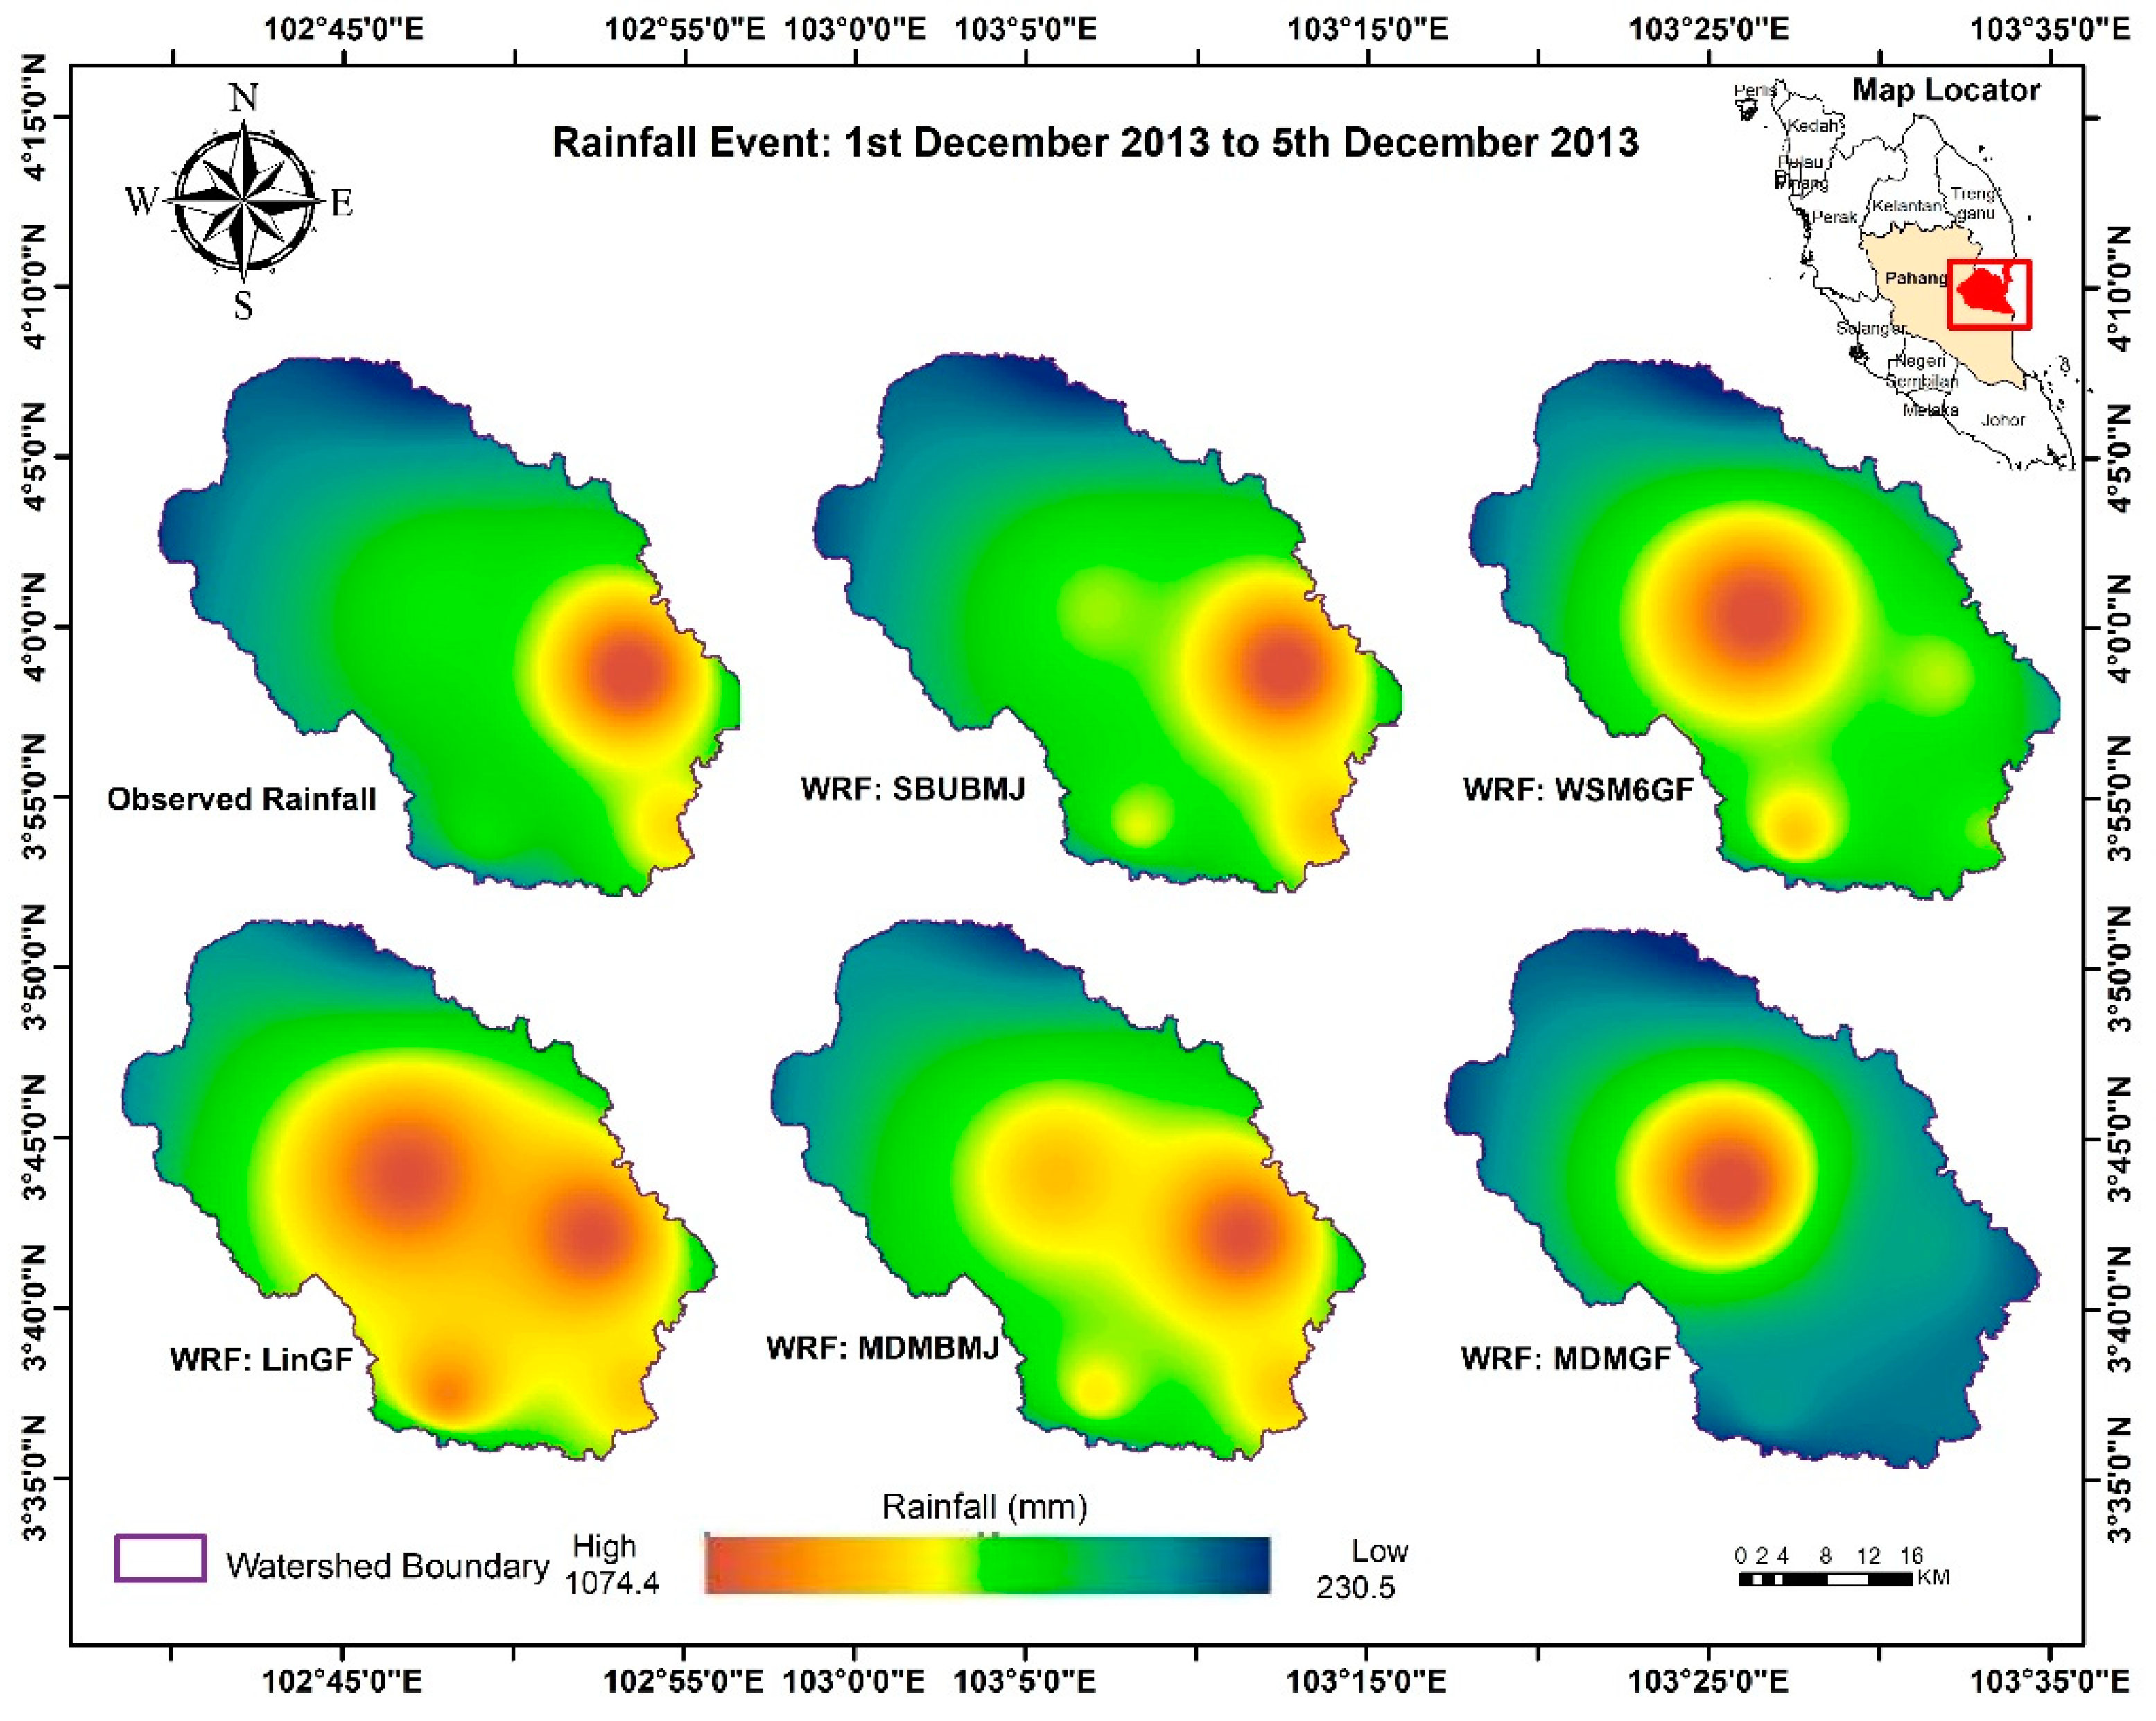
| SBUBMJ | 1 | 320.593 | −58.1 | |
| WSM6GF | 2 | 352.5 | −53.9 | |
| LinGF | 3 | 764.3 | 558.7 | −26.9 |
| MDMBMJ | 4 | 305.3 | −60.0 | |
| MDMGF | 5 | 349.6 | −54.3 |
| WRF Schemes | Ranked | Average Total Observed Rainfall Depth (mm) | Average Total WRF Rainfall Depth (mm) | PE (%) |
|---|---|---|---|---|
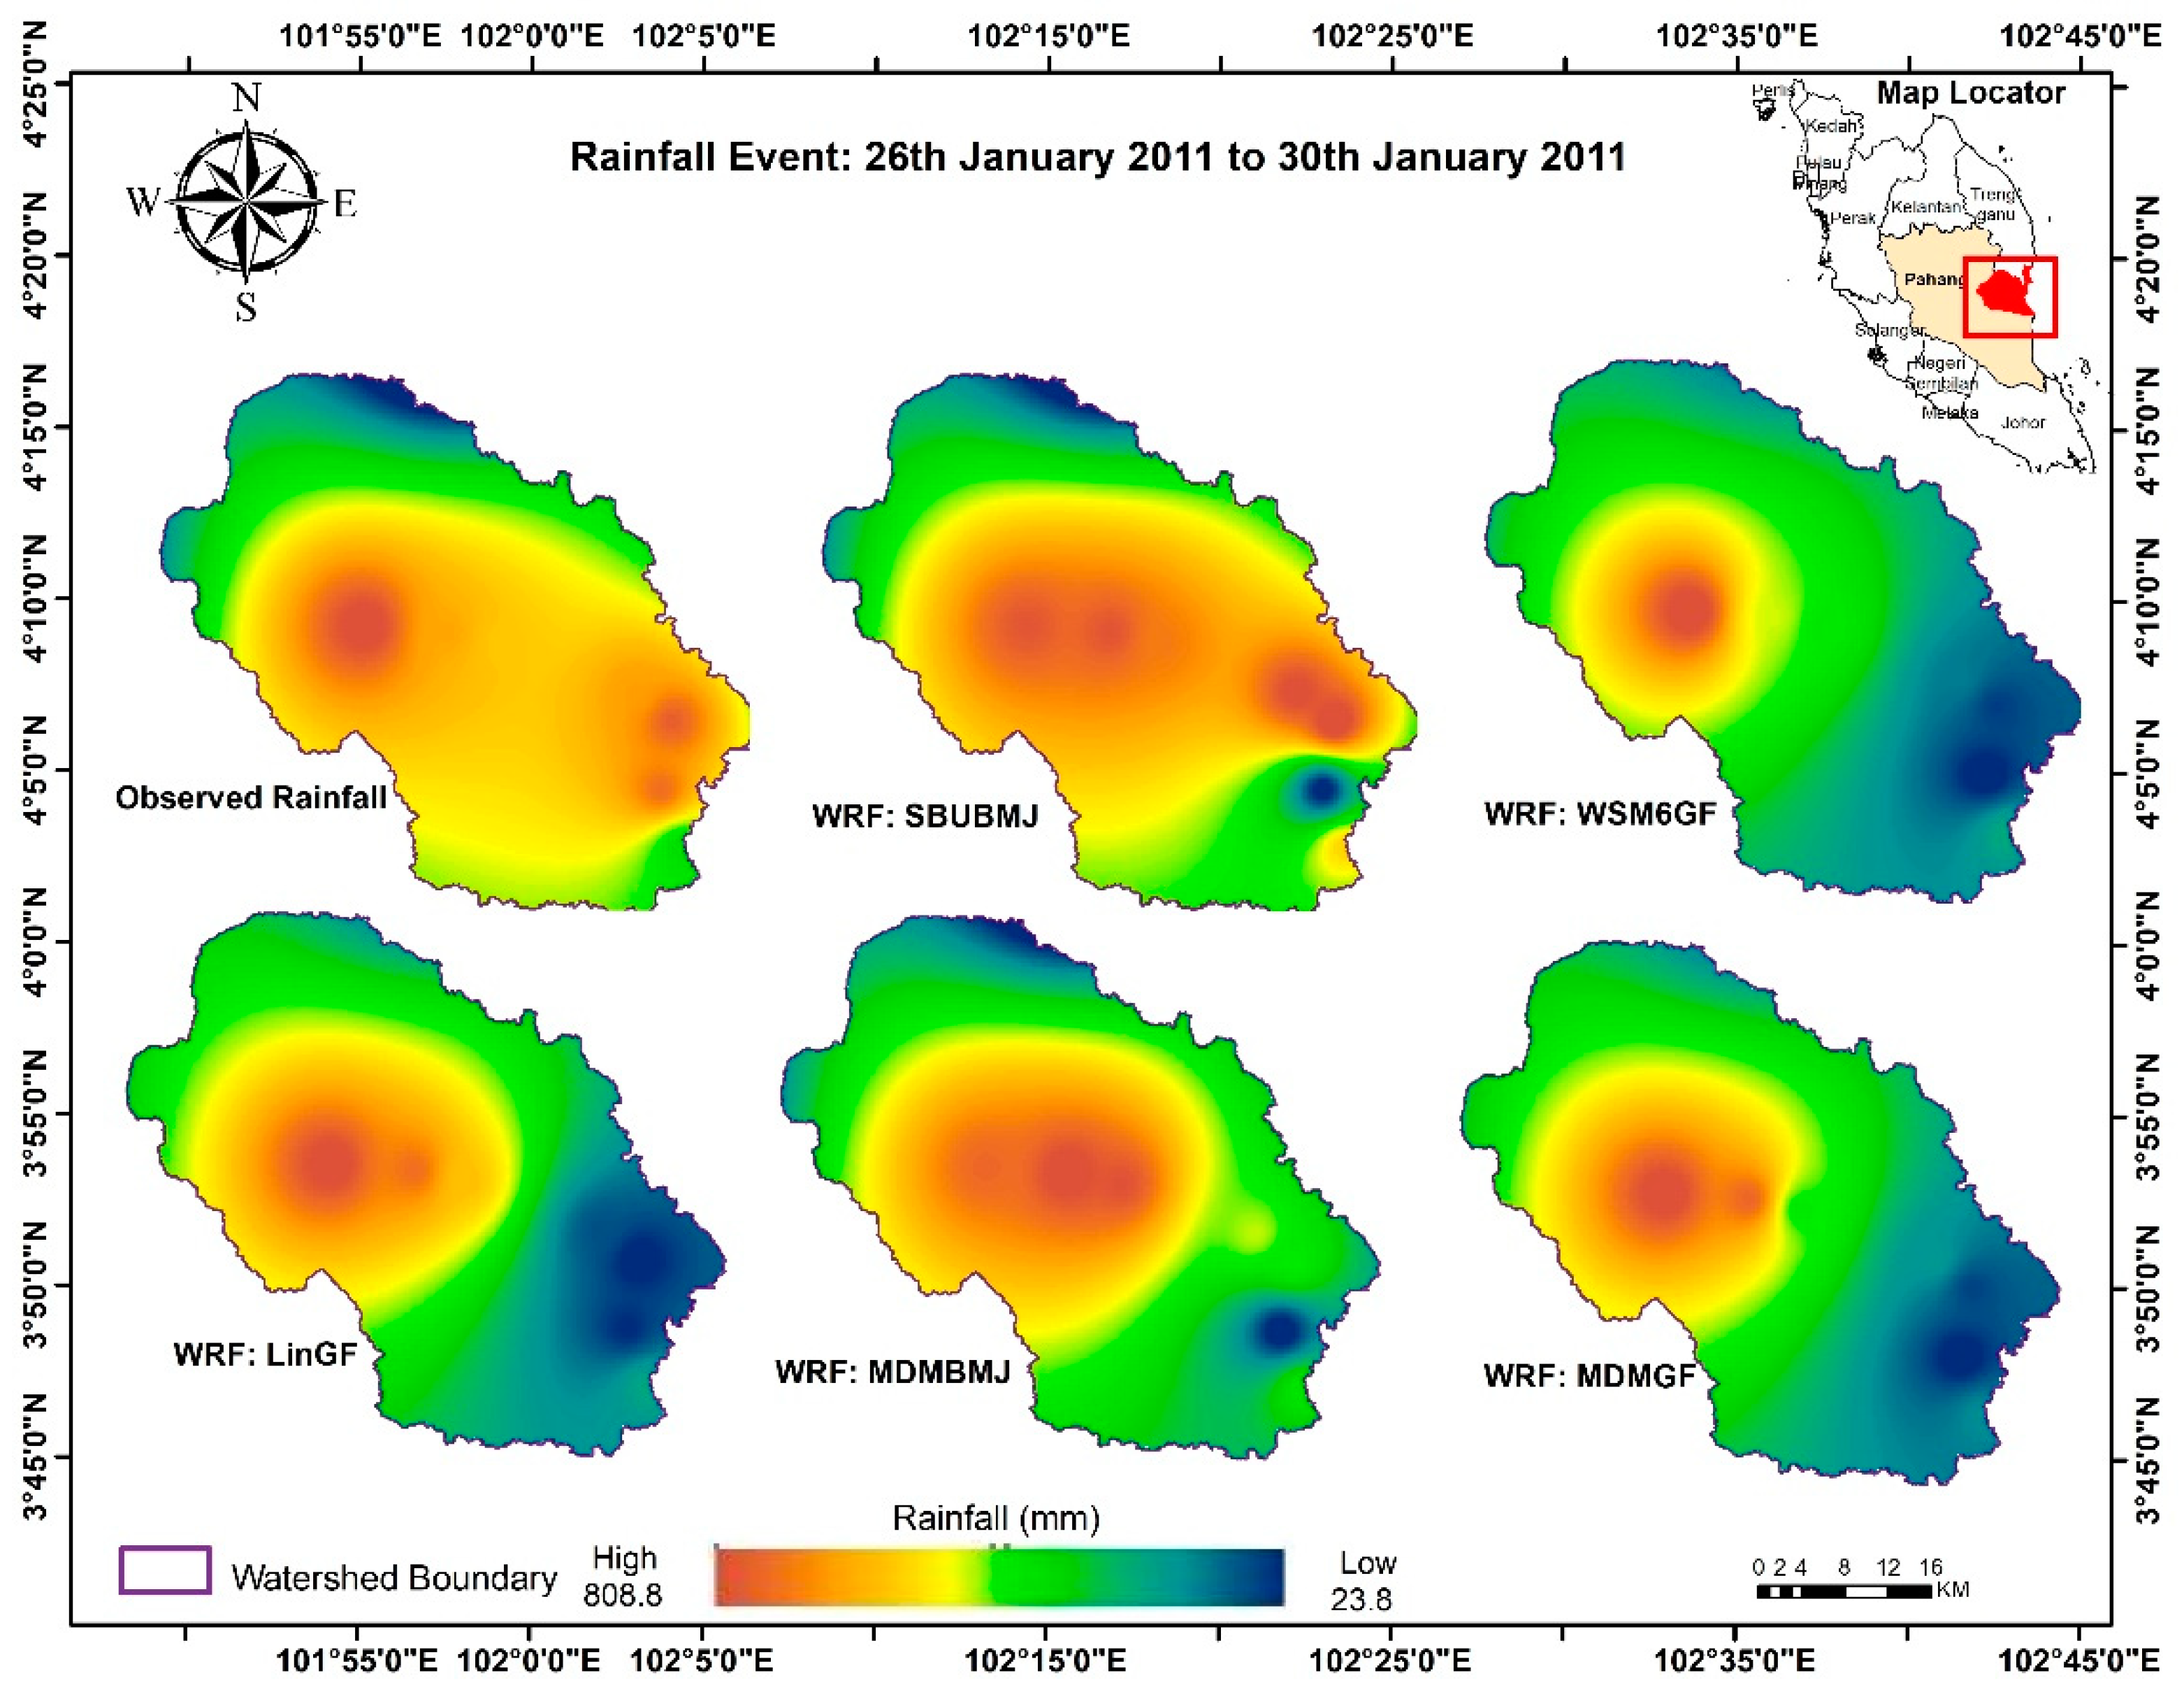
| SBUBMJ | 1 | 201.3 | −17.5 | |
| WSM6GF | 2 | 118.8 | −51.3 | |
| LinGF | 3 | 244.1 | 107.1 | −56.1 |
| MDMBMJ | 4 | 101.7 | −58.3 | |
| MDMGF | 5 | 105.0 | −57.0 |
| WRF Schemes | Ranked | Average Total Observed Rainfall Depth (mm) | Average Total WRF Rainfall Depth (mm) | PE (%) |
|---|---|---|---|---|
| SBUBMJ | 1 | 127.1 | −21.2 | |
| WSM6GF | 2 | 85.0 | −47.3 | |
| LinGF | 3 | 161.3 | 110.0 | −31.8 |
| MDMBMJ | 4 | 115.3 | −28.5 | |
| MDMGF | 5 | 113.8 | −29.4 |
| WRF Schemes | Ranked | Average Total Observed Rainfall Depth (mm) | Average Total WRF Rainfall Depth (mm) | PE (%) |
|---|---|---|---|---|
| SBUBMJ | 1 | 221.88 | −21.8 | |
| WSM6GF | 2 | 107.1 | −62.2 | |
| LinGF | 3 | 283.8 | 80.2 | −71.7 |
| MDMBMJ | 4 | 198.8 | −29.9 | |
| MDMGF | 5 | 115.6 | −59.3 |
| WRF Schemes | Ranked | Average Total Observed Rainfall Depth (mm) | Average Total WRF Rainfall Depth (mm) | PE (%) |
|---|---|---|---|---|
| SBUBMJ | 1 | 71.295 | 22.2 | |
| WSM6GF | 2 | 377.6 | 547.0 | |
| LinGF | 3 | 58.4 | 386.9 | 563.0 |
| MDMBMJ | 4 | 86.1 | 47.5 | |
| MDMGF | 5 | 387.5 | 564.0 |
| WRF Schemes | Ranked | Average Total Observed Rainfall Depth (mm) | Average Total WRF Rainfall Depth (mm) | PE (%) |
|---|---|---|---|---|
| SBUBMJ | 1 | 62.2 | 25.2 | |
| WSM6GF | 2 | 133.0 | 167.4 | |
| LinGF | 3 | 49.7 | 106.2 | 113.6 |
| MDMBMJ | 4 | 49.4 | −0.6 | |
| MDMGF | 5 | 118.9 | 139.1 |
| Region and Reference | Microphysics (MP) | Cumulus (CU) | Results |
|---|---|---|---|
| South China Sea [57] | WRF Single Moment—3 class Eta New Thompson Stony Brook University Lin Scheme | Kain–Fritsch Betts–Miller–Janjic NewSimplified Arakawa Tiedtke | Overall, the WRF model schemes combination have an acceptable parformance to predict important parameters (winds, rainfall) related to typhoon. However, the best estimated precipitation rate was identify with constantly lowest RMSE, MBE, and t values and highest CE values, 0.00025, 0.00015, 3.699,and 0.405, repectively. |
| Eastern Peninsular Malasysia (using MM5) [50] | - | Kain–Fritsch Betts–Miller Grell Anthes–Kuo | Betts–Miller performed better compared with obverserd TRMM rainfall with least RMSE (0.54, 1.2, 0.65), systematic RMSE (0.44, 1.04, 0.58), and unsystematic RMSE (0.31, 0.42, 0.30) at 06z09, 00z10, and 18z10 (6 hr interval), repectively |
| Ganges–Brahmaputra–Meghna basin (GBMB) and, Indus Basin (IB) [51] | WRF Single Moment—3 WRF Single Moment—5 WRF Single Moment—6 class Thompson Scheme | Kain–Fritsch Betts–Miller–Janjic Grell–Freitas | Combination of MPCU WSM-5-BMJ showed better consistant performance in all conditions at both regions. The approximate estimated POD, CSI, FBI, and FAR, TOPSIS-RSV were reported as 0.8, 0.6, 0.9–1.2, 0.2–0.3, and 0.7–0.8, respectively. |
| Southeast India [52] | Lin Scheme Thompson WRF Single Moment—6 class | Betts–Miller–Janjic Kain–Fritsch- Grell–Devenyi | Compared with obsereved parameters, the meso-scale convetive system including wram temperature, refelectvity, and rainfall pattern are well simulated by WRF schemes MP Thompson, CU Betts–Miller–Janjic, and Mellor–Yamada–Janjic PB layer with less RMSE (2.32, 1.01) and Bias (5.42, 1.04) and high correlation (0.74 T2m, 0.19 h2m, and ws10m), respectively. |
| Chennai Southeast India [55] | Morrison double moment scheme Lin scheme WRF Single Moment—3 Class and 6 Class New Thompson scheme | Morrison Double Moment (MDM) schemes tend to perform better in simulating heavy rainfall events with estimated less RMSE 13.86, MAE, 11.03, and Bias 8.235. |
Publisher’s Note: MDPI stays neutral with regard to jurisdictional claims in published maps and institutional affiliations. |
© 2022 by the authors. Licensee MDPI, Basel, Switzerland. This article is an open access article distributed under the terms and conditions of the Creative Commons Attribution (CC BY) license (https://creativecommons.org/licenses/by/4.0/).
Share and Cite
Zaidi, S.M.; Gisen, J.I.A.; Eltahan, M.; Yu, Q.; Misbari, S.; Ngien, S.K. Assessment of Weather Research and Forecasting (WRF) Physical Schemes Parameterization to Predict Moderate to Extreme Rainfall in Poorly Gauged Basin. Sustainability 2022, 14, 12624. https://doi.org/10.3390/su141912624
Zaidi SM, Gisen JIA, Eltahan M, Yu Q, Misbari S, Ngien SK. Assessment of Weather Research and Forecasting (WRF) Physical Schemes Parameterization to Predict Moderate to Extreme Rainfall in Poorly Gauged Basin. Sustainability. 2022; 14(19):12624. https://doi.org/10.3390/su141912624
Chicago/Turabian StyleZaidi, Syeda Maria, Jacqueline Isabella Anak Gisen, Mohamed Eltahan, Qian Yu, Syarifuddin Misbari, and Su Kong Ngien. 2022. "Assessment of Weather Research and Forecasting (WRF) Physical Schemes Parameterization to Predict Moderate to Extreme Rainfall in Poorly Gauged Basin" Sustainability 14, no. 19: 12624. https://doi.org/10.3390/su141912624
APA StyleZaidi, S. M., Gisen, J. I. A., Eltahan, M., Yu, Q., Misbari, S., & Ngien, S. K. (2022). Assessment of Weather Research and Forecasting (WRF) Physical Schemes Parameterization to Predict Moderate to Extreme Rainfall in Poorly Gauged Basin. Sustainability, 14(19), 12624. https://doi.org/10.3390/su141912624


