Abstract
Since the COVID-19 pandemic, working from home has become normalised and is likely to continue to gather pace. The adjustment in daytime population that this creates has implications for urban planning, as it can drive greater levels of localization and less car-dependent cities. In this paper, we describe how this shift changes urban daytime population density, a significant predictor of most measures of amenity, walkability, and liveability. First, we define a method for mapping access to amenity, applied to two cities: Melbourne and Sydney. Secondly, we analyse the two-way causal relationship between population density and amenity based on bivariate spatial mapping. Thirdly, we provide a method for estimating changes in daytime populations. Finally, the article provides a taxonomy of telework regeneration potential for different parts of the city based on the level of amenity and expected changes in daytime population (average changes in high job-density areas −14%, CBDs −30%, and +54% in residential areas). We argue that, if used as a catalyst within strategic planning, and for urban regeneration, increases could create higher levels of amenity in suburban areas, which can lead to improved sustainability outcomes, specifically greater levels of walkability, liveability, and reduced car dependence. We have calculated that opportunity areas account for 89% of the greater urban area and cover 49% of the population, which may well grow as the WFH trend continues. As such, and in conclusion, we outline a set of site-specific opportunities and challenges relevant to urban planners that aim for urban regeneration.
1. Introduction
This article investigates the impact of working from home (WFH) practices on population densities and the implications of this change for the viability of amenity-rich areas, as well as the opportunities for suburban vitalisation due to the redistribution of daytime urban populations. The link to the urban agenda, and particularly the quantitative illustration of the potential change WFH can have for strategic urban planners, and ultimately for cities, is the critical aspect herein, and also the point of departure from other research projects exploring the work from home phenomenon. We use the term amenity here to refer to the set of local services and attractors. It was chosen as the terminological frame due to its use in planning disciplines and land-use legislation, as well as it being typically, and deliberately, poorly defined in planning ordinances. As such it is framework agnostic, allowing us to draw from a wide set of urban mapping methodologies to illustrate our argument.
As we will show, in the context of two large Australian cities, Sydney and Melbourne, population density is a significant indicator of access to services and amenity. If we follow this causal relationship then, as workers telecommute in greater numbers, this can lead to benefits in some areas and negative consequences in others, which in turn can lead to further redistribution of population. From our analysis we found that, averaged across both cities, the proportion of work that will continue to be done from home to be 26.9%, which translates to between 450,000–400,000 people, for each greater city, who will continue working from home if replicated at this scale. The effect of this will be to reduce the daytime population in postcodes of high job density from 15–30%, dependent on job and occupation density, with these reductions repopulated into residential areas, increasing their daytime populations by a minimum of 5–15% up to 50%. This adjustment in daytime population densities would, if planned for, be the catalyst for higher levels of localization and walkability, which all car-dependent cities are currently tacking.
1.1. The Density-Dilemma of Australian Cities
In Australian cities, once outside of the CBD and inner urban environs, housing densities in the suburbs are typically 10–20 dwellings per hectare with the vast majority of these being fully detached on 500–800 m2 allotments. By comparison, major English and Irish cities have population densities typically in the ranges of 4–5000 persons/km2 (Greater London at 1572 km2 and 5700 persons/km2, Manchester at 115 km2 and 4783 persons/km2, Dublin 117.8 km2 and 4610 persons/km2), greater Melbourne has an area of 9992 km2 and a population density of 508 persons/km2. Even car-dependent US cities such as Miami (2556 persons/km2), Detroit (1882 persons/km2), and the poster child for US car-dependent cities, Houston (1389 persons/km2), pale in comparison to Australian urban densities and scale of sprawl. These population densities, particularly in Australian suburbs, are generally too low to warrant clusters of economical or socially viable destinations; with Newman and Kenworthy setting the required density at 35 dwellings per hectare [1] and various government agencies aiming for a politically modest increase to 25 dwellings per hectare [2,3].
The impact of low densities has, for this argument, contributed strongly to two key outcomes. Firstly, reinforcing the dominance of the private car as a means of transport [4] and secondly creating a wider distribution, and lower concentration, of service destinations due to the greater catchment area required for business viability [1]. This is compounded by the high levels of planning and land-use regulation [5] and the primacy of residentially zoned land, which is largely a product of high levels of exclusionary zoning and car-reliant planning [6]. All of which makes the various policy attempts to achieve reduced car dependence and foster localised walkable communities (such as Melbourne’s 20 min Neighbourhoods policy, DELWP 2017) impossible to implement. Importantly, non-residential land, as potential new destinations in these areas, is largely non-existent. Therefore, without increasing population densities and recalibrating the land-use mix, attempts at increasing local amenity as a driver for reduced car dependence will largely continue to fail.
1.2. The Rise and Rise of Telework
Teleworking relates to “work-related substitution of telecommunications and related information technologies for travel” [7] (p. 301). This may mean working from home or working remotely in a different location to the usual workplace. The hybrid work model “combines a mix of working from home/remotely at least 25% of the time, with working from a traditional workplace such as an office” [8] (p. 3). In Australia, the rise in popularity of working from home practices (including telework, hybrid work and/or remote work), which is most recently brought about by COVID-19 lockdown policies, has seen a fundamental shift in daytime populations.
Work from home orders issued during the COVID-19 pandemic saw teleworking in Australia increase from 5% of the working population [9] to 41% two months after the end of lock-down [10], representing roughly 5 million of the 13-million workforce. The implications of this change in working patterns are likely to reconfigure many sectors of the urban landscape, including housing location, housing type, services location, and the viability of businesses, as demand is, at least partially, redistributed away from Central Business Districts and into the suburbs and regional areas [11,12]. It has long been argued that the propensity to telework (especially WFH) has the potential to reduce traffic congestion, air pollution and associated energy production, even if recognised it may also in some circumstances lead to increasing urban sprawl [13]. It is also notable that this change in working patterns is not expected to return to pre-COVID-19 conditions [14,15].
1.3. Research Premise and Question
With greater prevalence of WFH practice, the question arises as to how the redistribution of daytime populations (typically away from CBD to suburban and rural areas) may shape (sub)urban form going forward. As such, this paper and its analysis is based on one premise and two research questions. The premise is:
Premise: There is a two-way causal link between access to amenity and population density in most cities.
This premise is based on a large body of literature, as well as the exploration of these dimensions in the context of our two case study sites. Specifically, our analysis illustrates the strong correlation of a comprehensively constructed amenity index, with population density, at the very least in the two case study sites, and as per our definition of amenity.
Furthermore, with the background of COVID-19 and its impact on the prevalence and normalisation of WFH practices, this leads to the following questions:
Research question 1: How will the rise of working from home practices change urban daytime population densities?
Research question 2: What are the opportunities and risks for urban regeneration arising from a change in daytime population?
The way that the RQs are explored in this paper is based on a novel spatial analysis methodology applied in two cities (Melbourne and Sydney, Australia) exploring amenity, population density and changes in daytime populations due to increased adoption of WFH practices. Through this analysis and the resulting synthesis, our key knowledge contribution is fourfold:
- Development of a straightforward composite amenity index that can be applied across different Australian cities.
- An exploration of the two-way causal link between urban density and amenity features.
- A spatial analysis methodology for estimating changes in daytime populations, applied to two case studies, i.e., Sydney and Melbourne.
- A taxonomy of four types of areas in the city, based on evaluation of the levels of amenity, and projected daytime population changes.
The paper follows these steps, and therefore diverges from a more traditional scientific article structure. Firstly, we map urban amenity for the two cities. Secondly, the link between urban density and amenity is explored. Thirdly, a spatial analysis describing the likely changes in population densities is shown, and fourthly, a taxonomy of four types of WFH urban regeneration potential is described.
2. Two-Way Causal Link between Urban Density and Access to Amenity
Higher population density leads to greater levels of employment and salaries [16], is correlated with urban vitality [17], has been associated with beneficial health outcomes [18], has been linked with higher walkability [19], and has been correlated with social capital [20]. All these correlations, and associations may appear spurious without a better understanding of a clear causal link, and such a causal link likely exists within the realm of economics. Exploring such a link, Rappaport [21] explores the two-way relationship between amenity and population density. Specifically, Rappaport [21] notes the strong causal link between consumption of amenities, and population density; and how this increased demand for amenities also leads to more amenity being provided. It also notes that there is a strong causal link also going in the reverse direction, meaning that when higher levels of amenity are provided this creates a higher quality of life, which also creates an increase population density. This rings true to our experience, because we have found that across many datasets, population density is always a close correlate of amenity. This leads us to state the key premise in our paper (see previous section).
Noting this causal effect, the link between amenity and population density is context dependent and subject to some level of complexity. For example, in their study of Vancouver, Martino et al. [22] suggested that, due to a mix of agglomeration functions and as a way to remove local and socio-demographic subjectivities of liveability, that density was the dominant factor up to roughly 3000 p/km2, after which overcrowding and cost of living started to create negative health, economic and equity outcomes.
2.1. Mapping Amenity
To illustrate the two-way causal link between urban density and urban amenity in the context of Melbourne and Sydney, we define a method for mapping amenity across a city. By defining an amenity index, we can explore the extent by which population density as a predictor of urban amenity in these two cities, which is then further utilised to illustrate the plausible effects of telework on amenity.
Methodologies for mapping urban geographies tend to align with expected funded research outcomes; with research funding often aligning to terminological trends within the research governance agenda. Examples include the changing emphasis on urban planning as relates to liveability [23], walkability [24], compact cities [25], just cities [26], healthy cities [27], green cities [28], and resilient cities [29], all of which, when used as frameworks for mapping the urban environment, deliver variables and weightings that speak to the mapping framework being utilised. Therefore, we cannot expect any single mapping system to illustrate all dimensions of a city’s functionality. However, even when we work within a given framework there is significant methodological and contextual divergence.
Taking liveability as an example. The aim of liveability analysis is to capture the objective conditions that lead to social, economic, physical and environmental well-being of the community [30]. Questioning the notions of objectivity however, many studies have shown the subjective aspect of liveability analysis, e.g., [31] which, when combined with the complexity of defining what exactly a ‘community’ entails [32], makes analysis of liveability overtly complex and ultimately flawed. Similar criticisms exist for walkabiltiy analysis, with Manaugh and El-Geneidy [33] stating that walkability is not the same for all socio-demographic or cultural groups and is inherently biased by research methodology. Furthermore, Ahmed et al. [34], Ghasemi et al. [30] and Bérenger and Verdier-Chouchane [35] note that livability comparisons between city, subregion and population group make it a difficult, if not impossible, concept to quantify, with Martino et al. [22] suggesting that residential density is the simplest method to show liveability, as it cuts though these subjectivities.
However, while acknowledging the criticisms, when developing an argument based on density and its impact, a methodology is required. To this end we have created a composite index of urban amenity across highly referenced mapping systems that speak variously to liveability, walkability and amenity. As mentioned, the term amenity was specifically chosen as, unlike walkability and liveability, it is universally used by planners and planning legislation, and is also far more loosely defined, allowing us to incorporate a wide range of popular variables into its creation.
Table 1 illustrates the most dominant variables across a range of highly referenced systems. Due to variance in terminology, the outcomes are clustered into the most commonly occurring terms (e.g., ‘commercial services’ for number of shops and so forth and ‘public services’ for schools, etc.). Additional variables, through regularly considered, were less common, particularly traffic analysis, design and bike/pedestrian infrastructure.

Table 1.
Frameworks for mapping urban functionality.
Using the outcomes from this review, and as a simple exercise to replicate the work of others locally to test the WFH hypothesis, and provide a measure of amenity broadly consistent with what’s available in literature (not primarily to create a new methodology) we define an urban amenity index, which is a composite index based on measures of features of interest, land-use mixture, as well as bicycle and road networks, to jointly indicate liveability, walkability and amenity. The mapping approach is described in Appendix A.
The result of the mapping of amenity in the two cities shows a trend of higher levels of the amenity index closer to the CBD of both Melbourne and Sydney. In the case of Sydney (Figure 1), the distribution of higher amenity is concentrated along a line directly west from the beach suburb of Bondi and following the trainline to Paramatta, the second CBD. A marginally lower level of amenity radiates from the CBD to the Northwest, Southeast and Southwest. The northern beaches of Manley and Newport also show high levels. In the case of Melbourne there are similar patterns (Figure 2), with the CBD and the beachside suburb of St Kilda showing the highest levels of amenity. The inner east and inner north suburbs have high levels of amenity and, as with Sydney, amenity levels radiated along train routes, markedly along the Northwest arc from Melbourne to Footscray, as well as along the eastern line to Ringwood and the Southeast line to Frankston.
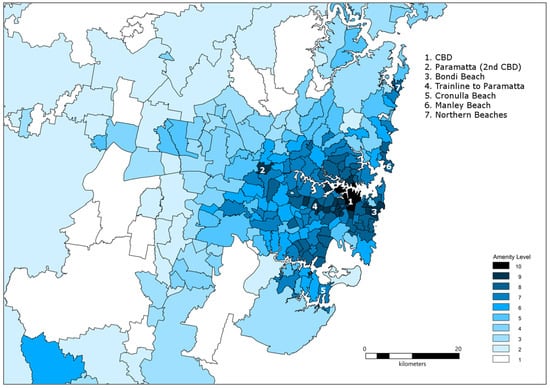
Figure 1.
Sydney amenity levels 1 to 10.
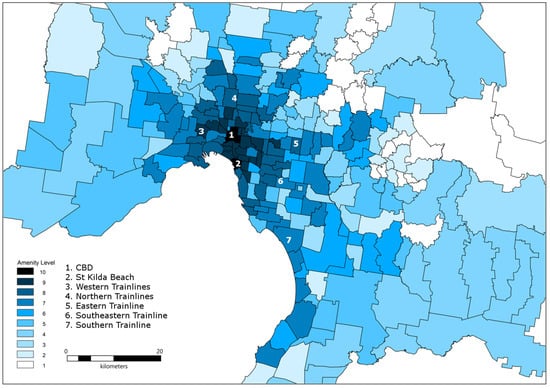
Figure 2.
Melbourne amenity levels 1 to 10.
Consistent with the premise of a two-way causation between population density and access to amenity, population density is the most strongly correlated with our amenity index (correlation = 0.84–0.85), as shown in Table 2. After population density, the most strongly correlated variables are access to schools (a function of population), religious institutions (a function of older, less car-dependent, urban development), and access to recreational space (a function of planning for populations).

Table 2.
Correlations between amenity and related variables for Sydney and Melbourne. Codes are explained below.
Comparing these correlations between Melbourne and Sydney, there is a difference in the correlation between amenity and access to bike-paths and access to park area. This can be explained by variable transit policies and access to available space in the CBDs; and/or variations in the coding of the various state datasets. Differences in the way that objects are coded may also explain the variation in administration, care, community and sporting centres, all of which are open to interpretation, but which, cumulatively, still provide destinations, thus their ongoing inclusion in the set.
Figure 3 and Figure 4 illustrate the variables that showed moderate to high correlation with amenity, plus, to illustrate the distinction between the cities, two variables that differed greatly (Cycleways and parks). We can see that population density maps closely to amenity scores.
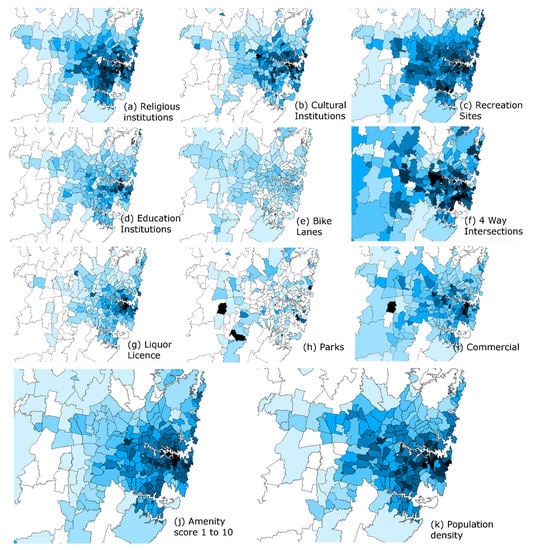
Figure 3.
Selection of indicators plus full amenity and population density, Sydney These maps use a ‘natural break’ methodology to define the categorical spread. As such it delivers a far more fluid outcome, in terms of colour gradients.
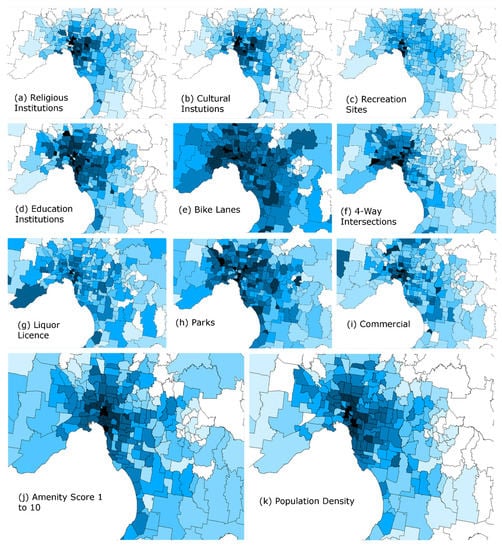
Figure 4.
Selection of indicators plus full amenity and population density, Melbourne.
2.2. Bivariate Analysis of Amenity Versus Population Density
To further analyse the premise that amenity and population density are causally linked, we undertake bivariate mapping. This is done by using a High-Low dichotomy for the two variables Population Density and Amenity. This dichotomy is defined based on below and above average levels. Using this dichotomy allows us to produce a two-by-two matrix of: high-population and high-amenity; high-population and low amenity; low population and high amenity; low population and low amenity. For population density to be a clear indicator of amenity, we would expect the most postcodes to fall in the either the high/high or low/low categories. This expectation holds true in 85% of the postcodes. The p-value for this occurring under the null hypothesis, that population density and amenity are uncorrelated, is 2 × 10−65, and so this hypothesis is rejected, with the alternative hypothesis accepted, i.e., we can be certain that these two measures are closely linked.
Figure 5 illustrates the numerical outcomes in terms of the four categories (High-High, High-Low, Low-High, Low-Low), largely confirming the population/amenity theory (that amenity and density generally vary together), while Figure 6 and Figure 7 show the mapped variance spatially. The black (high/high) and white (low/low) postcodes conform to the population-amenity correlation, crosshatch represents high population density and low amenity, while grey represents low population density, high amenity.
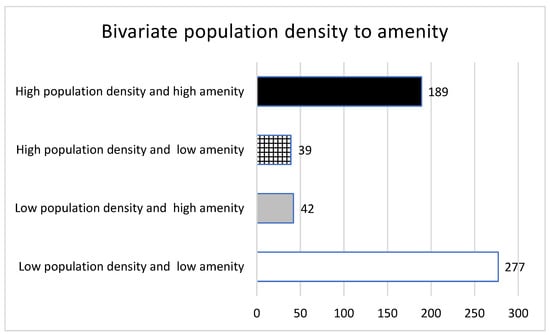
Figure 5.
Bivariate analysis of population density to amenity.
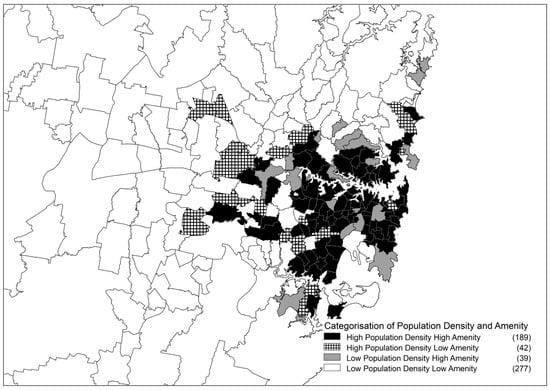
Figure 6.
Bivariate map population density to amenity, Sydney.
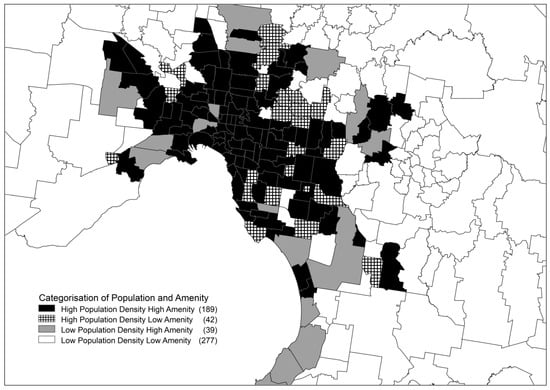
Figure 7.
Bivariate map population density to amenity, Melbourne.
An explanation for the small proportion (15%) of areas that do not adhere to the population/amenity hypothesis, for both cities the grey postcodes (low population density—high amenity) on the coast or fronting onto the estuary can be explained by the natural benefits of beaches/water access and recreation areas, as well as their population magnet effect and the commercial consequences of it, to the amenity calculation.
Furthermore, grey areas (low population density, high amenity) are generally proximate to the CBD and are largely areas zoned for specific functions, such as the postcode 2021 in Sydney which is predominantly parkland and sports, and postcode 3003 in Melbourne, which is primarily Melbourne docks, but has the social functionality of the CBD to its southeast. Inland grey areas (low population density, high amenity) not proximate to CBD are the postcodes that service the surrounding areas, which is, again, a function of suburban car dependence, low population densities and the need for larger business catchments.
Crosshatch areas (high population—low amenity) are almost exclusively in the middle and outer-ring suburbs, where residential zoned land dominates local planning schemes. These areas are also the suburban response to car dependence and the sparse distribution of services covered in the introduction. In inner urban areas they are, again, a response to land-use regulation but done so to maintain land values in wealthier areas and utilise the services in neighbouring postcodes (Newton et al., 2022).
3. Estimation of Changes in Daytime Population
We estimate how WFH practices are expected to change daytime populations, as outline in Appendix B. Importantly, this is based on the notion that the prevalence of WFH practices vary primarily according to occupation (See Dey et al. 2020, Dingel and Neiman 2020, Dockery and Bawa 2020, Gottlieb, Grobovsek, and Poschke 2020, Gschwind and Vargas 2019, Holgersen, Jia, and Svenkerud 2020, Pennington and Stanford 2020 for a range of percent telecommuting ranges for occupations).
The reliance on key occupations, combined with factors such as housing suitability, access to transport and access to local amenity, also covered in the above literature, play a role in the decision-making process, so the distribution of telecommuting, and increase (or decrease) in daytime populations is going to be skewed towards areas with particular occupation profiles.
To test the local application of these figures (plus other research questions) a survey of 2321 individuals was run over greater Sydney, inquiring as to their occupation, housing, capacity a desire to work from home. The survey was administered using Qualtrics and distributed through a panel survey company (The Online Research Unit). Participants were targeted within the Sydney Metropolitan Region (incl. the Illawarra and Blue Mountains areas) who were above 18. There were quotas based on education, gender and age. Gender was balanced, age was roughly 15% per 10-year cohort, with some bias towards the 25–34 (20%) and 55+ (38%) groups, education was typically 20–23% in each category, with a slight bias towards undergraduate studies (32%), and professionals were the most responsive occupation (26%), followed by managers (13%), clerical (13%), service and sales (both 7%) and trades, drivers and laborers <3%. The survey was active in October and November 2021. This timing therefore signified both the recent experience of working from home, as well as the new-found freedom to return to the workplace.
Regarding the propensity to WFH, survey outcomes were analysed by occupation at maximum WFH (purely based on what’s at all feasible within an occupation) and probable WFH (using statistical methods to consider occupations, and preferences for WFH practice). Table 3 illustrates the averaged values from range of secondary WFH research combined with the proportion WFH rates across our two scenarios.

Table 3.
Estimations of WFH probabilities by occupation type under different scenarios.
The estimated proportions of work that will be done from home under the “Current expectation” scenario is 27.2% in Greater Sydney and 26.6% in Greater Melbourne. Google mobility data (Google Community Mobility Reports 2022) shows that in the period post-COVID lockdowns, mobility in Metropolitan Sydney workplaces has reduced by 24.0% and mobility in Metropolitan Melbourne workplaces has reduced by 24.1%. This shows that our expected scenario, slightly over-estimates WFH propensities at the current time, but we acknowledge that this is a dynamic situation likely to change rapidly.
Projected population changes under the different scenarios were calculated using ABS occupation data, at both place of usual residence and place of work, with our proportionate WFH rates for each occupation applied (the methodology is described in Appendix B). The net gain/loss in worker volumes was added to the non-working population to provide a percentage change in daytime populations. Using the ‘maximum’ WFH scenario (when workers WFH as much as they can reasonably do and still achieve their tasks, as was the case for example during extreme lockdowns) we calculated that, at the height of lockdown orders, central Sydney (postcode 2000, one of 3 central-city postcodes) saw its daytime population reduce by an average of 175,000 per day, while Melbourne’s central postcode (3000, one of four) would experience reductions of an average of 125,000 per day.
Switching to the ‘expected’ scenario (in which workers would work from home as many days per week as they hoped and as much as their employer and work would allow), which reduced the WFH rates to allow for partial WFH (2–3 days), company policy and other limitations, percentage and volumes of workers were calculated for each postcode. Figure 8 and Figure 9 show the percentage change in daytime population, illustrating the proportional redistribution outwards from the CBD and other business activity centres. This scenario, even allowing for only partial work from home at 2–3 days per week, accounts for roughly 450,000 workers daily in Greater Sydney and 400,000 in Greater Melbourne not travelling to their place of work. The effects of which could be profound, particularly if acted upon and leveraged for urban change.
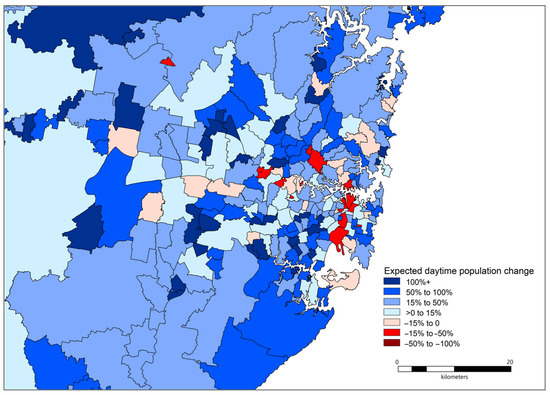
Figure 8.
Sydney expected percentage daytime population change due to working from home.
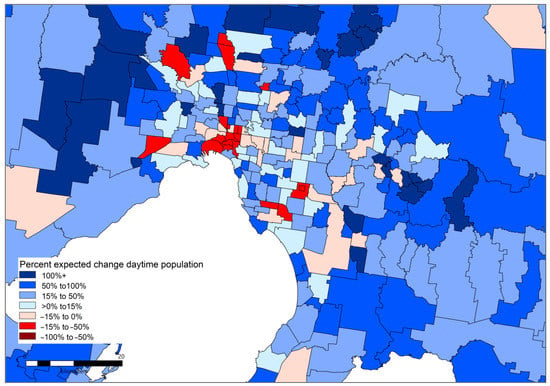
Figure 9.
Melbourne expected percentage daytime population change due to working from home.
4. WFH Regeneration Potential Taxonomy
With daytime population changes arising from the adoption of WFH practices, the question is, given the strong link between amenity and daytime population density, how this change could affect amenity, and what opportunities or risks will arise from it. While a highly localised analysis is not within the scope of this paper what we can show is a categorisation of potential change. For this we again turn to bivariate analysis, this time exploring daytime population change (loss/gain) from the WFH data and amenity levels (high/low) as per previous calculations.
Using above and below average amenity, combined with population loss/gain, the categorisation creates a taxonomy of four types of areas with distinctly different profiles of the potential for regeneration arising out of WFH practices, shown in Figure 10 and Figure 11:
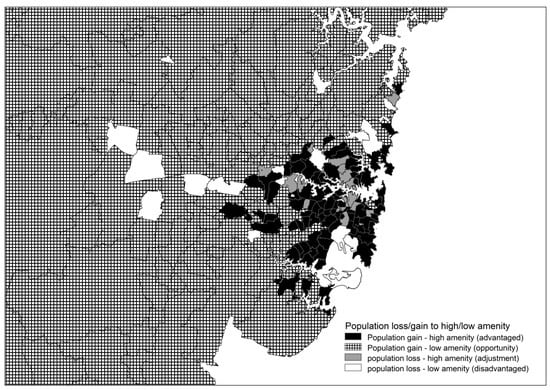
Figure 10.
Bivariate population change (loss or gain) to amenity level (high or low), Sydney.
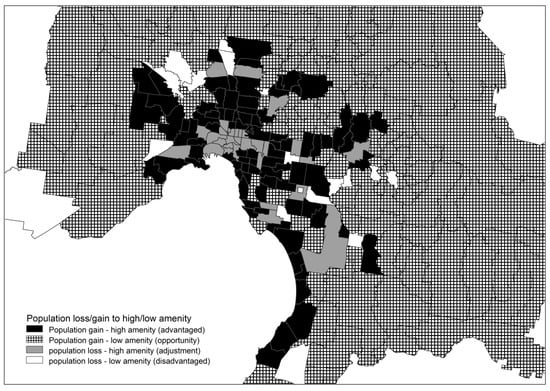
Figure 11.
Bivariate population change (loss or gain) to amenity level (high or low), Melbourne.
- Advantaged (population gain—high amenity): where an existing high amenity location gains more daytime population, thus making new/existing services more profitable/attended.
- Opportunity (population gain—low amenity): where a low amenity area has an increase in population, increasing demand and viability of services, potentially increasing amenity levels.
- Adjustment (population loss—high amenity): where a high amenity area suffers a daytime population loss and will potentially need to go through a period of adjustment to rationalise services that become less viable due to reduced demand.
- Disadvantaged (population loss—low amenity): where an area with low amenity suffers a population decline, further reducing the viability of existing services, leading to a further drop in amenity levels.
Adjustment areas (high amenity—population loss): As CBD’s are the visible heart of the city, and largely indicative of a greater city’s vitality and health, the ‘adjustment’ category is currently attracting the most media attention as mayors scramble to re-energise their city centres. While the CBD will endure, due to being the central public transport node of the greater city, housing the ‘big ticket’ event spaces, having the majority of hotels and, significantly, having high residential populations, the ‘adjustment’ that will be required relates to the future viability of office space, which will inevitably alter once leases expire, plus the commercial offerings that service the working and night-time economies, with reduced demand reducing business viability. Non-CBD ‘adjustment’ areas will face similar issues, which, particularly if they have low resident populations either may be more pronounced, due to not having the attractions of the CBD, or less pronounced, due to suffering less of a percentage daytime population loss. In terms of the greater city, it is the remaining three categories which are more significant.
Opportunity areas (low amenity—population gain): This category is important because, as we have argued, they can utilise the additional daytime populations to increase amenity levels. This is particularly important when we note the car dependence of suburban Australia and the volume of policies that aim to address this issue; most of which fail due to lack of implementation directives and no attention paid to changing land-use regulation, increasing amenity or increasing population densities. Given that these are the areas that are (in terms of new suburban development and greyfield infill regeneration) being planned for and/or developed now, not to make avail of population gains through telecommuting is to lose out on a critical opportunity to increase destination points and implement more walkable cities.
Advantage areas (high amenity—population gain): Those areas in or abutting the ‘advantaged’ categories will continue, as they have done, to enjoy their high amenity status based on the ongoing feedback loop. However, as local amenity is a particularly strong driver of house prices (Beracha et al. 2018), and (Lee et al. 2021) have shown a tripling of Moran’s I (a measure of spatial autocorrelation) directly related to amenity in areas, indicating ever growing disadvantage is less serviced areas, i.e., in our ‘disadvantaged’ category, as well as potentially the ‘opportunity’ areas, should higher levels of amenity not eventuate.
Disadvantage areas (low amenity—population loss): These areas, though limited, will be the biggest losers in the telecommuting shakeup. If they are residential areas then they are ones with low population, already lacking in amenity. The reduced demand for services will make existing ones even less viable, turning these areas into food and service deserts. If mainly commercial, as in business parks and so forth, then there is an issue of the feasibility of them remaining commercial. Should other services fill these areas then it will simply be an issue of re-leasing to non-telecommuting industries. Failing that, the office and business parks could become the brownfields of the future.
5. Discussion
One of the most significant positive outcomes from the COVID-19 pandemic was the acceleration of WFH/telecommuting as a norm for both businesses and employees. The implications of this for cities could be profound, particularly if leveraged as a vehicle for demand-driven, planning-facilitated, urban change to reduce car dependence and promote suburban regeneration and activation.
All Australian cities are currently trying to implement compact city policies in one form or another, variously through transport orientated development, infill-housing quotas, activity centre activation, greater emphasis on walkability and so forth. However, implementing these policies has largely been unsuccessful, chiefly due to low population densities combined with little planning forethought for land-use change at higher densities in suburban environments. However, if telecommuting remains at the current levels or greater, this could provide the additional demand for services outside of current activity centres and be the catalyst for these policies to succeed into the future, but only if planning authorities look at altering land-use regimes to accommodate this demand.
Areas of high amenity generally attract a premium and are, overall, more attractive for landowners. It follows that If an area can feasibly increase demand-led amenity it could lead to a positive feedback loop; where greater population densities demand more services, which attracts more population, cyclically increasing both population density and amenity levels to an optimised point. The counterpoint could also eventuate, where lower daytime population densities begin to reduce service demand, leading to amenity reduction, but in this instance, land is already zoned for non-commercial use, meaning that it is available for future reuse, such as in the CBD where office buildings may need to pivot in terms of function. As such, the changes in demand for services, and more significantly the ability of municipal planners to capitalise on this, could lead to areas becoming more popular, which may then impact upon municipal income as densities and rates increase. The opposite may also occur, where the reduction in daytime populations may reduce service demand and desirability, further driving a wedge between higher and lower socio-economic areas. Of course, there is the possibility that nothing will change, councils will remain conservative in their land-use policies and the opportunity will be lost.
However, to illustrate the scale of the issue, particularly for areas of Adjustment and Opportunity, Table 4. Change category and proportion of urban land and population shows both the proportion of land in each greater city, as well as the percentages of the population, that reside in each category. The areas where some form of adjustment will be required, while only representing 5.7% of the total population of both cities, comprise 39.8% of the population, which, again, illustrates the power of population density to drive higher amenity. More significantly, areas where there is opportunity to take advantage of increased populations comprise 89.3% of the total area of both cities, and while currently only housing 48.5% of the population (illustrating the car-dependent, low-density suburban reality of Australian cities) evidently have the potential to accommodate more into the future, particularly if councils think strategically about smart amenity-led growth.

Table 4.
Change category and proportion of urban land and population.
To conclude, we have analysed the link between density and amenity, and then the link between working from home leading to increased daytime populations. The chief aim being to illustrate the potential for utilising changes in daytime populations as an urban regeneration catalyst. However, it lies in the hands of state and municipal planners to realise this potential and capitalise on it by beginning strategic land-use amendment work now, as step changes like this do not come often.
6. Conclusions
Our conclusions are that the rapid rise of working from home practices will lead to considerable changes to population density, and that this has considerable implications for amenities, services, and future opportunities and risks for urban planners.
Specifically, this article has provided four main knowledge contributions. Firstly, we describe the mapping of access to amenity across Melbourne and Sydney, based on a novel composite index. Secondly, we analysed the link between population density and amenity access in Melbourne and Sydney, providing compelling evidence especially based on bivariate mapping, to suggest a two-way causal connection between these two variables. Thirdly, we have provided a simple method for estimating expected changes in daytime populations across a city, arising from adoption of telework, which we have cross-validated with recent mobility data, showing acceptable accuracy. Fourthly, we have developed a WFH regeneration potential taxonomy that describes the various fortunes and opportunities of different parts of a city impacted by significant uptake of telework. Comprising areas of adjustment (high amenity, population loss), opportunity (low amenity, population gain), advantage (high amenity, population gain) and disadvantage (low amenity, population loss) these categories each signify particular issues for strategic planners going forward.
Based on this study, a summation of the outcomes begins with our estimation that roughly 27% of all work in the case study sties will continue to be done at home. This is allowing for occupation type, employer openness, peer acceptance and preferred days working from home. Having established that density is a key aspect of local amenity, we then propose that, with the redistribution of daytime populations away from areas of job density and into more residential areas, that several urban and other issues will arise. In terms of media visibility, the issue attracting most attention are the areas of adjustment, where previously high working populations drove higher levels of amenity and service access. With a redistribution of workers away from these areas they will need to reconsider their land-use options, and particularly the reuse of office space, to remain viable. More significantly however are the areas of opportunity, where a relative increase in daytime populations will see an increase in demand for services. This category accounts for 89% of both greater Sydney and Melbourne. This figure not only captures the low-amenity car-dependent nature of these cities, but also illustrates how, with the increase in demand higher daytime populations deliver, there is potential to reconfigure these areas to provide more services and higher levels of local amenity and access. We therefore conclude that working from home could be the catalyst that could lead to the reconfiguration of our cities; driving higher levels of localism, less car dependence and providing the impetus for poly-centric, neighbourhood-base, cities that planners have envisioned as the more sustainable urban outcome for the last 40 plus years. Based on these outcomes we highlight the significant opportunity for planners in suburban environments to begin the process of identifying areas for increased services, such as under-utilized municipal land/assets, areas that could accommodate residential infill, and spaces that could be reactivated or amended, in terms of land use function, to accommodate a wider range of uses than just residential, as land use planning, community engagement and localized place-making policy will be critical in this endeavour.
To conclude, the form and function of cities is one of the foremost agendas in the sustainability debate, a key element of which is reducing car dependence and optimally increasing densities to reduce urban sprawl. To date most planning policies have failed in this regard, due largely to planning practices that purely focus density around areas of high job density such Central Business Districts. This in turn attracts most of the available services to these areas, further intrenching the car-dependent nature of suburbs. With the increase in working from home we see an opportunity to use the natural increase in daytime population as a driver for more localized services, increasing local amenity and acting as the magnet for yet higher densities again, as less dense suburban areas become potentials for urban regeneration through infill housing policies. As such working from home has the potential to radically transform our sprawling cities, and, if planned for, could be the driver to more sustainable, localized, living.
Author Contributions
Conceptualization, M.M., S.G. and P.N.; methodology, M.M. and S.G.; validation, M.M. and S.G.; formal analysis, S.G.; data curation, M.M. and S.G.; writing—original draft preparation, M.M. and S.G.; writing—review and editing, M.M., P.N. and S.G.; visualization, S.G.; funding acquisition, M.M. All authors have read and agreed to the published version of the manuscript.
Funding
This research was funded by Sydney Water Corporation and Swinburne University of Technology for the project titled “Telework Practice Post COVID-19: Projections and implications for water demand”.
Institutional Review Board Statement
The data collection approach was approved by the Australian Human Ethics Review Committee at the Swinburne University of Technology, approval number, 20215905-8292.
Informed Consent Statement
Informed consent was obtained from all subjects involved in the study.
Data Availability Statement
Data used for this study is available, as per cited references, as well as in the available tables.
Acknowledgments
The authors acknowledge advice and support from John Hopkins (Swinburne University of Technology), Luther Uthayakumaran (Sydney Water), Piret Veeroja (Swinburne University of Technology), Christian A Nygaard (Swinburne University of Technology).
Conflicts of Interest
The authors declare no conflict of interest.
Appendix A. Measures of Amenity
For each postcode, datasets were acquired that covered (a) the number of services within the area categorised per Feature Of Interest (FOI) code, (b) land use zoning categories, (c) road intersection analysis and (d) population density per postcode (See Table A1). Each category of feature was summed per postcode, defining the local access to each by volume and then divided by area (km2) of postcode. These values were normalised per variable (scored 0–1) and summed to provide a zero to n-variable score of the area’s amenity relative to its city’s counterparts. The use of n-variable was due to variation in the categorisation of data per state (Victoria/New South Wales). Due to variance in state datasets the normalisation occurs at a greater city level. This was then scored at a 1–10 scale to allow consistent analysis across cities.

Table A1.
Data and its sources.
Table A1.
Data and its sources.
| Dataset | Purpose of Using the Data | Reference |
|---|---|---|
| Household survey across Sydney, as described above | To validate key premises of the study, provide estimates of working from home by occupation, explore housing satisfaction, and the use of locale and amenity as a WFH attractor. | Not yet published. |
| Occupation (level 1): Sydney and Melbourne postcodes | To obtain the occupations of individuals, and therefore the probability of telecommuting per municipality | Australian Bureau of Statistics, OCCP1 at POA (ABS 2016) |
| Land zoning maps | To obtain data on access to commercial and parkland destinations | Victorian planning scheme zones (DELWP 2022b) and New South Wales, Environment Planning Instrument—Zones (DPIE 2022) |
| Road intersections | To capture 4-way intersections as a measure of walkability | Road network segments for Victoria (DELWP 2022c) and NSW (TfNSW 2022) |
| Features/points of interest | To provide a spatial overview of destinations and amenity locally, incorporating:
| Victorian Features of Interest (DELWP 2022a) NSW Points of Interest (NSW Spatial Services 2021) |
| Liquor licences | As an indicator of place activation—place making licences only (wholesale, retail and production excluded) | Victorian Commission for Gaming and Liquor Regulation (VCGLR 2021), Liquor and Gaming NSW (NSW 2022) |
Appendix A.1. Features of Interest
Effectively this aspect works as a destination point assessment. While aspects of the dataset will not be relevant to all subsectors of the community, they, collectively, define the network of places across the geographical area of analysis that service people.
Features/Points of Interest (FOI/POI) datasets (DELWP 2022a, NSW Spatial Services 2021) are used for assessing the access to services. In Australia, such data is typically held by state planning authorities and includes a count of points that may be of interest to urban geographers. The categorisation and levels of inclusion vary per state and are divided into subsets of data reflecting hard, engineering type, features (pipes, wells, storage facilities), and community assets (including cultural spaces and sports grounds). An analysis of amenity focuses on the latter. Whilst varying per state, the dataset typically consists of categories related to human activity, such as education, health, community, care, cultural and so forth, as described in Table A2.
An additional feature, not included in the feature/points of interest is liquor licences which are often seen as a way to positively increase local amenity though providing more destinations, activity and passive surveillance and are often a corollary of local area activation: (City of Fremantle 2013, Victorian Government 2022). For this analysis licences that were not deemed to be part of an area’s activation (i.e., wholesale and packaged liquor) were removed from the dataset.
Appendix A.2. Measures of Land-Use Mix
The mix of land use in an area is a key factor in walkability analysis (Ghosh and Raval 2022, Sugiyama et al. 2019, Xiao and Wei 2021). The premise is that more land-use zones within a walking network, the more destinations the walker can access; such as services, changes in morphology, shops, parks or other features defined in the FOI section. Importantly, some zones, such as industrial or comprehensive development zones (new suburbs), would likely not contribute to an area’s walkability (Sugiyama et al. 2019). Therefore, the analysis in this paper incorporates only data on zones that could be placed into the categories of commercial and parks; see Table A2 for specific information about which zones are included.
The aggregate area (km2) of the zones in Table A2 was captured and divided by the total area (km2) of each spatial unit, giving a percentage area of commercial and parkland. These were used jointly to remove the bias from activity centres and CBD and to provide a more balanced outcomes in relation to amenity.

Table A2.
Land use zones used for amenity calculations per greater city.
Table A2.
Land use zones used for amenity calculations per greater city.
| Land Use | Melbourne | Sydney |
|---|---|---|
| Commercial | City Centre Zone Activity Centre Zone Commercial zones Mixed Use Zone | B1–B8 (Local Centre, Business Corridor, Neighbourhood Centre, Mixed Use, Business Park, Commercial Core, Metropolitan Centre, Business Zone) |
| Parks | Park and reserve zone Public Use Zone—Sparingly, as also includes schools and train stations. Public Conservation and Resource Zone | Public Recreation Private Recreation Special Activities Recreation Zone—Public Recreation Recreation Zone—Private Recreation |
Appendix A.3. Measures of Road and Bicycle Networks
Road intersections are critically important when achieving walkable cities (Shaer et al. 2021, Ewing and Cervero 2010). Specifically, Molina-García et al. (2017) as well as others have identified that 4-way intersections increase the walkability of urban environments. Therefore, we collected the number of 4-way intersections over the greater urban area and allocated them to the geographical scales of analysis. This was done by accessing the street network spatial file, removing unwalkable roads such as freeways, identifying intersections, buffering each intersection, segmenting each road and then counting the number of intersections. Intersections with less than 3 were removed.
Additionally, and as a complement to greater walkability, kilometres of cycleways per kilometre of total road network were also counted. These were obtained through the bicycle network spatial files for each state, where lines were segmented, and their distance intersection within the geographical region measured. This was divided by the distance of the total road network of the area, this representing bicycle lane density, i.e., the proportion of roads that have bike paths associated with them.
Appendix B. Calculation of Work from Home Rates and Daytime Population Changes
Australian Bureau of Statistics (ABS) data was obtained at the postcode level (POA) for number of individuals in each of the level1 occupation categories (OCCP1) at both Place of Usual Residence (POUR) and Place of Work (POW). OCCP1 is the highest and most abstract occupation category and matches the categories used internationally by Day et al., 2020; Dingel and Neiman, 2020; Dockery and Bawa, 2020; Gottlieb et al., 2020; Gschwind, 2019; Holgersen et al., 2021; Pennington and Stanford, 2020 to calculate WFH probabilities. By having the occupation figures at both POUR and POW, we were able to determine the pre-COVID daytime work-related migratory patterns per postcode.
Table A3 shows results from the Sydney WFH survey revealed the maximum levels of telecommuting by OCCP1. These figures were then amended to include the influence of company policy, peer pressure, management decisions on telecommuting and the preferred days of working from home, to generate the expected figures.

Table A3.
Maximum and expected telecommuting figures from survey data.
Table A3.
Maximum and expected telecommuting figures from survey data.
| Occupation Type | Maximum Scenario (Survey) | Current Expectation (Survey) |
|---|---|---|
| Manager | 61% | 35% |
| Professional | 70% | 39% |
| Tech/Trade | 40% | 25% |
| Service | 18% | 12% |
| Admin | 60% | 34% |
| Sales | 36% | 21% |
| Operator/Driver | 9% | 6% |
| Labourer | 18% | 11% |
With the numbers of individuals in each occupation category at place of usual residence and place of work, we then applied (variously the max or expected figures for a max and expected scenario) the above probabilities to each occupation at POUR postcode to calculate the increase in population from working from home, and then inversely applied (1-p) the probabilities to show decrease in individuals travelling to the postcode. The sum of these figures provided the (n) change in daytime population.
Baseline daytime population was considered to be all individuals not included in the OCCP calculations, capturing retirees and children, with the assumption that the majority of school children would remain within the postcode school catchment, plus individuals travelling the postcode for work. The change in daytime population (either plus or minus) was added to this to get the new total daytime population, from which we could calculate percentage total daytime population change.
References
- Newman, P.; Kenworthy, J. Urban Design to Reduce Automobile Dependence. Opolis 2006, 2, 35–52. [Google Scholar]
- Landcom. Residential Density Guide for Landcom Project Teams; Landcom: Parramatta, Australia, 2011. [Google Scholar]
- DELWP. Plan Melbourne 2017–2050. In Department of Energy; Water, L., Ed.; Victorian Government: Melbourne, Australia, 2017. [Google Scholar]
- Taylor, E.J.; van Bemmel-Misrachi, R. The elephant in the scheme: Planning for and around car parking in Melbourne, 1929–2016. Land Use Policy 2017, 60, 287–297. [Google Scholar] [CrossRef]
- Productivity Commission. Plan to Identify Planning and Zoning Reforms; Australian Government: Canberra, Australia, 2021. [Google Scholar]
- Glaeser, E. The Triumph of the City; Penguin: New York, NY, USA, 2011. [Google Scholar]
- Nilles, J.M. Traffic reduction by telecommuting: A status review and selected bibliography. Transp. Res. Part A Gen. 1988, 22, 301–317. [Google Scholar] [CrossRef]
- Moglia, M.; Hopkins, J.; Bardoel, A. Telework, Hybrid Work and the United Nation’s Sustainable Development Goals: Towards Policy Coherence. Sustainability 2021, 13, 9222. [Google Scholar] [CrossRef]
- ABS. OCCP1 at POA (Postcode), Austrlaian Census Table Builder. In Statistics; ABS: Canberra, Australia, 2016. [Google Scholar]
- ABS. More than 40 Per Cent of Australians Worked from Home; Australian Bureau of Statistics: Canberra, Australia, 2021. [Google Scholar]
- Lennox, J. More Working from Home Will Change the Shape and Size of Cities; Victoria University, Centre of Policy Studies/IMPACT Centre: Melbourne, Australia, 2020. [Google Scholar]
- Productivity Commission. Working from Home: Research Paper; Australian Government: Canberra, Australia, 2021. [Google Scholar]
- Nilles, J.M. Telecommuting and urban sprawl: Mitigator or inciter? Transportation 1991, 18, 411–432. [Google Scholar] [CrossRef]
- Hensher, D.A.; Balbontin, C.; Beck, M.J.; Wei, E. The impact of working from home on modal commuting choice response during COVID-19: Implications for two metropolitan areas in Australia. Transp. Res. Part A Policy Pract. 2022, 155, 179–201. [Google Scholar] [CrossRef]
- Jain, T.; Currie, G.; Aston, L. COVID and working from home: Long-term impacts and psycho-social determinants. Transp. Res. Part A Policy Pract. 2022, 156, 52–68. [Google Scholar] [CrossRef]
- Hummel, D. The effects of population and housing density in urban areas on income in the United States. Local Econ. 2020, 35, 27–47. [Google Scholar] [CrossRef]
- Liu, D.; Shi, Y. The Influence Mechanism of Urban Spatial Structure on Urban Vitality Based on Geographic Big Data: A Case Study in Downtown Shanghai. Buildings 2022, 12, 569. [Google Scholar] [CrossRef]
- Cerin, E.; Barnett, A.; Shaw, J.E.; Martino, E.; Knibbs, L.D.; Tham, R.; Wheeler, A.J.; Anstey, K.J. From urban neighbourhood environments to cognitive health: A cross-sectional analysis of the role of physical activity and sedentary behaviours. BMC Public Health 2021, 21, 2320. [Google Scholar] [CrossRef]
- Bartzokas-Tsiompras, A.; Photis, Y.N. Microscale walkability modelling. The case of athens city centre. Int. J. Sustain. Dev. Plan. 2021, 16, 413–426. [Google Scholar] [CrossRef]
- Rahimi, S.; Martin, M.J.R.; Obeysekere, E.; Hellmann, D.; Liu, X.; Andris, C. A Geographic Information System (GIS)-Based analysis of social capital data: Landscape factors that correlate with trust. Sustainability 2017, 9, 365. [Google Scholar] [CrossRef]
- Rappaport, J. Consumption amenities and city population density. Reg. Sci. Urban Econ. 2008, 38, 533–552. [Google Scholar] [CrossRef]
- Martino, N.; Girling, C.; Lu, Y. Urban form and livability: Socioeconomic and built environment indicators. Build. Cities 2021, 2, 220–243. [Google Scholar] [CrossRef]
- Economist Intelligence. The Global Liveability Index. Available online: https://www.eiu.com/n/campaigns/global-liveability-index-2021 (accessed on 25 March 2022).
- Van Dyck, D.; Deforche, B.; Cardon, G.; De Bourdeaudhuij, I. Neighbourhood walkability and its particular importance for adults with a preference for passive transport. Health Place 2009, 15, 496–504. [Google Scholar] [CrossRef]
- Abdullahi, S.; Pradhan, B.; Mansor, S.; Shariff, A.R.M. GIS-based modeling for the spatial measurement and evaluation of mixed land use development for a compact city. GIScience Remote Sens. 2015, 52, 18–39. [Google Scholar] [CrossRef]
- Pineda-Pinto, M.; Nygaard, C.A.; Chandrabose, M.; Frantzeskaki, N. Mapping social-ecological injustice in Melbourne, Australia: An innovative systematic methodology for planning just cities. Land Use Policy 2021, 104, 105361. [Google Scholar] [CrossRef]
- Barton, H.; Grant, M. Urban planning for healthy cities. J. Urban Health 2013, 90, 129–141. [Google Scholar] [CrossRef]
- Artmann, M.; Bastian, O.; Grunewald, K. Using the concepts of green infrastructure and ecosystem services to specify Leitbilder for compact and green cities—The example of the landscape plan of Dresden (Germany). Sustainabilty 2017, 9, 198. [Google Scholar] [CrossRef]
- Chang, S.E.; McDaniels, T.; Fox, J.; Dhariwal, R.; Longstaff, H. Toward disaster-resilient cities: Characterizing resilience of infrastructure systems with expert judgments. Risk Anal. 2014, 34, 416–434. [Google Scholar] [CrossRef]
- Ghasemi, K.; Hamzenejad, M.; Meshkini, A. The spatial analysis of the livability of 22 districts of Tehran Metropolis using multi-criteria decision making approaches. Sustain. Cities Soc. 2018, 38, 382–404. [Google Scholar] [CrossRef]
- Shashank, A.; Schuurman, N. Unpacking walkability indices and their inherent assumptions. Health Place 2019, 55, 145–154. [Google Scholar] [CrossRef] [PubMed]
- Day, G. Commuity and Everyday Life; Routledge: Melbourne, Australia, 2006. [Google Scholar]
- Manaugh, K.; El-Geneidy, A. Validating walkability indices: How do different households respond to the walkability of their neighborhood? Transp. Res. Part D Transp. Environ. 2011, 16, 309–315. [Google Scholar] [CrossRef]
- Ahmed, N.O.; El-Halafawy, A.M.; Amin, A.M. A critical review of urban livability. Eur. J. Sustain. Dev. 2019, 8, 165. [Google Scholar] [CrossRef]
- Bérenger, V.; Verdier-Chouchane, A. Multidimensional measures of well-being: Standard of living and quality of life across countries. World Dev. 2007, 35, 1259–1276. [Google Scholar] [CrossRef]
- Szibbo, N.A. Livability and LEED-ND: The Challenges and Successes of Sustainable Neighborhood Rating Systems; University of California: Berkeley, CA, USA, 2015. [Google Scholar]
- Ducas, C.R. Incorporating Livability Benefits into the Federal Transit Administration New Starts Project Evaluation Process through Accessibility-Based Modeling; Massachusetts Institute of Technology: Cambridge, MA, USA, 2011. [Google Scholar]
- Murakami, J. The Transit-Oriented Global Centers for Competitiveness and Livability: State Strategies and Market Responses in Asia; University of California: Berkeley, CA, USA, 2010. [Google Scholar]
- Talen, E.; Allen, E.; Bosse, A.; Ahmann, J.; Koschinsky, J.; Wentz, E.; Anselin, L. LEED-ND as an urban metric. Landsc. Urban Plan. 2013, 119, 20–34. [Google Scholar] [CrossRef]
- Laprise, M.; Lufkin, S.; Rey, E. An indicator system for the assessment of sustainability integrated into the project dynamics of regeneration of disused urban areas. Build. Environ. 2015, 86, 29–38. [Google Scholar] [CrossRef]
- Grasser, G.; Van Dyck, D.; Titze, S.; Stronegger, W. Objectively measured walkability and active transport and weight-related outcomes in adults: A systematic review. Int. J. Public Health 2013, 58, 615–625. [Google Scholar] [CrossRef]
- McCormack, G.R.; Shiell, A. In search of causality: A systematic review of the relationship between the built environment and physical activity among adults. Int. J. Behav. Nutr. Phys. Act. 2011, 8, 125. [Google Scholar] [CrossRef]
- Saelens, B.E.; Handy, S.L. Built environment correlates of walking: A review. Med. Sci. Sport. Exerc. 2008, 40 (Suppl. S7), S550–S566. [Google Scholar] [CrossRef]
- Transport for London Street Management. Making London a Walkable City: The Walking Plan for London. In Mayor of London; Transport for London Street Management: London, UK, 2004. [Google Scholar]
- Cervero, R.; Kockelman, K. Travel demand and the 3Ds: Density, diversity, and design. Transp. Res. Part D Transp. Environ. 1997, 2, 199–219. [Google Scholar] [CrossRef]
- Ewing, R.; Meakins, G.; Bjarnson, G.; Hilton, H. Transportation and land use. In Making Healthy Places; Dannenberg, A., Frumkin, H., Jackson, R.J., Eds.; Island Press: Washington, WA, USA, 2011; pp. 149–169. [Google Scholar]
- Moura, F.; Cambra, P.; Gonçalves, A.B. Measuring walkability for distinct pedestrian groups with a participatory assessment method: A case study in Lisbon. Landsc. Urban Plan. 2017, 157, 282–296. [Google Scholar] [CrossRef]
- Dogan, T.; Yang, Y.; Samaranayake, S.; Saraf, N. Urbano: A tool to promote active mobility modeling and amenity analysis in urban design. Technol. Archit. Des. 2020, 4, 92–105. [Google Scholar] [CrossRef]
- Beames, A.; Broekx, S.; Schneidewind, U.; Landuyt, D.; van der Meulen, M.; Heijungs, R.; Seuntjens, P. Amenity proximity analysis for sustainable brownfield redevelopment planning. Landsc. Urban Plan. 2018, 171, 68–79. [Google Scholar] [CrossRef]
Publisher’s Note: MDPI stays neutral with regard to jurisdictional claims in published maps and institutional affiliations. |
© 2022 by the authors. Licensee MDPI, Basel, Switzerland. This article is an open access article distributed under the terms and conditions of the Creative Commons Attribution (CC BY) license (https://creativecommons.org/licenses/by/4.0/).