Article

Low-Carbon Product Family Planning for Manufacturing as a Service (MaaS): Bilevel Optimization with Linear Physical Programming

1
School of Management, Tianjin University of Commerce, Tianjin 300134, China
2
Research Center for Management Innovation and Evaluation, Tianjin University of Commerce, Tianjin 300134, China
3
The George W. Woodruff School of Mechanical Engineering, Georgia Institute of Technology, Atlanta, GA 30332-0405, USA
*
Author to whom correspondence should be addressed.
Sustainability 2022, 14(19), 12566; https://doi.org/10.3390/su141912566
Submission received: 17 August 2022 / Revised: 13 September 2022 / Accepted: 29 September 2022 / Published: 2 October 2022

Abstract

:
The conversion of manufacturing functional areas towards services implies a paradigm of Manufacturing as a Service (MaaS). It transforms the product fulfillment process to a distributed one via a service-oriented manufacturing platform. Successful MaaS operational planning must be coordinated with low-carbon product family planning (PFP) at the front end of product design and development. These changes challenge the traditional PFP design, considering its manufacturer loading balancing (MLB) problem, which is limited to integrated product fulfillment. This paper proposes a leader–follower interactive decision-making mechanism for distributed collaborative product fulfillment of low-carbon PFP and MLB based on a Stackelberg game. A bilevel optimization model with linear physical programming was developed and solved, comprising an upper-level PFP optimization problem and a lower-level MLB optimization problem. The upper-level PFP aims to determine the optimal configuration of each product variant with the objective of maximizing the market share and the total profit in the product family. The lower-level MLB seeks for the optimal partition of manufacturing processes among manufacturers in order to minimize the low-carbon operation cost of product variants and balance the loads among manufacturers. A case study of WS custom kitchen product family design for MaaS is reported to demonstrate the feasibility and potential of the proposed bilevel interactive optimization approach.

1. Introduction

The cutting edge of manufacturing challenges enterprises to meet the personalized needs of individual customers while managing product categories and completing products more efficiently than their competitors [1]. Today’s enterprises no longer have excess production capacity to hedge against demand fluctuations, but tend to adopt an open business model [2], and implement manufacturing capability and resources as an expandable and variable production network to achieve quick response and adjustment [3] through an agile enterprise structure with a broad capacity base [4]. In the open business model, many functional areas of manufacturing have become services [5], e.g., manufacturing-as-a-service (MaaS), and the transformation of MaaS driven by resource sharing and networking in Industry 4.0 may prevail for companies embracing open manufacturing [6].
Because it can meet diversified customer needs in the fiercely competitive market with high resource utilization efficiency, the platform-driven strategy explores the common modules among products and processes to achieve mass customization [7]. The instantiation of the platform-driven strategy is product family design and development, which involves multiple domains (customer, functional, physical, process, and logistics), and each domain owns different domain decision-making problems [8,9]. This platform-driven and collaborative integration of various business and operation processes forges an extended enterprise in which the joint decision making of product planning and early involvement of manufacturer crowds becomes a new competitive edge for innovative product development. Product family planning (PFP) aims to determine product variants as well as their configurations considering the engineering costs and customer needs of the product family, which is the stage of product definition at the intersection of the customer domain and the functional domain [10]. As it will be the input of the MaaS operational planning decision making, the PFP decision result will obviously affect the back-end MaaS decision making. Moreover, in order to cope with global warming, a serious problem facing human society, reducing carbon emissions has become an important industrial development goal. How to pay attention to low-carbon design optimization in the process of product design, so as to maximize the low-carbon sustainability of design and make products more in line with low-carbon ecological requirements, has become a research hotspot [11,12,13,14,15,16].
Successful MaaS implementation must be coordinated with low-carbon PFP at the front end of product design and development. Thus, systematic planning for coordinating low-carbon PFP and MaaS operational decision making from the beginning is necessary. Some key technical challenges identified for low-carbon PFP for MaaS include the following:
(1) Interactive design. Future networked manufacturing in Industry 4.0 is equipped with ubiquitous connectivity in the manufacturing environment, allowing a large amount of decentralized information to be collected to support distributed production decision making and complete manufacturing tasks [17]. The new open manufacturing capability realized by the network platform will promote the realization of MaaS by developing an intelligent cognitive assistant as a decision support system and will create opportunities for the transformation and expansion of the manufacturing industry [18]. Thus, multiple agents, including MaaS service providers and platform operators like intelligent cognitive assistants, will be involved in low-carbon PFP for MaaS. It is necessary to develop decision-making methods for this kind of multi-agent online interactive design decision making.
(2) Conflicting objectives. In distributed collaborative design, low-carbon PFP and MaaS operational planning have different decision objectives [19,20,21]. For example, the decision objectives of PFP are usually maximizing the customer perceived utility, maximizing the market share, minimizing the product development time, etc. [22]. The decision objectives of MaaS operational planning are usually minimizing the total costs, minimizing the load indices, maximizing the relevance of manufacturing tasks, etc. [5,6,20]. These decision objectives are interrelated, restrictive and even conflict with each other [5,6,20,22]. Therefore, it is necessary to establish an effective decision-making mechanism to coordinate the interests of low-carbon PFP and MaaS decision-making processes.
(3) Goal preferences. As previously described, low-carbon PFP and MaaS design decision-making processes are essentially multi-objective optimization problems [5,6,11,12,13,14,15,16,20]. In the traditional weight-based techniques used for this kind of multi-objective optimization problem [11], the process of determining appropriate weights or priorities is uncertain and time-consuming, and thus the practicality of these approaches is diminished [23]. In addition, the decision makers can not represent their preferences regarding each goal using more physically meaningful preference ranges in these approaches [24]. Thus, there is a need to adopt a more flexible approach with physically meaningful formulation of targets for eliminating low-carbon PFP and MaaS decision makers from the traditional subjective weight-setting process.
In this regard, this paper formulates MaaS operational planning as a distributed networked manufacturer loading balancing (MLB) problem. A leader–follower interactive decision-making mechanism for distributed collaborative design of low-carbon PFP and MLB in MaaS is proposed. A bilevel optimization model with linear physical programming was developed and solved, in which PFP plays a leader and MLB acts as a follower.
The rest of the paper proceeds as follows. The next section reviews related work regarding future manufacturing trends towards MaaS, low-carbon product design, and PFP for manufacturing. Coordinated decision making of low-carbon PFP and MLB is formulated as a leader–follower interactive optimization problem in Section 3. Section 4 elaborates the formulation of a bilevel optimization model with linear physical programming, comprising an upper-level PFP optimization problem and a lower-level MLB optimization problem. Section 5 develops a nested bilevel genetic algorithm (NBGA) for the solution of the proposed model. A case study of WS custom kitchen product family design for MaaS is reported in Section 6, and this paper concludes in Section 7 with discussions on further research.

2. Literature Review and Contributions

2.1. Future Manufacturing Trends towards MaaS

In the Industry 4.0 era, various advanced technologies such as Internet of Things, cloud computing, blockchain technology, and big data analysis have been applied in the cyberphysical manufacturing environment, consolidating the foundation of future manufacturing paradigm shifts [25]. Open manufacturing, social manufacturing, cloud-based design and manufacturing, service manufacturing, crowdsourced manufacturing, and other concepts and technologies have been put forward in succession [21]. The need to accommodate a dynamic and collaborative network implies the adoption of a service-oriented paradigm which installs X as a service in the manufacturing regime as manufacturing as a service [6]. MaaS is defined as the sum of process as a service and manufacturing operations as a service [5]. In MaaS, the traditional design of a manufacturing system will be reduced to an enterprise configuration decision-making problem which can be modeled and solved using mathematical programming and evolutionary computation [5,6].
Future manufacturing trends towards MaaS have become a hot research issue, as MaaS is regarded as the correct opening mode of the industrial internet for constructing a cyberphysical manufacturing platform. For example, decentralized middleware software architectures of Cloud MaaS based on the blockchain technology have been proposed for linking client users and manufacturing service providers directly [26]. A mechanism similar to the reverse auction in a 3D-printing MaaS marketplace has been designed to increase the accessibility of prototype services providers though taking advantage of their excess manufacturing capacity [27]. A multi-objective optimization approach to MaaS has been proposed for recommending machine groups to enterprises who encounter unexpected downtime in production [20]. Optimal pricing strategies for sustainable MaaS platforms have been discussed using Hotelling’s model for maximizing MaaS platform profit [28]. Near-real-time decision making for suppliers in a dynamic and stochastic two-sided MaaS marketplace has been formulated and solved based on deep reinforcement learning [29]. The expected benefits obtained from MaaS can be illustrated through shared manufacturing services and democratization of manufacturing [6,20]. In conclusion, the current research focuses mainly on the mechanism design of MaaS using the blockchain, dynamic evolution analysis, and other technologies, and less on the product design for MaaS.
The future manufacturing paradigm for delivery of MaaS, i.e., crowdsourced manufacturing, has been discussed [21,30]. In crowdsourced manufacturing, enterprises can share manufacturing resources according to their needs and capabilities [31], and the supply of raw materials, assembly, manufacturing, transportation, etc., of products can be realized by manufacturing service providers through a cyber platform in a crowdsourcing model [32,33]. Existing studies on product design in crowdsourced manufacturing include product family design considering postponement contracting decisions [32] and service product family design [33]. However, how to make low-carbon product design decisions in crowdsourced manufacturing remains to be studied.

2.2. Low-Carbon Product Design

Previous research efforts on low-carbon product design have mainly focused on low-carbon product design systems or frameworks, estimation or calculation of carbon footprints, and low-carbon product design optimization. Multi-objective optimization methods have been used for low-carbon product design. Kuo et al. [34] established a multi-objective planning model with the objective of minimizing carbon emissions and cost for low-carbon product design, and an interactive step method was applied to seek a satisfactory solution. Xu et al. [35] proposed a low-carbon product multi-objective optimization approach for handling conflicting requirements among enterprises, user, and government, and developed a NSGA with a simplified solving strategy for solving this three-level coupled problem. Chiang and Che [36] proposed a decision-making methodology to support low-carbon electric product design, in which a multi-objective evaluation model for low-carbon design alternative combinations was formulated. In addition, He et al. [37] proposed a dynamic programming approach for low-carbon product design, which was characterized as a multi-stage decision-making process during the product life cycle. He et al. [38] developed a network-based low-carbon product design model considering carbon footprint and cost, and then applied a Lagrange-relaxation-based constrained shortest-path algorithm to obtain the optimal solution. He et al. [39] also developed a five-layer weighted directed graph-based life cycle model and a shortest-path-searching algorithm for low-carbon product design. These proposed optimization approaches for low-carbon product design in the above researches have mainly focused on a single product. Compared with the low-carbon design of a single product, the low-carbon design of a product family is more complex [11,12,13,14,15,16].
Low-carbon product family design that considers environmental factors has recently become an area of intense ongoing research. Wang et al. [11] established a bi-objective optimization model with consideration of costs and GHG emissions for low-carbon product family design. Wang et al. [13] presented a multi-objective optimization model for low-carbon modular product platform planning. Baud-Lavigne et al. [40] considered joint design optimization of a product family and its supply chain with environmental constraints. Wang et al. [12] proposed a bi-objective optimization model for low-carbon product family design considering supplier selection. Wang et al. [14] developed a bi-objective optimization model for low-carbon product family design considering remanufacturing product planning, with the objectives of maximizing profits and minimizing GHG emissions. However, the supply risk and decision maker’s objective preferences were not considered in the above studies. In addition, game analysis approaches have been adopted by some scholars for low-carbon product line/family design. Huang et al. [41] established a game-theoretic model for green product line and supply chain design with GHG emissions management. Ma et al. [42] formulated an inventive-based bilevel model for green product line design optimization considering carbon emissions. Xiao et al. [43] developed a bilevel game-theoretic model for coordinating low-carbon product family architecture design considering its manufacturing process configuration.

2.3. PFP for Manfacturing

The influence of manufacturing factors has been considered since the early stages of PFP, and has gradually attracted the attention of scholars [44,45,46,47,48,49]. For example, Xu and Liang [50] proposed an integrated approach to planning product module selection and assembly line design with the objective of minimizing the total cost, including quality loss, the assembly line reconfiguration and material cost, and the assembly operation-related cost. Xu and Liang [51] also established a multi-objective model to deal with this problem, and solved it by adopting a modified version of Chebyshev goal programming. The objectives of their model are to minimize the total costs, minimize the product performance index, and minimize the assembly line smoothness index. Bryan et al. [52] considered the concurrent design of product portfolio planning and mixed product assembly line balancing, and developed a multi-objective model for minimizing the oversupply of optional modules and maximizing the assembly line efficiency. However, the market demands of product variants are determined before optimization in all the above three models, and thus the effects of consumer preferences and purchase behaviors in marketing are not considered. Bryan et al. [53] formulated a mixed-integer nonlinear programming model for product family design with reconfigurable assembly systems considerations. Bryan et al. [54] further proposed co-evolution of product families and assembly systems over generations, and introduced a two-phase method based on the model in Bryan et al. [53] for evaluating the co-evolution effectiveness. Instead of adopting the deterministic choice rule [55], Liu et al. [56] studied PFP by considering its mixed-model assembly line balancing decision making under a multinomial logit choice model.
Recently, Hanafy and ElMaraghy [57] formulated a mixed-integer programming model for integrating assembly line planning with modular product platform configuration. Abbas and ElMaraghy [58] introduced an integrated methodology for synthesizing assembly systems for customized products by coplatforming of products and assembly systems. However, all the above studies were conducted under traditional integrated product fulfillment, in which a manufacturer implements a series of activities to develop a product and meet customer needs. In addition, the constraint satisfaction approach can be used to coordinate decisions across the product, process, and the supply chain to derive an effective manufacturer load planning result [59]. The cloud-based cyber platform synergizes the product and process information and enables the interactive optimization of product design and process setup [60]. Although PFP for manufacturing (including assembly, remanufacturing, etc.) has been widely studied, there is still a gap in the research regarding PFP under the new trend of MaaS, especially considering environmental factors.

2.4. Contributions

The main contribution of this paper is concerned with the distributed collaborative design of low-carbon PFP and MLB in MaaS. We revealed the intrinsic hierarchical structure for joint decision making of PFP and MLB, i.e., the leader–follower interactive game between PFP and MLB. The leader (upper-level PFP) aims to select the optimal product portfolio and determine the optimal configuration of each product variant, with the objective of maximizing the market share and maximizing the total profit in the product family. The follower (lower-level MLB) seeks the optimal partition solution of the manufacturing tasks among manufacturers in order to minimize the MaaS low-carbon operational cost of product variants and balance the loads among manufacturers. This problem was modeled as a bilevel optimization and the corresponding NBGA solving algorithm was developed. Our contributions are listed as follows:
  • Coordinated decision making of low-carbon PFP and MLB for MaaS is proposed and described as a joint optimization problem.
  • A leader–follower interactive decision-making mechanism is proposed, and we formulate the joint optimization of low-carbon PFP and MLB as a bilevel optimization model with linear physical programming (both upper level and lower level have multiple objectives).
  • A NBGA algorithm embedded linear physical programming method is designed to solve the proposed bilevel model and obtain the near-equilibrium points between the upper-level PFP and the lower-level MLB, which can be used to effectively solve similar bilevel multi-objective optimization problems that consider the goal preferences of decision makers.
  • A case study of low-carbon PFP and MaaS operational planning for the WS Company is presented and corresponding management insights are given.

3. Problem Formulation

3.1. A Motivating Example

A motivating example of WS Custom Kitchens is considered to illustrate the problem setting. Considering dynamic market demands and shortened product lifecycles, the WS Company plans to provide products and services for customers by adopting the MaaS model. The WS Company has developed a manufacturing platform which provides a collaborative manufacturing system to small- and medium-sized furniture manufacturing enterprises in the customized home furnishing industry. In the MaaS model, manufacturing activities are provided by external partners based on the manufacturing cyber platform. The platform-driven strategy in MaaS connects a wide spectrum of product fulfillment demands and enables an extensive search for the similarities among them. The cyber platform can assign the similar manufacturing tasks to a manufacturer, which can allow the manufacturer to achieve maximized reusability of the related resources. Thus, with the expansion of customer clusters, the manufacturers can focus on their core competitive edges and achieve economies of scale. Assume that the WS Company plans to design a family of custom kitchens to meet customer needs in different market segments. WS custom kitchens can be considered modular products, and each module required in the product family can be designed and manufactured by MaaS service providers through the service-oriented manufacturing platform.
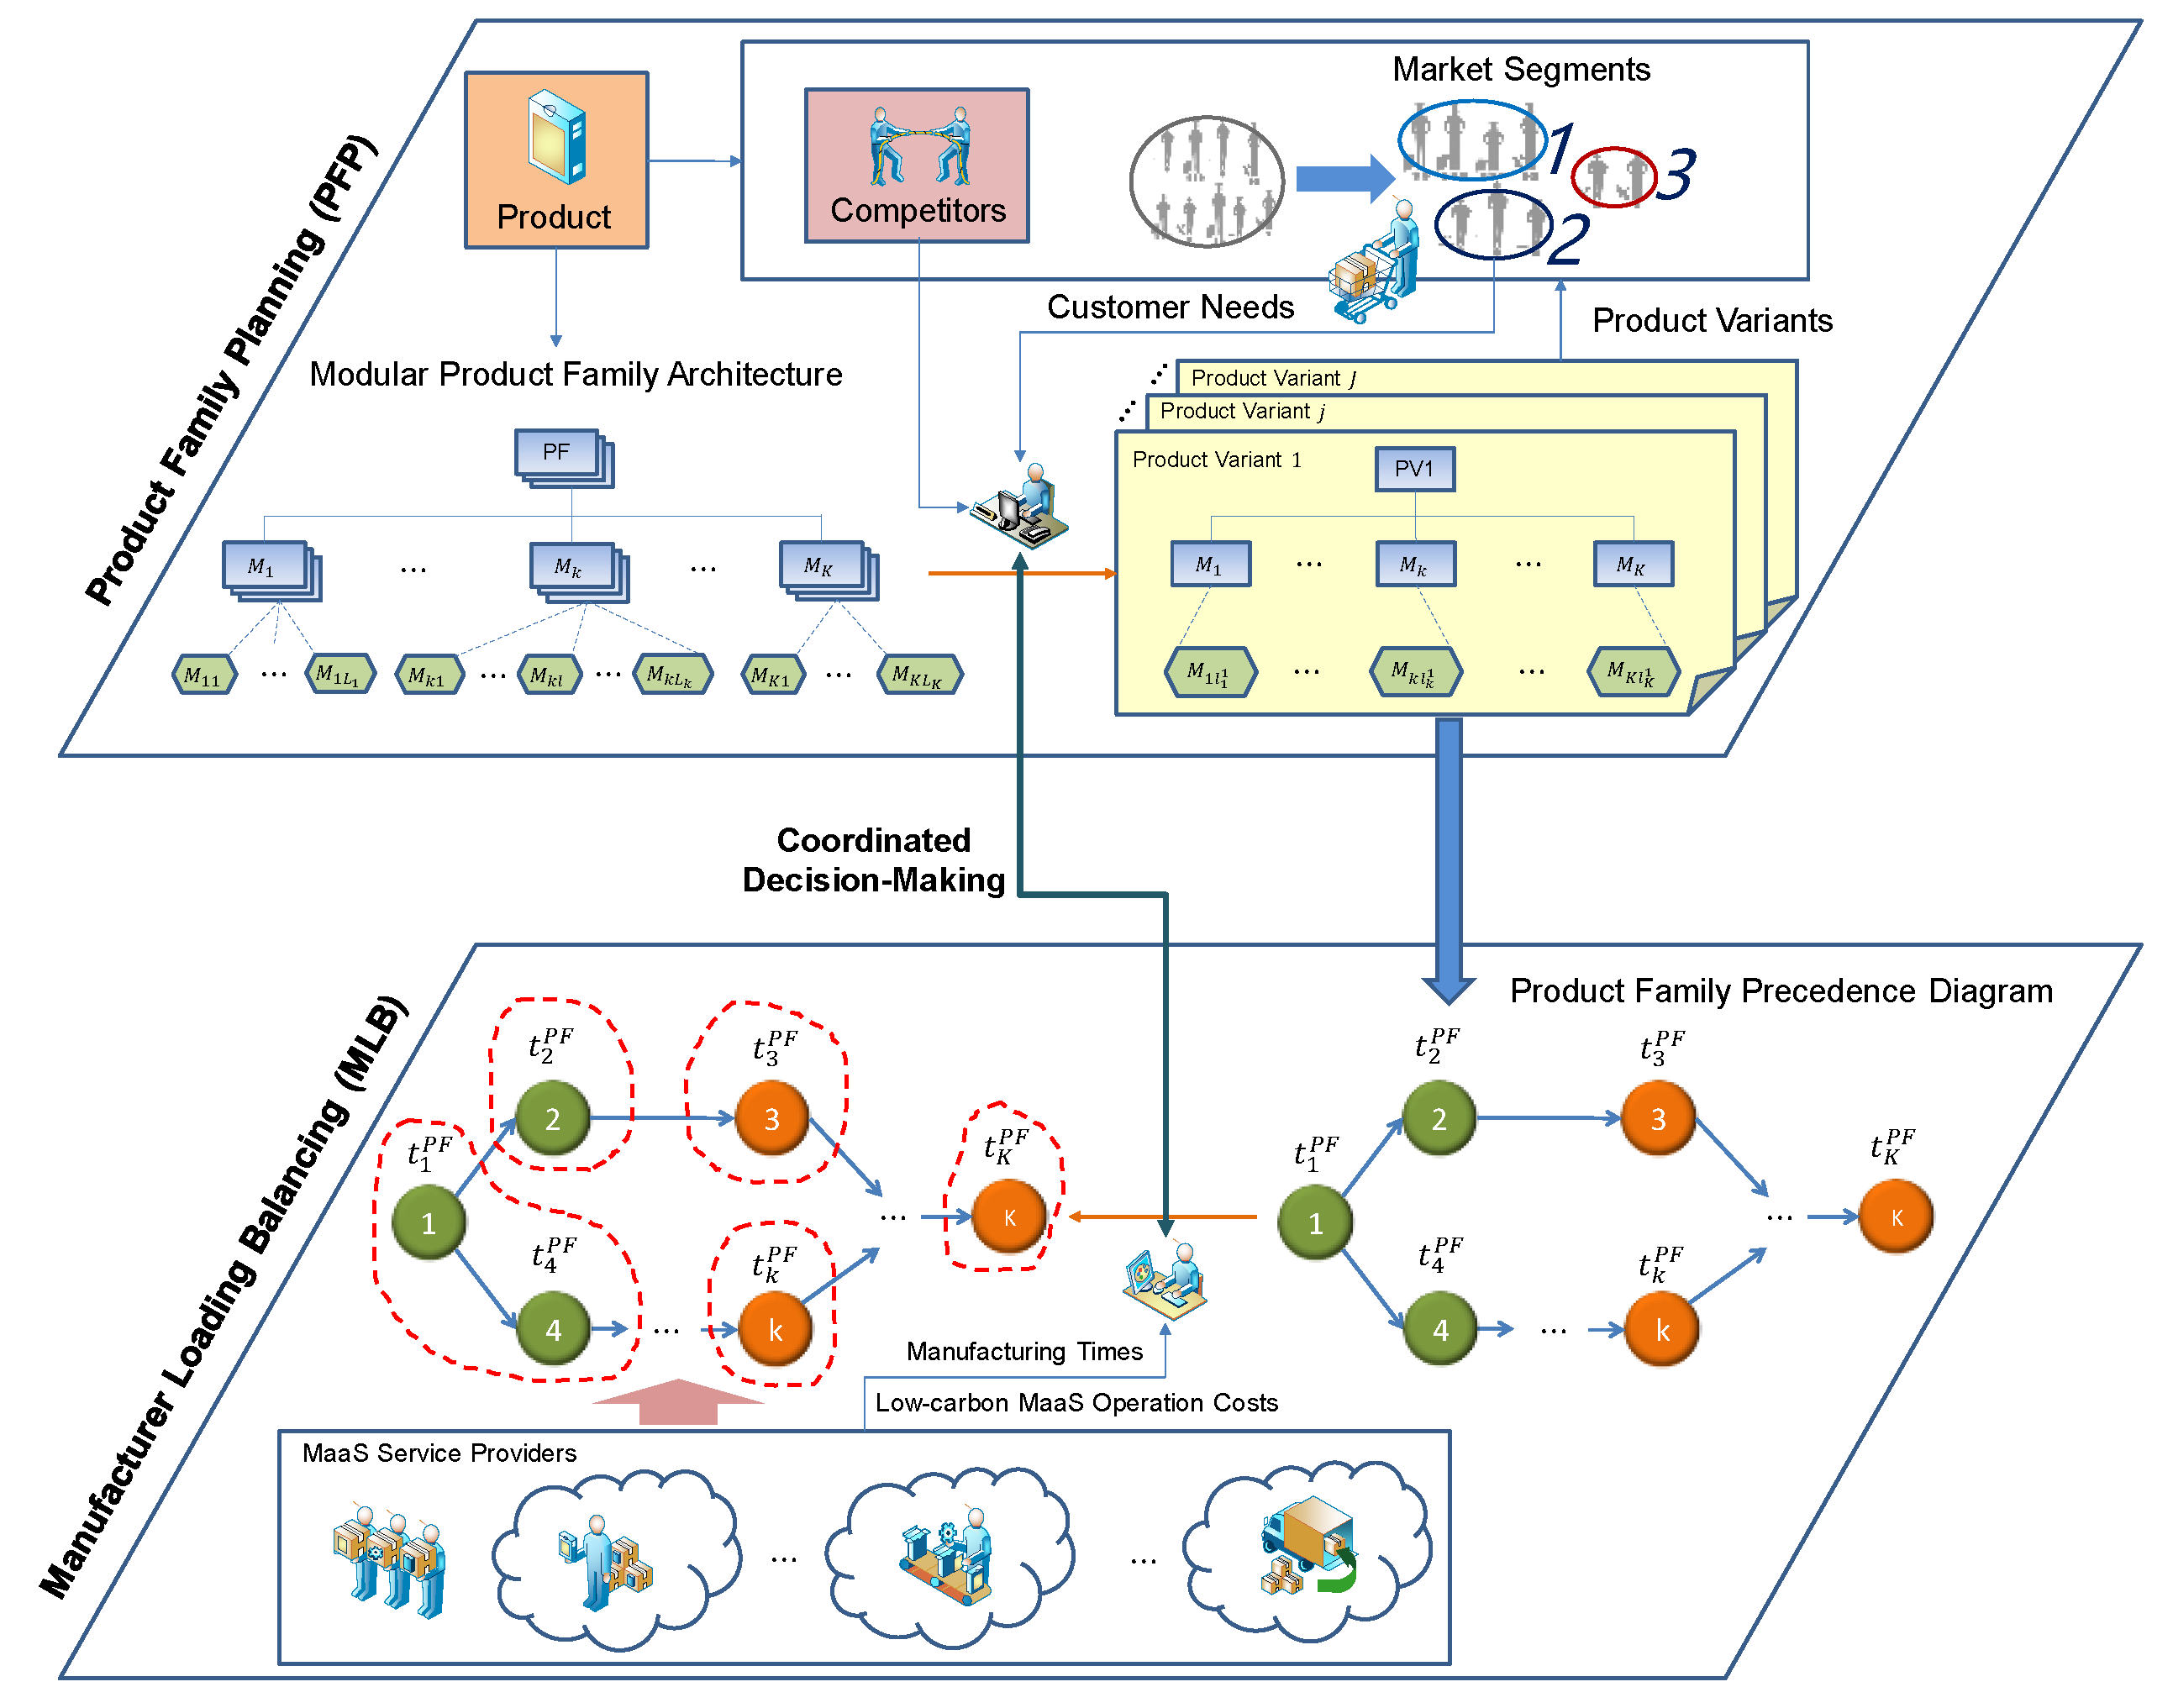
The decision making for low-carbon PFP and MaaS operational planning for the WS Company is shown in Figure 1. The first layer is the developed WS product family modular architecture, which contains six common modules, i.e., wall tile (M1), suspended ceiling (M2), floor tile (M4), cupboard (M5), kitchen sink (M6), and wall cupboard (M8), and four variable modules, i.e., cooker hood (M3), gas stove (M7), LED lamp (M9), and refrigerator (M10). The number of module instances for variable modules M3, M7, M9, and M10 are three, two, two, and three, respectively. For example, there are three module instances for M10, i.e., null instance, single-door refrigerator, and double-door refrigerator. J different product variants are configured in the process of PFP based on the WS product family architecture, as shown in the second layer. For each product variant in the product family, one precedence diagram of the manufacturing route is determined, as shown in the third layer. The node represents a manufacturing task that joins one model to the previously completed submanufacturing task; the number outside the node is the manufacturing time for the corresponding task, and the arc indicates the manufacturing order. The fourth layer obtains the product family precedence diagram and the manufacturing task assignment. The last layer shows service pools linked to the developed manufacturing platform, and each service pool includes a few related MaaS service providers.
In this example, the decisions to be made for the WS Company and the manufacturing platform include the following: determining the optimal configuration of the product variants in the WS custom kitchen product family, considering marketing and engineering factors such as customer preferences, low-carbon MaaS operation costs, etc.; determining the optimal assignment of tasks to manufacturers and the optimal number of MaaS service providers in order to balance manufacturer loads.

3.2. Problem Description

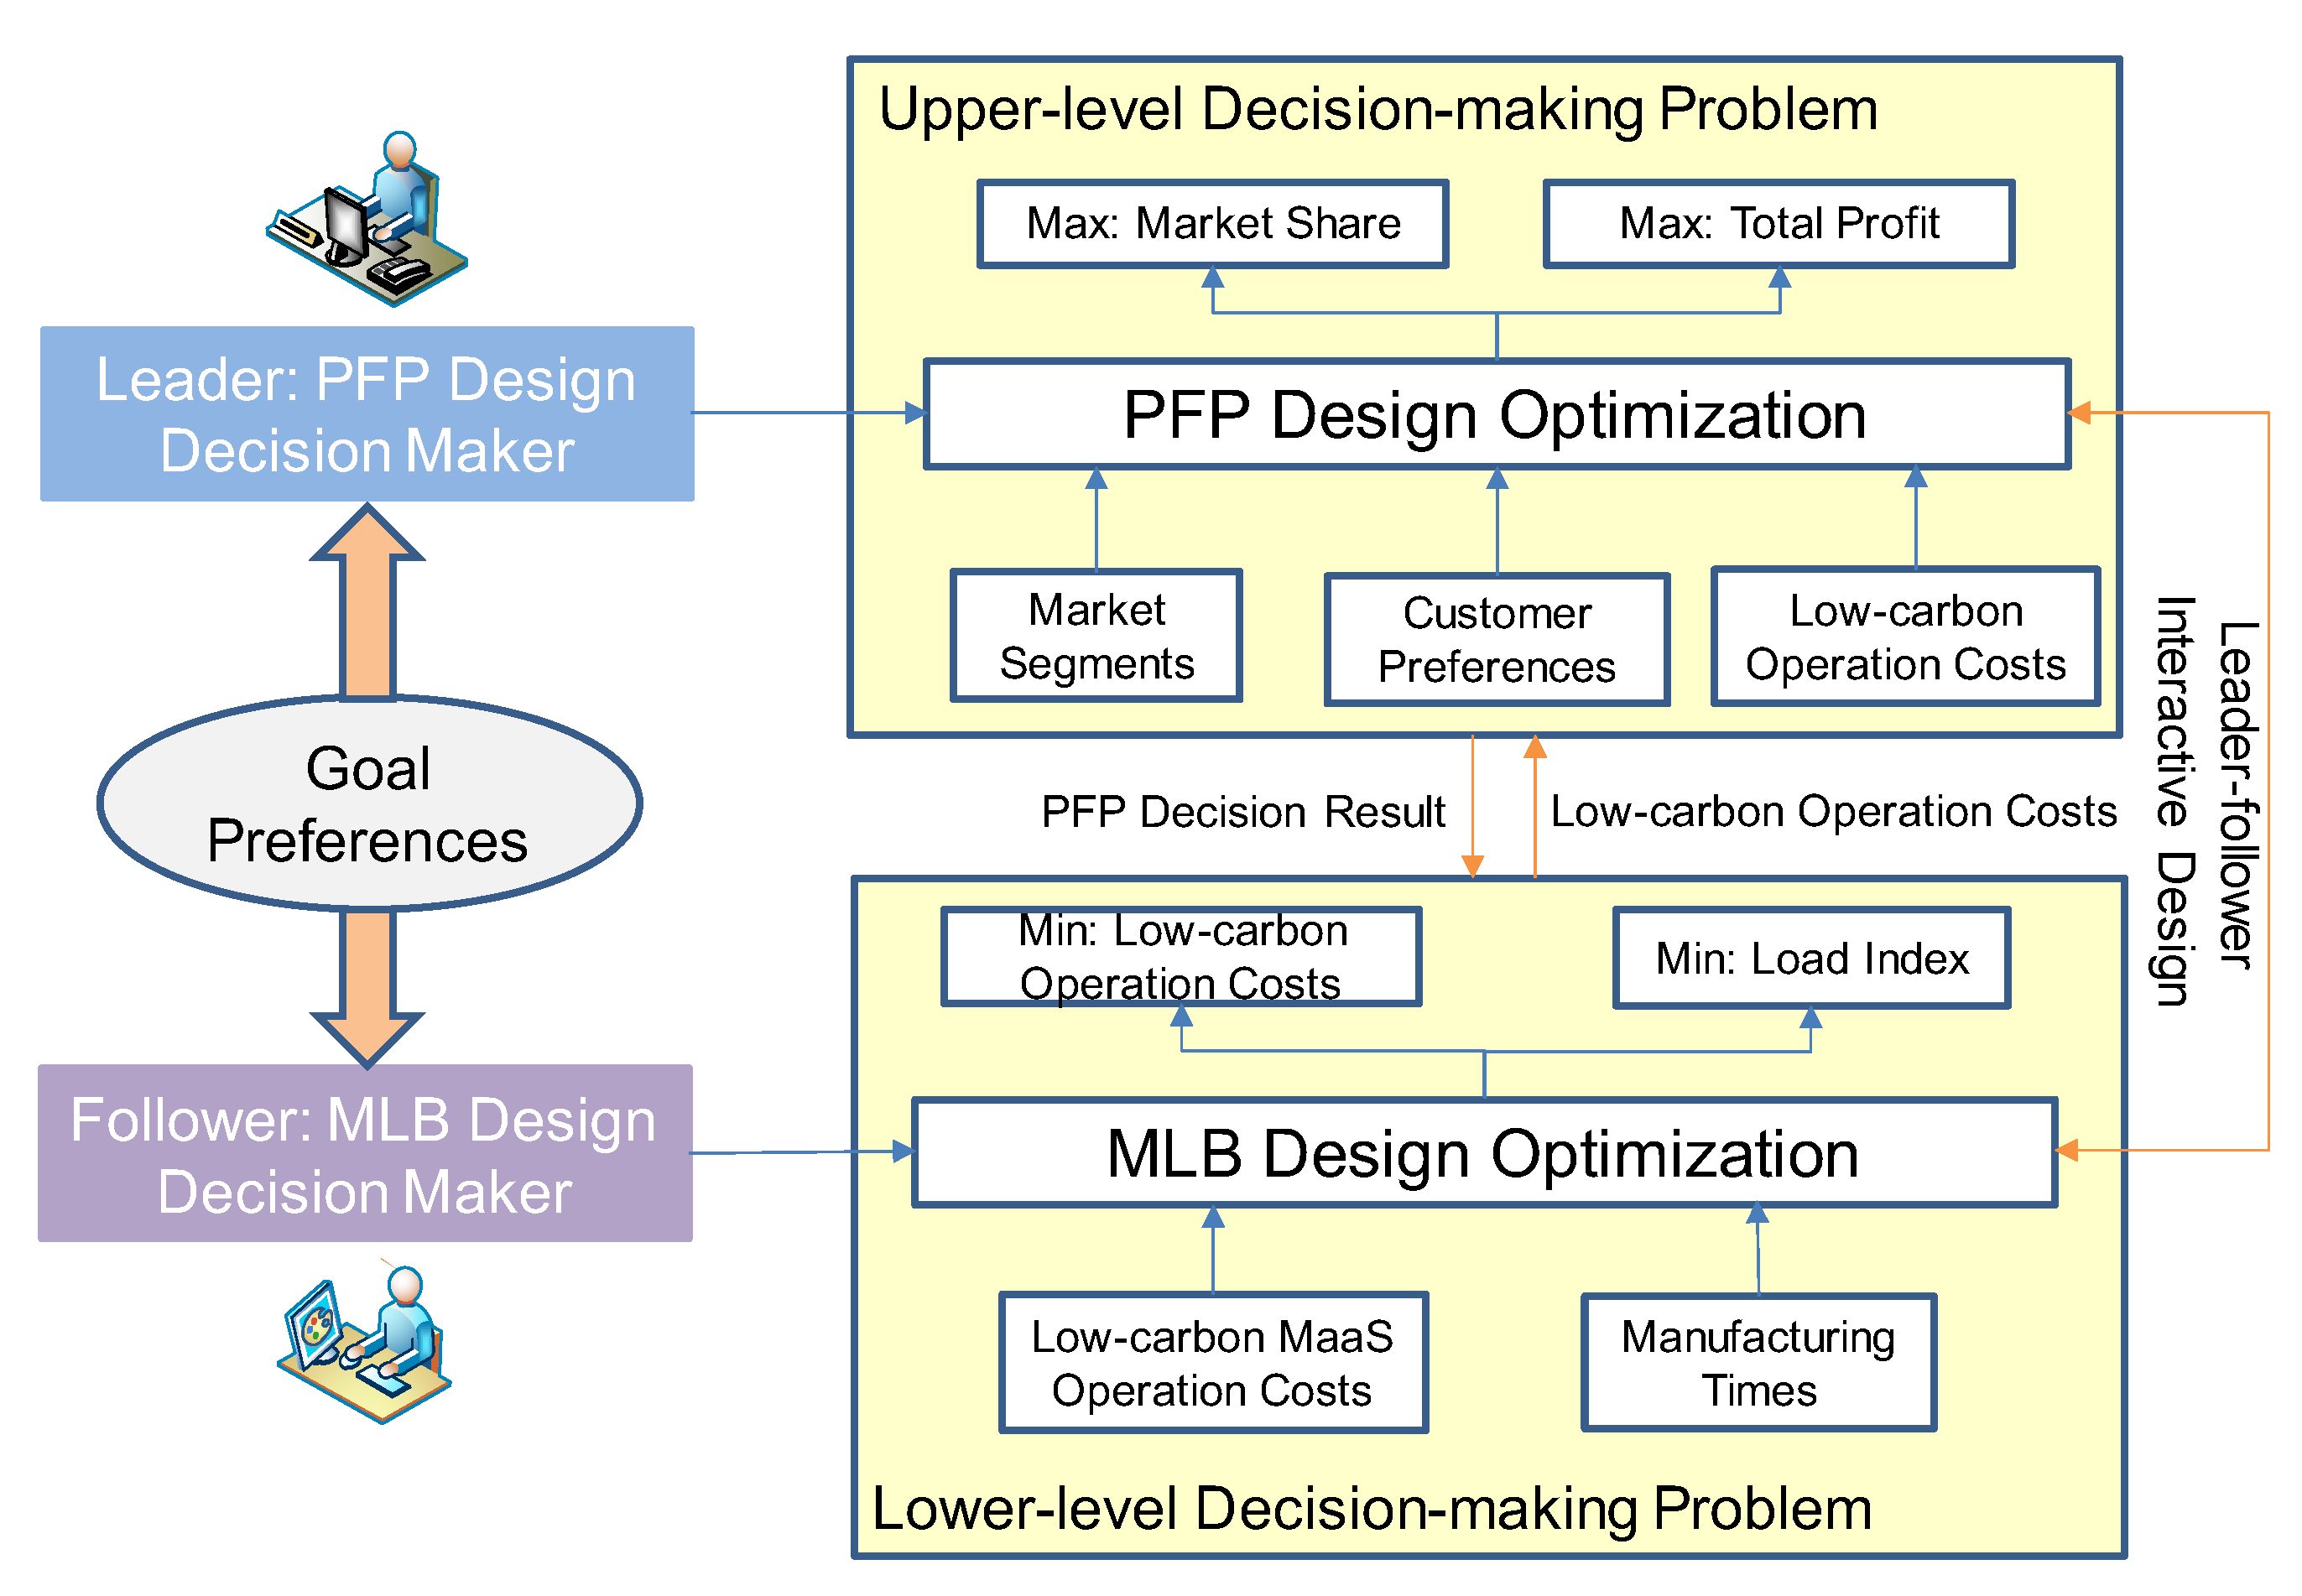
The problem of coordinated decision making for low-carbon PFP and MLB in MaaS is shown in Figure 2. It can be described as follows: to satisfy the diversified needs of customers in a competitive market with lower cost and higher efficiency, one company plans to offer a family of product variants by adopting the MaaS model. In PFP, a modular product family architecture with several common modules and selective modules has been developed as the foundation for product configuration. Based on the designed product family architecture, different module instances of variable modules can be combined with common modules as product variants, considering customer, competition, and cost factors. The manufacturing services of these product variants can been provided by external suppliers, i.e., MaaS service providers, through a certain service-oriented manufacturing platform. The goal of the coordinated decision-making process of low-carbon PFP and MLB is to simultaneously determine the optimal configuration of each product variant in the product family, obtain the product family precedence diagram, and partition the manufacturing tasks among manufacturers according to competitive products, customer needs, MaaS low-carbon operation costs, and manufacturing times, with the objective of maximizing the market share and maximizing the total profit of the planned product family.

3.3. Leader–Follower Interactive Mechanism

Since manufacturing becomes a service in MaaS, the traditional integrated product fulfillment is transformed into a distributed product fulfillment based on collaborative negotiation in open design and manufacturing [5,6,20]. In this scenario, low-carbon PFP and MLB decision making in MaaS can be done by different decision makers, and the joint design decision making is then done under a certain coordination mechanism. Here, the coordinated decision making for low-carbon PFP and MLB for MaaS can be regarded as a distributed collaborative design optimization problem, which can be dealt with using a leader–follower game theoretic approach [19].
Figure 3 illustrates the leader–follower interactive decision-making mechanism for joint design of low-carbon PFP and MLB for MaaS. The PFP design decision maker plays a leader’s role and handles the upper-level decision-making problem, i.e., PFP design optimization. The goal of the upper-level problem is to optimize the selection and configuration of product variants to maximize the market share M S and total profit T P of the product family, in which considerations about market segments, customer preferences, and low-carbon MaaS operation costs should be incorporated. The MLB design decision maker acts as a follower and deals with the lower-level decision-making problem, i.e., MLB design optimization. After obtaining the PFP decisions derived from the upper-level optimization, the lower-level MLB aims to partition the manufacturing tasks among manufacturers to minimize the low-carbon MaaS operation costs O C and the load index L I . During the formulation of the lower-level problem, the main influencing factors are the MaaS service provider’s low-carbon operation costs and the manufacturing times of module instances. The total low-carbon MaaS operation cost O C obtained in the lower-level optimization will be fed back to the upper-level, and the leader will then adjust the PFP decisions to maximize his own interest according to these cost figures. This distributed bilevel collaborative optimization of PFP and MLB proceeds in an interactive manner until a leader–follower equilibrium solution is achieved based on the Stackelberg game. In addition, instead of assigning subjective weights, the preferences for each goal using physically meaningful preference ranges should be considered for both the upper-level PFP and lower-level MLB design decision makers.

4. Joint Optimization of Low-Carbon PFP and MLB

4.1. Upper-Level PFP

The upper-level PFP design decision-making process aims to select the optimal product portfolio and determine the optimal configuration of each product variant with the objective of maximizing the market share and maximizing the total profit in the product family.
According to the commonly used linear-additive part-worth utility model [22] in conjoint analysis in marketing, the perceived utility U s j that customers in the s -th market segment can obtain by purchasing the j -th product variant can be formulated as follows:
U s j = k = 1 K l = 1 L k ( u s k l c k l ) x j k l ,             s = 1 ,   2 ,   ,   S ,       j = 1 ,   2 ,   ,   J
where u s k l is the part-worth utility of the l -th module instance of the k -th module for the s -th market segment, c k l is the cost for buying one unit of the l -th module instance of the k -th module, and x j k l is the decision variable which indicates whether (1) or not (0) the l -th module instance of the k -th module is assigned to the j -th product variant. Following the traditional multinomial logit choice model [55] for product family positioning in marketing, the probability P s j that customers in the s -th market segment purchase the j -th product variant in the product family can be formulated as follows:
P s j = exp ( μ U s j ) j = 1 J η j exp ( μ U s j ) + ν = 1 N C exp ( μ U s ν C ) + κ = 1 N E exp ( μ U s κ E ) ,     s = 1 ,   2 ,   ,   S ,       j = 1 ,   2 ,   ,   J
Thus, the total market revenue M R of the product family can be obtained by first multiplying the revenue of each product variant by the demand for this product variant, and then adding all the product variant revenue, which can be formulated as follows:
M R = s = 1 S j = 1 J k = 1 K l = 1 L k Q s P s j c k l x j k l η j
where η j is the decision variable which indicates whether (1) or not (0) the j -th product variant is selected in the planned product family.
One objective of the upper-level PFP optimization problem is to maximize the total profit T P of the product family, which is the difference between the total market revenue M R and the total MaaS low-carbon operation cost O C of the product family, i.e.,
T P = M R O C = s = 1 S j = 1 J k = 1 K l = 1 L k Q s P s j c k l x j k l η j O C
The other objective is to maximize the market share M S of the product family, which can be formulated as follows:
M S = 1 s = 1 S Q s s = 1 S j = 1 J Q s P s j η j

4.2. Lower-Level MLB

When the upper-level PFP decisions have been determined, the lower-level MLB design decision-making process seeks the optimal partition solution of the manufacturing tasks among manufacturers in order to minimize the MaaS low-carbon operation cost of product variants and balance the loads among manufacturers.
Following an approach based on fixed costs and variable costs, the overall MaaS low-carbon operation costs O C of the product family can be formulated as follows:
O C = m = 1 M ( C M a a S f i x + C M a a S v a r T P L ) ξ m
where C M a a S f i x is the low-carbon fixed cost for each MaaS service provider and C M a a S v a r is the low-carbon variable operation cost for each MaaS service provider per unit time. The corresponding low-carbon costs ( C M a a S f i x , C M a a S v a r ) can be obtained based on the carbon emissions generated in the manufacturing process using the scaling parameter method by [35].
The load of the whole manufacturing process should be balanced, which is to say that the total manufacturing time allocated to each manufacturer should be as equal as possible. The load index among manufacturers L I can be defined by the standard deviation of manufacturing loads, i.e.,
L I = [ 1 M 1 m = 1 M ( k = 1 K t k P F y k m T P L s = 1 S j = 1 J Q s P s j ξ m ) 2 ] 1 2
where T P L is the planned life of the MaaS operations and t k P F is the product family manufacturing time for the k -th module, which can be computed as the weighted sum of the manufacturing task times for each product variant in the product family, i.e.,
t k P F = j = 1 J l = 1 L k t k l x j k l s = 1 S Q s P s j s = 1 S j = 1 J Q s P s j ,             k = 1 ,   2 ,   ,   K

4.3. Bilevel Optimization Model

LPP is adopted in both the upper-level and lower-level optimization, and it allows the PFP and MLB decision makers to represent their preferences for each goal using physically meaningful preference ranges [61]. Linear physical programming (LPP) was proposed by Messac et al. [61] as a novel approach to multiple objective optimization. The application of LPP involves the following four steps: (1) Identify each decision criterion as Class 1S (Smaller is Better), Class 2S (Larger is Better), Class 3S (Value is Better), or Class 4S (Range is Better); (2) Define the desirability ranges for each decision criteria: ideal, desirable, tolerable, undesirable, highly undesirable, and unacceptable; (3) Calculate the values of the weights using the algorithm developed by [61] or [23]; (4) Formulate a common deviation function to evaluate the alternatives. LPP has been applied in industrial engineering and product engineering [62,63,64,65,66]. For example, Ilgin et al. [24] developed a LPP-based disassembly line balancing method to balance a mixed-model disassembly line. A comprehensive review of different variants and applications of physical programming can be found in [67].
The bilevel joint optimization model of low-carbon PFP and MLB can be formulated as below based on the Stackelberg game, according to the aforementioned objective functions and linear physical programming.
Min   Z 1 = i = 1 2 k = 1 4 ( w i k d i k + w i k + d i k + )
Subject to
T P min ( T P T P Target m + 1 , 0 ) T P Target m + d 1 m d 1 m + = 1             m = 1 , 2 , , 4
M S min ( M S M S Target m + 1 , 0 ) M S Target m + d 2 m d 2 m + = 1           m = 1 , 2 , , 4
l = 1 L k x j k l = 1 ,             j = 1 ,   2 ,   ,   J ,       k = 1 ,   2 ,   ,   K
k = 1 K l = 1 L k | x j k l x j k l | > 0 ,           j = 1 ,   2 ,   ,   J ,       j = 1 ,   2 ,   ,   J ,       j j  
U s j = k = 1 K l = 1 L k ( u s k l c k l ) x j k l ,             s = 1 ,   2 ,   ,   S ,       j = 1 ,   2 ,   ,   J
P s j = exp ( μ U s j ) j = 1 J η j exp ( μ U s j ) + ν = 1 N C exp ( μ U s ν C ) + κ = 1 N E exp ( μ U s κ E ) ,     s = 1 ,   2 ,   ,   S ,       j = 1 ,   2 ,   ,   J
T P T P Target 5
M S M S Target 5
x j k l ,   η j { 0 , 1 }
Min   Z 2 = i = 3 4 k = 1 4 ( w i k d i k + w i k + d i k + )
Subject to
O C max ( O C O C Target m + 1 , 0 ) O C Target m + d 3 m d 3 m + = 1         m = 1 , 2 , , 4
L I max ( L I L I Target m + 1 , 0 ) L I Target m + d 4 m d 4 m + = 1         m = 1 , 2 , , 4
m = 1 M y k m = 1 ,             k = 1 ,   2 ,   ,   K
s = 1 S j = 1 J k = 1 K l = 1 L k t k l x j k l Q s P s j y k m T P L ξ m ,             m = 1 ,   2 ,   ,   M
x k m θ = 1 m x h θ ,             k = 1 ,   2 ,   ,   K , m = 1 ,   2 ,   ,   M ,       h P r e ( k )
O C O C Target 5
L I L I Target 5
y k m { 0 , 1 }   and   ξ m 0 ,   ξ m   is   an   integer
The upper-level objective function Z 1 in Equation (9) is a common deviation function, which is formulated as a weighted sum of the deviation variables d i k , d i k + ( i = 1 , 2 ; k = 1 , 2 , , 4 ). These deviation variables can be obtained by Constraints (10) and (11) where T P Target k and M S Target k are the physically meaningful target values at the desirability level k for the goals T P and M S , respectively ( k = 1 , 2 , , 5 ). These target values are specified by the PFP design decision maker to quantify the preferences associated with the T P and M S criteria. Different from assigning subjective weights, the weights w i k and w i k + ( i = 1 , 2 ; k = 1 , 2 , , 4 ) can be determined by the linear physical programming weight algorithm proposed in [23]. Similarly, the common deviation function Z 2 in Equation (19) is the lower-level objective function, which is a weighted sum of the deviation variables d i k , d i k + ( i = 3 , 4 ; k = 1 , 2 , , 4 ) derived from Constraints (20) and (21).
To establish the bilevel optimization model, some additional constraints of relationships among decision variables are required. Constraint (12) is the exclusiveness condition, which indicates that exactly one and only one module instance can be selected for each selective module of one product variant. Constraint (13) is the divergence condition, which requires that at least one module instance is different between any two product variants. Constraint (22) is the occurrence constraint, which ensures that each task is assigned to exactly one manufacturer, since tasks are indivisible work elements. Constraint (23) is the time constraint, which ensures that the total manufacturing time for tasks assigned to this manufacturer does not exceed the time available at this manufacturer. Constraint (24) is the precedence constraint, which enforces the rule that the resulting sequence of manufacturing tasks cannot violate the precedence constraints among these tasks. Constraints (16), (17), (25), and (26) indicate that the fifth-level values T P Target 5 , M S Target 5 , O C Target 5 , and L I Target 5 are unacceptable. The values of decision variables x j k l ,   η j ,   y k m ,   ξ m are restricted in Constraints (18) and (27).

5. Design of NBGA

In this section, a NBGA is developed to find the optimal or near-optimal solution of the bilevel optimization model with linear physical programming. The NBGA is a nested sequential approach, in which the PFP and MLB decision-making processes are solved sequentially by the traditional single-level genetic algorithm (GA) and the lower-level GA is performed for each feasible upper-level solution.

5.1. Flow Chart of NBGA

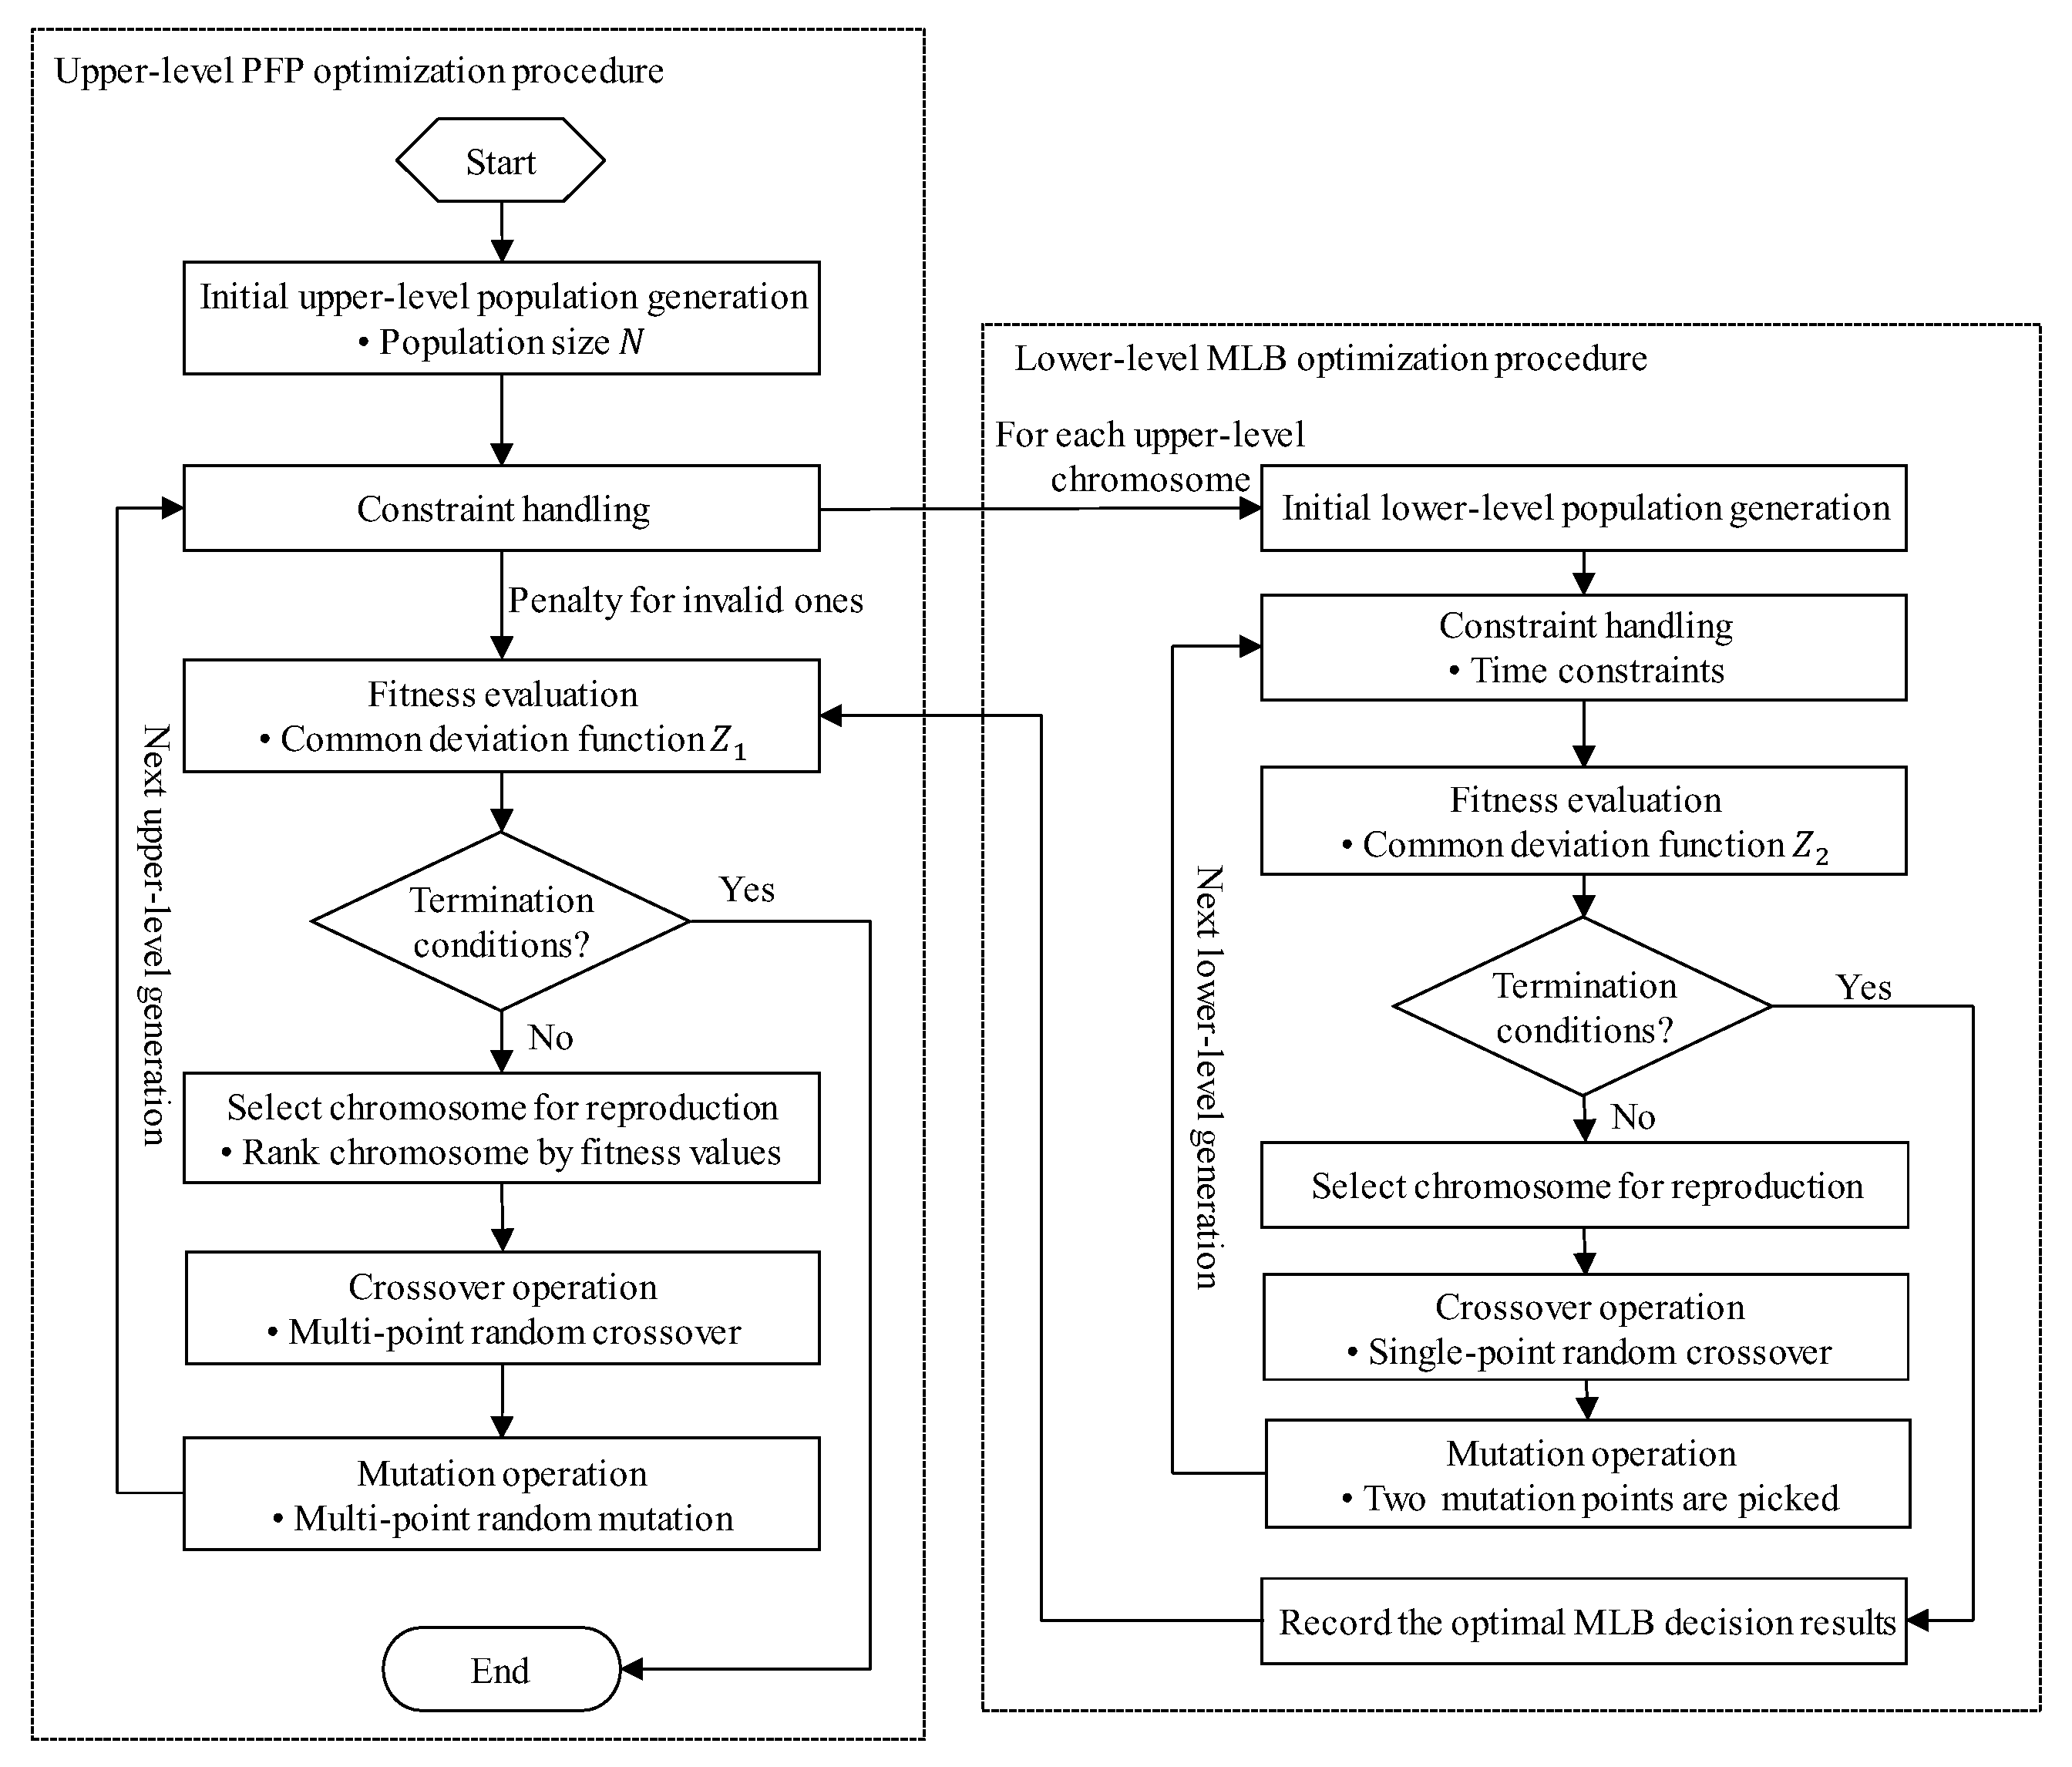
The flow chart of the NBGA algorithm is shown in Figure 4.
A step-by-step procedure for the NBGA algorithm is described below:
Step 1: Initialization. Upper-level PFP and lower-level MLB solutions are encoded (see Figure 5). An upper-level PFP initial population with size N is generated randomly and constraint handling is carried out such that each generated upper-level PFP chromosome satisfies the corresponding required constraints (Constraint (12)). Next, for each upper-level PFP chromosome, the corresponding lower-level MLB optimization procedure is executed to obtain the near-optimal lower-level solution.
Step 2: Upper-level selection operation. The upper- and lower-level chromosomes are combined, and then each upper-level chromosome is evaluated by computing a fitness value using the upper-level common deviation function Z 1 in Equation (9). By adopting the rank selection method according to these fitness values, parent chromosomes are chosen for upper-level crossover and mutation operations from the current upper-level population.
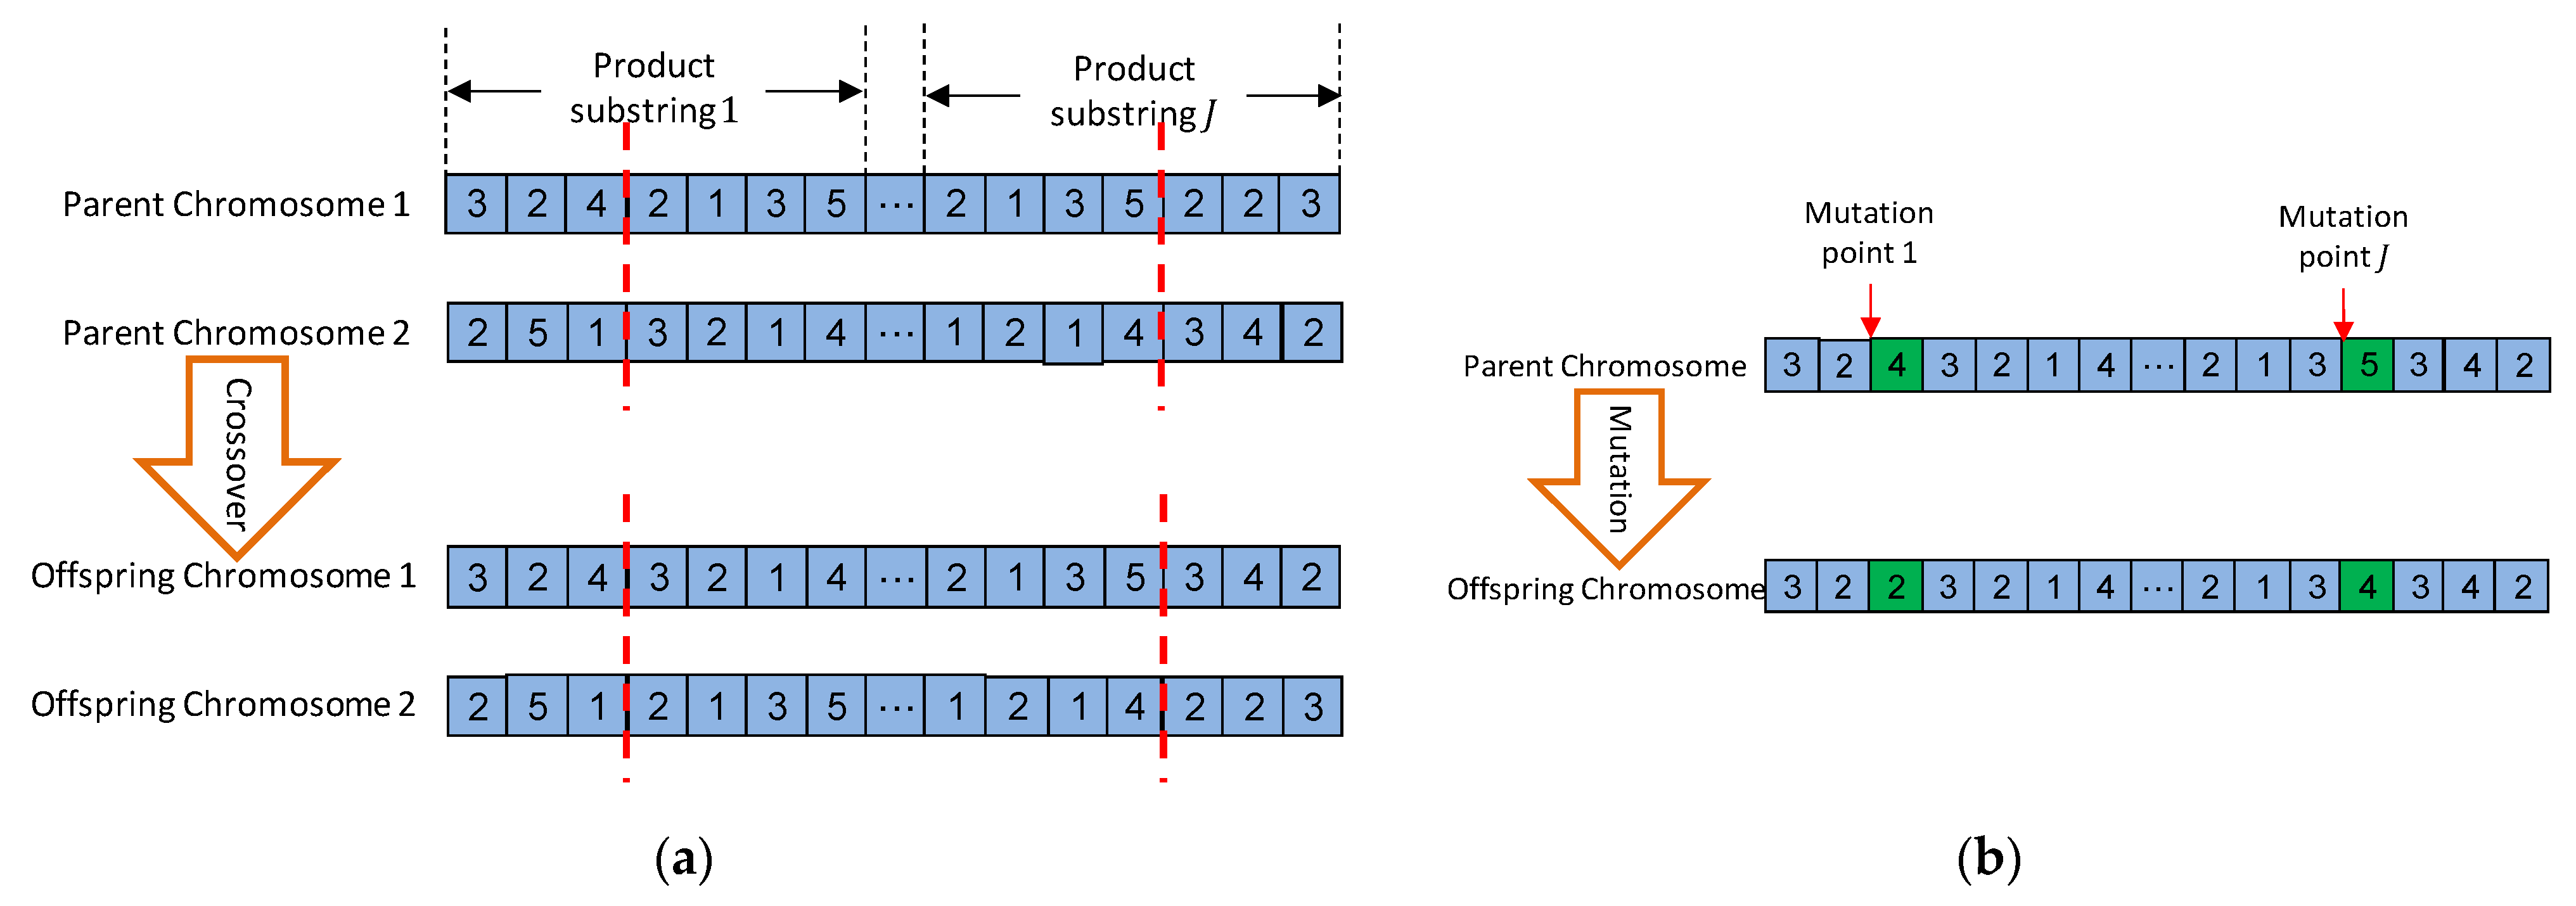
Step 3: Upper-level crossover and mutation operations. Offspring chromosomes are created by performing multipoint random crossover and mutation operators (see Section 5.2), in which single-point random crossover and mutation operators are applied, respectively, for each upper-level product variant chromosome section, as shown in Figure 6.
Step 4: Lower-level optimization. For each upper-level offspring chromosome, the corresponding upper-level PFP decision results are transferred to the lower-level MLB decision-making problem. After initializing the lower-level population, the fitness value of each chromosome is computed based on the common deviation function Z 2 in Equation (19), and a penalizing strategy is adopted to handle those invalid chromosomes that violate the lower-level constraints. Next, the lower-level selection, crossover, and mutation operations are carried out in sequence (see Section 5.3), as shown in Figure 7.
Step 5: Evaluation of offspring chromosomes. Fitness values of upper-level offspring chromosomes are evaluated by combining each upper-level PFP offspring chromosome with its corresponding lower-level MLB chromosome and then computing the upper-level common deviation value Z 1 in Equation (9).
Step 6: Examination of termination conditions. In both the upper- and lower- level GA, a maximal number of generations is specified as the criterion for the termination check. If the termination check is false, proceed to the next generation (Step 2).

5.2. Upper-Level GA

To apply GA to the upper-level PFP design decision-making process, the integer encoding strategy is adopted for the chromosome structure, as illustrated in Figure 5a. A chromosome is composed of J product variant sections, and there are K module sub-sections for each product variant section. The value l in the k th module sub-section in the j th product variant section represents that the l th module instance of the k th selective module is selected for the j th product variant. Thus, the PFP design decision making is described by a chromosome with length of K J . Each chromosome in the upper-level initial population is generated randomly to ensure the satisfaction of Constraint (12). The upper-level fitness function is the common deviation function Z 1 in Equation (9).
A single-point crossover operator is adopted for each product variant substring, and thus the crossover for the upper-level chromosome is carried out with a multipoint crossover operator, as shown in Figure 6a. Similarly, a single-point mutation operator is employed for each product variant substring, in which one mutation point is picked randomly and then the corresponding module instance is altered at random. Figure 6b illustrates the detailed process of multipoint random mutation operators.

5.3. Lower-Level GA

Figure 5b illustrates the chromosome encoding for the lower-level MLB design decision-making, and there are K manufacturing task subsections for the task sequence section. Each manufacturing task subsection, i.e., the gene, indicates the manufacturing sequence, and the value in the manufacturing task subsection, i.e., the allele, represents the corresponding task. In this research, for each lower-level chromosome in the initial population, the manufacturing task substring was generated by the top sort algorithm to satisfy the precedence constraints, i.e., Constraint (24). The lower-level fitness function is the common deviation function Z 2 described in Equation (19).
A single-point crossover operator is implemented for the task sequence substring, in which two parent chromosome exchange genetic information after selecting the crossover point randomly. To avoid generating infeasible offspring chromosomes after crossover, an improved exchange process is adopted for the task sequence substring, as illustrated in Figure 7a. Figure 7b illustrates the lower-level mutation operator. For the task sequence substring, two mutation points are picked randomly, between which the manufacturing tasks are reordered according to the product family precedence graph by the scheme of producing the initial population. Thus, the obtained offspring chromosomes are still feasible after crossover and mutation operations.

6. Case Study

6.1. Case Description

To illustrate the proposed model and algorithm, a joint low-carbon PFP and MLB design problem for WS Custom Kitchens is presented. Suppose that the WS Company plans to design a family of two WS custom kitchens, and there are one existing product and one competitive product in the market. Suppose that the customized kitchen market has been divided into three segments through market research.
The size of each market segment is given in the last row in Table 1. Table 1 also lists the utility surplus of one existing product and one competitive product for each market segment. Table 2 lists the part-worth utilities of module instances for each market segment, which can be estimated by conjoint analysis. The estimated manufacturing times are listed in the fifth column in Table 2. The estimated purchase costs of module instances are shown in the last column in Table 2. The LPP target values for the upper-level PFP goals ( T P and M S ) and the lower-level MLB goals ( O C and L I ) are shown in Table 3. Applying the algorithm described in [58], the resulting weights for both the upper- and lower-level common deviation functions are shown in Table 4. The scaling parameter μ in the MNL choice model was set to 0.75. The low-carbon fixed cost for each MaaS service provider C M a a S f i x was set to 500, and the operation cost C M a a S v a r for each MaaS service provider per unit time was set to 0.5. The total planned life T P L of the MaaS operations was assumed to be 3,000,000.

6.2. Implementation Results

To solve the bilevel optimization model for joint decision making of PFP and MLB, the proposed NBGA was applied. In the upper-level GA, the maximum number of iterations was 500, the crossover probability was 0.8, and the mutation probability was 0.2. In the lower-level GA, the maximum number of iterations was 100, the crossover probability was 0.8, and the mutation probability was 0.2. With the above assumptions, the NBGA was run using Matlab 2017b under the circumstance of Windows 10, Intel i7-7500U 2.90 GH, and Ram 8G. The running time was 3628.125 s.
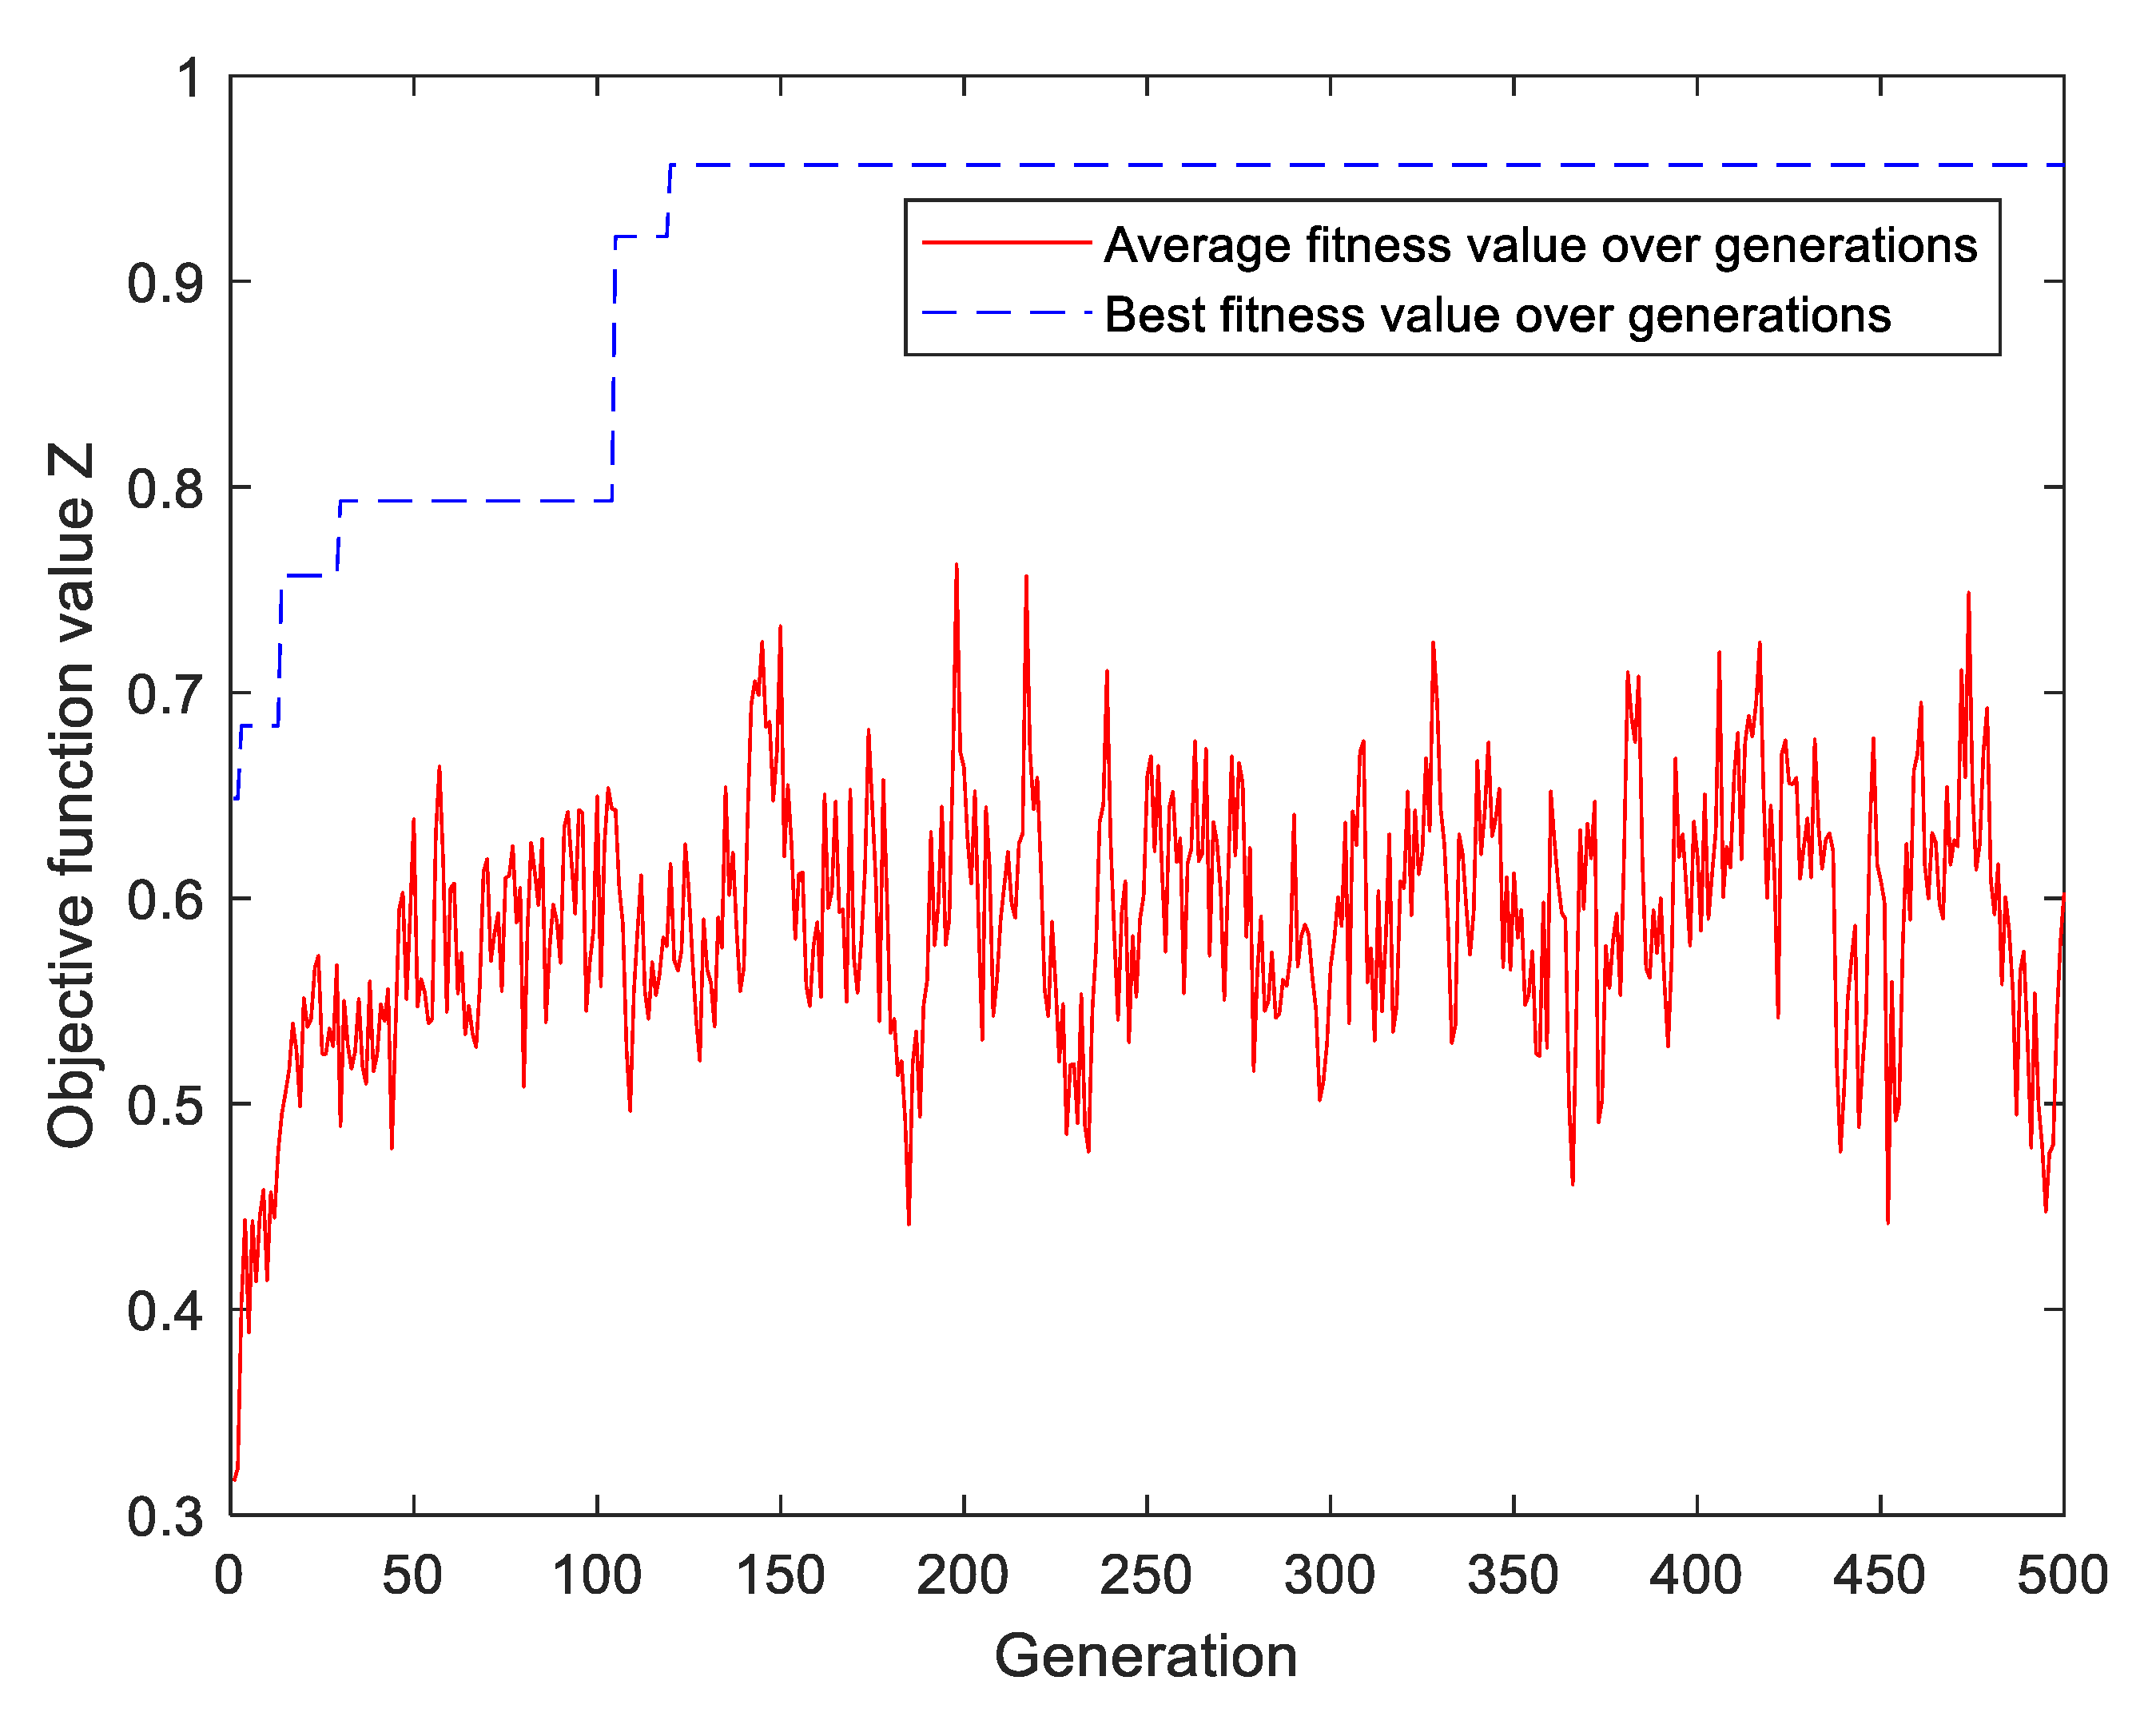
Figure 8 provides the NBGA evolution processes for the upper-level PFP and the lower-level MLB optimizations. It shows the upper-level common deviation function value Z 1 and the lower-level common deviation function value Z 2 for the best individual over generations, which illustrates the complex and dynamic interactive decision-making process between the upper- and lower- level decision problems. After 250 iterations, the optimal PFP result and the corresponding MLB result were identified, and are listed in the third column in Table 5.
As shown in Table 5, the optimal upper-level chromosome coding scheme was [1 1 2 1 1 1 2 1 2 3 1 1 1 1 1 1 2 1 2 3], the upper-level common deviation function value was 0.5721, the total profit was 1.5600 × 10 7 , and the market share was 92.05 % . The corresponding lower-level coding scheme was [1 4 5 6 2 3 7 8 9 10], the lower-level common deviation function value was 0.3820, the low-carbon operation cost was 1.9507 × 10 7 , and the load index was 1.1217. According to the lower-level MLB decision-making result, all the manufacturing tasks were assigned to nine manufacturers, within which task 1 and task 4 were assigned to the same manufacturer. The numbers of MaaS service providers were two, two, two, two, one, two, three, one, and two, respectively.

6.3. Comparison with Other Approaches

To verify the validity of the proposed method, two experiments were designed to compare the results of the bilevel approach (TBA) with those of the sequential approach (TSA), i.e., solving the PFP decision-making problems and the MLB decision-making problems sequentially in two steps, and the cooperative approach (TCA), i.e., the PFP decision maker and the MLB decision maker engage in bargaining and desire a cooperative and binding trade to maximize their collective interest (see Figure 9). For TSA, in the first step, the total low-carbon operation cost can be estimated based on historical data, and the PFP problem was solved using the upper-level GA. After obtaining the PFP results in the first step, the MLB problem was solved using the lower-level GA in the second step. In this experiment, the estimated low-carbon operation cost in the first step was set as 2.5 × 10 7 . The optimal PFP and MLB results are listed in the fourth column in Table 5.
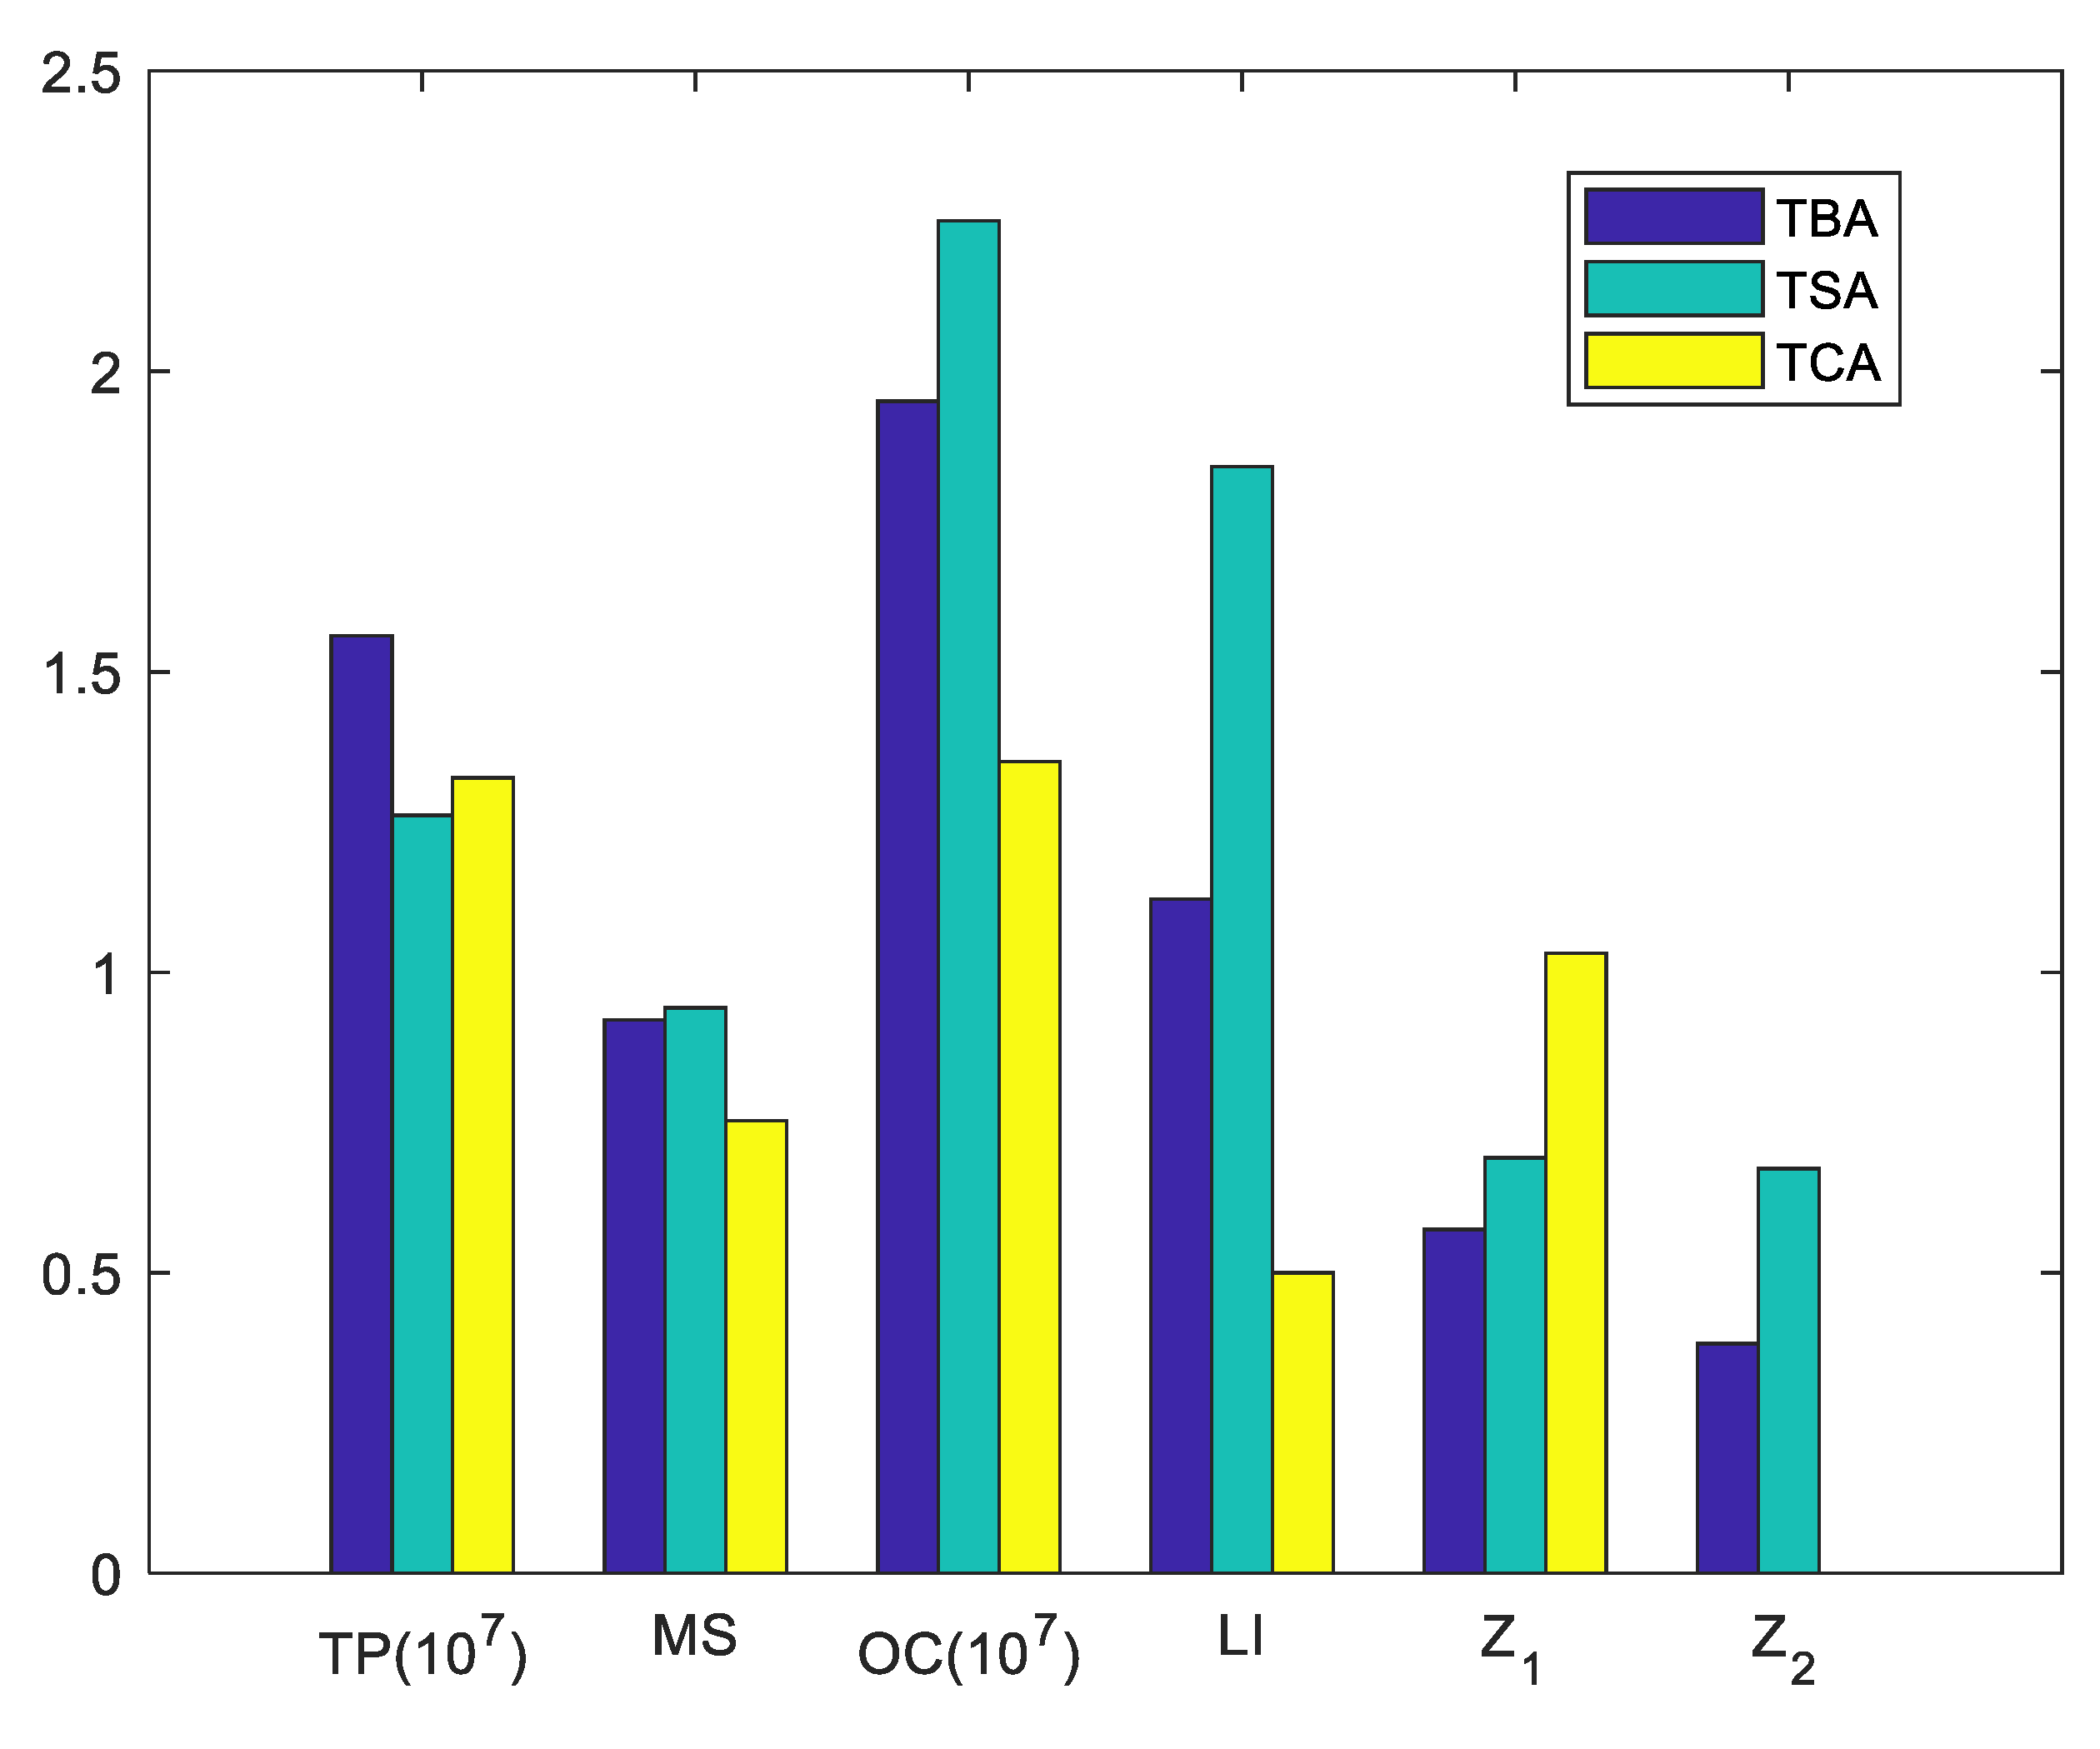
Figure 10 compares the experimental results of the bilevel approach and the sequential approach. It indicates that the total profit increased by 23.66% from   1.2615 × 10 7 (TSA) in the sequential approach to 1.5600 × 10 7 (TBA) upon adopting the bilevel approach, while the market share decreased by 2.13% from 0.9405 (TSA) to 0.9205 (TBA). Both the low-carbon operation cost and the load index obtained in the sequential approach were much higher than those obtained using the bilevel approach. For the upper-level common deviation function value Z 1 and the lower-level common deviation function value Z 2 , the results obtained by the bilevel approach were 17.24% and 43.26% less than those of the sequential approach, respectively. The reason is that the independent PFP optimization in the sequential approach considers low-carbon operation costs based on the estimation of existing historical data, and it cannot make full use of the low cost advantage brought by the interactive design between low-carbon PFP and MLB.
For TCA, the cooperative decision making of low-carbon PFP and MLB can be formulated as a bargaining model [68] which is formally one single-level optimization. In this case, the bargaining objective function between PFP and MLB in TCA can be defined as
Max   Z = ( 1 Z 1 Z 1 Z 1 Z 1 ) ( 1 Z 2 Z 2 Z 2 Z 2 )
where Z 1 and Z 1 are the upper-level best and worst common deviation function values, respectively, and Z 2 and Z 2 are the lower-level best and worst common deviation function values, respectively. The traditional GA was employed to solve the proposed single-level optimization model in TCA. Figure 9 illustrates the evolution process of the traditional GA for the cooperative approach. The optimal PFP and MLB results are listed in the last column in Table 5.
Figure 10 also compares the experimental results of the bilevel approach and the cooperative approach. While the values of T P and M S decreased 15.17% and 18.20% from TBA to TCA, respectively, the values of O C and L I decreased 30.77% and 55.42% from TBA to TCA, respectively. The upper-level common deviation function value increased 80.32% from 0.5721 (TBA) to 1.0316 (TCA), whereas the lower-level common deviation function value in TCA was close to zero and was significantly smaller than that in TBA. Since the objective function Z 1 for PFP and the objective function Z 2 for MLB are assumed to be equally important in the bargaining objective function, this phenomenon can be attributed to the greater decision-making power of the MLB decision maker in TCA.
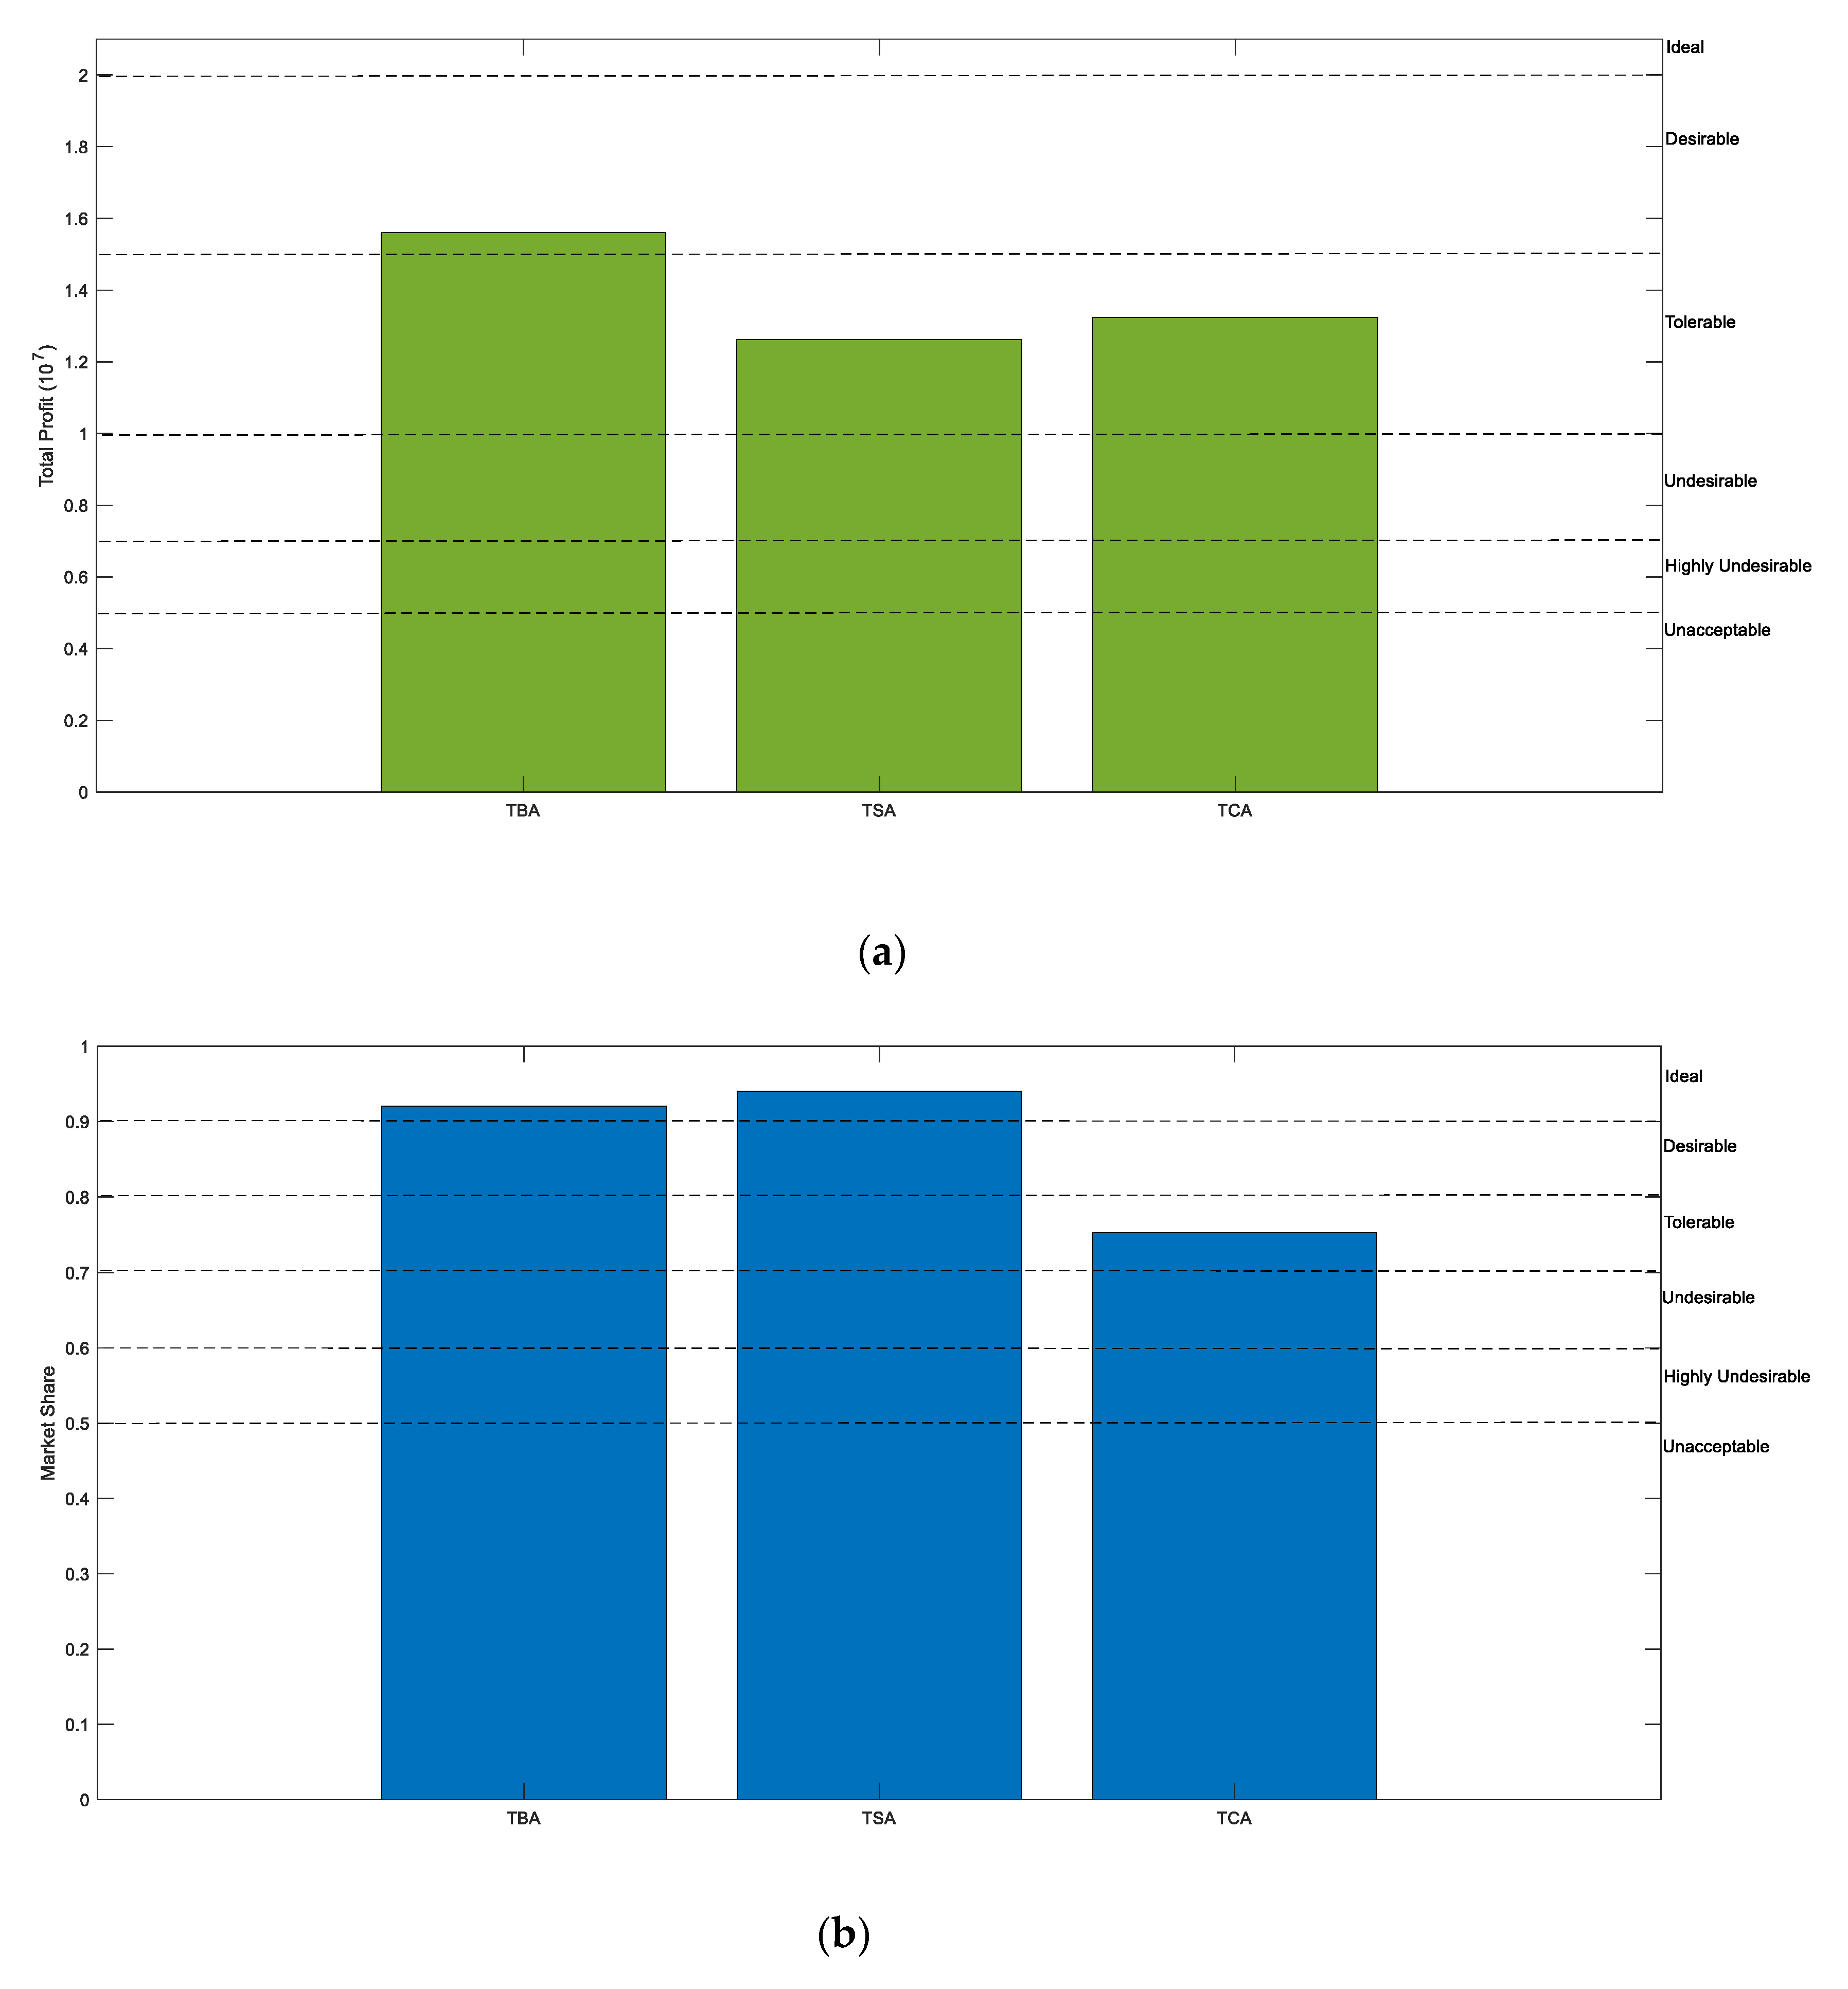
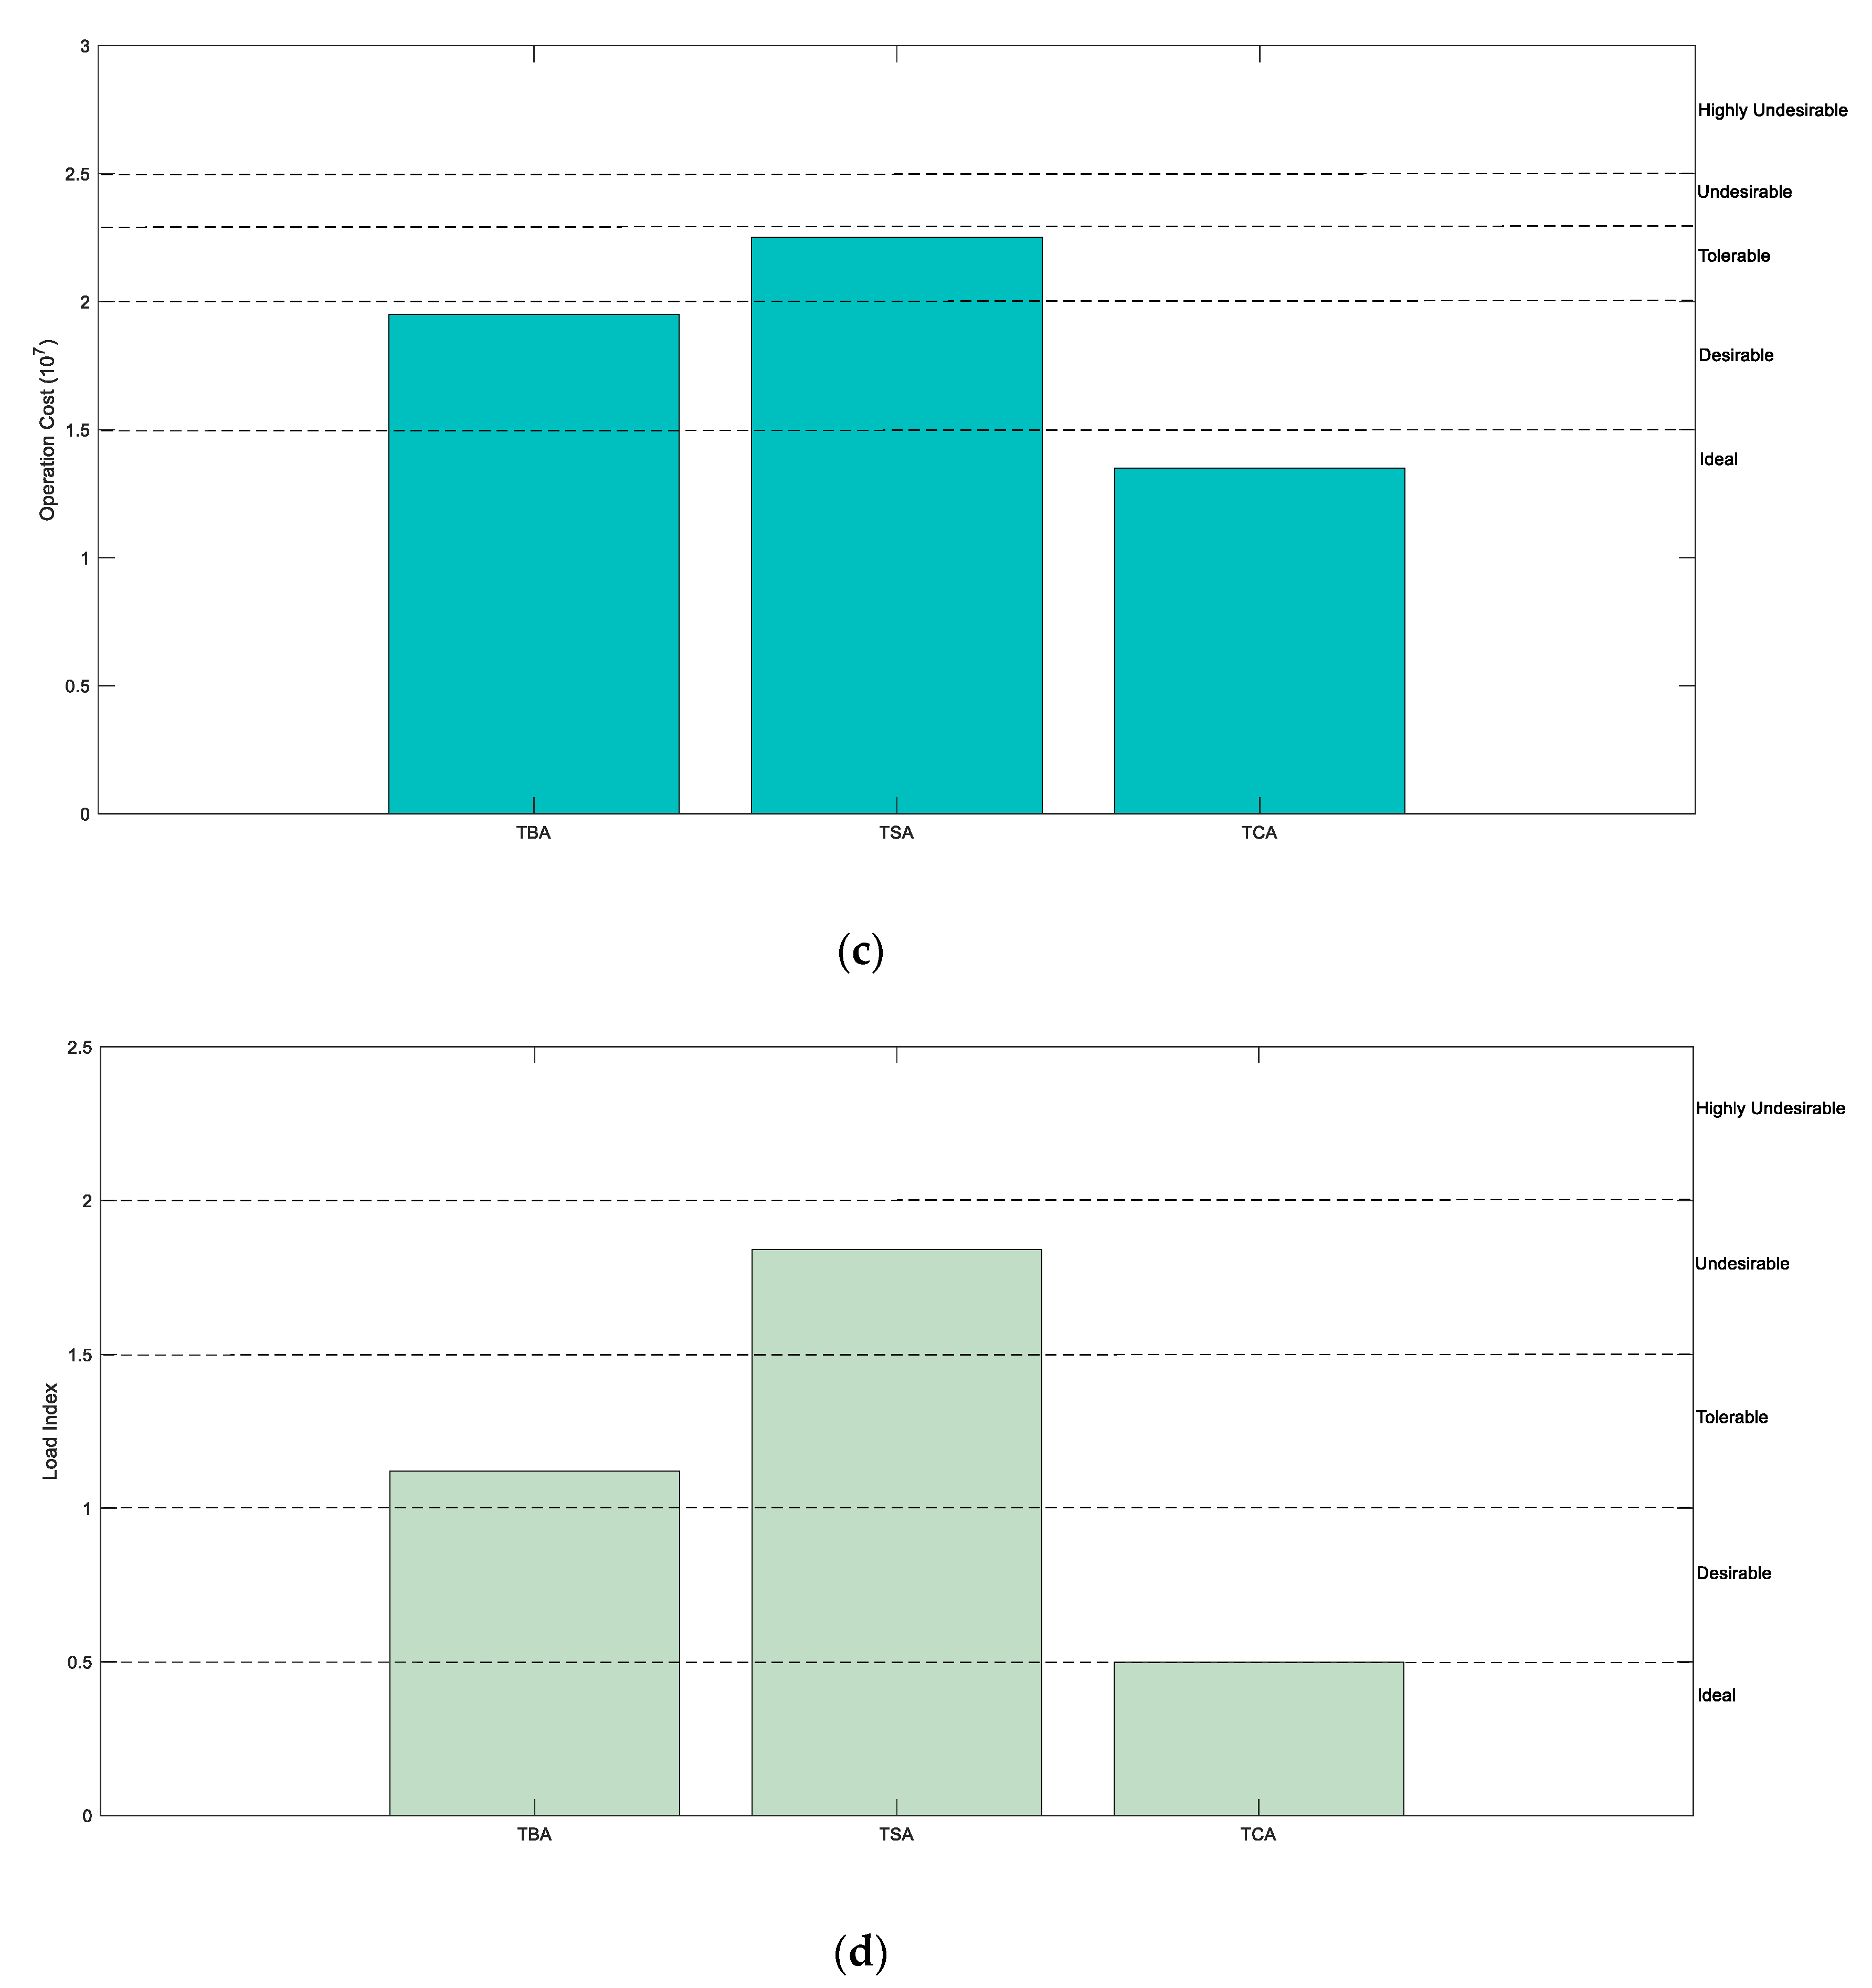
The target values of T P , M S , O C , and L I under TBA, TSA, and TCA are compared graphically in Figure 11. The values of T P and O C in TBA are in the desirable region, and those in TSA lie in the tolerable region. The value of L I in TBA is in the tolerable region, but that in TSA is in the undesirable region. Compared with TBA, the values of T P and M S in TCA are only in the tolerable region, although the values of M S and L I in TCA are in the ideal region. It can be seen that the solution obtained by adopting the bilevel approach yielded a better balance between the four objectives, i.e., T P , M S , O C , and L I , than other two approaches (TSA and TCA).

6.4. Sensitivity Analysis

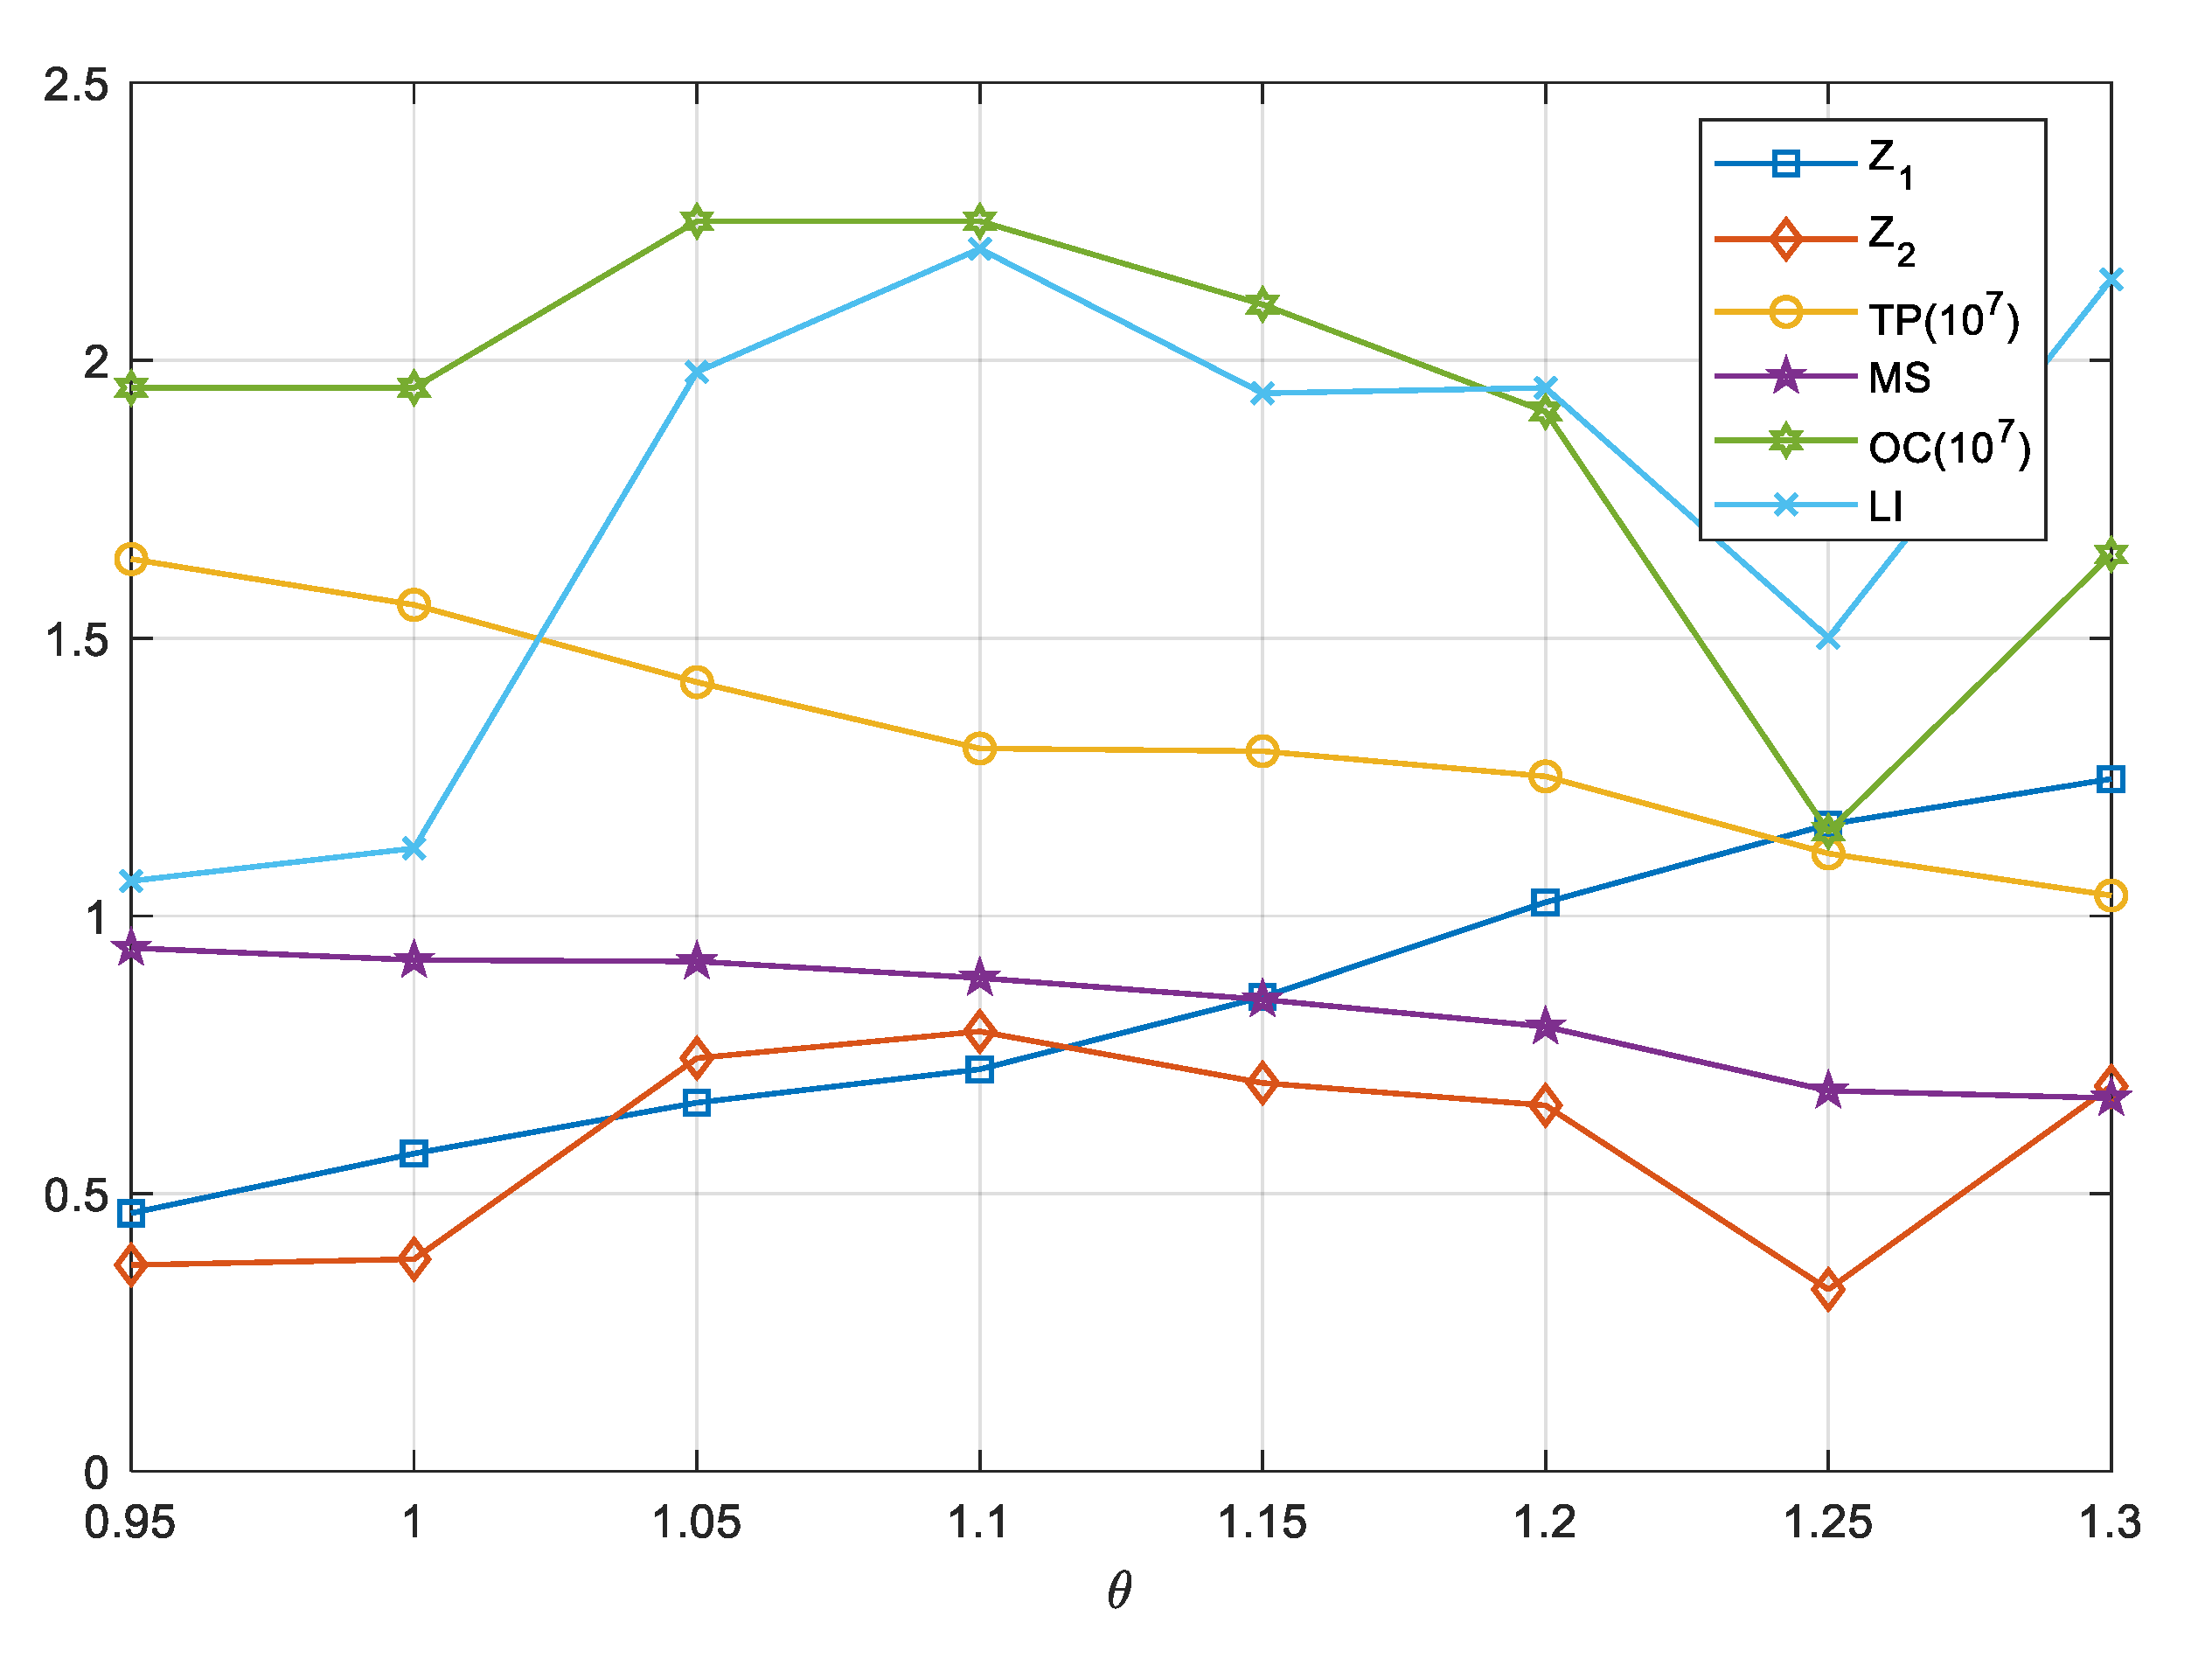
To explore the influence of competitive intensity on the objective values of upper-level PFP and lower-level MLB, the following sensitivity analysis experiment designed and performed. The competitive intensity can be represented using the utility U i j C of competitive products and U i j E of existing products in the market. Let U i j C ¯ = θ U i j C and U i j E ¯ = θ U i j E , where θ is fixed as a series of constants from 0.95 to 1.3 in steps of 0.05. The obtained results are shown in Figure 12. With the increase of the parameter θ , the upper-level objective values T P and M S decrease, and thus the upper-level common deviation function value Z 1 increases gradually. This decrease or increase makes the corresponding lower-level objective values O C and L I , as well as the lower-level common deviation function value Z 2 , fluctuate accordingly.
The managerial insight from this experiment is as follows: (1) The intensity of competition has a significant impact on the target values, including the upper-level Z 1 and the lower-level Z 2 , and thus PFP and MLB decision makers should consider the reactions of competitors more seriously in leader–follower interactive decision making; (2) With the changing customer preferences and the progress of technology in the dynamic market, it is necessary for the PFP and MLB decision makers to upgrade products and maintain a domain position in the competition. For example, they have to consider the co-planning evolution of low-carbon product families with MaaS operation systems in future.

7. Conclusions

Low-carbon PFP design considering MLB decisions in MaaS usually involves interactive decision making between various agents. A practical and effective bilevel approach for dynamic interactive design optimization of PFP and MLB is proposed based on a Stackelberg game. Consistent with the leader–follower interactive mechanism, a bilevel optimization model with linear physical programming was developed, in which the upper- and lower-level objective functions are the common deviation functions adapted from the corresponding linear physical programs. NBGA with upper-level GA for PFP and lower-level GA for MLB was designed to solve the developed model. The proposed bilevel approach was demonstrated via a joint PFP and MLB design problem for WS Custom Kitchens. Through comparison with other approaches, this bilevel approach was shown to yield satisfactory levels of achievement for PFP and MLB objectives. This approach provides an effective decision-making framework for the multi-agent online interactive design faced by enterprises adopting the MaaS model through service-oriented manufacturing platforms.
The avenues for further research are wide and include: (1) Co-evolutionary approach for solving the proposed bilevel optimization model. Due to the high computational complexity of the nested approach, it is difficult to extend the NBGA to solve large-scale bilevel optimization problems. More research on a co-evolutionary approach in which two levels proceed in parallel and exchange information is needed. (2) Uncertain interactive decision-making of low-carbon PFP and MLB. While low-carbon PFP and MLB in an uncertain environment have been separately optimized extensively in the literature, little has been done regarding the uncertain interactive decision-making processes of PFP and MLB in MaaS. (3) Co-evolution of product families and operation systems in MaaS. In service manufacturing, co-evolution of product families and operation systems over generations caused by market demand changes and technological progress is worthy of in-depth research.

Author Contributions

Writing—original draft preparation, X.L.; writing—review and editing, X.G.; supervision, R.J.J. All authors have read and agreed to the published version of the manuscript.

Funding

This research was funded by the General Project of Humanities and Social Sciences Research in Tianjin Institution of Higher Education, grant number 2017SK073.

Institutional Review Board Statement

Not applicable.

Informed Consent Statement

Not applicable.

Data Availability Statement

The relevant data is contained in this article.

Conflicts of Interest

The authors declare no conflict of interest.

References

  1. Brettel, M.; Friederichsen, N.; Keller, M.; Rosenberg, M. How Virtualization, Decentralization and Network Building Change the Manufacturing Landscape: An Industry 4.0 Perspective. World Acad. Sci. Eng. Technol. Int. J. Mech. Aerosp. Ind. Mechatron. Manuf. Eng. 2014, 8, 37–44. [Google Scholar]
  2. Chesbrough, H.W.; Appleyard, M.M. Open Innovation and Strategy. Calif. Manag. Rev. 2007, 50, 57–76. [Google Scholar] [CrossRef] [Green Version]
  3. Freitag, M.; Becker, T.; Duffie, N.A. Dynamics of resource sharing in production networks. CIRP Ann.-Manuf. Technol. 2015, 64, 435–438. [Google Scholar] [CrossRef]
  4. Kortmann, S.; Piller, F.T. Open Business Models and Closed-Loop Value Chains: Redefining the Firm-Consumer Relationship. Calif. Manag. Rev. 2016, 58, 88–108. [Google Scholar] [CrossRef] [Green Version]
  5. Kusiak, A. Service manufacturing = process-as-a-service + manufacturing operations-as-a-service. J. Intell. Manuf. 2020, 31, 1–2. [Google Scholar] [CrossRef] [Green Version]
  6. Kusiak, A. Service manufacturing: Basic concepts and technologies. J. Manuf. Syst. 2019, 52, 198–204. [Google Scholar] [CrossRef]
  7. Park, J.; Simpson, T.W. Toward an activity-based costing system for product families and product platforms in the early stages of development. Int. J. Prod. Res. 2008, 46, 99–130. [Google Scholar] [CrossRef]
  8. Jiao, J.R.; Simpson, T.W.; Siddique, Z. Product family design and platform-based product development: A state-of-the-art review. J. Intell. Manuf. 2007, 18, 5–29. [Google Scholar] [CrossRef]
  9. Pirmoradi, Z.; Wang, G.G.; Simpson, T.W. A review of recent literature in product family design and platform-based product development. In Advances in Product Family and Product Platform Design; Springer: New York, NY, USA, 2014; pp. 1–46. [Google Scholar]
  10. Jiao, J.; Zhang, Y. Product portfolio planning with customer-engineering interaction. IIE Trans. 2005, 37, 801–814. [Google Scholar] [CrossRef] [Green Version]
  11. Wang, Q.; Tang, D.; Yin, L.; Salido, M.A.; Giret, A.; Xu, Y. Bi-objective optimization for low-carbon product family design. Robot. Comput.-Integr. Manuf. 2016, 41, 53–65. [Google Scholar] [CrossRef] [Green Version]
  12. Wang, Q.; Tang, D.; Yin, L.; Ullah, I.; Salido, M.A.; Giret, A. An Optimization Method for Coordinating Supplier Selection and Low-Carbon Design of Product Family. Int. J. Precis. Eng. Manuf. 2018, 19, 1715–1726. [Google Scholar] [CrossRef]
  13. Wang, Q.; Tang, D.; Yin, L.; Ullah, I.; Tan, L.; Zhang, T. An optimization model for low carbon oriented modular product platform planning (MP 3). Int. J. Precis. Eng. Manuf.-Green Technol. 2018, 5, 121–132. [Google Scholar] [CrossRef]
  14. Wang, Q.; Tang, D.; Li, S.; Yang, J.; Salido, M.A.; Giret, A.; Zhu, H. An Optimization Approach for the Coordinated Low-Carbon Design of Product Family and Remanufactured Products. Sustainability 2019, 11, 460. [Google Scholar] [CrossRef] [Green Version]
  15. Yang, D.; Li, J.; Wang, B.; Jia, Y.J. Module-based product configuration decisions considering both economical and carbon emission-related environmental factors. Sustainability 2020, 12, 1145. [Google Scholar] [CrossRef] [Green Version]
  16. Liu, D.; Li, Z.; He, C.; Wang, S. Risk-Averse Co-Decision for Lower-Carbon Product Family Configuration and Resilient Supplier Selection. Sustainability 2021, 14, 384. [Google Scholar] [CrossRef]
  17. Monostori, L.; Kádár, B.; Bauernhansl, T.; Kondoh, S.; Kumara, S.; Reinhart, G.; Sauer, O.; Schuh, G.; Sihn, W.; Ueda, K. Cyber-physical systems in manufacturing. CIRP Ann. -Manuf. Technol. 2016, 65, 621–641. [Google Scholar] [CrossRef]
  18. Li, Z.; Wang, W.M.; Liu, G.; Liu, L.; He, J.; Huang, G.Q. Toward open manufacturing: A cross-enterprises knowledge and services exchange framework based on blockchain and edge computing. Ind. Manag. Data Syst. 2018, 118, 303–320. [Google Scholar] [CrossRef]
  19. Du, G.; Zhang, Y.; Liu, X.; Jiao, R.J.; Xia, Y.; Li, Y. A review of leader-follower joint optimization problems and mathematical models for product design and development. Int. J. Adv. Manuf. Technol. 2019, 103, 3405–3424. [Google Scholar] [CrossRef]
  20. Medeiros, G.H.A.; Cao, Q.; Zanni-Merk, C.; Samet, A. Manufacturing as a Service in Industry 4.0: A Multi-Objective Optimization Approach. In International Conference on Intelligent Decision Technologies; Springer: Singapore, 2020; pp. 37–47. [Google Scholar]
  21. Gong, X.; Jiao, R.; Jariwala, A.; Morkos, B. Crowdsourced manufacturing cyber platform and intelligent cognitive assistants for delivery of manufacturing as a service: Fundamental issues and outlook. Int. J. Adv. Manuf. Technol. 2021, 117, 1997–2007. [Google Scholar] [CrossRef]
  22. Kwong, C.K.; Luo, X.G.; Tang, J.F. A multiobjective optimization approach for product line design. IEEE Trans. Eng. Manag. 2011, 58, 97–108. [Google Scholar] [CrossRef]
  23. Hernandez, G.; Allen, J.K.; Mistree, F. The compromise decision support problem: Modeling the deviation function as in physical programming. Eng. Optim. 2001, 33, 445–471. [Google Scholar] [CrossRef]
  24. Ilgin, M.A.; Akçay, H.; Araz, C. Disassembly line balancing using linear physical programming. Int. J. Prod. Res. 2017, 55, 6108–6119. [Google Scholar] [CrossRef]
  25. Schwab, K. The Fourth Industrial Revolution; Currency: New York, NY, USA, 2017. [Google Scholar]
  26. Hasan, M.; Starly, B. Decentralized cloud manufacturing-as-a-service (CMaaS) platform architecture with configurable digital assets. J. Manuf. Syst. 2020, 56, 157–174. [Google Scholar] [CrossRef]
  27. Pahwa, D.; Starly, B.; Cohen, P. Reverse auction mechanism design for the acquisition of prototyping services in a manufacturing-as-a-service marketplace. J. Manuf. Syst. 2018, 48, 134–143. [Google Scholar] [CrossRef]
  28. Chaudhuri, A.; Datta, P.P.; Fernandes, K.J.; Xiong, Y. Optimal pricing strategies for manufacturing-as-a service platforms to ensure business sustainability. Int. J. Prod. Econ. 2021, 234, 108065. [Google Scholar] [CrossRef]
  29. Pahwa, D.; Starly, B. Dynamic matching with deep reinforcement learning for a two-sided Manufacturing-as-a-Service (MaaS) marketplace. Manuf. Lett. 2021, 29, 11–14. [Google Scholar] [CrossRef]
  30. Gong, X.; Jiao, R.; Jariwala, A.; Morkos, B. Crowdsourced Manufacturing for Delivery of Manufacturing as a Service. In Proceedings of the 2021 IEEE International Conference on Industrial Engineering and Engineering Management (IEEM), Singapore, 13–16 December 2021; pp. 1617–1621. [Google Scholar]
  31. Kaihara, T.; Katsumura, Y.; Suginishi, Y.; Kadar, B. Simulation model study for manufacturing effectiveness evaluation in crowdsourced manufacturing. CIRP Ann. 2017, 66, 445–448. [Google Scholar] [CrossRef]
  32. Wu, J.; Du, G.; Jiao, R.J. Optimal postponement contracting decisions in crowdsourced manufacturing: A three-level game-theoretic model for product family architecting considering subcontracting. Eur. J. Oper. Res. 2021, 291, 722–737. [Google Scholar] [CrossRef]
  33. Zhou, K.; Du, G.; Jiao, R.J. Personalized service product family design optimization considering crowdsourced service operations. Comput. Ind. Eng. 2022, 166, 107973. [Google Scholar] [CrossRef]
  34. Kuo, T.C.; Chen, H.M.; Liu, C.Y.; Tu, J.C.; Yeh, T.C. Applying multi-objective planning in low-carbon product design. Int. J. Precis. Eng. Manuf. 2014, 15, 241–249. [Google Scholar] [CrossRef]
  35. Xu, Z.Z.; Wang, Y.S.; Teng, Z.R.; Zhong, C.Q.; Teng, H.F. Low-carbon product multi-objective optimization design for meeting requirements of enterprise, user and government. J. Clean. Prod. 2015, 103, 747–758. [Google Scholar] [CrossRef]
  36. Chiang, T.A.; Che, Z.H. A decision-making methodology for low-carbon electronic product design. Decis. Support Syst. 2015, 71, 1–13. [Google Scholar] [CrossRef]
  37. He, B.; Huang, S.; Wang, J. Product low-carbon design using dynamic programming algorithm. Int. J. Precis. Eng. Manuf. -Green Technol. 2015, 2, 37–42. [Google Scholar] [CrossRef] [Green Version]
  38. He, B.; Wang, J.; Deng, Z. Cost-constrained low-carbon product design. Int. J. Adv. Manuf. Technol. 2015, 79, 1821–1828. [Google Scholar] [CrossRef]
  39. He, B.; Wang, J.; Huang, S.; Wang, Y. Low-carbon product design for product life cycle. J. Eng. Des. 2015, 26, 321–339. [Google Scholar] [CrossRef]
  40. Baud-Lavigne, B.; Agard, B.; Penz, B. Environmental constraints in joint product and supply chain design optimization. Comput. Ind. Eng. 2014, 76, 16–22. [Google Scholar] [CrossRef]
  41. Huang, Y.; Wang, K.; Zhang, T.; Pang, C. Green supply chain coordination with greenhouse gases emissions management: A game-theoretic approach. J. Clean. Prod. 2016, 112, 2004–2014. [Google Scholar] [CrossRef]
  42. Ma, S.; Chen, S.; Cai, X. An Incentive-based Bi-level optimization Model for Collaborative Green Product Line Design. In Proceedings of the 2018 IEEE International Conference on Industrial Engineering and Engineering Management (IEEM), Bangkok, Thailand, 16–19 December 2018; pp. 981–985. [Google Scholar]
  43. Xiao, W.; Du, G.; Zhang, Y.; Liu, X. Coordinated optimization of low-carbon product family and its manufacturing process design by a bilevel game-theoretic model. J. Clean. Prod. 2018, 184, 754–773. [Google Scholar] [CrossRef]
  44. Abdi, M.R.; Labib, A.W. Grouping and selecting products: The design key of reconfigurable manufacturing systems (RMSs). Int. J. Prod. Res. 2004, 42, 521–546. [Google Scholar] [CrossRef]
  45. Raman, N.; Chhajed, D. Simultaneous determination of product attributes and prices, and production processes in product-line design. J. Oper. Manag. 1995, 12, 187–204. [Google Scholar] [CrossRef]
  46. Hernandez, G.; Allen, J.K.; Woodruff, G.W.; Simpson, T.W.; Bascaran, E.; Avila, L.F.; Salinas, F. Robust design of families of products with production modeling and evaluation. J. Mech. Des. 2001, 123, 183–190. [Google Scholar] [CrossRef]
  47. Michalek, J.J.; Ceryan, O.; Papalambros, P.Y.; Koren, Y. Balancing marketing and manufacturing objectives in product line design. J. Mech. Des. 2006, 128, 1196–1204. [Google Scholar] [CrossRef] [Green Version]
  48. Michalek, J.J.; Ebbes, P.; Adigüzel, F.; Feinberg, F.M.; Papalambros, P.Y. Enhancing marketing with engineering: Optimal product line design for heterogeneous markets. Int. J. Res. Mark. 2011, 28, 1–12. [Google Scholar] [CrossRef]
  49. Luo, L. Product line design for consumer durables: An integrated marketing and engineering approach. J. Mark. Res. 2011, 48, 128–139. [Google Scholar] [CrossRef] [Green Version]
  50. Xu, Z.; Liang, M. Integrated planning for product module selection and assembly line design/reconfiguration. Int. J. Prod. Res. 2006, 44, 2091–2117. [Google Scholar] [CrossRef]
  51. Xu, Z.; Liang, M. Concurrent optimization of product module selection and assembly line configuration: A multi-objective approach. J. Manuf. Sci. Eng. 2005, 127, 875–884. [Google Scholar] [CrossRef]
  52. Bryan, A.; Hu, S.J.; Koren, Y. Concurrent product portfolio planning and mixed product assembly line balancing. Chin. J. Mech. Eng. 2007, 20, 96–99. [Google Scholar] [CrossRef]
  53. Bryan, A.; Wang, H.; Abell, J. Concurrent design of product families and reconfigurable assembly systems. J. Mech. Des. 2013, 135, 051001. [Google Scholar] [CrossRef]
  54. Bryan, A.; Ko, J.; Hu, S.J.; Koren, Y. Co-evolution of product families and assembly systems. CIRP Ann. -Manuf. Technol. 2007, 56, 41–44. [Google Scholar] [CrossRef] [Green Version]
  55. Cao, Y.; Luo, X.G.; Kwong, C.K.; Tang, J.F.; Zhou, W. Joint optimization of product family design and supplier selection under multinomial logit consumer choice rule. Concurr. Eng. 2012, 20, 335–347. [Google Scholar] [CrossRef]
  56. Liu, X.; Xia, Y.; Chen, M.; Li, A.D. Integrating Assembly Line Balancing in Product Family Planning Design under the Multinomial Logit Choice Model. In Proceedings of the 2019 International Conference on Industrial Engineering and Systems Management (IESM), Shanghai, China, 25–27 September 2019; pp. 1–6. [Google Scholar]
  57. Hanafy, M.; ElMaraghy, H. Modular product platform configuration and co-planning of assembly lines using assembly and disassembly. J. Manuf. Syst. 2017, 42, 289–305. [Google Scholar] [CrossRef]
  58. Abbas, M.; ElMaraghy, H. Co-platforming of products and assembly systems. Omega-Int. J. Manag. Sci. 2018, 78, 5–20. [Google Scholar] [CrossRef]
  59. Jiao, J.; Xu, Q.; Wu, Z.; Ng, N. Coordinating product, process, and supply chain decisions: A constraint satisfaction approach. Eng. Appl. Artif. Intell. 2009, 22, 992–1004. [Google Scholar] [CrossRef]
  60. Valilai, O.F.; Houshmand, M. A platform for optimisation in distributed manufacturing enterprises based on cloud manufacturing paradigm. Int. J. Comput. Integr. Manuf. 2014, 27, 1031–1054. [Google Scholar] [CrossRef]
  61. Messac, A.; Gupta, S.M.; Akbulut, B. Linear physical programming: A new approach to multiple objective optimization. Trans. Oper. Res. 1996, 8, 39–59. [Google Scholar]
  62. Hernandez, G.; Seepersad, C.C.; Mistree, F. Designing for maintenance: A game theoretic approach. Eng. Optim. 2002, 34, 561–577. [Google Scholar] [CrossRef]
  63. Maria, A.; Mattson, C.; Ismail-Yahaya, A.; Messac, A. Linear physical programming for production planning optimization. Eng. Optim. 2003, 35, 19–37. [Google Scholar] [CrossRef]
  64. McAllister, C.D.; Simpson, T.W.; Hacker, K.; Lewis, K.; Messac, A. Integrating linear physical programming within collaborative optimization for multiobjective multidisciplinary design optimization. Struct. Multidiscip. Optim. 2005, 29, 178–189. [Google Scholar] [CrossRef]
  65. Lai, X.; Xie, M.; Tan, K.C. QFD optimization using linear physical programming. Eng. Optim. 2006, 38, 593–607. [Google Scholar] [CrossRef]
  66. Kongar, E.; Gupta, S.M. Solving the disassembly-to-order problem using linear physical programming. Int. J. Math. Oper. Res. 2009, 1, 504–531. [Google Scholar] [CrossRef]
  67. Ilgin, M.A.; Gupta, S.M. Physical programming: A review of the state of the art. Stud. Inform. Control 2012, 21, 349–366. [Google Scholar] [CrossRef] [Green Version]
  68. Dhingra, A.K.; Rao, S.S. A cooperative fuzzy game theoretic approach to multiple objective design optimization. Eur. J. Oper. Res. 1995, 83, 547–567. [Google Scholar] [CrossRef]
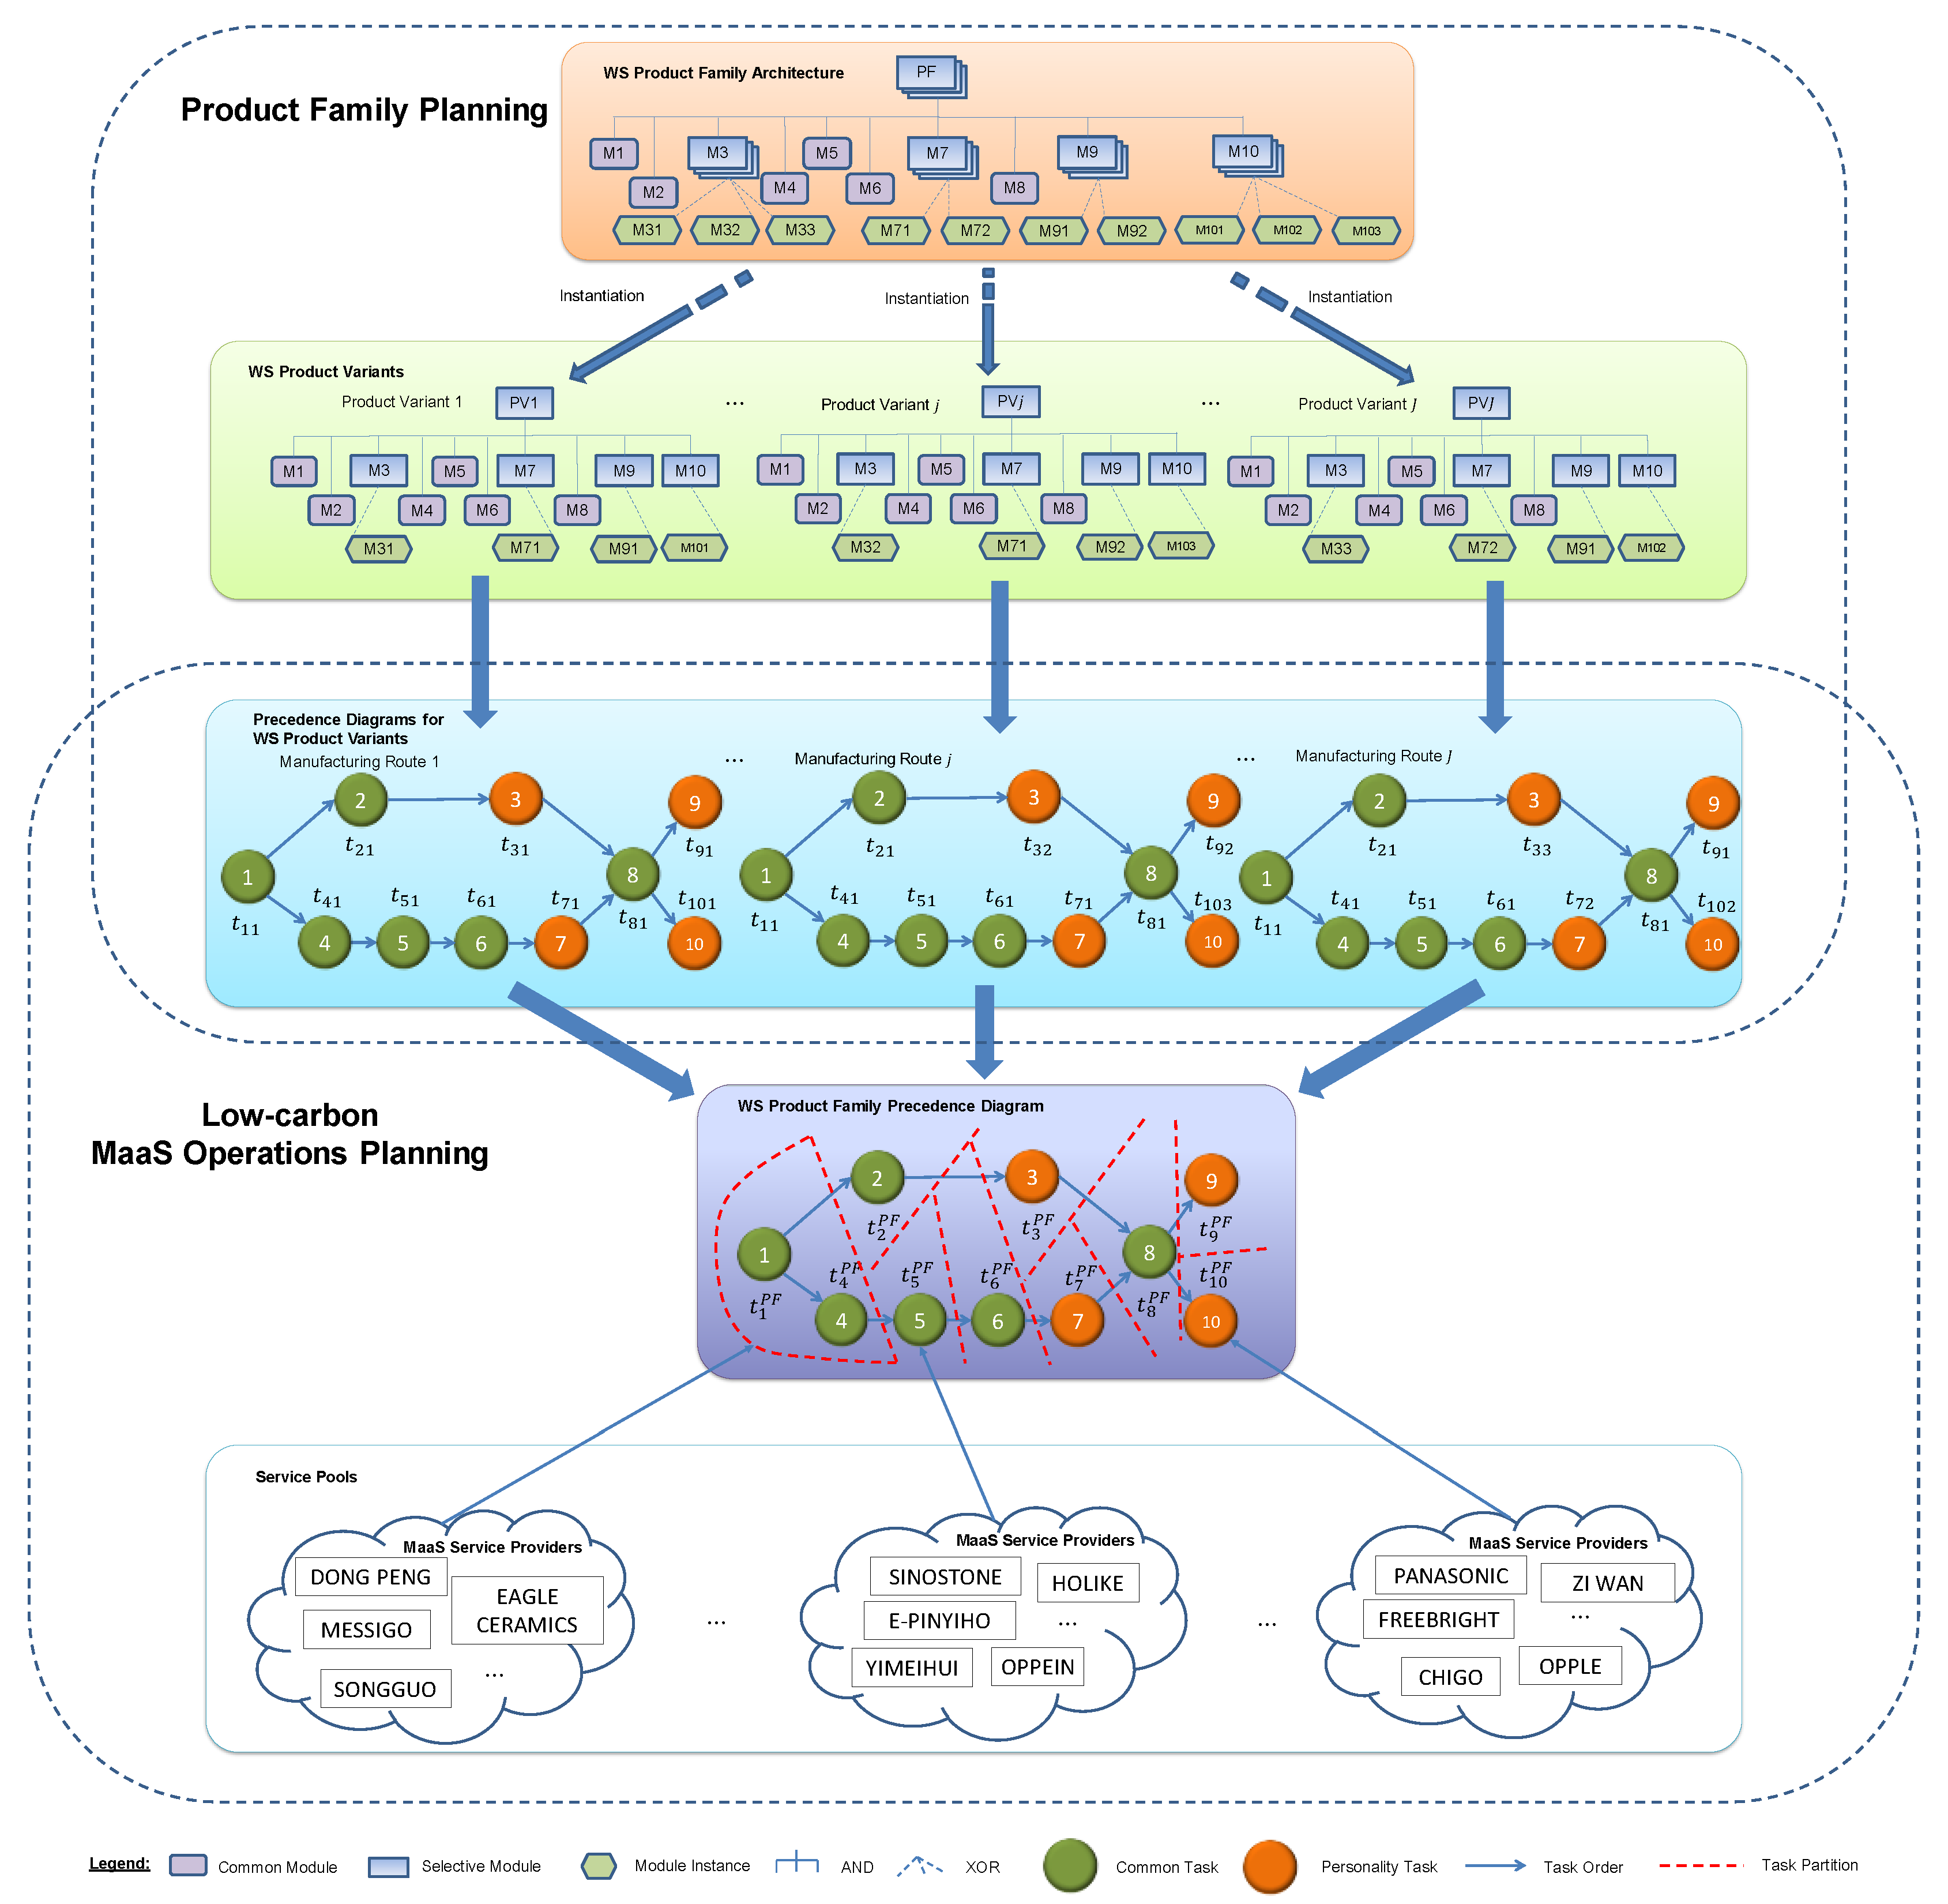
Figure 1. Low-carbon PFP and MaaS operational planning for the WS Company.
Sustainability 14 12566 g001
Figure 2. Coordinated decision making for low-carbon PFP and MLB.
Sustainability 14 12566 g002
Figure 3. Leader-follower interactive decision-making mechanism.
Sustainability 14 12566 g003
Figure 4. Flow chart of NBGA.
Sustainability 14 12566 g004
Figure 5. Genetic encoding for upper-level PFP and lower-level MLB. (a) Genetic encoding for upper-level PFP. (b) Genetic encoding for lower-level MLB.
Sustainability 14 12566 g005
Figure 6. Upper-level crossover and mutation operators. (a) Upper-level crossover operator. (b) Upper-level mutation operator.
Sustainability 14 12566 g006
Figure 7. Lower-level crossover and mutation operators. (a) Lower-level crossover operator. (b) Lower-level mutation operator.
Sustainability 14 12566 g007
Figure 8. The evolution process of NBGA.
Sustainability 14 12566 g008
Figure 9. The evolution process for the cooperative approach.
Sustainability 14 12566 g009
Figure 10. Comparison of experimental results.
Sustainability 14 12566 g010
Figure 11. Comparison of target values under different approaches. (a) Comparison of total profit under different approaches. (b) Comparison of market share under different approaches. (c) Comparison of operational cost under different approaches. (d) Comparison of load index under different approaches.
Sustainability 14 12566 g011aSustainability 14 12566 g011b
Figure 12. The influence of the competitive intensity.
Sustainability 14 12566 g012
Table 1. Utility surplus of two existing competitive products and sizes of market segments.
Segment 1Segment 2Segment 3
Utility surplus of one competitive product10.58.59.6
Utility surplus of one existing product8.79.48.3
Estimated sizes of market segments250,000350,000150,000
Table 2. Part-worth utilities, manufacturing times, and purchase costs for module instances.
Part-Worth UtilitiesManufacturing TimesModule Costs
Segment 1Segment 2Segment 3
M1 8.98.58.207.8
M2 9.29.79.968.5
M3M3100000
M326.86.66.355.3
M338.38.98.587.6
M4 4.54.74.973.5
M5 6.56.96.255.7
M6 6.57.27.955.2
M7M7100000
M725.94.85.283.9
M8 5.85.65.3104.8
M9M9100000
M925.83.86.842.8
M10M10100000
M1024.14.54.863.6
M1036.86.66.294.8
Table 3. LPP target values for each goal.
Level   k Upper-Level PFP Decision Maker
Total   Profit   T P T a r g e t   ( 10 7 ) Market   Share   M S T a r g e t   ( % )
1290
21.580
3170
40.760
50.550
Lower-Level MLB Decision Maker
Operation   cos t   O C T a r g e t   ( 10 7 ) Load   Index   L I T a r g e t
11.50.5
221
32.31.5
42.52
533
Table 4. Weights for the goals in the common deviation functions.
Level   k Upper-Level PFP Decision Maker
Total   Profit   T P   ( w 1 k + / w 1 k ) Market   Share   M S   ( w 2 k + / w 2 k )
10/2.60/3
20/0.260/0.3
30/7.150/3.63
40/21.5220/7.623
Lower-Level MLB Decision Maker
Operation   Cost   O C   ( w 3 k + / w 3 k ) Load   Index   L I   ( w 4 k + / w 4 k )
10.2/00.3/0
20.3333/00.18/0
31.5467/00.768/0
40.0832/00.3744/0
Table 5. Results under the bilevel, sequential, and cooperative approach.
The Bilevel ApproachThe Sequential ApproachThe Cooperative Approach
Upper-level PFP decisionsConfiguration of product variant 1[1 1 2 1 1 1 2 1 2 3][1 1 3 1 1 1 2 1 2 3][1 1 2 1 1 1 2 1 1 3]
Configuration of product variant 2[1 1 1 1 1 1 2 1 2 3][1 1 2 1 1 1 2 1 2 3][1 1 2 1 1 1 1 1 2 1]
Upper-level objective values Total   profit   ( 10 7 ) 1.56001.26151.3234
Market share0.92050.94050.7530
Common   deviation   function   value   Z 1 0.57210.69131.0316
Lower-level MLB decisionsManufacturing task partition solution1 4 | 5 | 6 | 2 | 3 | 7 | 8 | 9 | 101 4 |2 | 5 | 6 | 3 | 7 | 8 | 9 | 101 2 3 | 4 | 5 | 6 | 7 | 8 | 9 | 10
Number of MaaS service providers for each manufacturer2 2 2 2 1 2 3 1 22 2 2 2 2 2 3 1 2 2 2 1 1 1 2 1 1
Lower-level objective values Low - carbon   operation   cos t   ( 10 7 ) 1.95072.25081.3505
Load index1.12171.84130.5000
Common   deviation   function   value   Z 2 0.38200.6732 7.4919 × 10 6
Publisher’s Note: MDPI stays neutral with regard to jurisdictional claims in published maps and institutional affiliations.