
Life Cycle Assessment of Hydrogen Transportation Pathways via Pipelines and Truck Trailers: Implications as a Low Carbon Fuel


Abstract
:1. Introduction
1.1. Background and Motivation
1.2. Literature Review
1.3. Paper Contribution
1.4. Paper Organization
2. Data and Methods
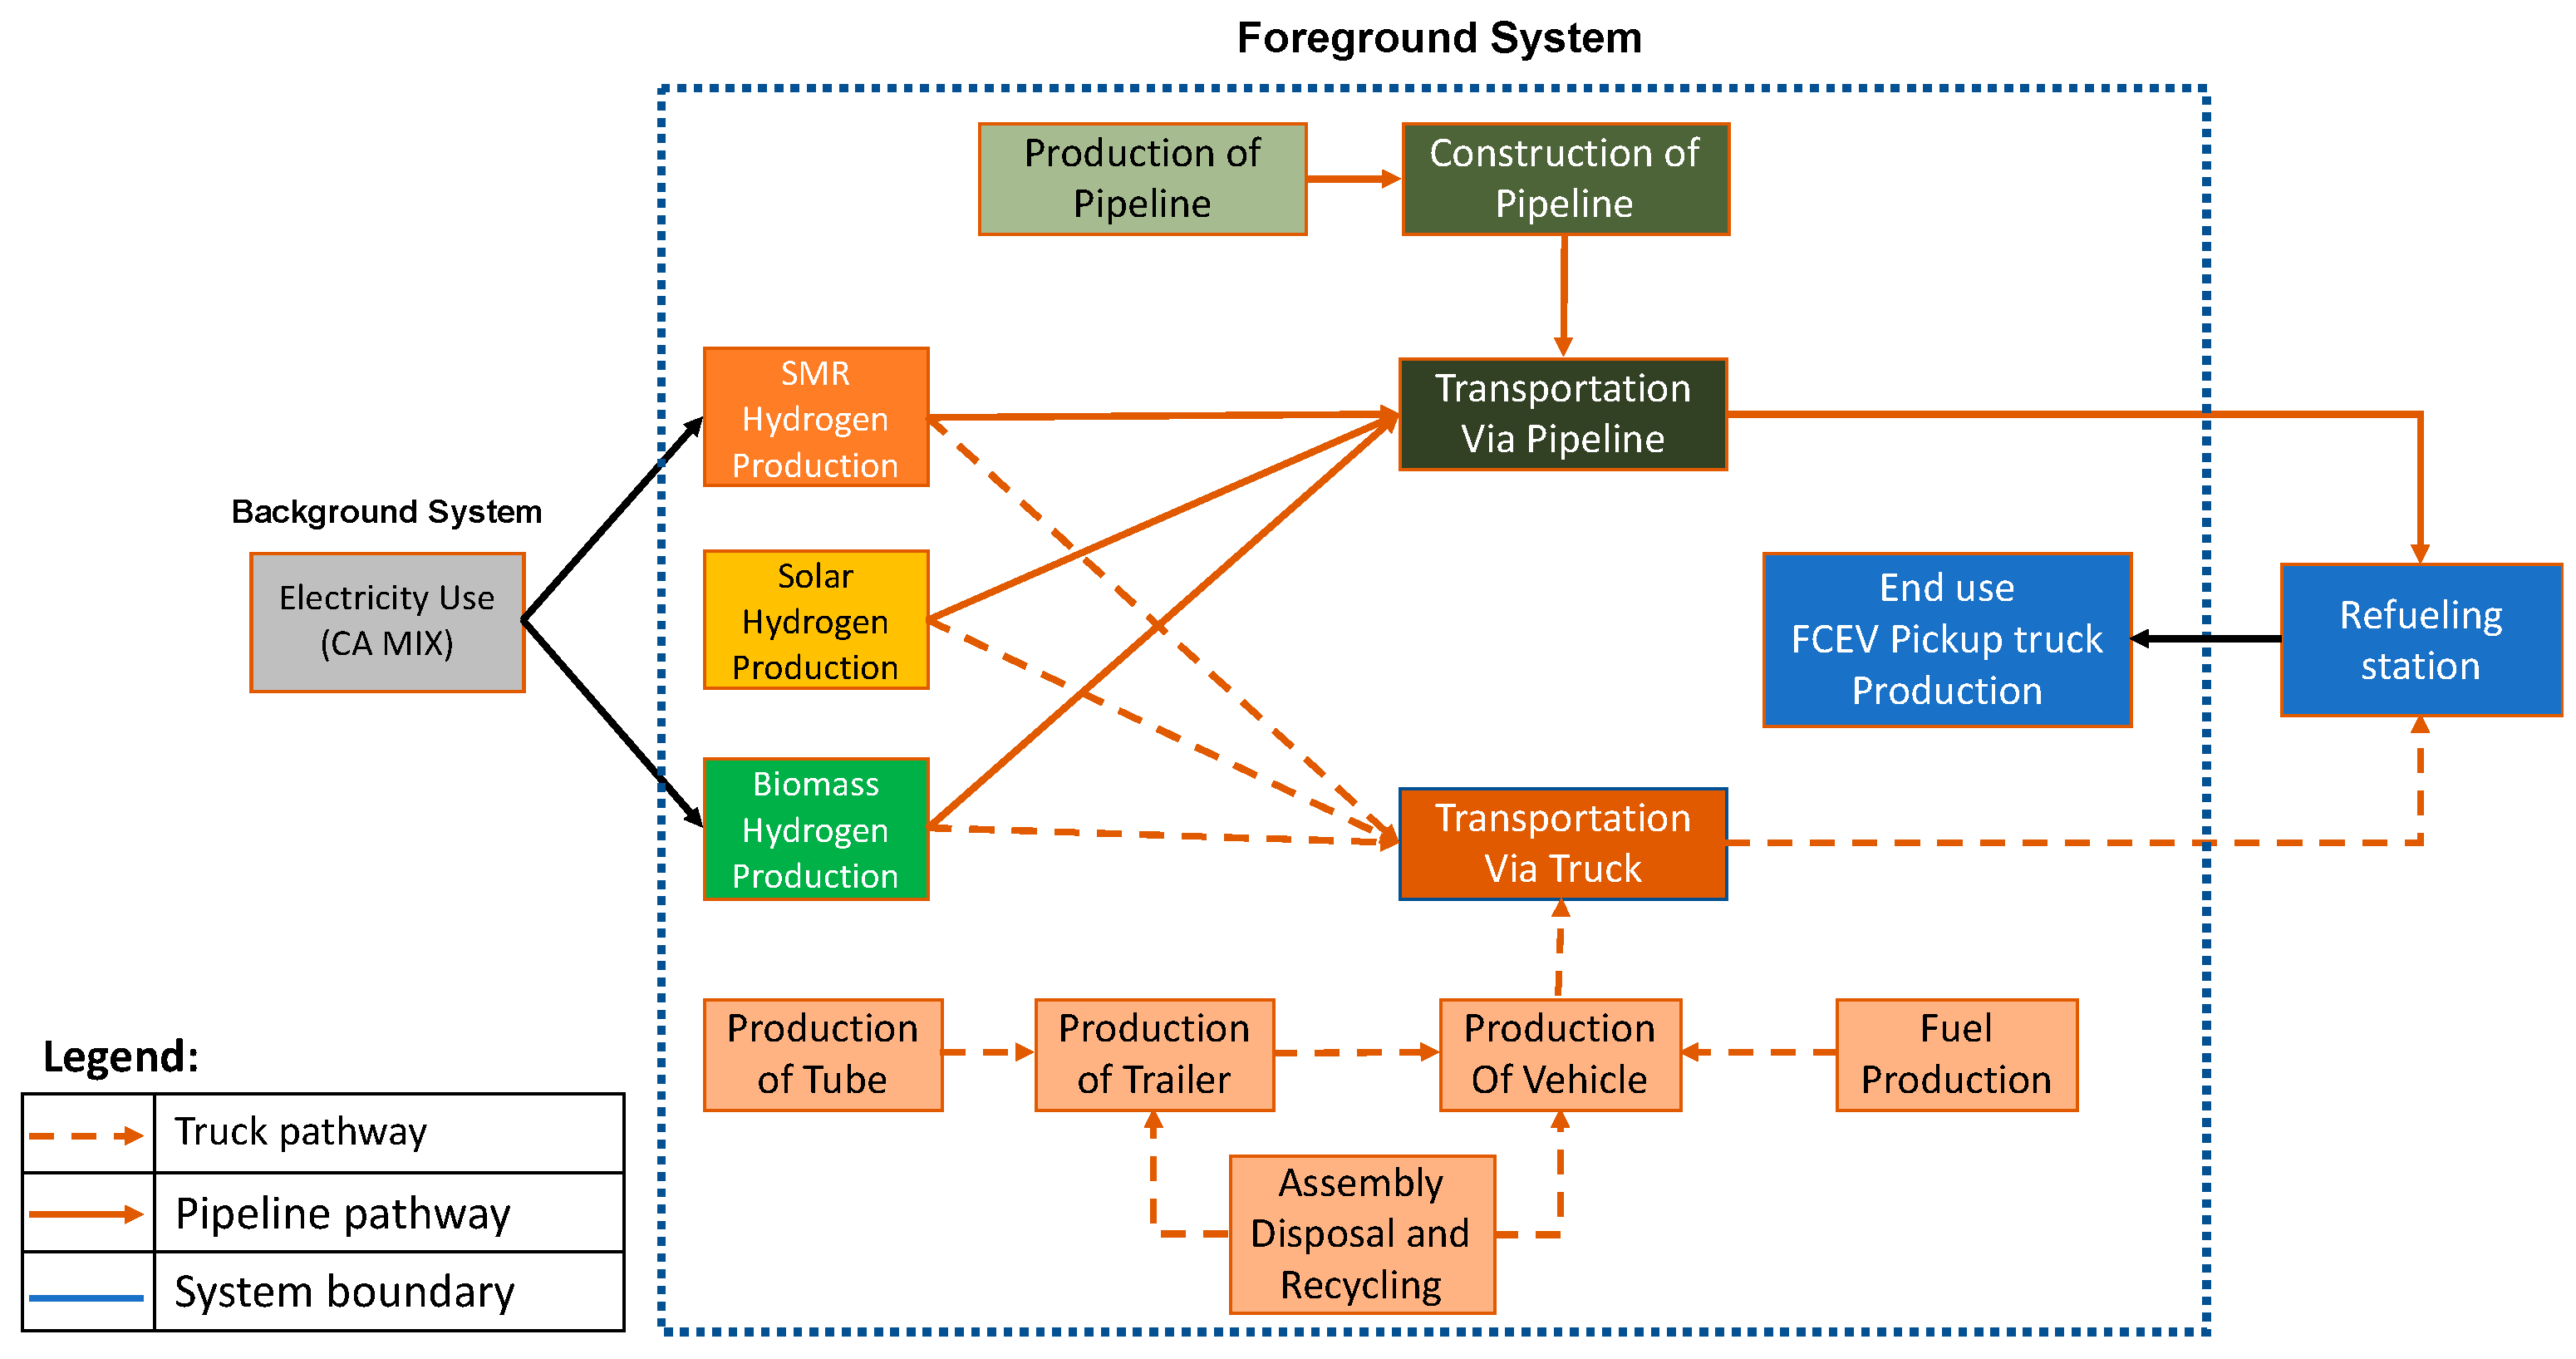
2.1. Methodology
2.2. Scenario Development
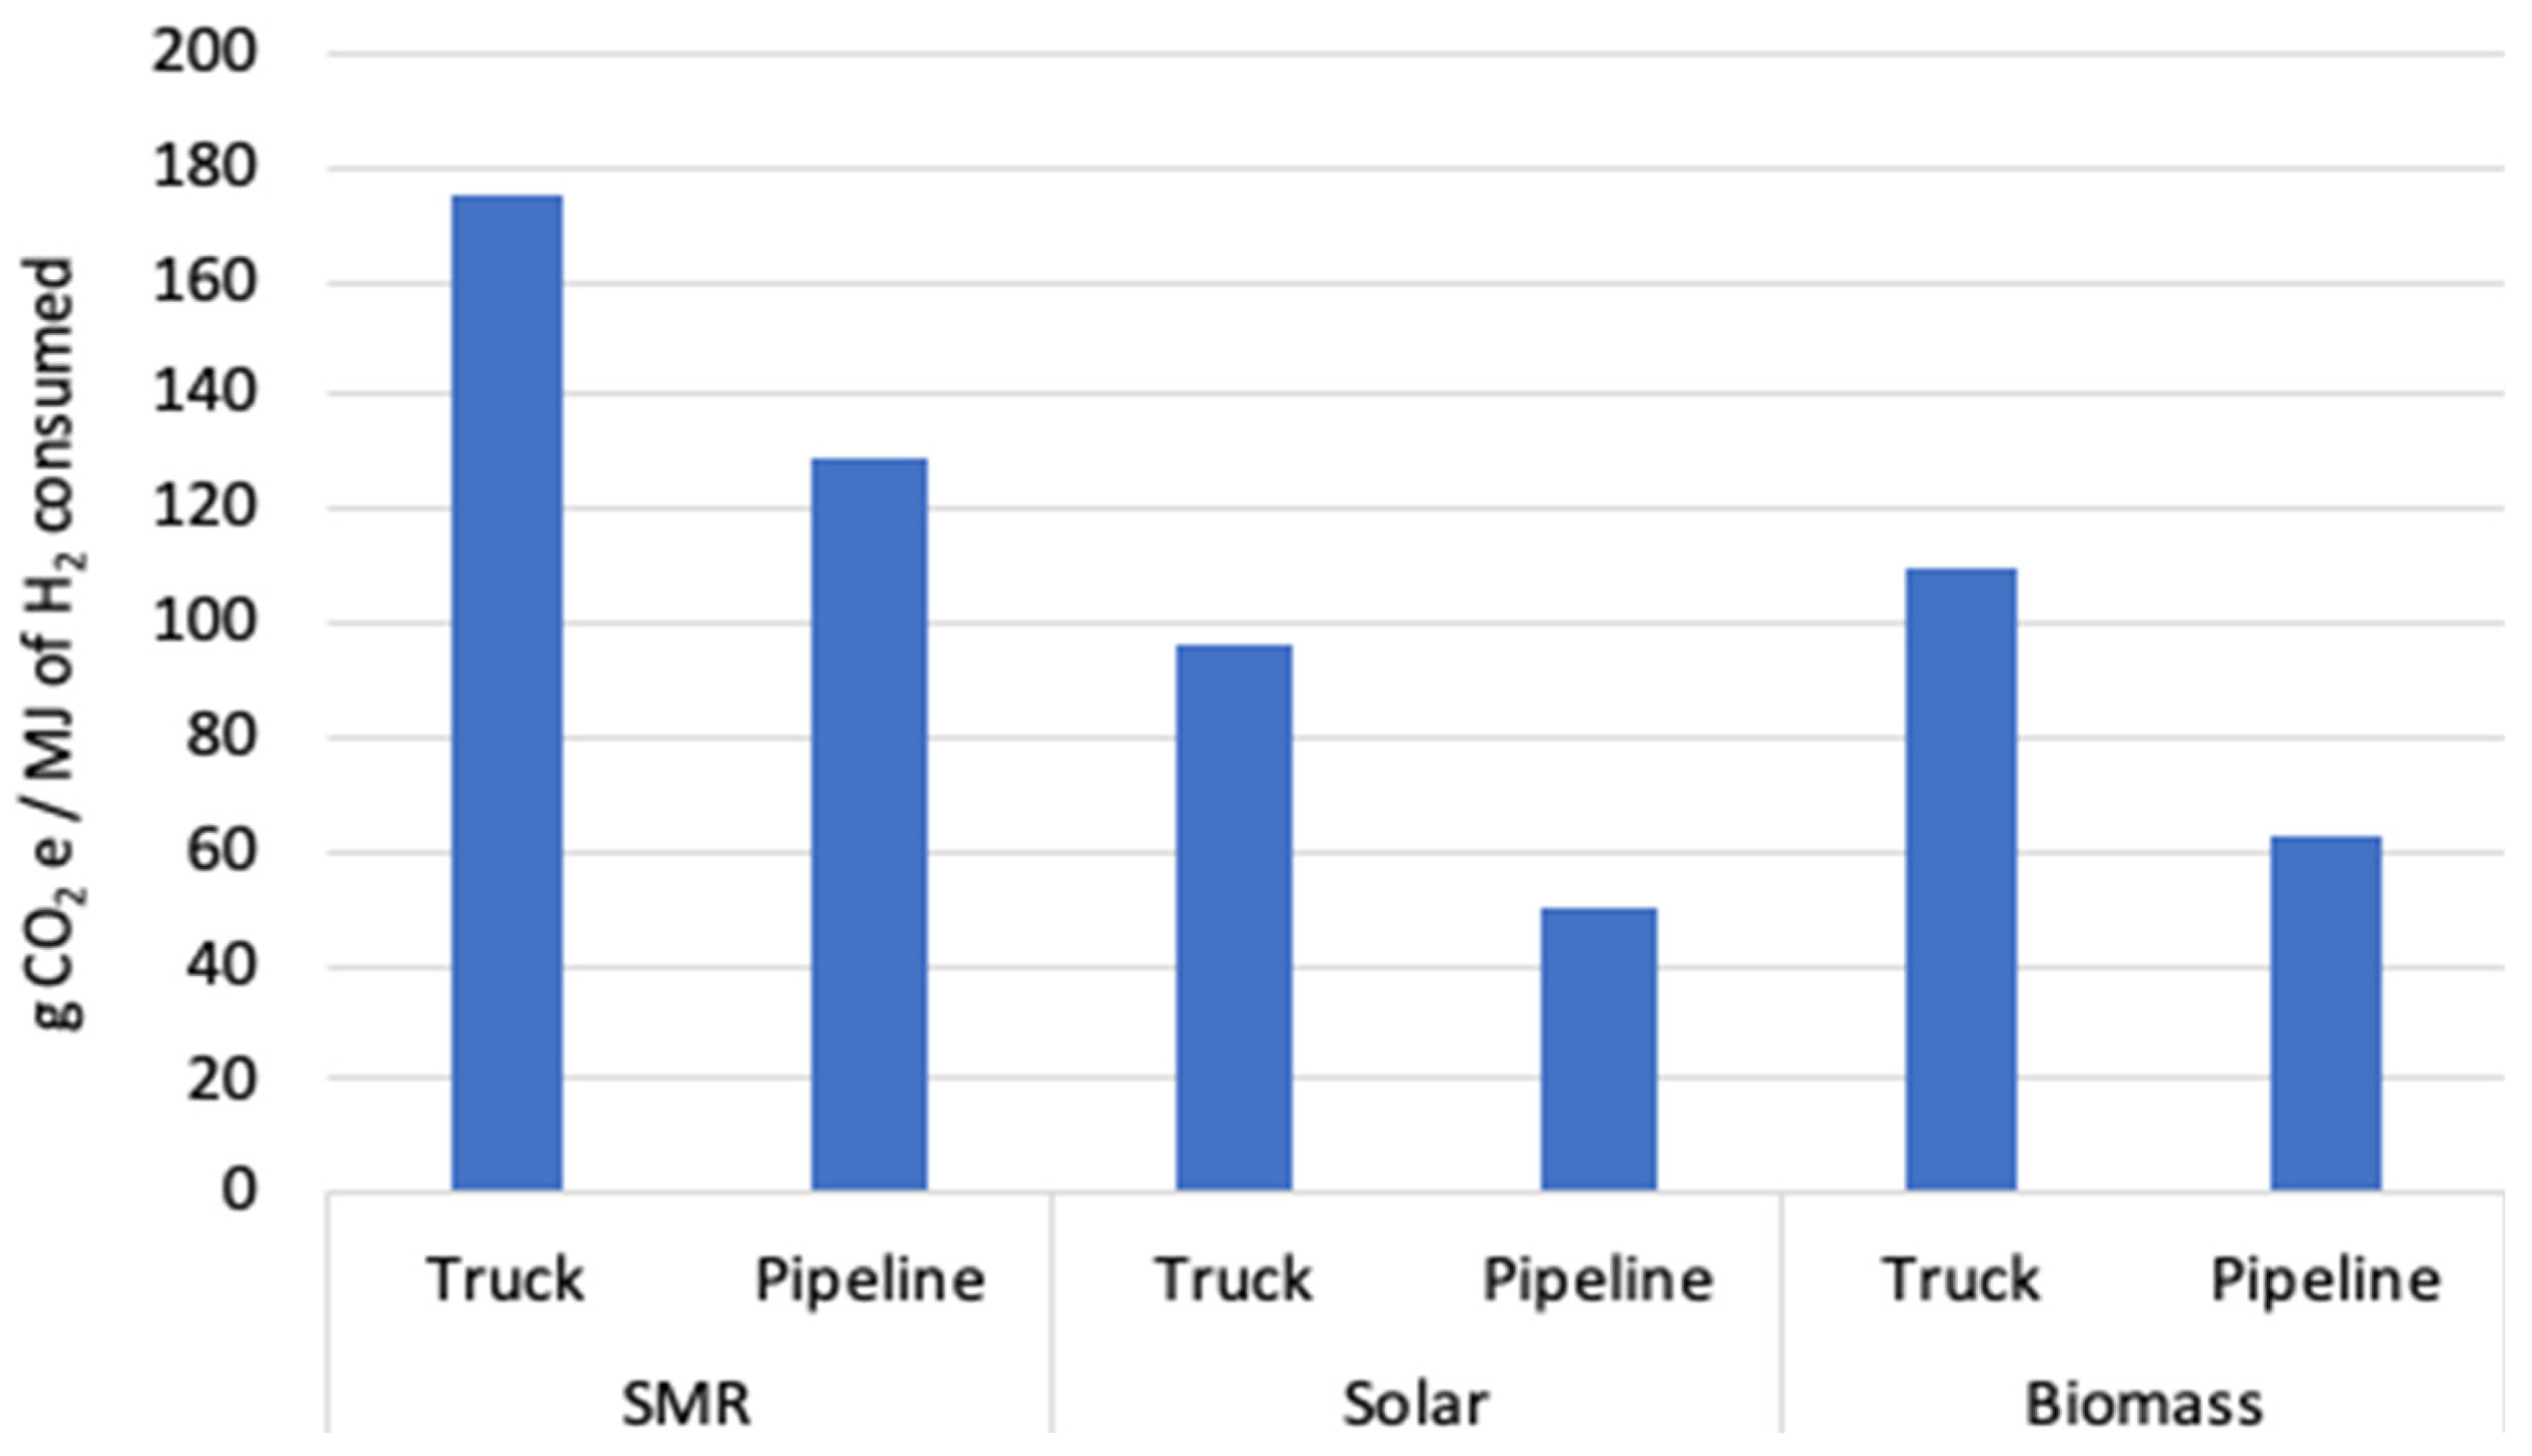
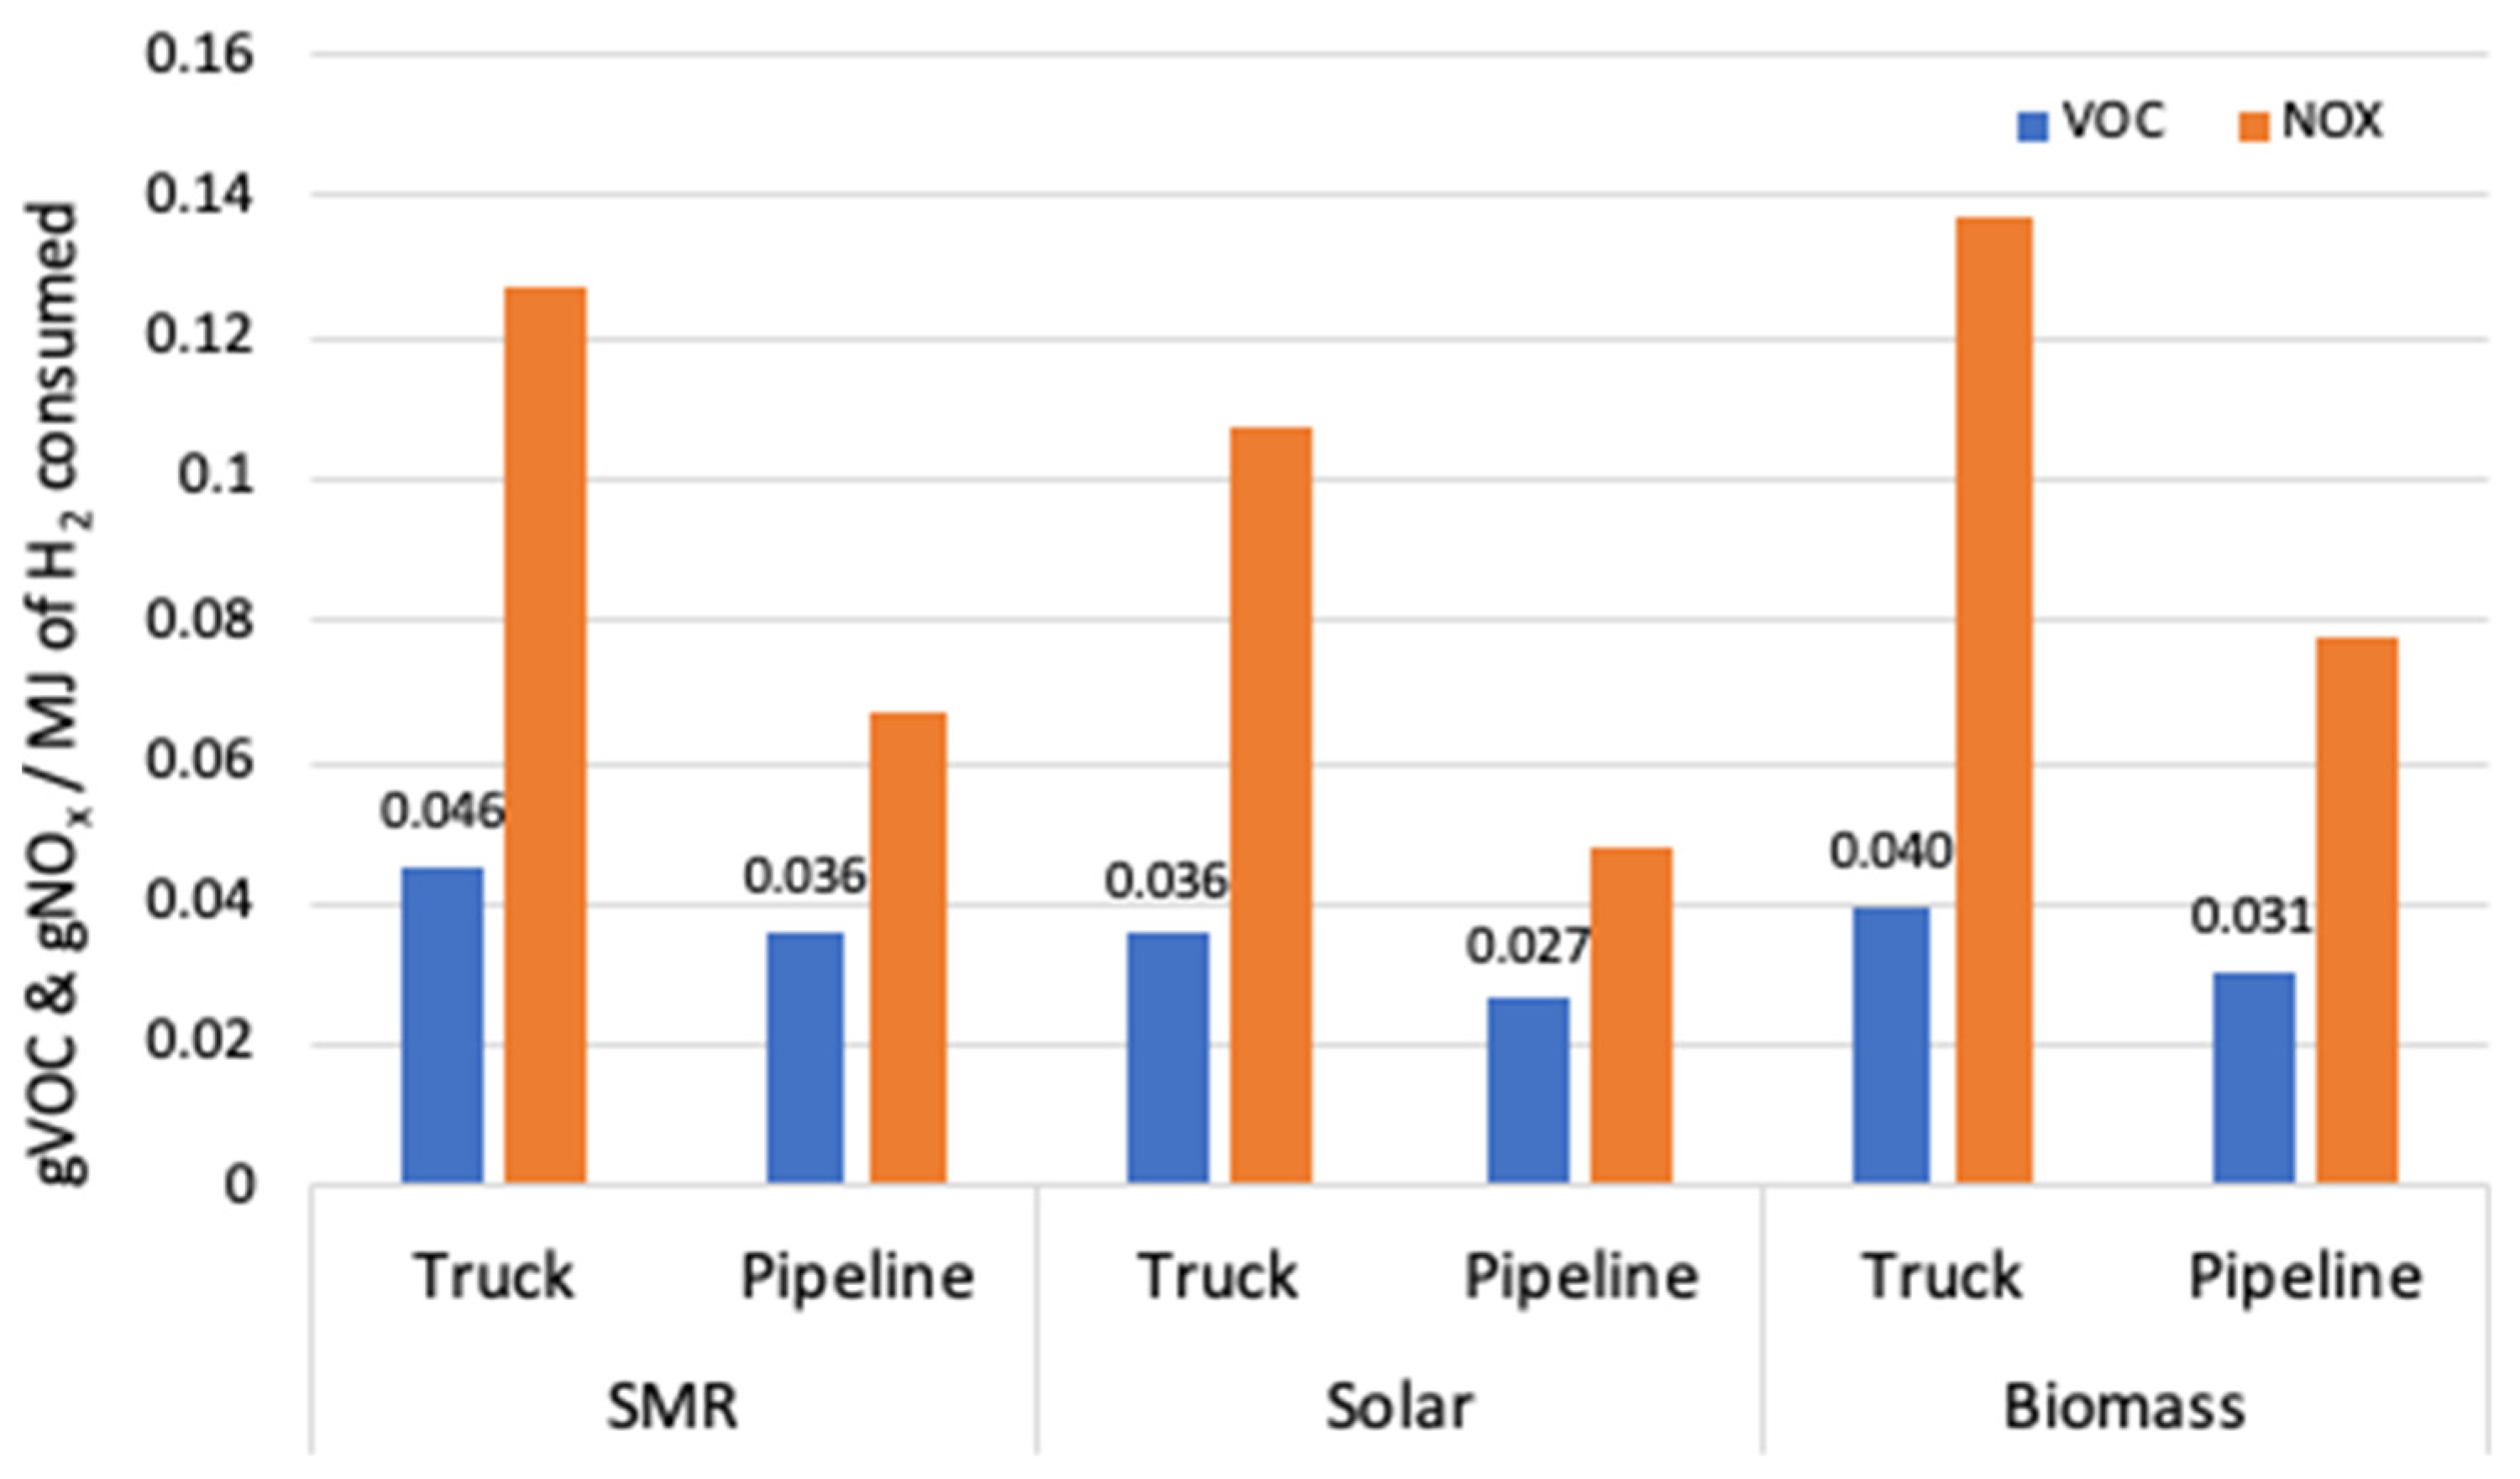
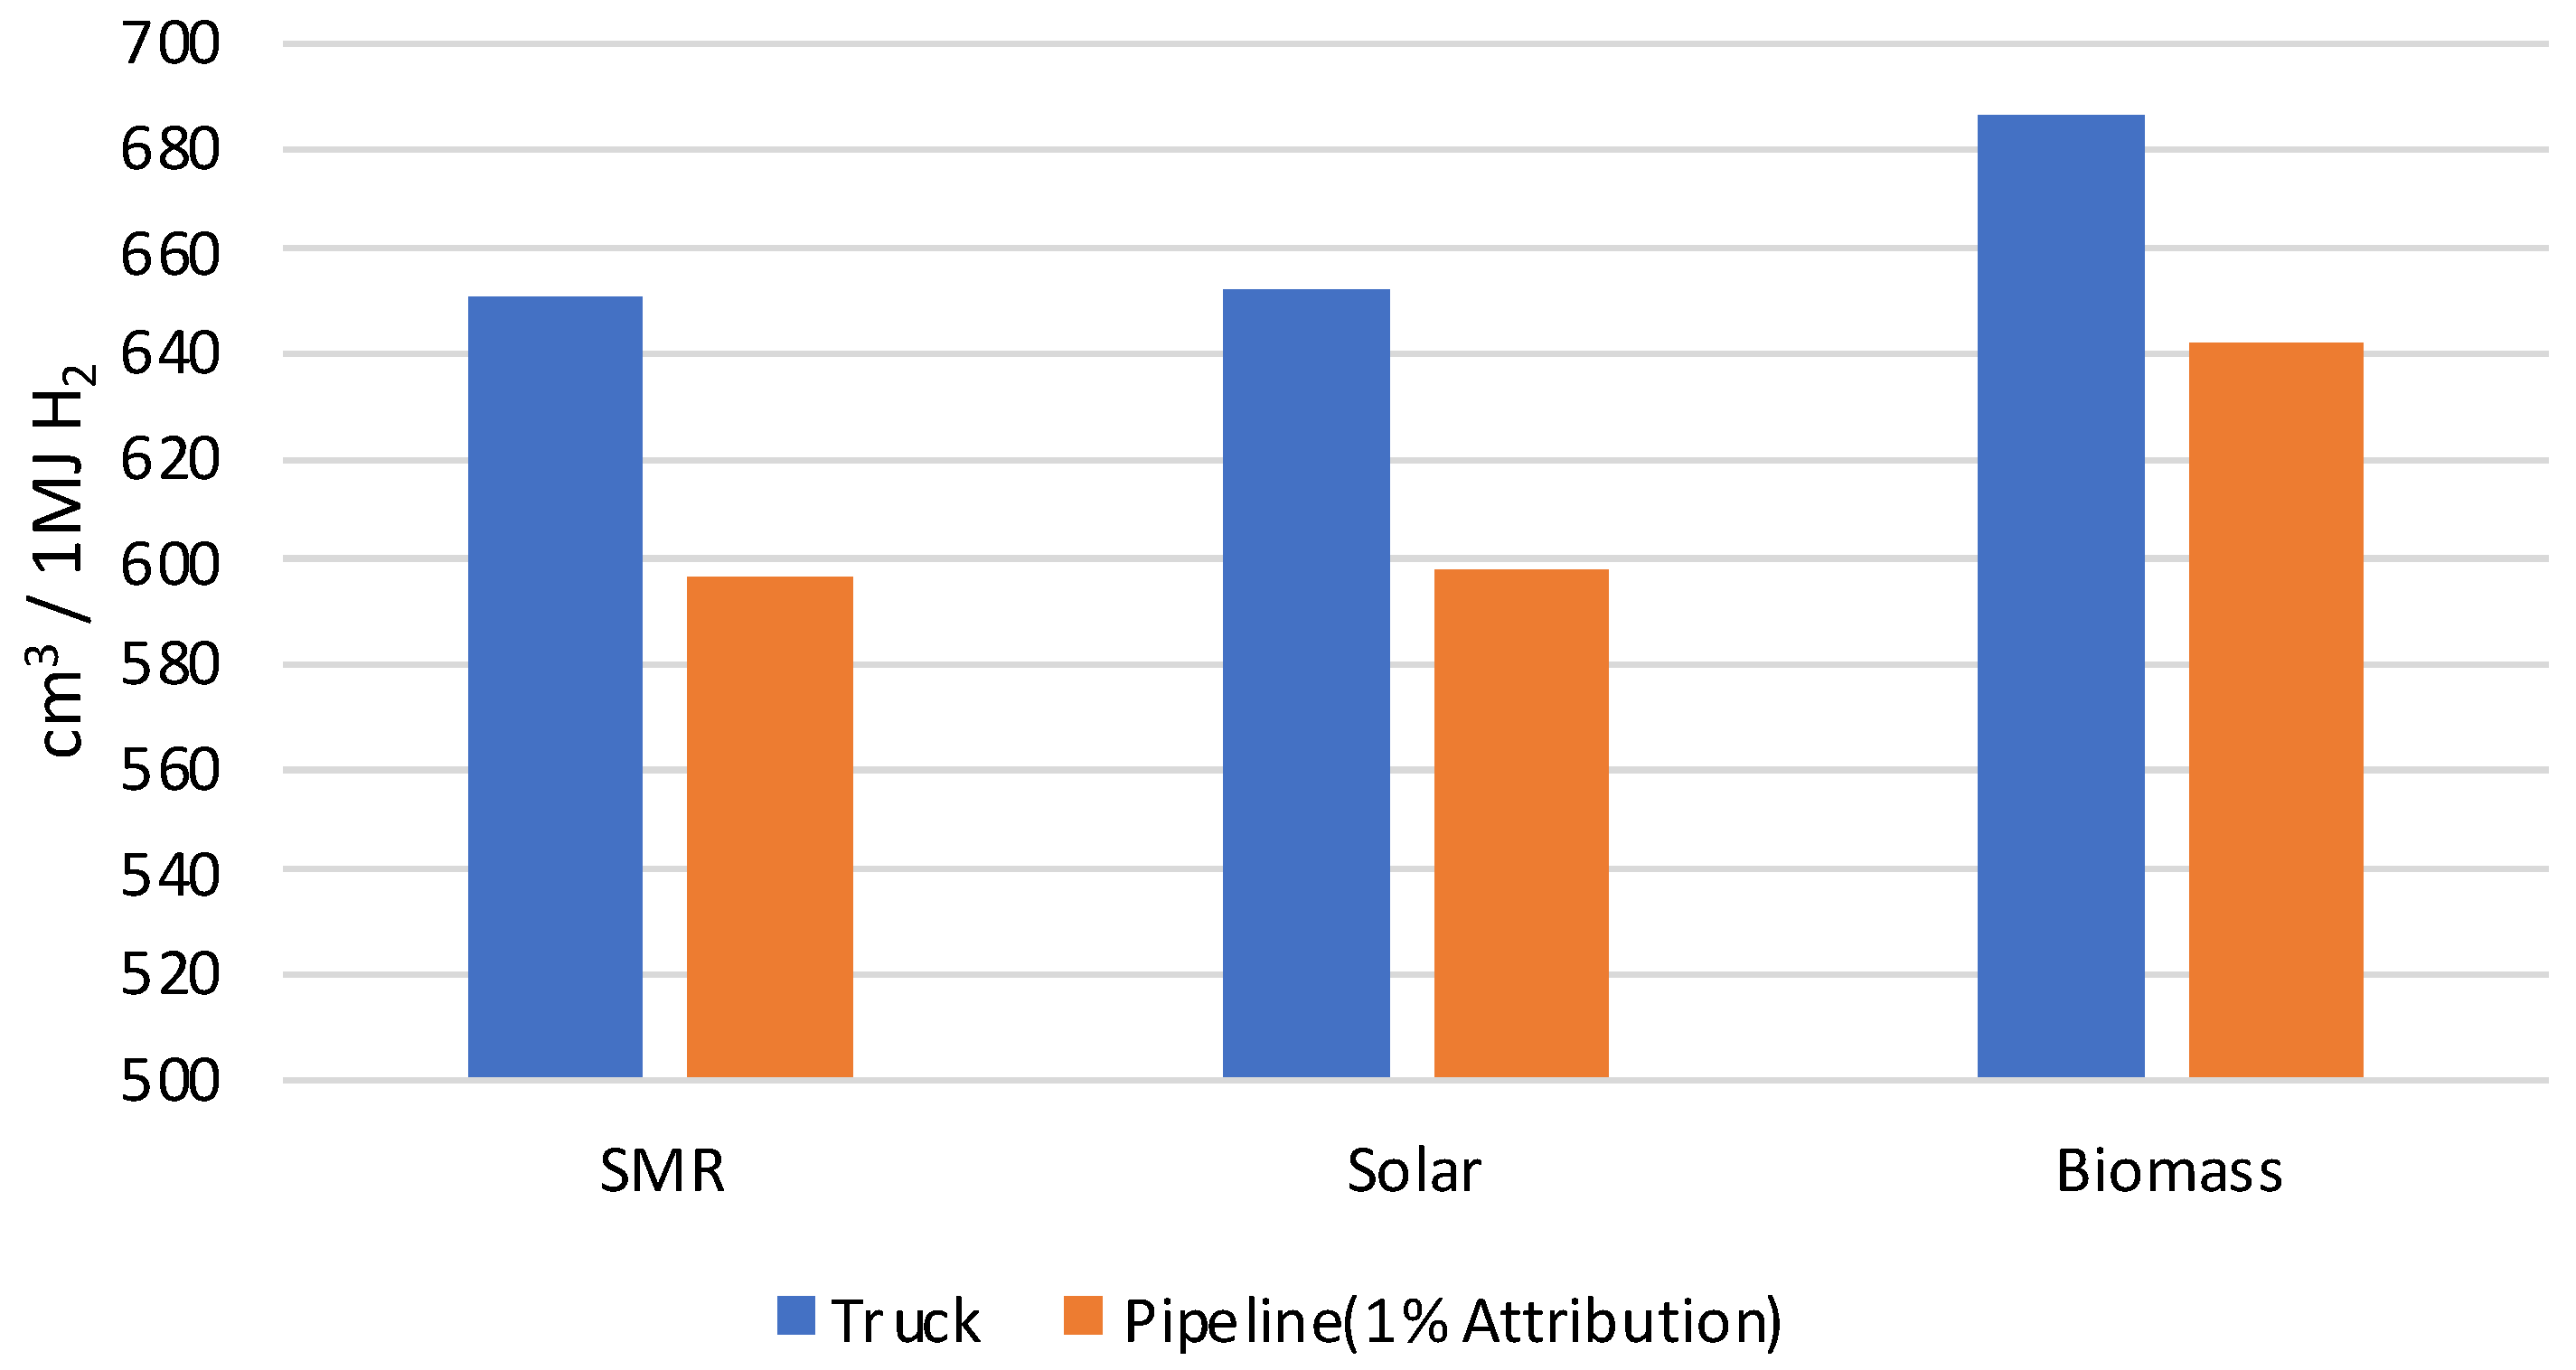
3. Results
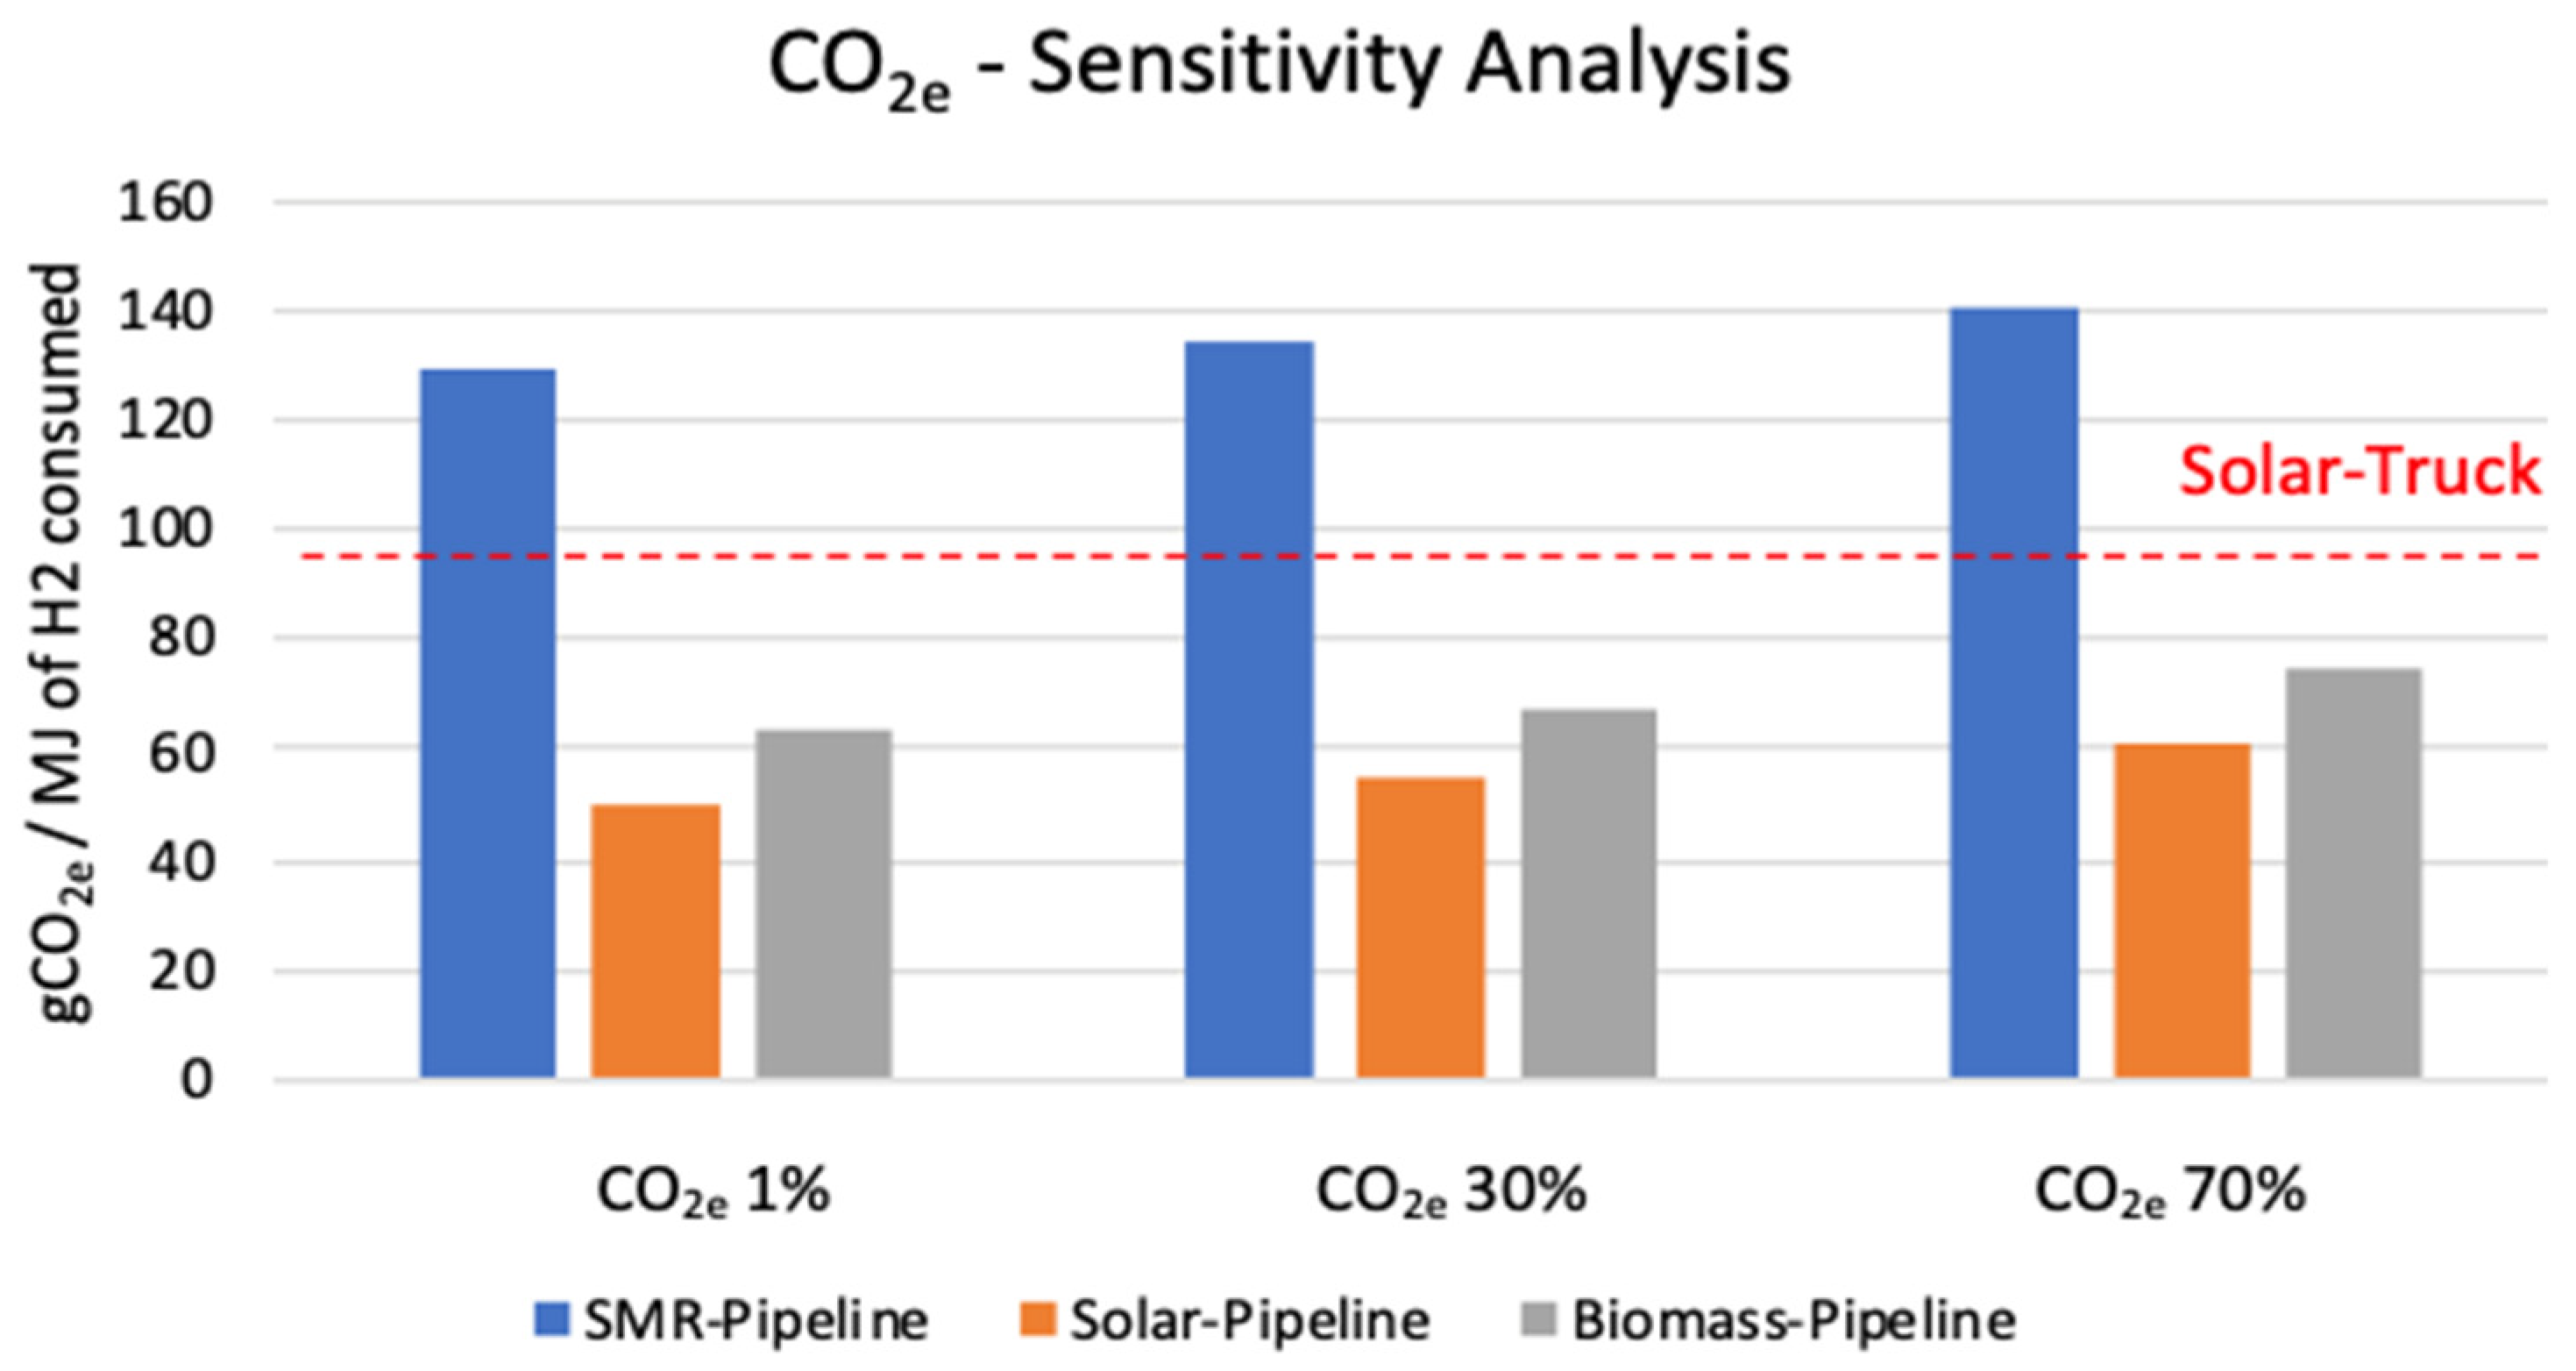
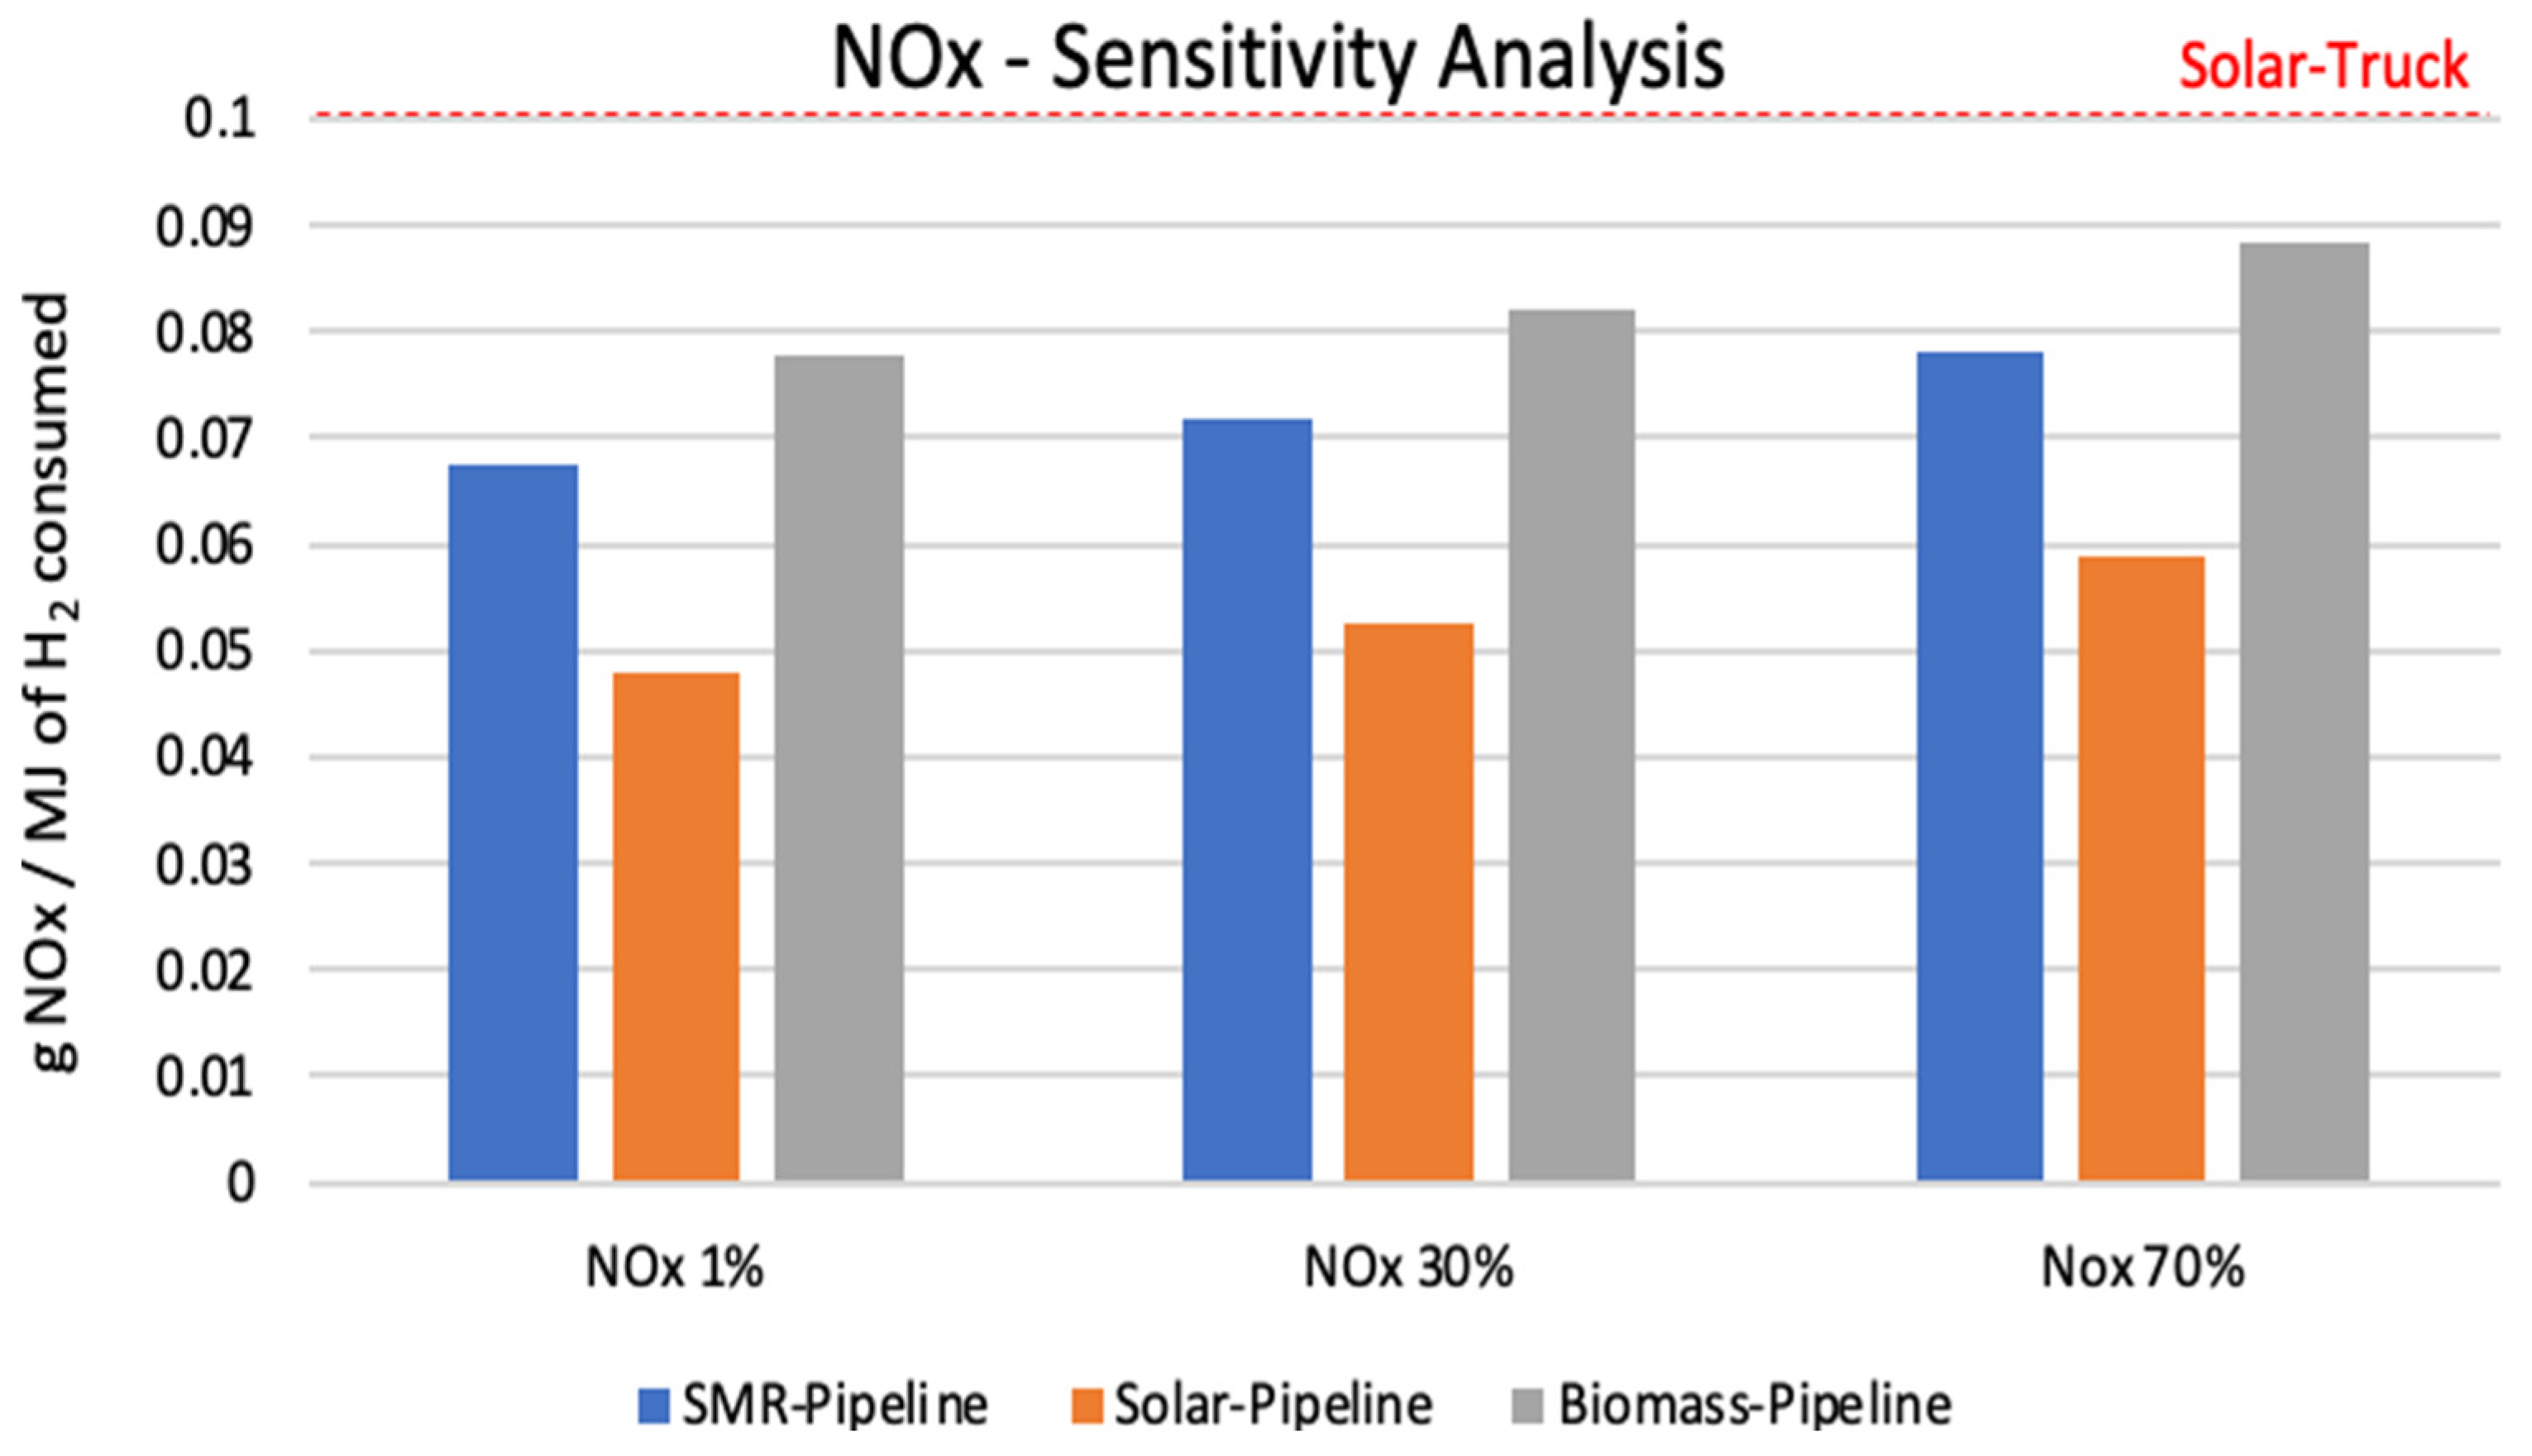
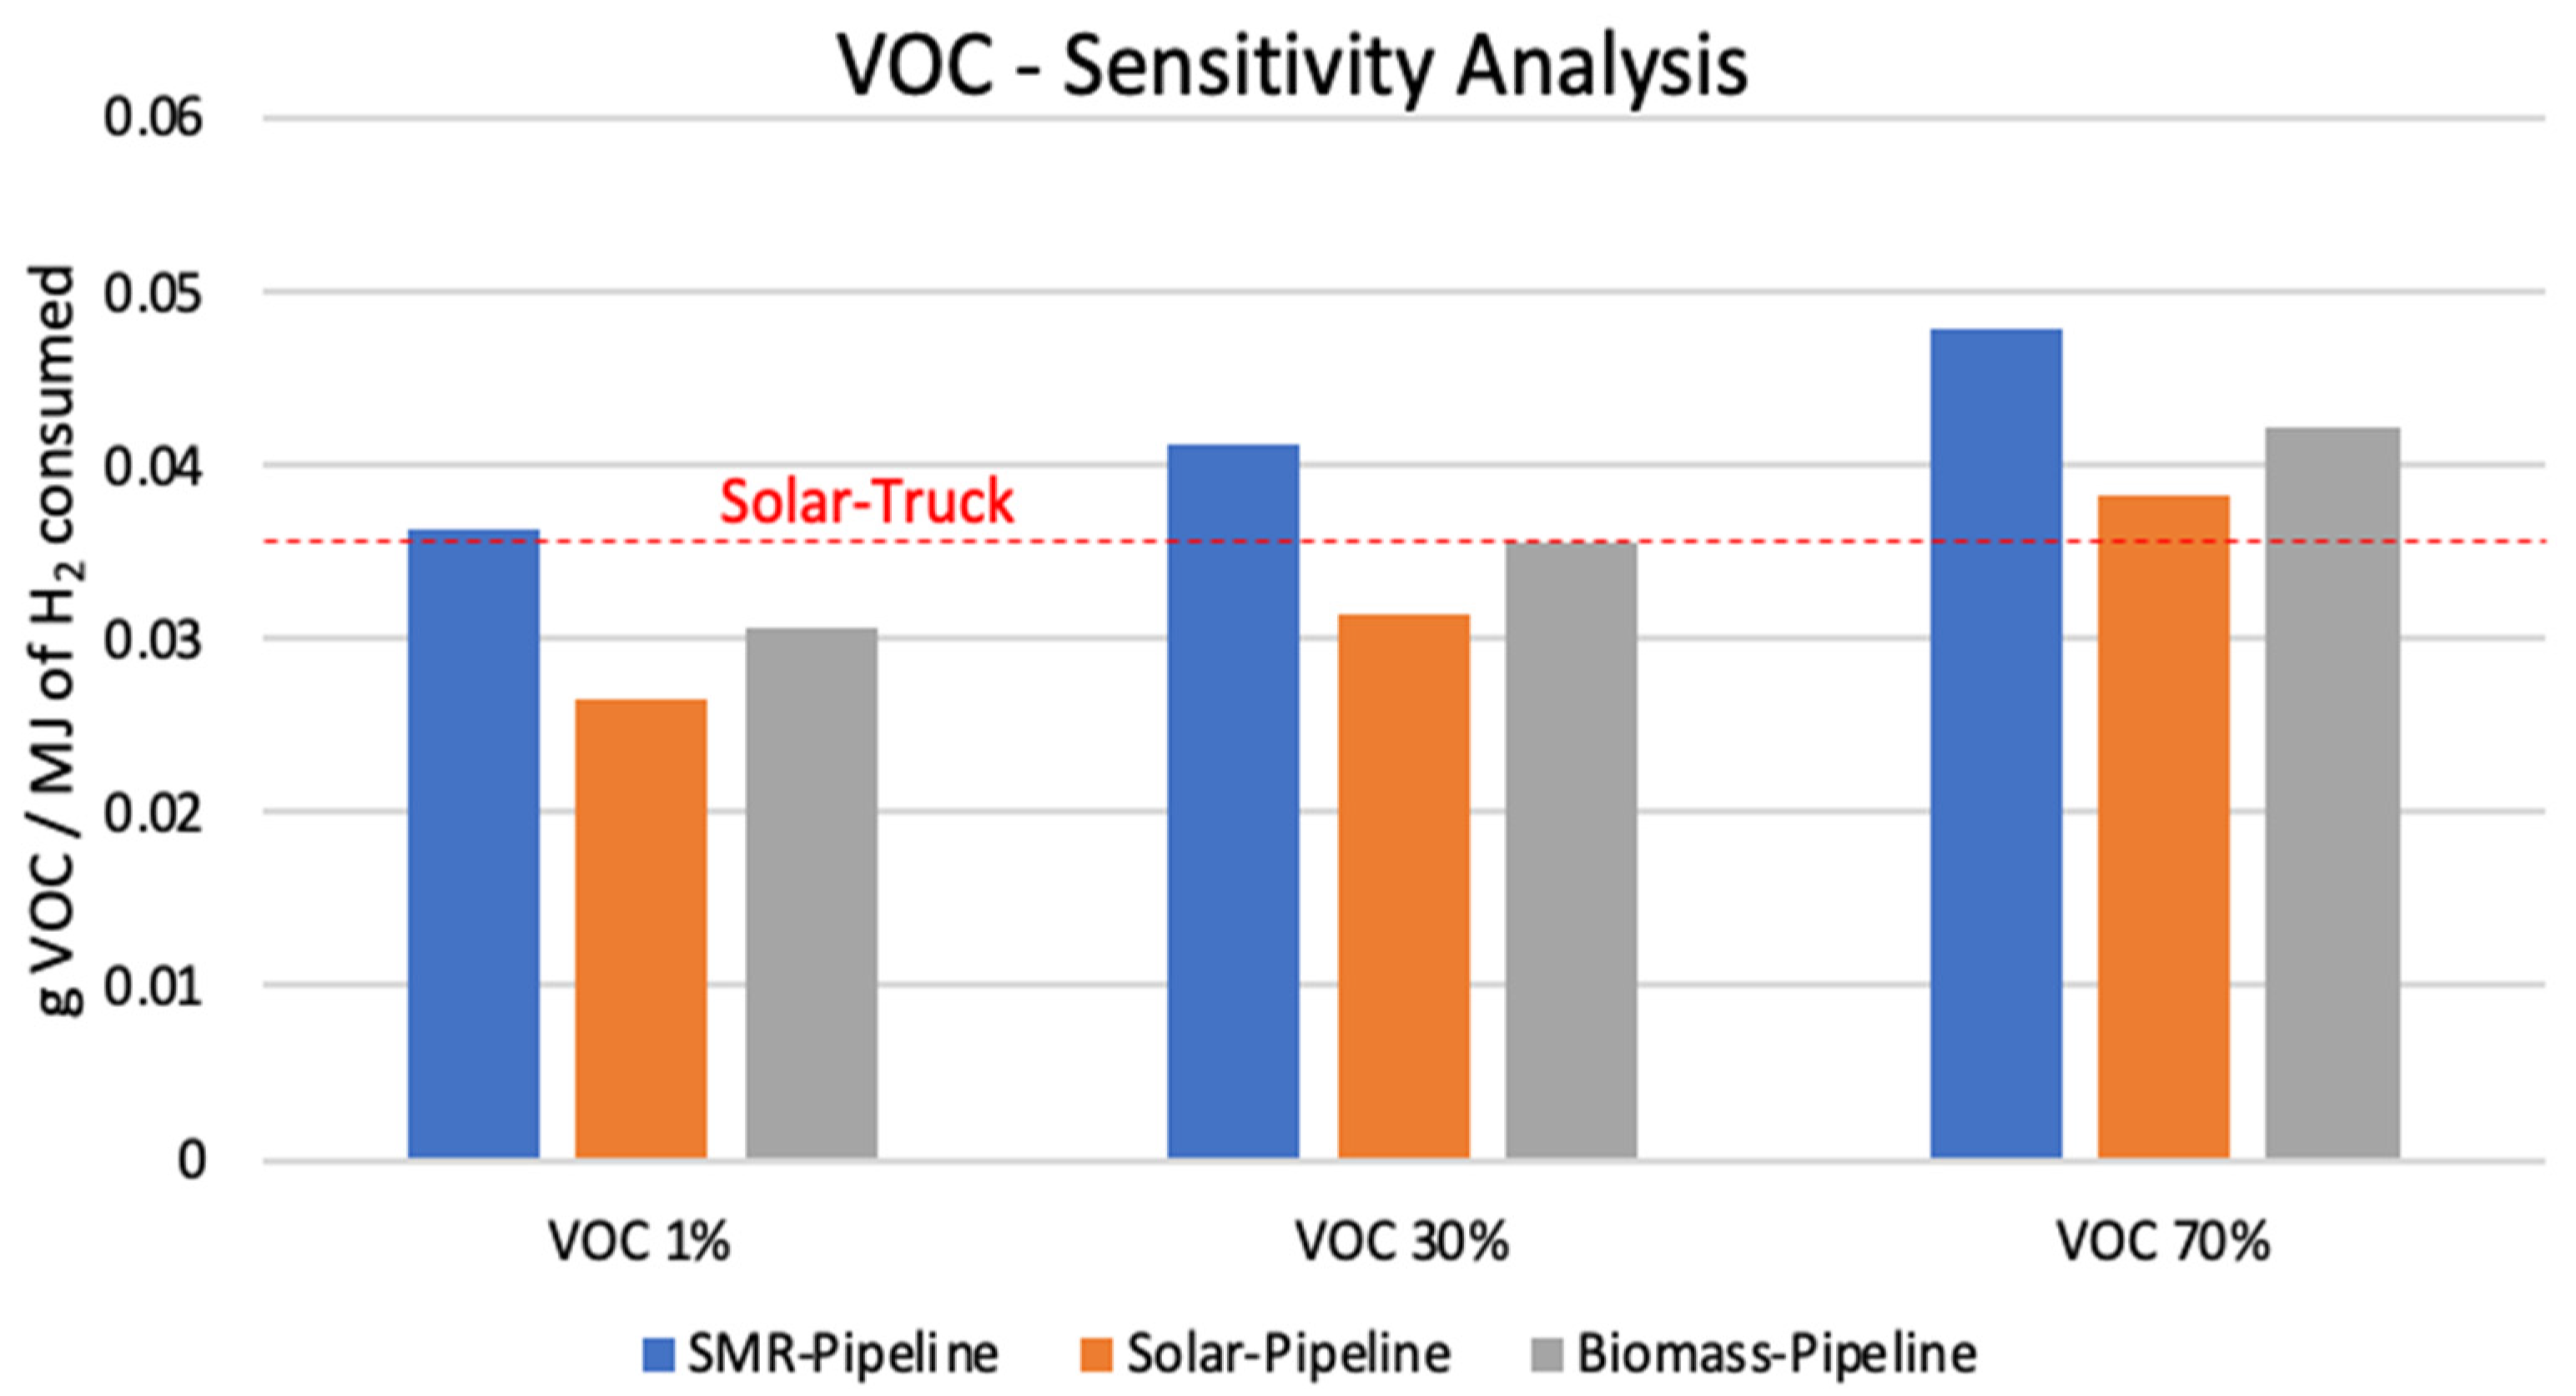
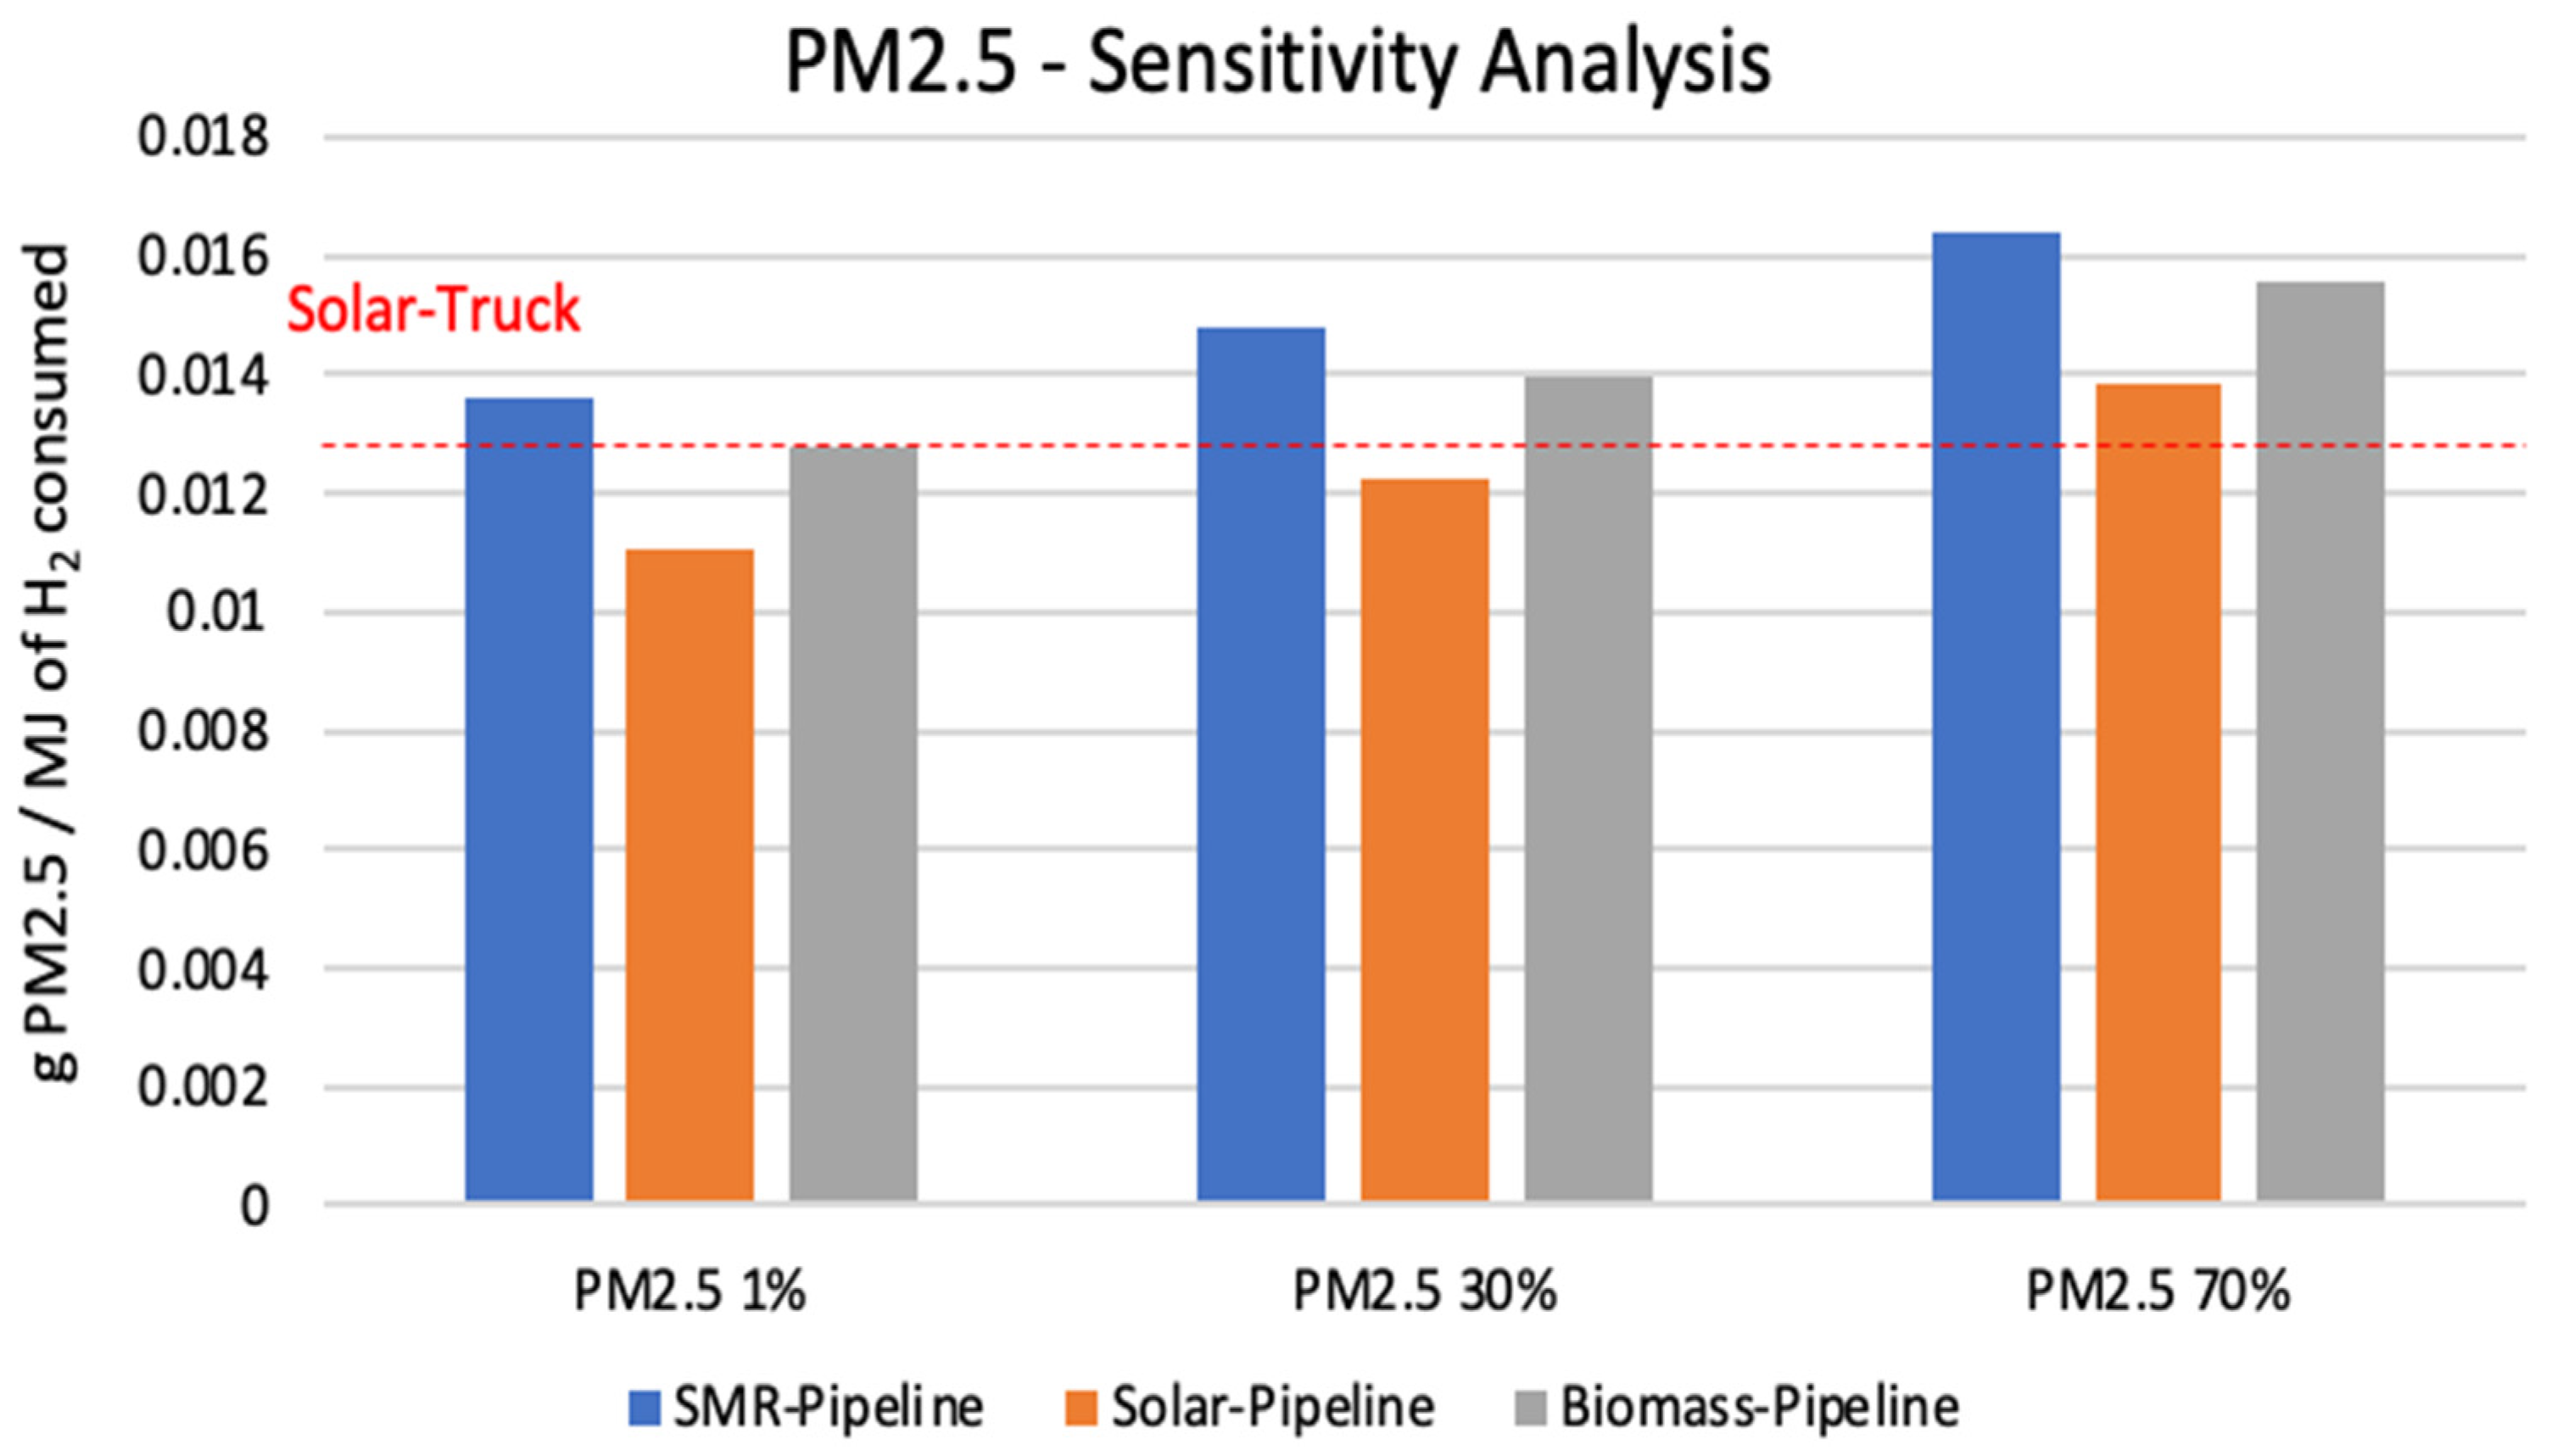
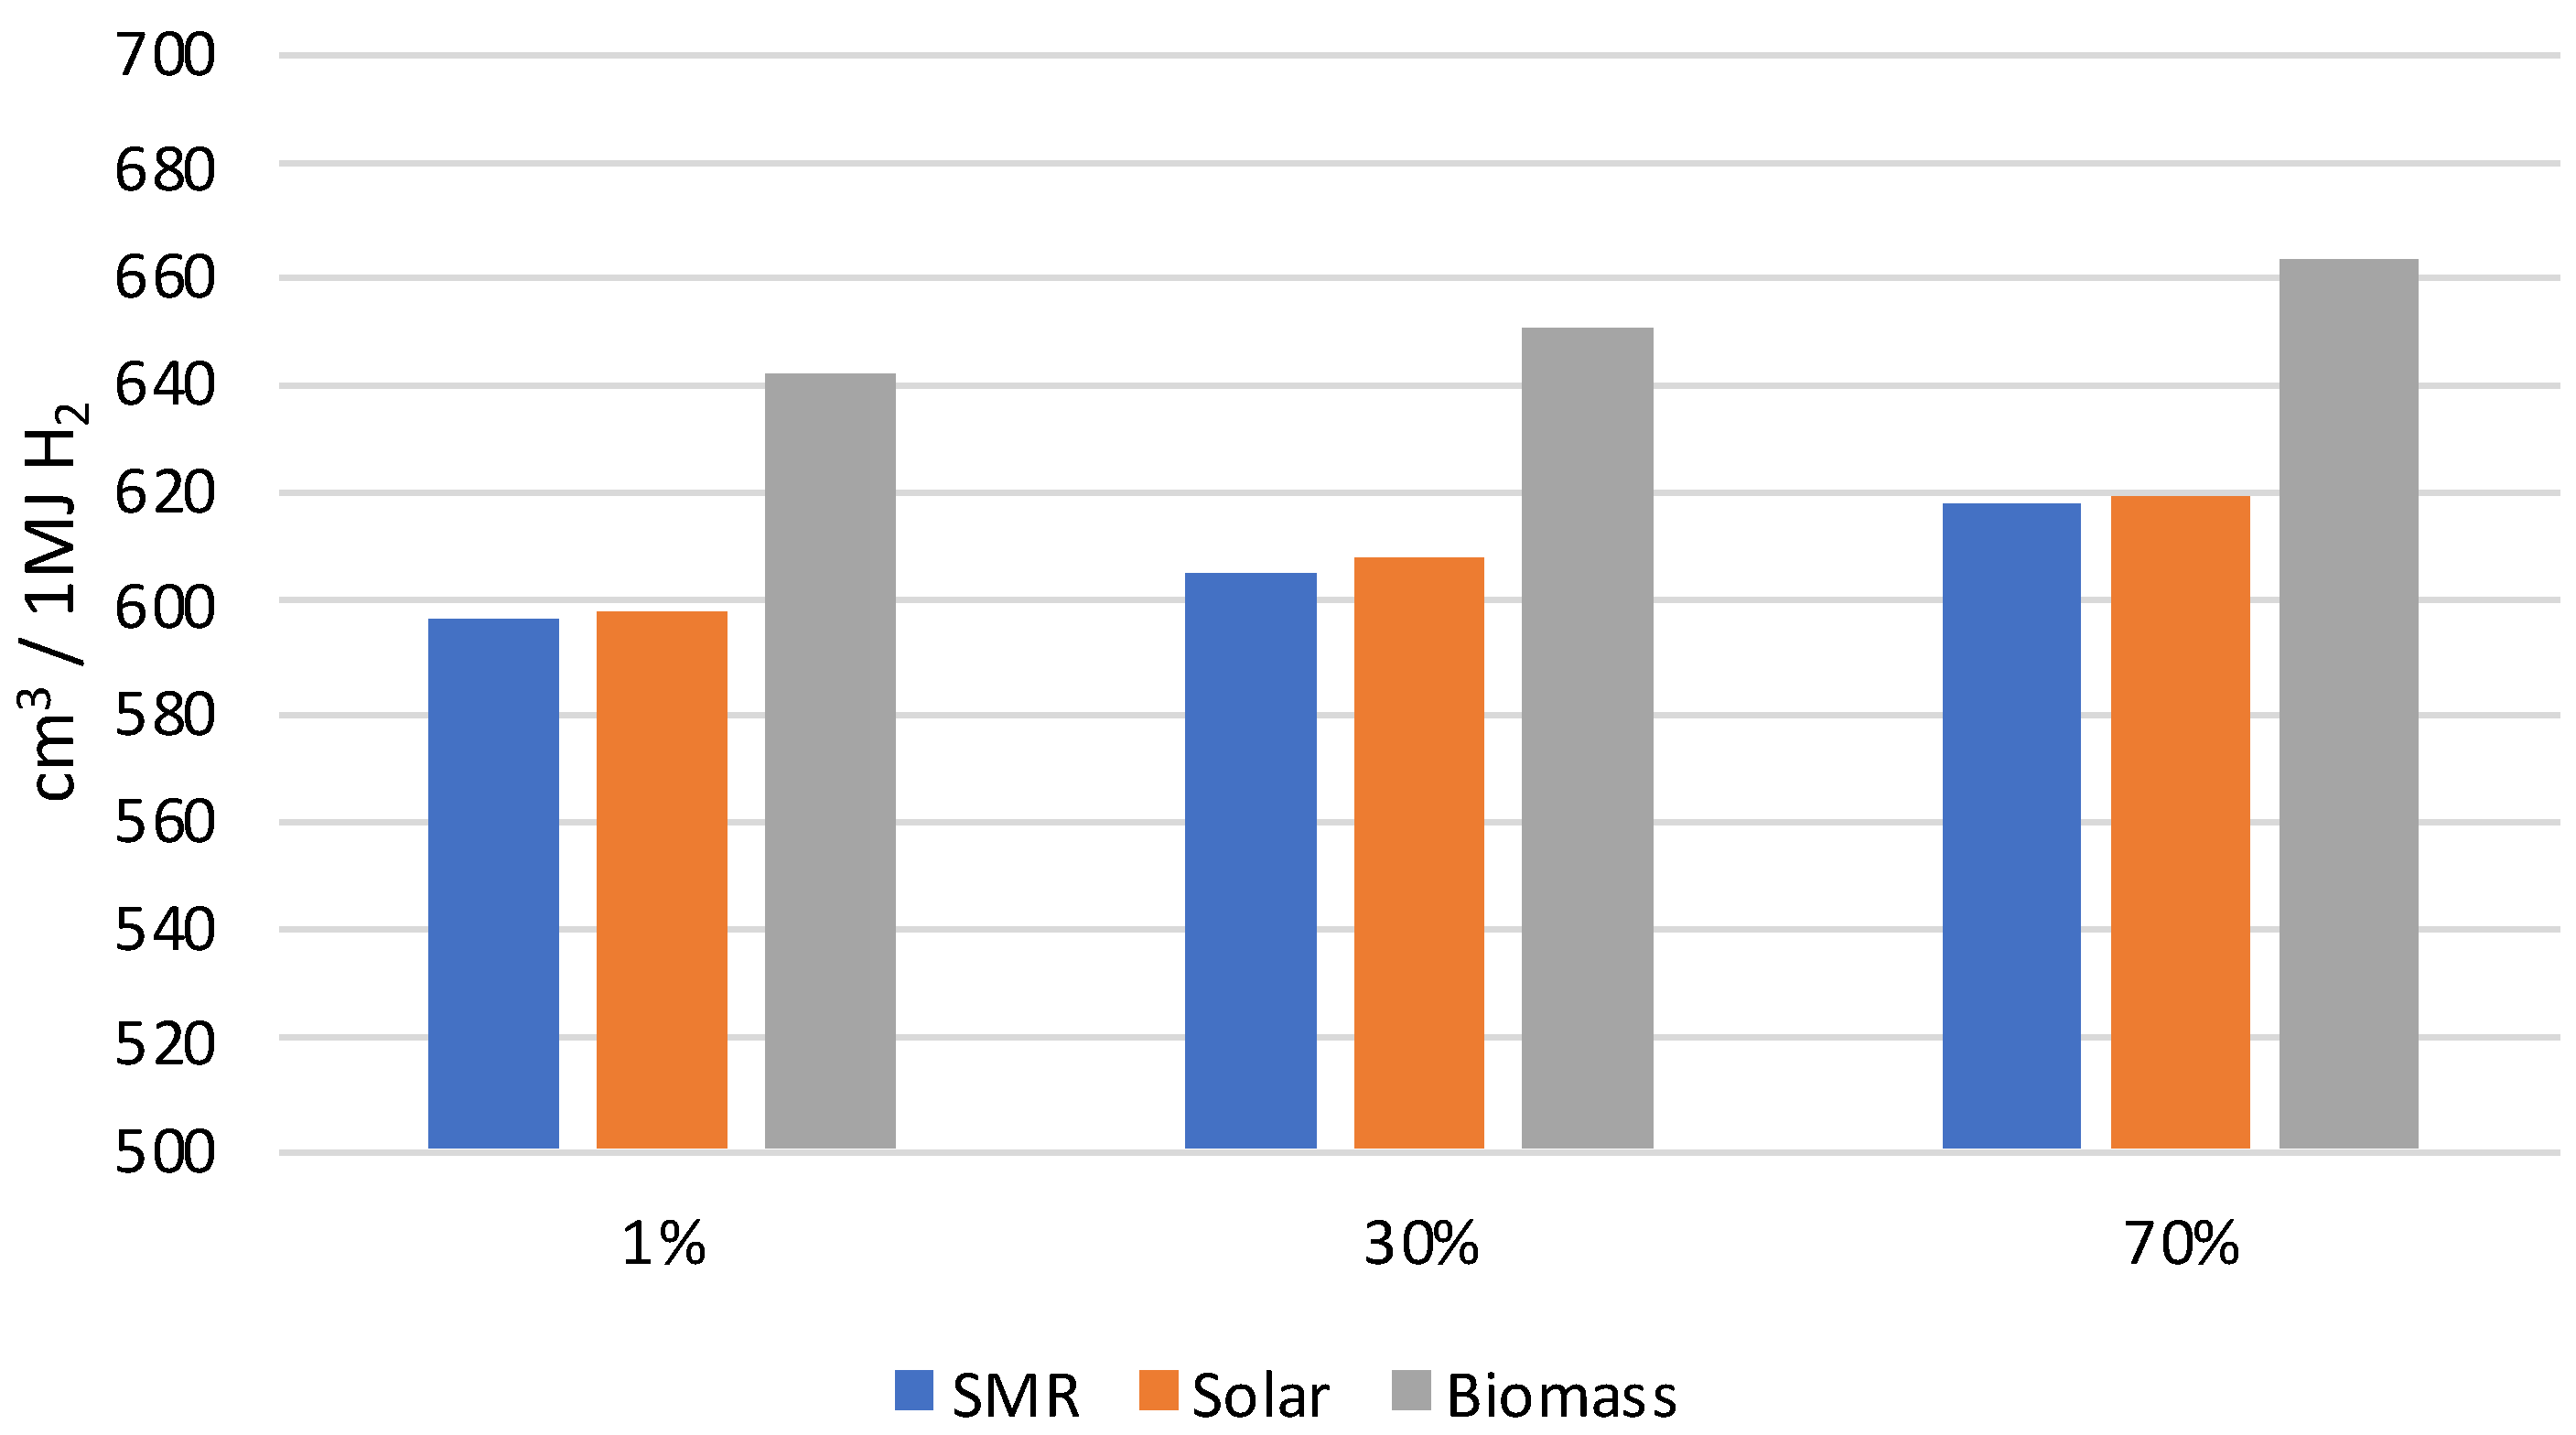
3.1. Sensitivity Analysis
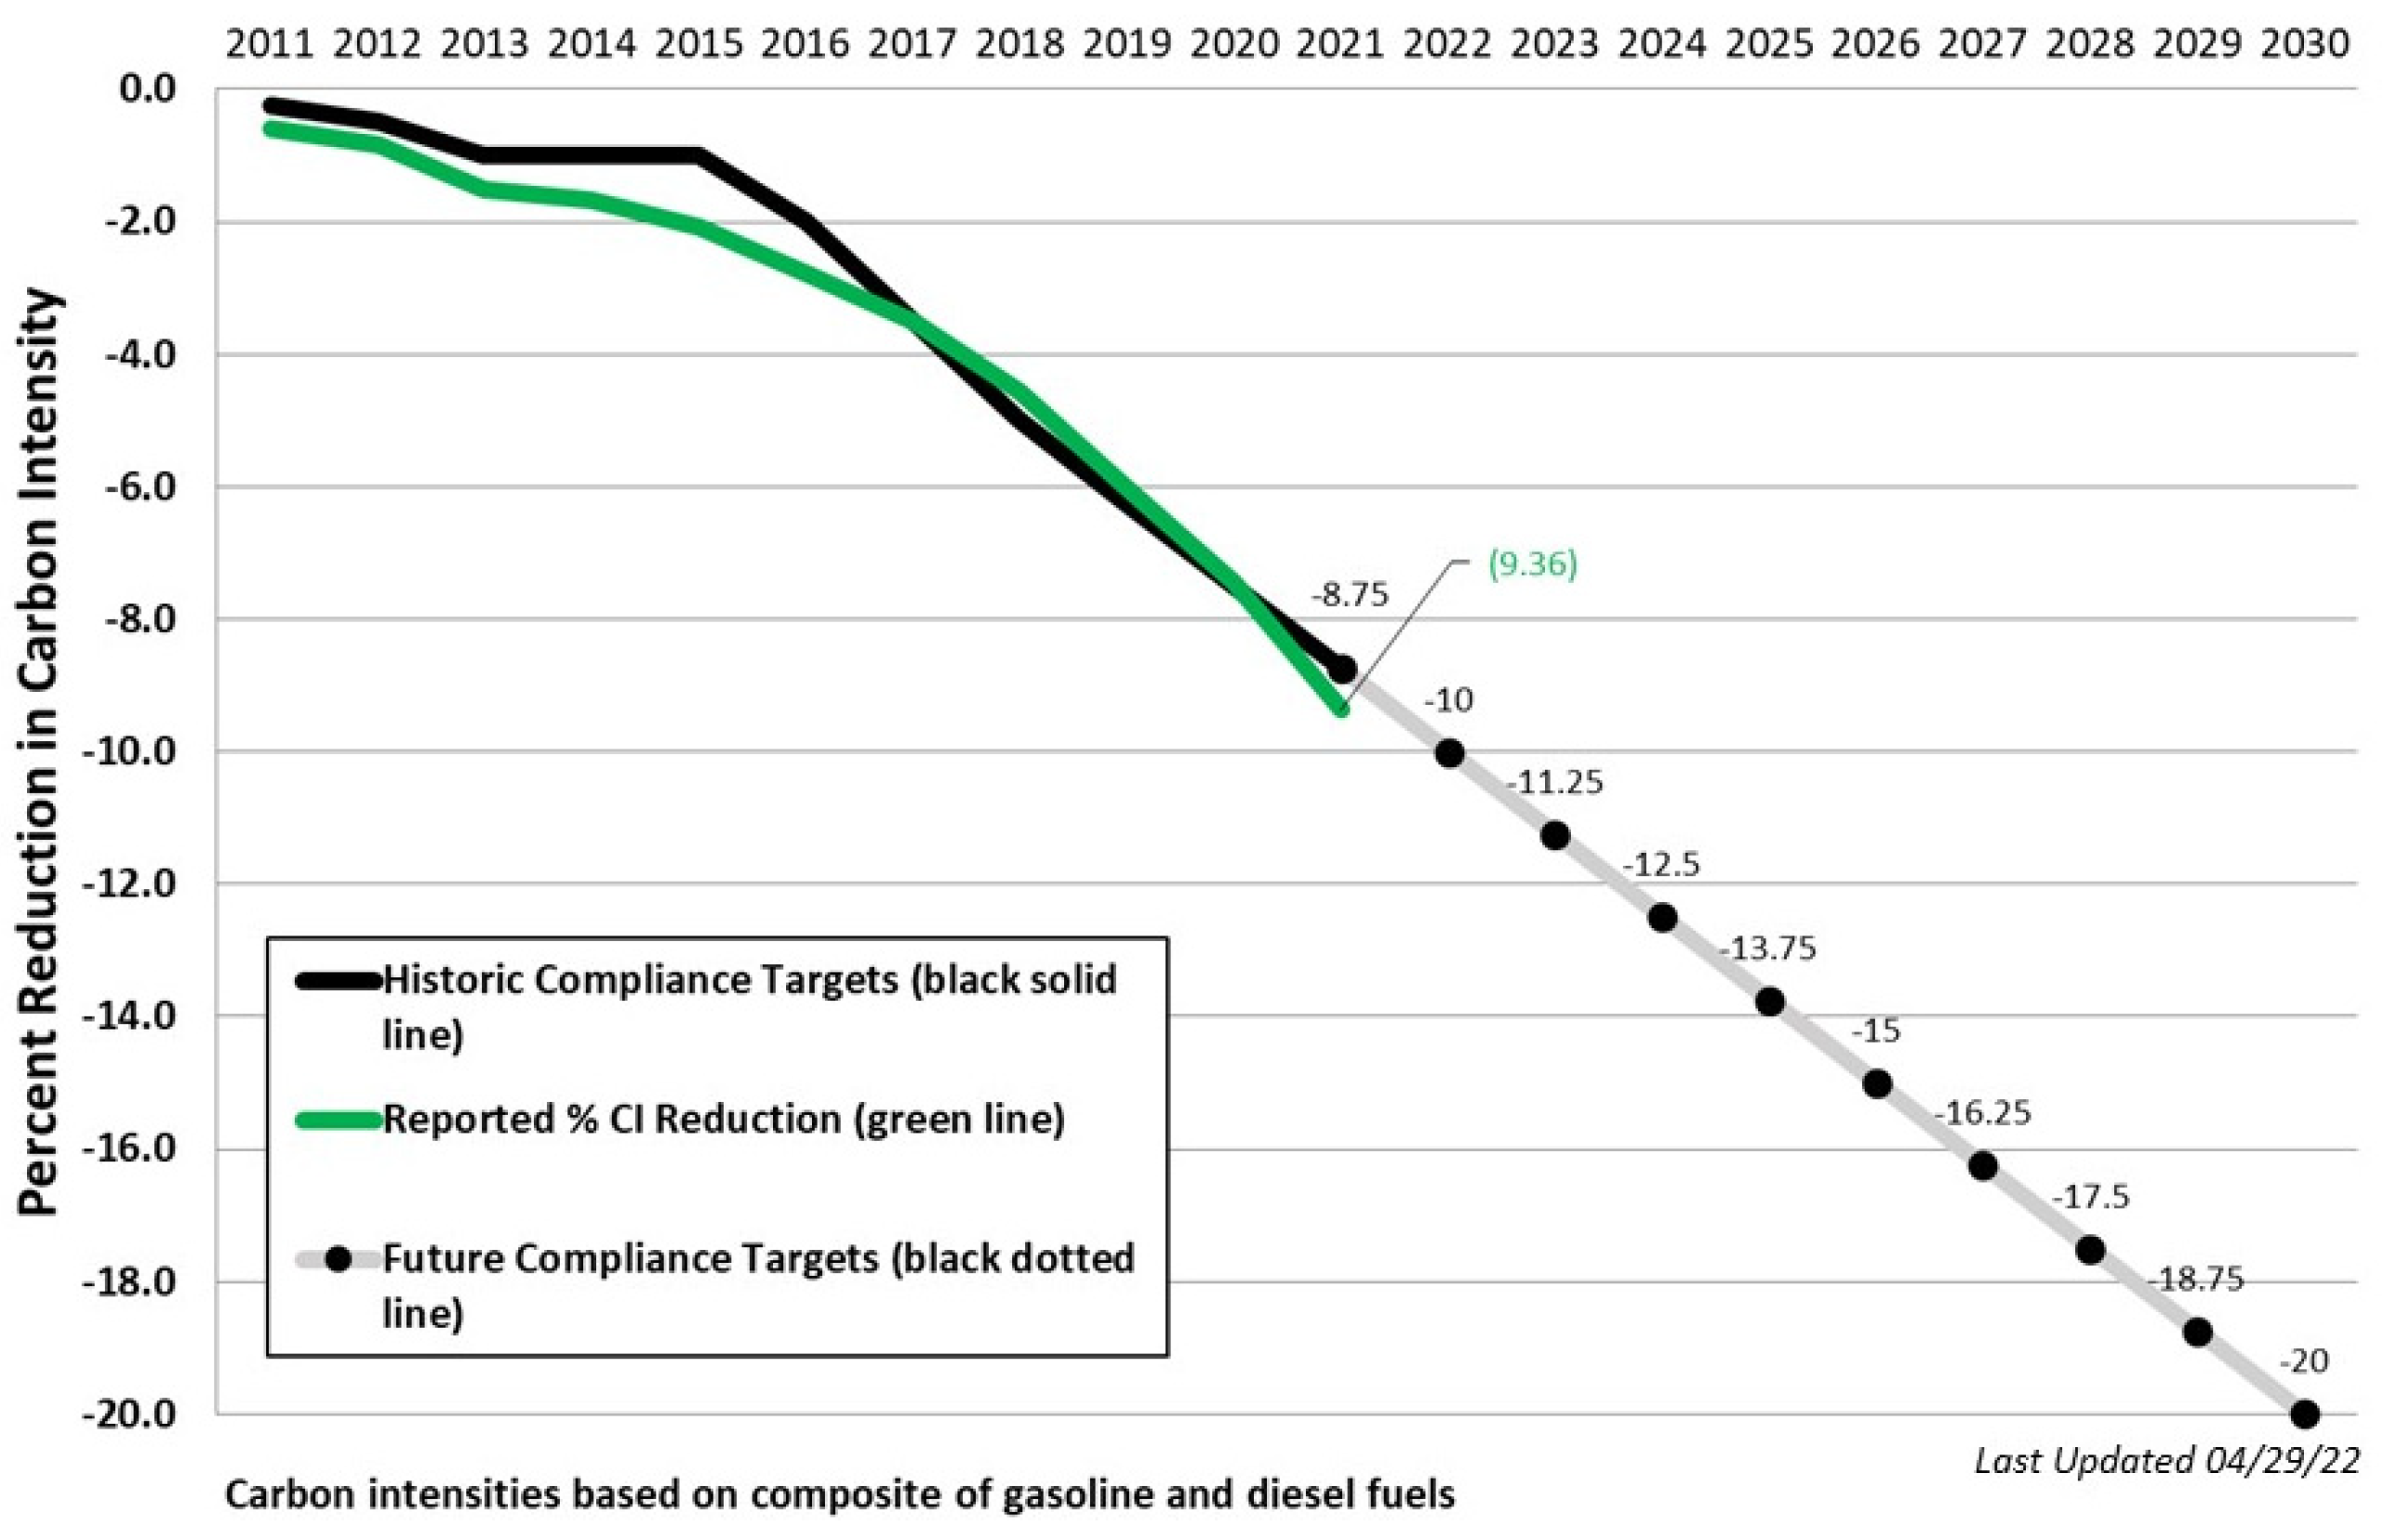
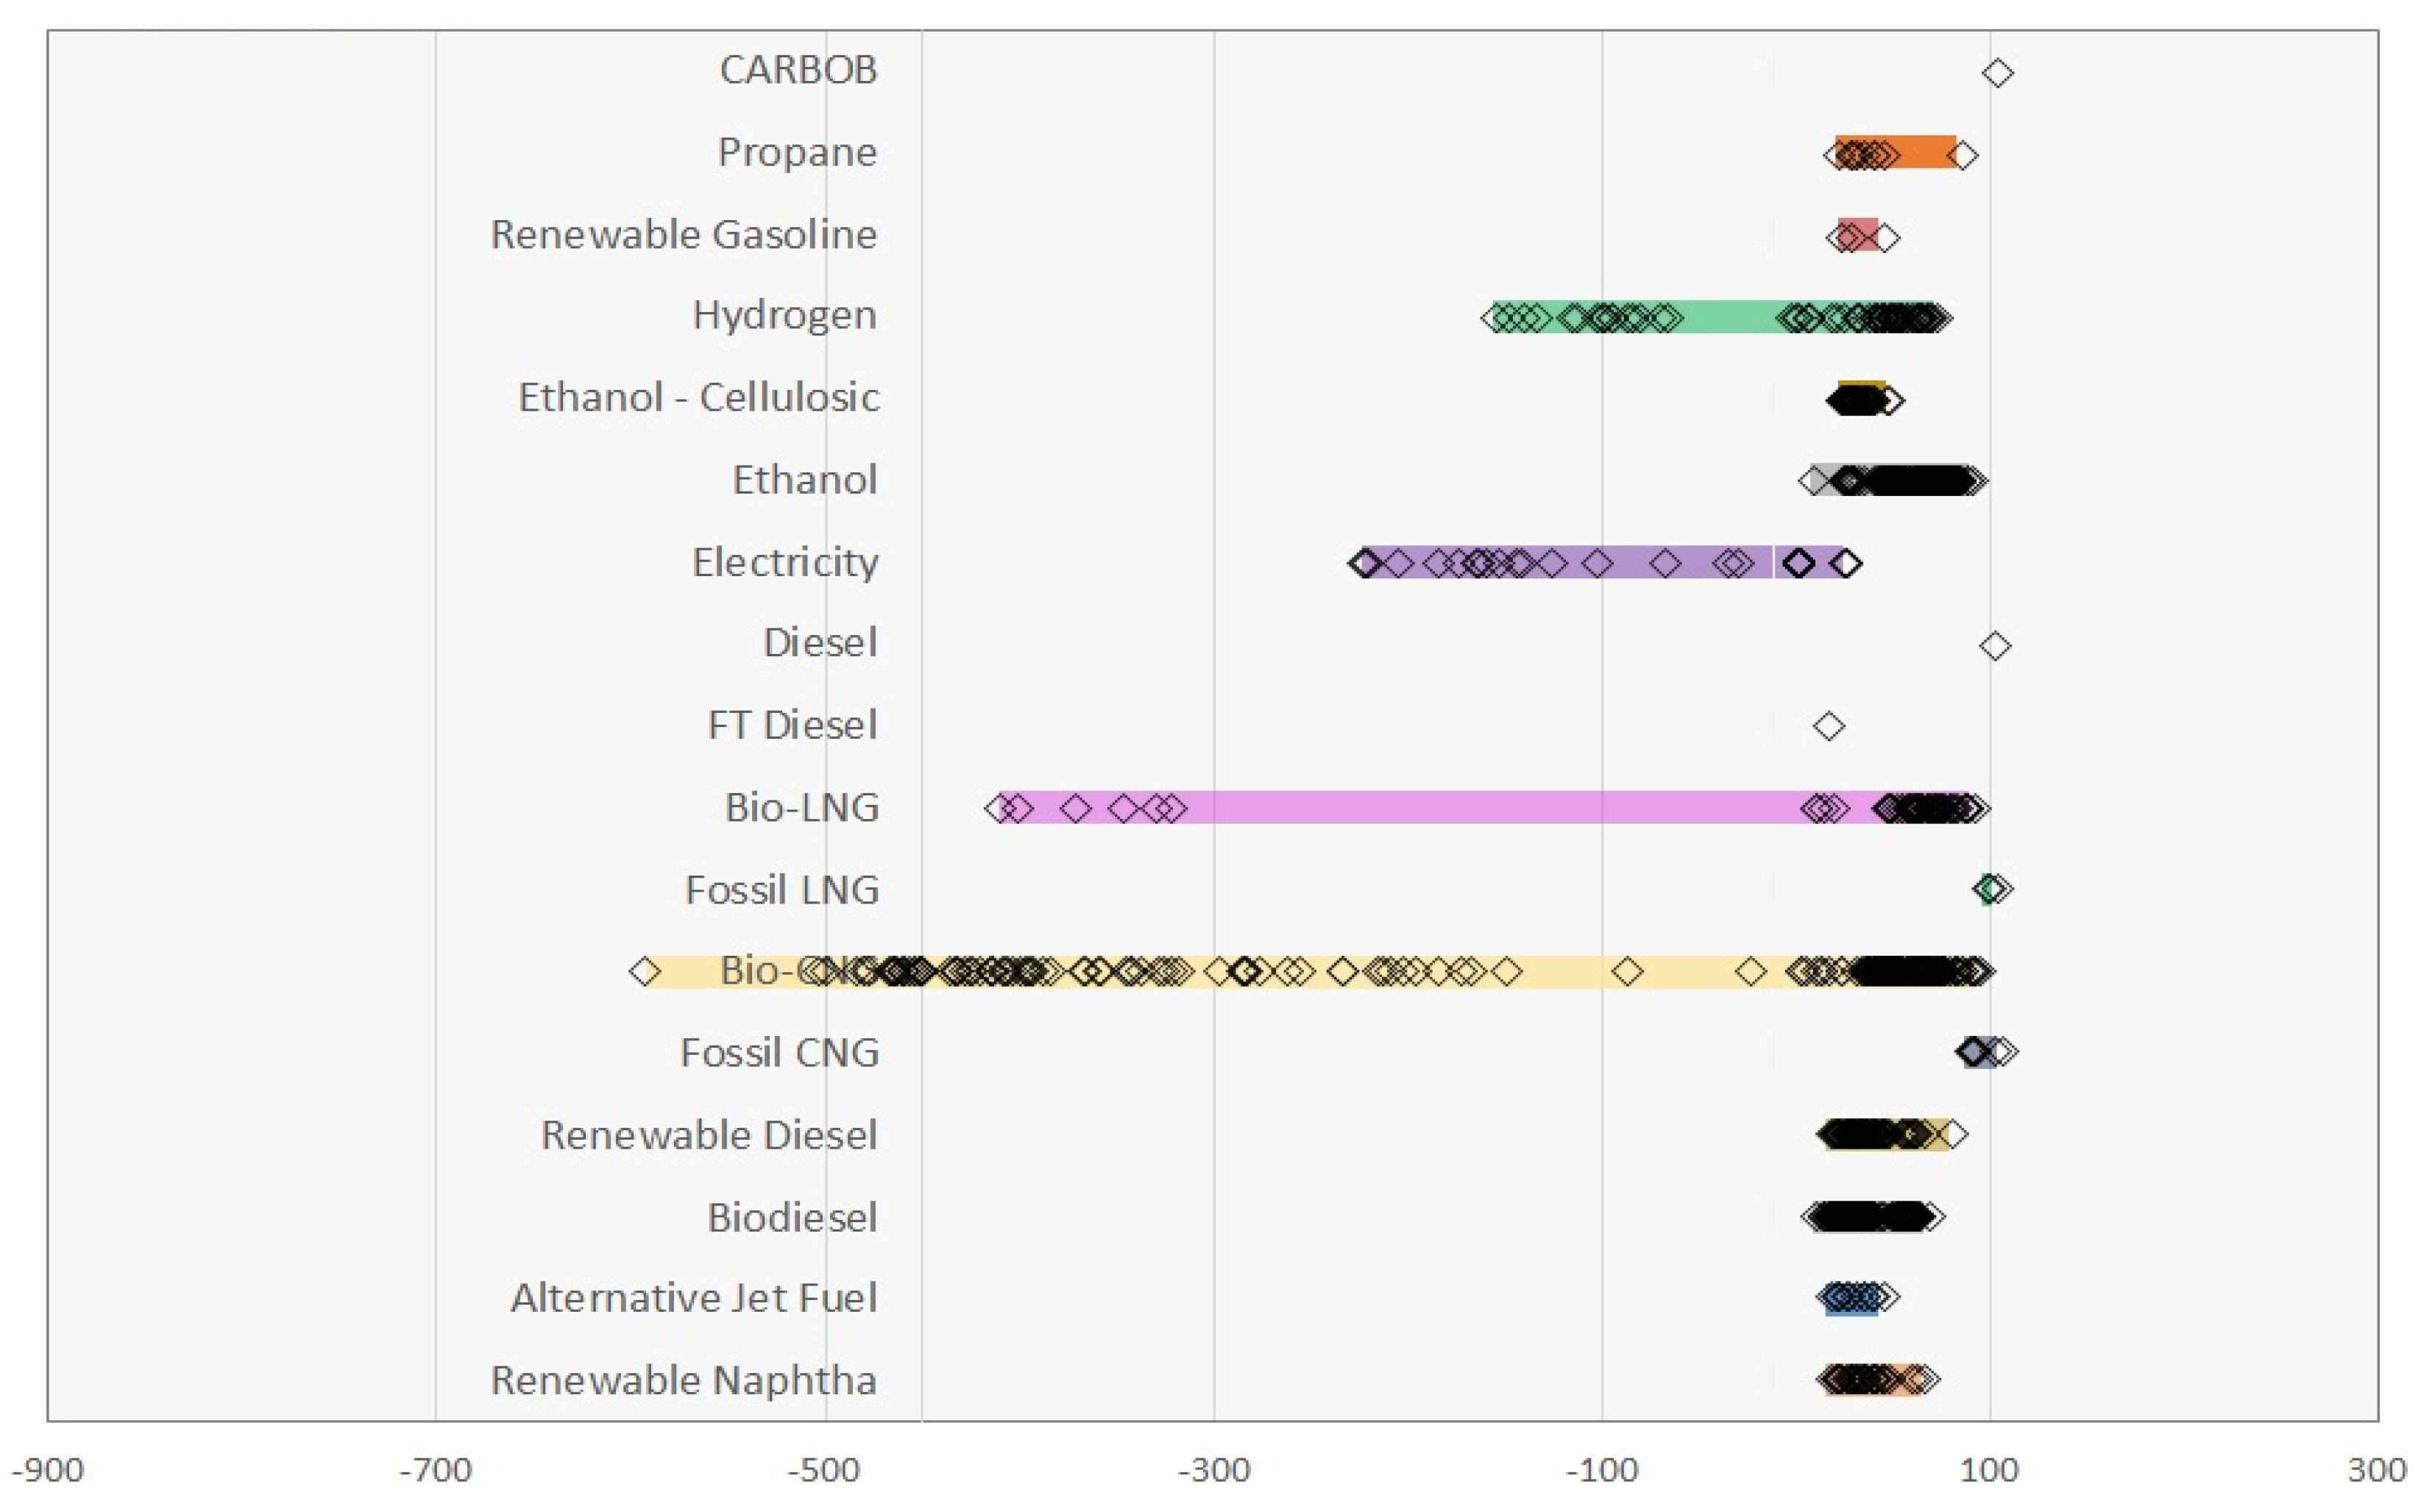
3.2. Policy
4. Discussion
5. Conclusions
Author Contributions
Funding
Institutional Review Board Statement
Informed Consent Statement
Data Availability Statement
Acknowledgments
Conflicts of Interest
Appendix A

| Life Cycle Stage (per 1 MJ Hydrogen Consumed) | ||||||||
|---|---|---|---|---|---|---|---|---|
| Environmental Flow/Impact | H2 Production | Truck trailer Production | Fuel Production | Fuel Consumption | End user Pick-up truck | Total life cycle per MJ consume on FCV | Units | |
| Inputs | Total Non-Renewable Energy | 1301.328 | 95.789 | 1.127 | 0.000 | 20.796 | 1419.039 | kJ |
| Total Renewable Energy | 0.335 | 7.731 | 1.614 | 0.000 | 0.121 | 9.801 | kJ | |
| Total water consumption | 88.943 | 29.568 | 24.705 | 0.000 | 507.316 | 650.533 | cm3 | |
| Outputs | CO2 Total | 0.073 | 0.006 | 0.004 | 0.034 | 0.046 | 0.165 | kg |
| CO2 | 0.073 | 0.006 | 0.004 | 0.034 | 0.047 | 0.165 | kg | |
| CO2 Biogenic | 0.000 | 0.000 | 0.000 | 0.000 | 0.000 | 0.000 | kg | |
| VOC | 0.010 | 0.006 | 0.002 | 0.001 | 0.026 | 0.046 | g | |
| CO | 0.015 | 0.022 | 0.004 | 0.070 | 0.150 | 0.260 | g | |
| NOx | 0.019 | 0.007 | 0.010 | 0.043 | 0.048 | 0.127 | g | |
| PM10 | 0.003 | 0.003 | 0.001 | 0.000 | 0.023 | 0.030 | g | |
| PM2.5 | 0.003 | 0.002 | 0.001 | 0.000 | 0.011 | 0.016 | g | |
| SOx | 0.012 | 0.019 | 0.005 | 0.000 | 0.337 | 0.373 | g | |
| CH4 | 0.178 | 0.015 | 0.031 | 0.000 | 0.119 | 0.343 | g | |
| N2O | 0.001 | 0.000 | 0.000 | 0.000 | 0.001 | 0.002 | g | |
| CF4 | 0.000 | 0.017 | 0.000 | 0.000 | 0.000 | 0.017 | g | |
| SF6 | 0.000 | 0.000 | 0.000 | 0.000 | 0.000 | 0.000 | g | |
| C2F6 | 0.000 | 0.002 | 0.000 | 0.000 | 0.000 | 0.002 | g | |
| CO2e | 78.934 | 6.952 | 5.293 | 34.189 | 50.135 | 175.504 | g | |
| Life Cycle Stage (per 1 MJ Hydrogen Consumed) | ||||||||
|---|---|---|---|---|---|---|---|---|
| Environmental Flow/Impact | H2 Production | Truck trailer Production | Fuel Production | Fuel Consumption | End user Pick-up truck | Total life cycle per MJ consume on FCV | Units | |
| Inputs | Total Non-Renewable Energy | 0.000 | 95.789 | 1.127 | 0.000 | 20.796 | 117.711 | kJ |
| Total Renewable Energy | 1351.000 | 7.731 | 1.614 | 0.000 | 0.121 | 1360.466 | kJ | |
| Total water consumption | 91.491 | 29.568 | 24.705 | 0.000 | 507.316 | 653.080 | cm3 | |
| Outputs | CO2 Total | 0.000 | 0.006 | 0.004 | 0.034 | 0.046 | 0.091 | kg |
| CO2 | 0.000 | 0.006 | 0.004 | 0.034 | 0.047 | 0.092 | kg | |
| CO2 Biogenic | 0.000 | 0.000 | 0.000 | 0.000 | 0.000 | 0.000 | kg | |
| VOC | 0.000 | 0.006 | 0.002 | 0.001 | 0.026 | 0.036 | g | |
| CO | 0.000 | 0.022 | 0.004 | 0.070 | 0.150 | 0.245 | g | |
| NOx | 0.000 | 0.007 | 0.010 | 0.043 | 0.048 | 0.108 | g | |
| PM10 | 0.000 | 0.003 | 0.001 | 0.000 | 0.023 | 0.027 | g | |
| PM2.5 | 0.000 | 0.002 | 0.001 | 0.000 | 0.011 | 0.013 | g | |
| SOx | 0.000 | 0.019 | 0.005 | 0.000 | 0.337 | 0.360 | g | |
| CH4 | 0.000 | 0.015 | 0.031 | 0.000 | 0.119 | 0.166 | g | |
| N2O | 0.000 | 0.000 | 0.000 | 0.000 | 0.001 | 0.001 | g | |
| CF4 | 0.000 | 0.017 | 0.000 | 0.000 | 0.000 | 0.017 | g | |
| SF6 | 0.000 | 0.000 | 0.000 | 0.000 | 0.000 | 0.000 | g | |
| C2F6 | 0.000 | 0.002 | 0.000 | 0.000 | 0.000 | 0.002 | g | |
| CO2e | 0.000 | 6.952 | 5.293 | 34.189 | 50.135 | 96.570 | g | |
| Life Cycle Stage (per 1 MJ Hydrogen Consumed) | ||||||||
|---|---|---|---|---|---|---|---|---|
| Environmental Flow/Impact | H2 Production | Truck trailer Production | Fuel Production | Fuel Consumption | End user Pick-up truck | Total life cycle per MJ consume on FCV | Units | |
| Inputs | Total Non-Renewable Energy | 149.837 | 95.789 | 204.126 | 0.000 | 20.796 | 470.547 | kJ |
| Total Renewable Energy | 2231.000 | 7.731 | 1.002 | 0.000 | 0.121 | 2239.854 | kJ | |
| Total water consumption | 134.304 | 29.568 | 15.334 | 0.000 | 507.316 | 686.523 | cm3 | |
| Outputs | CO2 Total | 0.010 | 0.006 | 0.004 | 0.034 | 0.046 | 0.102 | kg |
| CO2 | 0.011 | 0.006 | 0.004 | 0.034 | 0.047 | 0.102 | kg | |
| CO2 Biogenic | 0.000 | 0.000 | 0.000 | 0.000 | 0.000 | 0.000 | kg | |
| VOC | 0.004 | 0.006 | 0.002 | 0.001 | 0.026 | 0.040 | g | |
| CO | 0.018 | 0.022 | 0.004 | 0.070 | 0.150 | 0.263 | g | |
| NOx | 0.030 | 0.007 | 0.010 | 0.043 | 0.048 | 0.137 | g | |
| PM10 | 0.002 | 0.003 | 0.001 | 0.000 | 0.023 | 0.029 | g | |
| PM2.5 | 0.002 | 0.002 | 0.001 | 0.000 | 0.011 | 0.015 | g | |
| SOx | 0.020 | 0.019 | 0.005 | 0.000 | 0.337 | 0.380 | g | |
| CH4 | 0.019 | 0.015 | 0.031 | 0.000 | 0.119 | 0.185 | g | |
| N2O | 0.006 | 0.000 | 0.000 | 0.000 | 0.001 | 0.008 | g | |
| CF4 | 0.000 | 0.017 | 0.000 | 0.000 | 0.000 | 0.017 | g | |
| SF6 | 0.000 | 0.000 | 0.000 | 0.000 | 0.000 | 0.000 | g | |
| C2F6 | 0.000 | 0.002 | 0.000 | 0.000 | 0.000 | 0.002 | g | |
| CO2e | 12.740 | 6.952 | 5.293 | 34.189 | 50.135 | 109.310 | g | |
| Life Cycle Stage (per 1 MJ Hydrogen Consumed) | ||||||
|---|---|---|---|---|---|---|
| Environmental Flow/Impact | H2 Production | Pipeline Production and construction | End user Pick-up truck | Total life cycle per MJ consume on FCV | Units | |
| Inputs | Total Non-Renewable Energy | 1301.328 | 1.922 | 20.796 | 1324.046 | kJ |
| Total Renewable Energy | 0.335 | 0.094 | 0.121 | 0.550 | kJ | |
| Total water consumption | 88.943 | 0.305 | 507.316 | 596.564 | cm3 | |
| Outputs | CO2 Total | 0.073 | 0.000 | 0.046 | 0.120 | kg |
| CO2 | 0.073 | 0.000 | 0.047 | 0.120 | kg | |
| CO2 Biogenic | 0.000 | 0.000 | 0.000 | 0.000 | kg | |
| VOC | 0.010 | 0.000 | 0.026 | 0.036 | g | |
| CO | 0.015 | 0.001 | 0.150 | 0.166 | g | |
| NOx | 0.019 | 0.000 | 0.048 | 0.067 | g | |
| PM10 | 0.003 | 0.000 | 0.023 | 0.026 | g | |
| PM2.5 | 0.003 | 0.000 | 0.011 | 0.014 | g | |
| SOx | 0.012 | 0.001 | 0.337 | 0.350 | g | |
| CH4 | 0.178 | 0.000 | 0.119 | 0.297 | g | |
| N2O | 0.001 | 0.000 | 0.001 | 0.002 | g | |
| CF4 | 0.000 | 0.000 | 0.000 | 0.000 | g | |
| SF6 | 0.000 | 0.000 | 0.000 | 0.000 | g | |
| C2F6 | 0.000 | 0.000 | 0.000 | 0.000 | g | |
| CO2e | 78.934 | 0.163 | 50.135 | 129.233 | g | |
| Life Cycle Stage (per 1 MJ Hydrogen Consumed) | ||||||
|---|---|---|---|---|---|---|
| Environmental Flow/Impact | H2 Production | Pipeline Production and construction | End user Pick-up truck | Total life cycle per MJ consume on FCV | Units | |
| Inputs | Total Non-Renewable Energy | 0.000 | 1.922 | 20.796 | 22.717 | kJ |
| Total Renewable Energy | 1351.000 | 0.094 | 0.121 | 1351.215 | kJ | |
| Total water consumption | 91.491 | 0.305 | 507.316 | 599.112 | cm3 | |
| Outputs | CO2 Total | 0.000 | 0.000 | 0.046 | 0.046 | kg |
| CO2 | 0.000 | 0.000 | 0.047 | 0.047 | kg | |
| CO2 Biogenic | 0.000 | 0.000 | 0.000 | 0.000 | kg | |
| VOC | 0.000 | 0.000 | 0.026 | 0.027 | g | |
| CO | 0.000 | 0.001 | 0.150 | 0.151 | g | |
| NOx | 0.000 | 0.000 | 0.048 | 0.048 | g | |
| PM10 | 0.000 | 0.000 | 0.023 | 0.023 | g | |
| PM2.5 | 0.000 | 0.000 | 0.011 | 0.011 | g | |
| SOx | 0.000 | 0.001 | 0.337 | 0.337 | g | |
| CH4 | 0.000 | 0.000 | 0.119 | 0.120 | g | |
| N2O | 0.000 | 0.000 | 0.001 | 0.001 | g | |
| CF4 | 0.000 | 0.000 | 0.000 | 0.000 | g | |
| SF6 | 0.000 | 0.000 | 0.000 | 0.000 | g | |
| C2F6 | 0.000 | 0.000 | 0.000 | 0.000 | g | |
| CO2e | 0.000 | 0.163 | 50.135 | 50.298 | g | |
| Life Cycle Stage (per 1 MJ Hydrogen Consumed) | ||||||
|---|---|---|---|---|---|---|
| Environmental Flow/Impact | H2 Production | Pipeline Production and construction | End user Pick-up truck | Total life cycle per MJ consume on FCV | Units | |
| Inputs | Total Non-Renewable Energy | 149.837 | 1.922 | 20.796 | 172.554 | kJ |
| Total Renewable Energy | 2231.000 | 0.094 | 0.121 | 2231.215 | kJ | |
| Total water consumption | 134.304 | 0.305 | 507.316 | 641.925 | cm3 | |
| Outputs | CO2 Total | 0.010 | 0.000 | 0.046 | 0.057 | kg |
| CO2 | 0.011 | 0.000 | 0.047 | 0.057 | kg | |
| CO2 Biogenic | 0.000 | 0.000 | 0.000 | 0.000 | kg | |
| VOC | 0.004 | 0.000 | 0.026 | 0.031 | g | |
| CO | 0.018 | 0.001 | 0.150 | 0.169 | g | |
| NOx | 0.030 | 0.000 | 0.048 | 0.078 | g | |
| PM10 | 0.002 | 0.000 | 0.023 | 0.025 | g | |
| PM2.5 | 0.002 | 0.000 | 0.011 | 0.013 | g | |
| SOx | 0.020 | 0.001 | 0.337 | 0.357 | g | |
| CH4 | 0.019 | 0.000 | 0.119 | 0.139 | g | |
| N2O | 0.006 | 0.000 | 0.001 | 0.007 | g | |
| CF4 | 0.000 | 0.000 | 0.000 | 0.000 | g | |
| SF6 | 0.000 | 0.000 | 0.000 | 0.000 | g | |
| C2F6 | 0.000 | 0.000 | 0.000 | 0.000 | g | |
| CO2e | 12.740 | 0.163 | 50.135 | 63.038 | g | |
Appendix B
| Life Cycle Stage (per 1 MJ Hydrogen Consumed) | ||||||
|---|---|---|---|---|---|---|
| Environmental Flow/Impact | H2 Production | Pipeline Production and construction | End user Pick-up truck | Total life cycle per MJ consume on FCV | Units | |
| Inputs | Total Non-Renewable Energy | 1301.328 | 57.655 | 20.796 | 1379.779 | kJ |
| Total Renewable Energy | 0.335 | 2.813 | 0.121 | 3.269 | kJ | |
| Total water consumption | 88.943 | 9.152 | 507.316 | 605.411 | cm3 | |
| Outputs | CO2 Total | 0.073 | 0.005 | 0.046 | 0.124 | kg |
| CO2 | 0.073 | 0.005 | 0.047 | 0.125 | kg | |
| CO2 Biogenic | 0.000 | 0.000 | 0.000 | 0.000 | kg | |
| VOC | 0.010 | 0.005 | 0.026 | 0.041 | g | |
| CO | 0.015 | 0.036 | 0.150 | 0.201 | g | |
| NOx | 0.019 | 0.005 | 0.048 | 0.072 | g | |
| PM10 | 0.003 | 0.003 | 0.023 | 0.028 | g | |
| PM2.5 | 0.003 | 0.001 | 0.011 | 0.015 | g | |
| SOx | 0.012 | 0.017 | 0.337 | 0.366 | g | |
| CH4 | 0.178 | 0.009 | 0.119 | 0.306 | g | |
| N2O | 0.001 | 0.000 | 0.001 | 0.002 | g | |
| CF4 | 0.000 | 0.000 | 0.000 | 0.000 | g | |
| SF6 | 0.000 | 0.000 | 0.000 | 0.000 | g | |
| C2F6 | 0.000 | 0.000 | 0.000 | 0.000 | g | |
| CO2e | 78.934 | 4.881 | 50.135 | 133.951 | g | |
| Life Cycle Stage (per 1 MJ Hydrogen Consumed) | ||||||
|---|---|---|---|---|---|---|
| Environmental Flow/Impact | H2 Production | Pipeline Production and construction | End user Pick-up truck | Total life cycle per MJ consume on FCV | Units | |
| Inputs | Total Non-Renewable Energy | 0.000 | 57.655 | 20.796 | 78.450 | kJ |
| Total Renewable Energy | 1351.000 | 2.813 | 0.121 | 1353.934 | kJ | |
| Total water consumption | 91.491 | 9.152 | 507.316 | 607.959 | cm3 | |
| Outputs | CO2 Total | 0.000 | 0.005 | 0.046 | 0.051 | kg |
| CO2 | 0.000 | 0.005 | 0.047 | 0.051 | kg | |
| CO2 Biogenic | 0.000 | 0.000 | 0.000 | 0.000 | kg | |
| VOC | 0.000 | 0.005 | 0.026 | 0.032 | g | |
| CO | 0.000 | 0.036 | 0.150 | 0.186 | g | |
| NOx | 0.000 | 0.005 | 0.048 | 0.053 | g | |
| PM10 | 0.000 | 0.003 | 0.023 | 0.026 | g | |
| PM2.5 | 0.000 | 0.001 | 0.011 | 0.012 | g | |
| SOx | 0.000 | 0.017 | 0.337 | 0.354 | g | |
| CH4 | 0.000 | 0.009 | 0.119 | 0.128 | g | |
| N2O | 0.000 | 0.000 | 0.001 | 0.001 | g | |
| CF4 | 0.000 | 0.000 | 0.000 | 0.000 | g | |
| SF6 | 0.000 | 0.000 | 0.000 | 0.000 | g | |
| C2F6 | 0.000 | 0.000 | 0.000 | 0.000 | g | |
| CO2e | 0.000 | 4.881 | 50.135 | 55.016 | g | |
| Life Cycle Stage (per 1 MJ Hydrogen Consumed) | ||||||
|---|---|---|---|---|---|---|
| Environmental Flow/Impact | H2 Production | Pipeline Production and construction | End user Pick-up truck | Total life cycle per MJ consume on FCV | Units | |
| Inputs | Total Non-Renewable Energy | 149.837 | 57.655 | 20.796 | 228.287 | kJ |
| Total Renewable Energy | 2231.000 | 2.813 | 0.121 | 2233.934 | kJ | |
| Total water consumption | 134.304 | 9.152 | 507.316 | 650.772 | cm3 | |
| Outputs | CO2 Total | 0.010 | 0.005 | 0.046 | 0.061 | kg |
| CO2 | 0.011 | 0.005 | 0.047 | 0.062 | kg | |
| CO2 Biogenic | 0.000 | 0.000 | 0.000 | 0.000 | kg | |
| VOC | 0.004 | 0.005 | 0.026 | 0.035 | g | |
| CO | 0.018 | 0.036 | 0.150 | 0.203 | g | |
| NOx | 0.030 | 0.005 | 0.048 | 0.082 | g | |
| PM10 | 0.002 | 0.003 | 0.023 | 0.028 | g | |
| PM2.5 | 0.002 | 0.001 | 0.011 | 0.014 | g | |
| SOx | 0.020 | 0.017 | 0.337 | 0.374 | g | |
| CH4 | 0.019 | 0.009 | 0.119 | 0.148 | g | |
| N2O | 0.006 | 0.000 | 0.001 | 0.008 | g | |
| CF4 | 0.000 | 0.000 | 0.000 | 0.000 | g | |
| SF6 | 0.000 | 0.000 | 0.000 | 0.000 | g | |
| C2F6 | 0.000 | 0.000 | 0.000 | 0.000 | g | |
| CO2e | 12.740 | 4.881 | 50.135 | 67.757 | g | |
| Life Cycle Stage (per 1 MJ Hydrogen Consumed) | ||||||
|---|---|---|---|---|---|---|
| Environmental Flow/Impact | H2 Production | Pipeline Production and construction | End user Pick-up truck | Total life cycle per MJ consume on FCV | Units | |
| Inputs | Total Non-Renewable Energy | 1301.328 | 134.528 | 20.796 | 1456.652 | kJ |
| Total Renewable Energy | 0.335 | 6.563 | 0.121 | 7.020 | kJ | |
| Total water consumption | 88.943 | 21.354 | 507.316 | 617.613 | cm3 | |
| Outputs | CO2 Total | 0.073 | 0.011 | 0.046 | 0.130 | kg |
| CO2 | 0.073 | 0.011 | 0.047 | 0.131 | kg | |
| CO2 Biogenic | 0.000 | 0.000 | 0.000 | 0.000 | kg | |
| VOC | 0.010 | 0.012 | 0.026 | 0.048 | g | |
| CO | 0.015 | 0.083 | 0.150 | 0.248 | g | |
| NOx | 0.019 | 0.011 | 0.048 | 0.078 | g | |
| PM10 | 0.003 | 0.006 | 0.023 | 0.032 | g | |
| PM2.5 | 0.003 | 0.003 | 0.011 | 0.016 | g | |
| SOx | 0.012 | 0.039 | 0.337 | 0.388 | g | |
| CH4 | 0.178 | 0.020 | 0.119 | 0.317 | g | |
| N2O | 0.001 | 0.000 | 0.001 | 0.002 | g | |
| CF4 | 0.000 | 0.000 | 0.000 | 0.000 | g | |
| SF6 | 0.000 | 0.000 | 0.000 | 0.000 | g | |
| C2F6 | 0.000 | 0.000 | 0.000 | 0.000 | g | |
| CO2e | 78.934 | 11.389 | 50.135 | 140.459 | g | |
| Life Cycle Stage (per 1 MJ Hydrogen Consumed) | ||||||
|---|---|---|---|---|---|---|
| Environmental Flow/Impact | H2 Production | Pipeline Production and construction | End user Pick-up truck | Total life cycle per MJ consume on FCV | Units | |
| Inputs | Total Non-Renewable Energy | 0.000 | 134.528 | 20.796 | 155.324 | kJ |
| Total Renewable Energy | 1351.000 | 6.563 | 0.121 | 1357.685 | kJ | |
| Total water consumption | 91.491 | 21.354 | 507.316 | 620.161 | cm3 | |
| Outputs | CO2 Total | 0.000 | 0.011 | 0.046 | 0.057 | kg |
| CO2 | 0.000 | 0.011 | 0.047 | 0.057 | kg | |
| CO2 Biogenic | 0.000 | 0.000 | 0.000 | 0.000 | kg | |
| VOC | 0.000 | 0.012 | 0.026 | 0.038 | g | |
| CO | 0.000 | 0.083 | 0.150 | 0.233 | g | |
| NOx | 0.000 | 0.011 | 0.048 | 0.059 | g | |
| PM10 | 0.000 | 0.006 | 0.023 | 0.029 | g | |
| PM2.5 | 0.000 | 0.003 | 0.011 | 0.014 | g | |
| SOx | 0.000 | 0.039 | 0.337 | 0.376 | g | |
| CH4 | 0.000 | 0.020 | 0.119 | 0.140 | g | |
| N2O | 0.000 | 0.000 | 0.001 | 0.001 | g | |
| CF4 | 0.000 | 0.000 | 0.000 | 0.000 | g | |
| SF6 | 0.000 | 0.000 | 0.000 | 0.000 | g | |
| C2F6 | 0.000 | 0.000 | 0.000 | 0.000 | g | |
| CO2e | 0.000 | 11.389 | 50.135 | 61.524 | g | |
| Life Cycle Stage (per 1 MJ Hydrogen Consumed) | ||||||
|---|---|---|---|---|---|---|
| Environmental Flow/Impact | H2 Production | Pipeline Production and construction | End user Pick-up truck | Total life cycle per MJ consume on FCV | Units | |
| Inputs | Total Non-Renewable Energy | 149.837 | 134.528 | 20.796 | 305.160 | kJ |
| Total Renewable Energy | 2231.000 | 6.563 | 0.121 | 2237.685 | kJ | |
| Total water consumption | 134.304 | 21.354 | 507.316 | 662.974 | cm3 | |
| Outputs | CO2 Total | 0.010 | 0.011 | 0.046 | 0.067 | kg |
| CO2 | 0.011 | 0.011 | 0.047 | 0.068 | kg | |
| CO2 Biogenic | 0.000 | 0.000 | 0.000 | 0.000 | kg | |
| VOC | 0.004 | 0.012 | 0.026 | 0.042 | g | |
| CO | 0.018 | 0.083 | 0.150 | 0.251 | g | |
| NOx | 0.030 | 0.011 | 0.048 | 0.088 | g | |
| PM10 | 0.002 | 0.006 | 0.023 | 0.031 | g | |
| PM2.5 | 0.002 | 0.003 | 0.011 | 0.016 | g | |
| SOx | 0.020 | 0.039 | 0.337 | 0.396 | g | |
| CH4 | 0.019 | 0.020 | 0.119 | 0.159 | g | |
| N2O | 0.006 | 0.000 | 0.001 | 0.008 | g | |
| CF4 | 0.000 | 0.000 | 0.000 | 0.000 | g | |
| SF6 | 0.000 | 0.000 | 0.000 | 0.000 | g | |
| C2F6 | 0.000 | 0.000 | 0.000 | 0.000 | g | |
| CO2e | 12.740 | 11.389 | 50.135 | 74.265 | g | |
References
- Bringing Zero Carbon Gas to Aotearoa—First Gas. Available online: https://firstgas.co.nz/about-us/bringing-zero-carbon-gas-to-aotearoa/ (accessed on 6 July 2022).
- Study Shows Abundant Opportunities for Hydrogen in a Future Integrated Energy System. Available online: https://www.nrel.gov/news/program/2020/study-shows-abundant-opportunities-for-hydrogen-in-a-future-integrated-energy-system.html (accessed on 6 July 2022).
- Hydrogen Production. Available online: https://www.energy.gov/eere/fuelcells/hydrogen-production (accessed on 6 July 2022).
- Rosa, L.; Mazzotti, M. Potential for Hydrogen Production from Sustainable Biomass with Carbon Capture and Storage. Renew. Sustain. Energy Rev. 2022, 157, 112123. [Google Scholar] [CrossRef]
- Clarke, S.H.; Dicks, A.L.; Pointon, K.; Smith, T.A.; Swann, A. Catalytic Aspects of the Steam Reforming of Hydrocarbons in Internal Reforming Fuel Cells. Catal. Today 1997, 38, 411–423. [Google Scholar] [CrossRef]
- Nikolaidis, P.; Poullikkas, A. A Comparative Overview of Hydrogen Production Processes. Renew. Sustain. Energy Rev. 2017, 67, 597–611. [Google Scholar] [CrossRef]
- Borgnakke, C.; Sonntag, R.E. Fundamentals of Thermodynamics; John Wiley & Sons: Hoboken, NJ, USA, 2022; ISBN 978-1-119-82077-2. [Google Scholar]
- Spath, P.L.; Mann, M.K. Life Cycle Assessment of Hydrogen Production via Natural Gas Steam Reforming; No. NREL/TP-570-27637; National Renewable Energy Laboratory (NREL): Golden, CO, USA, 2000.
- US EPA. Energy and the Environment. Available online: https://www.epa.gov/energy (accessed on 11 July 2022).
- Pelda, J.; Stelter, F.; Holler, S. Potential of Integrating Industrial Waste Heat and Solar Thermal Energy into District Heating Networks in Germany. Energy 2020, 203, 117812. [Google Scholar] [CrossRef]
- Ursua, A.; Gandia, L.M.; Sanchis, P. Hydrogen Production From Water Electrolysis: Current Status and Future Trends. Proc. IEEE 2012, 100, 410–426. [Google Scholar] [CrossRef]
- Ahmed, F.E.; Hashaikeh, R.; Hilal, N. Solar Powered Desalination—Technology, Energy and Future Outlook. Desalination 2019, 453, 54–76. [Google Scholar] [CrossRef]
- Aqachmar, Z.; Allouhi, A.; Jamil, A.; Gagouch, B.; Kousksou, T. Parabolic Trough Solar Thermal Power Plant Noor I in Morocco. Energy 2019, 178, 572–584. [Google Scholar] [CrossRef]
- Sadeghi, S.; Ghandehariun, S.; Rosen, M.A. Comparative Economic and Life Cycle Assessment of Solar-Based Hydrogen Production for Oil and Gas Industries. Energy 2020, 208, 118347. [Google Scholar] [CrossRef]
- Zhang, J.; Ling, B.; He, Y.; Zhu, Y.; Wang, Z. Life Cycle Assessment of Three Types of Hydrogen Production Methods Using Solar Energy. Int. J. Hydrogen Energy 2022, 47, 14158–14168. [Google Scholar] [CrossRef]
- Koroneos, C.; Dompros, A.; Roumbas, G.; Moussiopoulos, N. Life Cycle Assessment of Hydrogen Fuel Production Processes. Int. J. Hydrogen Energy 2004, 29, 1443–1450. [Google Scholar] [CrossRef]
- Susmozas, A.; Iribarren, D.; Dufour, J. Life-Cycle Performance of Indirect Biomass Gasification as a Green Alternative to Steam Methane Reforming for Hydrogen Production. Int. J. Hydrogen Energy 2013, 38, 9961–9972. [Google Scholar] [CrossRef]
- Balat, H.; Kırtay, E. Hydrogen from Biomass—Present Scenario and Future Prospects. Int. J. Hydrogen Energy 2010, 35, 7416–7426. [Google Scholar] [CrossRef]
- Corn Stover: What Is Its Worth? Available online: https://www.canr.msu.edu/news/corn_stover_what_is_its_worth (accessed on 6 July 2022).
- Di Marcoberardino, G.; Foresti, S.; Binotti, M.; Manzolini, G. Potentiality of a Biogas Membrane Reformer for Decentralized Hydrogen Production. Chem. Eng. Process.-Process Intensif. 2018, 129, 131–141. [Google Scholar] [CrossRef]
- Lahnaoui, A.; Wulf, C.; Heinrichs, H.; Dalmazzone, D. Optimizing Hydrogen Transportation System for Mobility via Compressed Hydrogen Trucks. Int. J. Hydrogen Energy 2019, 44, 19302–19312. [Google Scholar] [CrossRef]
- Hydrogen Tube Trailers. Available online: https://www.energy.gov/eere/fuelcells/hydrogen-tube-trailers (accessed on 6 July 2022).
- Compilation of Existing State Truck Size and Weight Limit Laws—FHWA Freight Management and Operations. Available online: https://ops.fhwa.dot.gov/freight/policy/rpt_congress/truck_sw_laws/index.htm (accessed on 6 July 2022).
- Liu, X.; Reddi, K.; Elgowainy, A.; Lohse-Busch, H.; Wang, M.; Rustagi, N. Comparison of Well-to-Wheels Energy Use and Emissions of a Hydrogen Fuel Cell Electric Vehicle Relative to a Conventional Gasoline-Powered Internal Combustion Engine Vehicle. Int. J. Hydrogen Energy 2020, 45, 972–983. [Google Scholar] [CrossRef]
- Rahbari, A.; Garcia-Navarro, J.C.; Ramdin, M.; van den Broeke, L.J.P.; Moultos, O.A.; Dubbeldam, D.; Vlugt, T.J.H. Effect of Water Content on Thermodynamic Properties of Compressed Hydrogen. J. Chem. Eng. Data 2021, 66, 2071–2087. [Google Scholar] [CrossRef]
- Elgowainy, A.; Reddi, K. Hydrogen Fueling Station Pre-Cooling Analysis; Argonne National Laboratory: Lemont, IL, USA, 2016. [Google Scholar]
- Hydrogen Storage. Available online: https://www.energy.gov/eere/fuelcells/hydrogen-storage (accessed on 6 July 2022).
- Li, X.J.; Allen, J.D.; Stager, J.A.; Ku, A.Y. Paths to Low-Cost Hydrogen Energy at a Scale for Transportation Applications in the USA and China via Liquid-Hydrogen Distribution Networks. Clean Energy 2020, 4, 26–47. [Google Scholar] [CrossRef]
- Ghorbani, B.; Mehrpooya, M.; Aasadnia, M.; Niasar, M.S. Hydrogen Liquefaction Process Using Solar Energy and Organic Rankine Cycle Power System. J. Clean. Prod. 2019, 235, 1465–1482. [Google Scholar] [CrossRef]
- Hydrogen Pipelines. Available online: https://www.energy.gov/eere/fuelcells/hydrogen-pipelines (accessed on 6 July 2022).
- Hydrogen Blending. Available online: https://www.fchea.org/in-transition/2021/3/8/hydrogen-blending (accessed on 6 July 2022).
- Parfomak, P.W. Pipeline Transportation of Hydrogen: Regulation, Research, and Policy; Congressional Research Service: Washington, DC, USA, 2021.
- Ahmadi, P.; Kjeang, E. Comparative Life Cycle Assessment of Hydrogen Fuel Cell Passenger Vehicles in Different Canadian Provinces. Int. J. Hydrogen Energy 2015, 40, 12905–12917. [Google Scholar] [CrossRef]
- Lee, D.-Y.; Elgowainy, A.; Kotz, A.; Vijayagopal, R.; Marcinkoski, J. Life-Cycle Implications of Hydrogen Fuel Cell Electric Vehicle Technology for Medium- and Heavy-Duty Trucks. J. Power Sources 2018, 393, 217–229. [Google Scholar] [CrossRef]
- Frank, E.D.; Elgowainy, A.; Reddi, K.; Bafana, A. Life-Cycle Analysis of Greenhouse Gas Emissions from Hydrogen Delivery: A Cost-Guided Analysis. Int. J. Hydrogen Energy 2021, 46, 22670–22683. [Google Scholar] [CrossRef]
- Sinha, P.; Brophy, B. Life Cycle Assessment of Renewable Hydrogen for Fuel Cell Passenger Vehicles in California. Sustain. Energy Technol. Assess. 2021, 45, 101188. [Google Scholar] [CrossRef]
- Lark, T.J.; Hendricks, N.P.; Smith, A.; Pates, N.; Spawn-Lee, S.A.; Bougie, M.; Booth, E.G.; Kucharik, C.J.; Gibbs, H.K. Environmental Outcomes of the US Renewable Fuel Standard. Proc. Natl. Acad. Sci. USA 2022, 119, e2101084119. [Google Scholar] [CrossRef] [PubMed]
- Somerday, B.P.; San Marchi, C.W. Effects of Hydrogen Gas on Steel Vessels and Pipelines; Sandia National Laboratory (SNL-CA): Livermore, CA, USA, 2006. [Google Scholar]
- Wang, M. Argonne GREET Publication: The Greenhouse Gases, Regulated Emissions, and Energy Use in Transportation (GREET) Model Version 1.5. Available online: https://greet.es.anl.gov/publication-h3k81jas (accessed on 7 September 2022).
- Commission, C.E. Hydrogen Refueling Stations in California. Available online: https://www.energy.ca.gov/data-reports/energy-almanac/zero-emission-vehicle-and-infrastructure-statistics/hydrogen-refueling (accessed on 10 September 2022).
- Low Carbon Fuel Standard|California Air Resources Board. Available online: https://ww2.arb.ca.gov/our-work/programs/low-carbon-fuel-standard (accessed on 6 July 2022).
- LCFS Data Dashboard|California Air Resources Board. Available online: https://ww2.arb.ca.gov/resources/documents/lcfs-data-dashboard (accessed on 28 July 2022).
- LCFS Pathway Certified Carbon Intensities|California Air Resources Board. Available online: https://ww2.arb.ca.gov/resources/documents/lcfs-pathway-certified-carbon-intensities (accessed on 28 July 2022).
- Simons, A.; Bauer, C. Life Cycle Assessment of Hydrogen Production. In Transition to Hydrogen: Pathways toward Clean Transportation; Wokaun, A., Wilhelm, E., Eds.; Cambridge University Press: Cambridge, UK, 2011; pp. 13–57. ISBN 978-1-139-01803-6. [Google Scholar]

Publisher’s Note: MDPI stays neutral with regard to jurisdictional claims in published maps and institutional affiliations. |
© 2022 by the authors. Licensee MDPI, Basel, Switzerland. This article is an open access article distributed under the terms and conditions of the Creative Commons Attribution (CC BY) license (https://creativecommons.org/licenses/by/4.0/).
Share and Cite
Tayarani, H.; Ramji, A. Life Cycle Assessment of Hydrogen Transportation Pathways via Pipelines and Truck Trailers: Implications as a Low Carbon Fuel. Sustainability 2022, 14, 12510. https://doi.org/10.3390/su141912510
Tayarani H, Ramji A. Life Cycle Assessment of Hydrogen Transportation Pathways via Pipelines and Truck Trailers: Implications as a Low Carbon Fuel. Sustainability. 2022; 14(19):12510. https://doi.org/10.3390/su141912510
Chicago/Turabian StyleTayarani, Hanif, and Aditya Ramji. 2022. "Life Cycle Assessment of Hydrogen Transportation Pathways via Pipelines and Truck Trailers: Implications as a Low Carbon Fuel" Sustainability 14, no. 19: 12510. https://doi.org/10.3390/su141912510
APA StyleTayarani, H., & Ramji, A. (2022). Life Cycle Assessment of Hydrogen Transportation Pathways via Pipelines and Truck Trailers: Implications as a Low Carbon Fuel. Sustainability, 14(19), 12510. https://doi.org/10.3390/su141912510